Embed Size (px)
Citation preview

Global Exposure Analysis on Floods/Drought and Poverty
Hessel Winsemius, Philip Ward, Ted Veldkamp, Brenden Jongman, Stephane
Hallegatte, Mook Bangalore
2
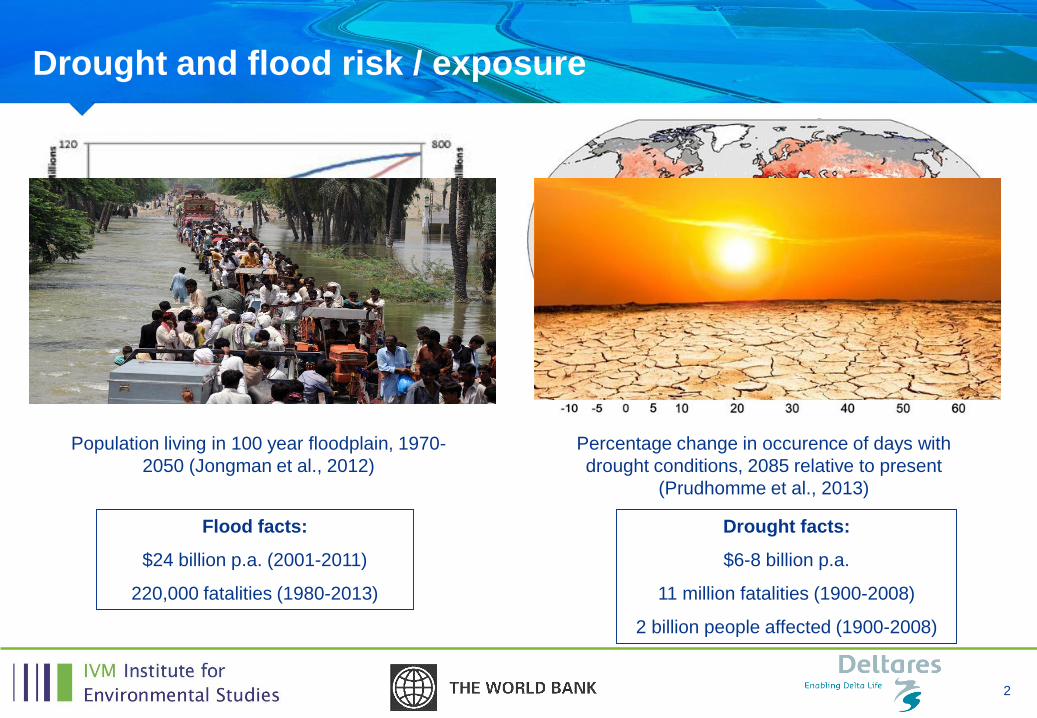
Drought and flood risk / exposure
Population living in 100 year floodplain, 1970-
2050 (Jongman et al., 2012)
Percentage change in occurence of days with
drought conditions, 2085 relative to present
(Prudhomme et al., 2013)
Flood facts:
$24 billion p.a. (2001-2011)
220,000 fatalities (1980-2013)
Drought facts:
$6-8 billion p.a.
11 million fatalities (1900-2008)
2 billion people affected (1900-2008)
3
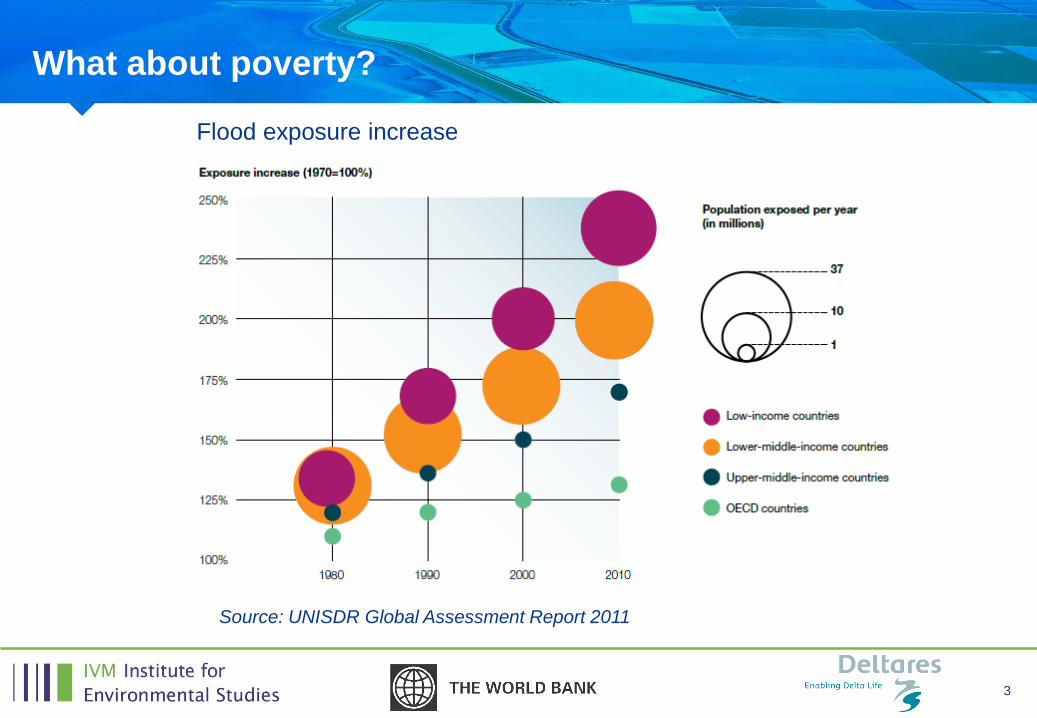
What about poverty?
Source: UNISDR Global Assessment Report 2011
Flood exposure increase

5
• Are poor more exposed to floods/droughts measuredat the country scale?
• Do poor become more exposed to floods/drought in the future due to climate change?
• What are the implications for policy making?
Investigated for 52 countries with household survey data (DHS wealth index) and at sub-national scalefor 2 countries and one city (Morocco, Malawi, Mumbai)
Research questions

6
Methods
7
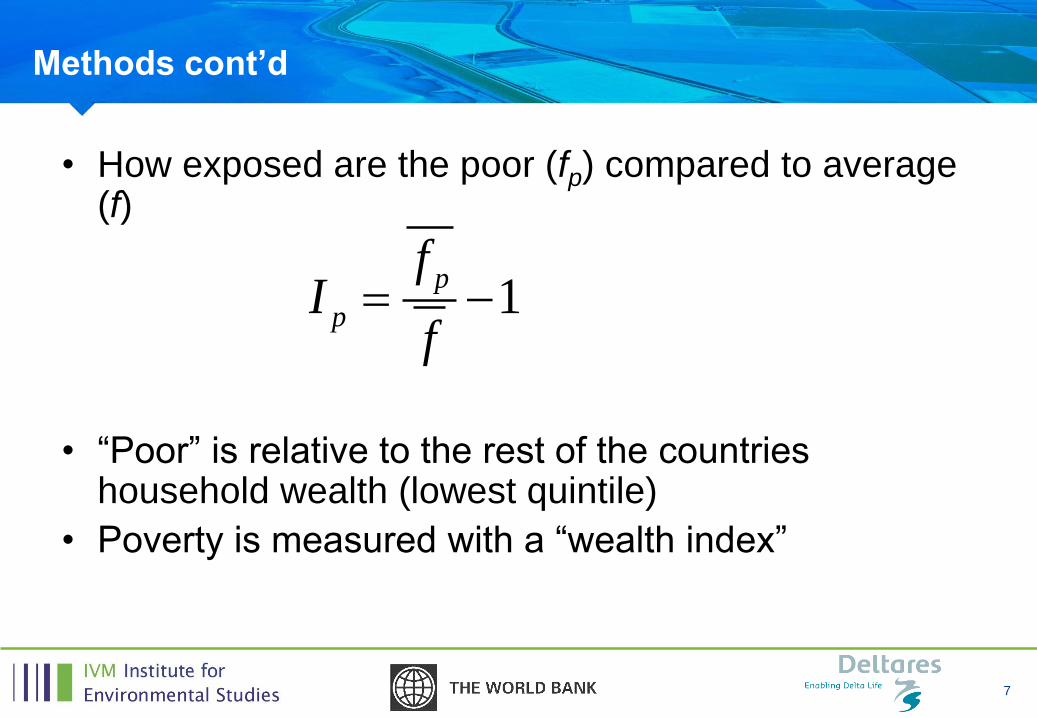
• How exposed are the poor (fp) compared to average (f)
• “Poor” is relative to the rest of the countries household wealth (lowest quintile)
• Poverty is measured with a “wealth index”
Methods cont’d
1p
p
fI
f

8
Methods cont’d
Future:
• How does the poverty exposure index change (floods/droughts)?
• How does the average amount of affected people per year change?
9
Results: poverty exposure index and floods
Floods
10
Results: poverty exposure index and flooding
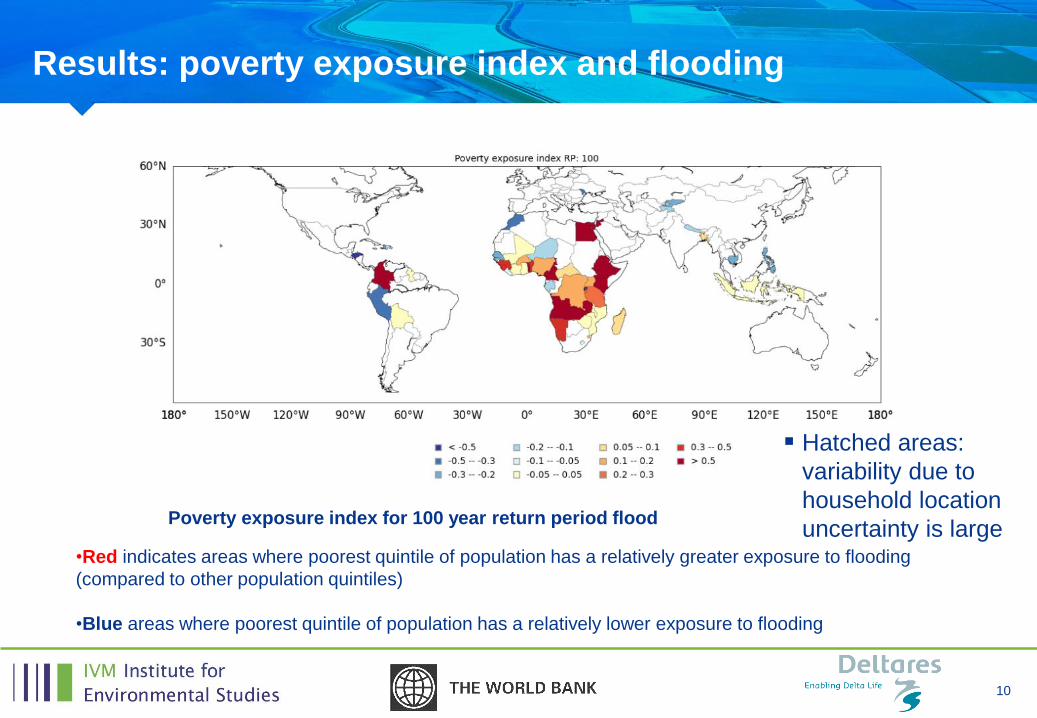
Poverty exposure index for 100 year return period flood
•Red indicates areas where poorest quintile of population has a relatively greater exposure to flooding
(compared to other population quintiles)
•Blue areas where poorest quintile of population has a relatively lower exposure to flooding
Hatched areas:
variability due to
household location
uncertainty is large

11
Results: poverty exposure index and flooding
Poverty exposure index for 100 year return period flood: urban households only
•Red indicates areas where poorest quintile of population has a relatively greater exposure to flooding
(compared to other population quintiles)
•Blue areas where poorest quintile of population has a relatively lower exposure to flooding

12
Results: poverty exposure index and drought
Droughts

13
Results: poverty exposure index and drought
Poverty exposure index for 100 year return period drought
•Red indicates areas where poorest quintile of population has a relatively greater exposure to drought
(compared to other population quintiles)
•Green indicates areas where poorest quintile of population has a relatively lower exposure to drought
Hatched areas: one
of quintiles lower
than 1% affected
In many of these countries,
poor are subsistence farmers
14
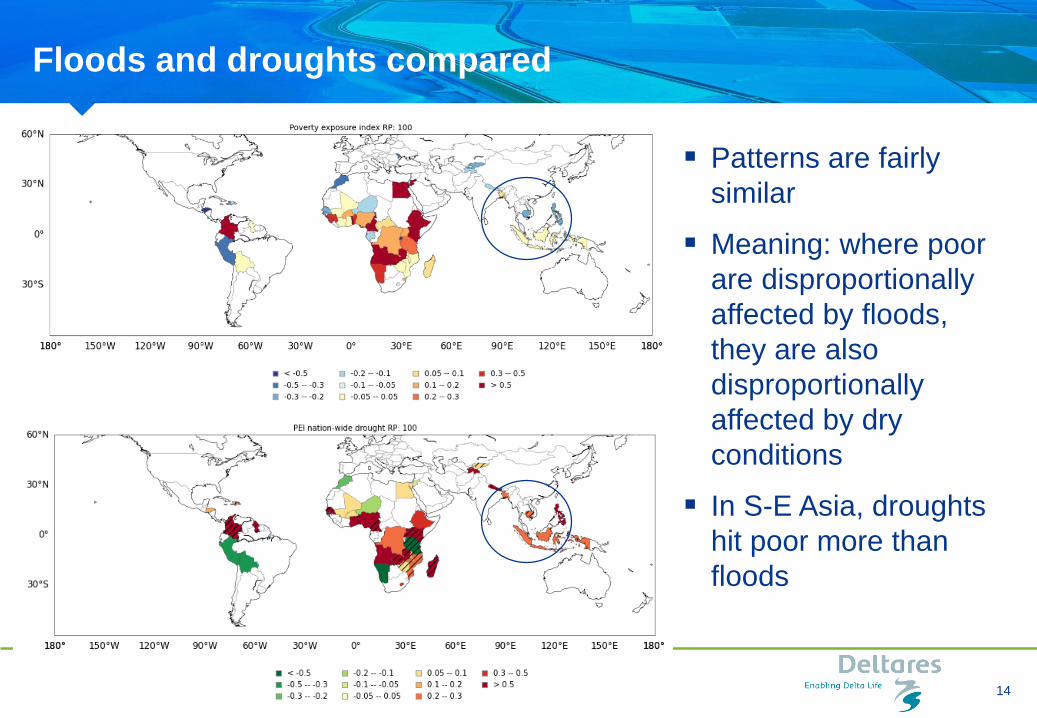
Floods and droughts compared
Patterns are fairly
similar
Meaning: where poor
are disproportionally
affected by floods,
they are also
disproportionally
affected by dry
conditions
In S-E Asia, droughts
hit poor more than
floods
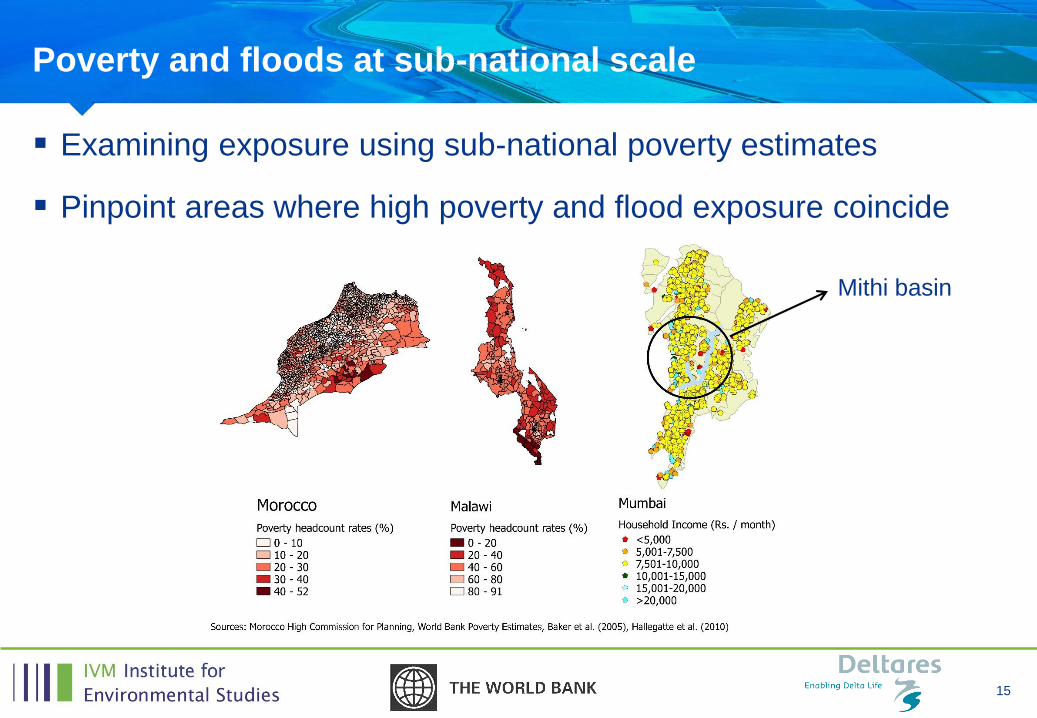
15
Poverty and floods at sub-national scale
Examining exposure using sub-national poverty estimates
Pinpoint areas where high poverty and flood exposure coincide
Mithi basin
16
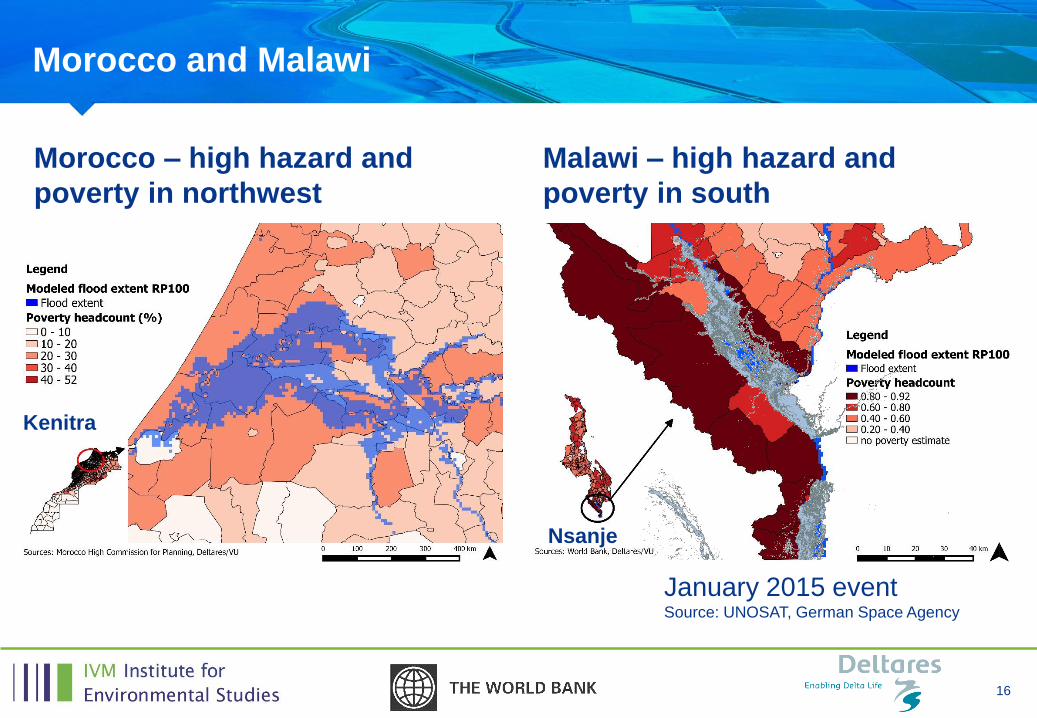
Morocco and Malawi
Morocco – high hazard and
poverty in northwest
Malawi – high hazard and
poverty in south
January 2015 event Source: UNOSAT, German Space Agency
Kenitra
Nsanje
17
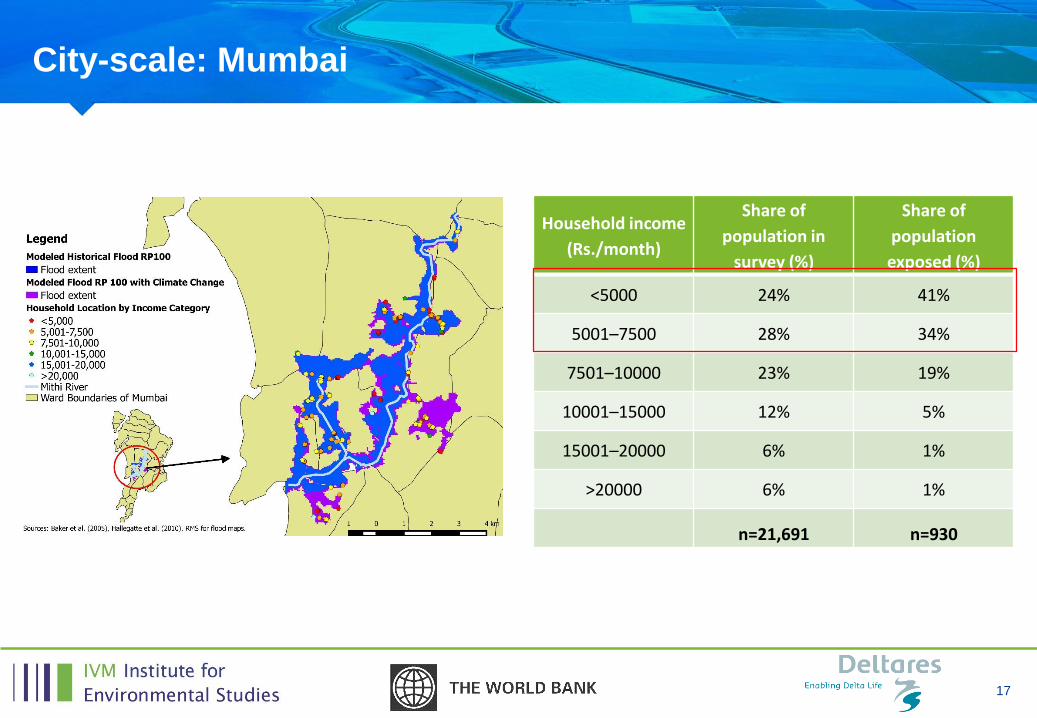
City-scale: Mumbai
Household income
(Rs./month)
Share of
population in
survey (%)
Share of
population
exposed (%)
<5000 24% 41%
5001–7500 28% 34%
7501–10000 23% 19%
10001–15000 12% 5%
15001–20000 6% 1%
>20000 6% 1%
n=21,691 n=930

18
Climate change
Where are poor disproportionately
affected by climate change?
Yamuna floodplain India.
Source:
http://www.thehindu.com/news/cities/Delhi/ddas-
proposal-to-redraw-yamuna-floodplain-
criticised/article5031574.ece

19
Results: future changes [%] in population exposed to flooding
Hatched areas:
standard dev. of 5
GCM results > 50% of
their mean

20
Where will climate change hit the poor more severe than average?
Where are poor experiencing disproportionately more flooding in the future?
a)Bias in poor exposed (> 10%)
b)Increase in exposure in 2050 > 10%
•Grey are countries that are part of this analysis
•Hashed are countries where poor are more vulnerable
Egypt
Ethiopia
Kenya
Uganda
Guinea
Sierra
Leone
Burkina
Faso
Nigeria
Burundi

21
Results: future changes [%] in population exposed to drought
…Results here are preliminary and are being reviewed for accuracy…

22
• Poor people are disproportionately affected by climatechange induced increases in flood risk in Africa, countriesabove the equator
• In particular urban areas
• Same for droughts (but more Southern Africa, adding S-E Asia)
• More exposure bias at sub-national scale, areas which maybe of policy priority
Conclusions

23
• Finalize the analysis for dry conditions
• Examine more countries sub-nationally with povertymaps
• Investigate the significance of the results further
Further research
24
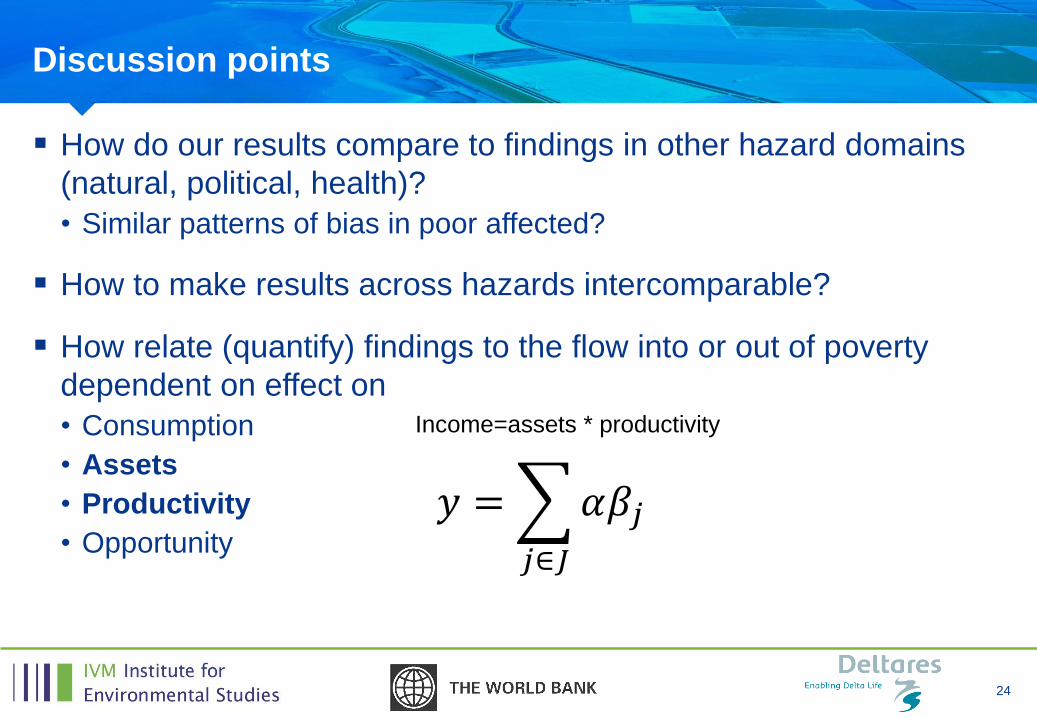
Discussion points
How do our results compare to findings in other hazard domains
(natural, political, health)?
• Similar patterns of bias in poor affected?
How to make results across hazards intercomparable?
How relate (quantify) findings to the flow into or out of poverty
dependent on effect on
• Consumption
• Assets
• Productivity
• Opportunity
𝑦 =
𝑗∈𝐽
𝛼𝛽𝑗
Income=assets * productivity
25
Thank you!
Background materials •Winsemius et al., 2013. A framework for global river flood assessment. Hydrology and Earth System Sciences, doi:10.5194/hess-17-1871-2013
•Ward et al., 2013. Assessing flood risk at the global scale: model setup, results, and sensitivity. Environmental Research Letters
doi:10.1088/1748-9326/8/4/044019.
Jongman et al., 2012. Global exposure to river and coastal flooding: Long term trends and changes. Global Environmental Change,
doi:10.1016/j.gloenvcha.2012.07.004.
•Veldkamp et al., in review. Changing mechanism of global water scarcity events: impacts of socioeconomic changes and inter-annual hydro-
climatic variability.