Embed Size (px)
Citation preview

GLOBAL ETF SNAPSHOT November 2013
HONG KONG State Street Global Advisors Asia Limited
68th Floor, Two International Finance Centre,
8 Finance Street, Central,
Hong Kong
spdrs.com.hk* SINGAPORE State Street Global Advisors Singapore, Limited 200002719D
168 Robinson Road
#33-01 Capital Tower
Singapore 068912
spdrs.com.sg*
SALES & CLIENT SERVICE Hong Kong +852 2103 0100
Singapore +65 6826 7500
MEDIA Pieter Bakker Phone: +852 2230 1661 [email protected]
The research and analysis included in this document has been produced by SSgA for its own investment management activities and is made available here incidentally. Information obtained from external sources is believed to be reliable and is as of the date of publication but is subject to change. This information must not be used in any jurisdiction where prohibited by law and must not be used in a way that would be contrary to local law or legislation. No investment advice, tax advice, or legal advice is provided herein. Unless otherwise noted, all data and statistical information were obtained from Markit and SSgA as of 10/31/13. Data in tables have been rounded to whole numbers, except for percentages, which have been rounded to the nearest tenth of a percent. *The websites are not reviewed by the Securities and Future Commission of Hong Kong (“SFC”) and may contain information relating to other funds not authorized by SFC.

1
Snapshot Overview: Includes Data for Every Region Available
GLOBAL ETF ASSET GROWTH
2011 2012 2013 YTD
ASSETS $1.5TN $1.9TN $2.3TN
# OF ETFs 4,648 5,023 5,289
STATE STREET GLOBAL ADVISORS HIGHLIGHTS, NOVEMBER 2013
Why Commodities, Just like Real Estate, Deserve a Place in a Diversified Portfolio o Rising interest rates do have an adverse impact on the cost of capital, but the benefits from an improving economy can
outweigh the costs. While such an environment may not be a boon for real asset linked investments, we do believe that REITs and Commodities will continue to have a place in a diversified investment strategy.
o To read more, click here.
For more information, including product fact sheets and related whitepapers, visit spdrs.com.
ETFs trade like stocks, are subject to investment risk and will fluctuate in market value. The investment return and principal value of an investment will fluctuate in value, so that when shares are sold or redeemed, they may be worth more or less than when they were purchased. Although shares may be bought or sold on an exchange through any brokerage account, shares are not individually redeemable from the fund. Investors may acquire shares and tender them for redemption through the fund in large aggregations known as “creation units.” Please see the fund prospectus for more details.
Because of their narrow focus, sector funds tend to be more volatile than funds that diversify across many sectors and companies.
Non-diversified funds that focus on a relatively small number of stocks or countries tend to be more volatile than diversified funds and the market as a whole.
Past performance does not guarantee future results.
Before investing, consider the funds’ investment objectives, risks, charges and expenses. To obtain a prospectus which contains this and other information, call 866.787.2257 or visit spdrs.com. Read it carefully.

Source: S&P, MSCI, Barclays, FactSet, as of 11/30/2013. Index returns are unmanaged and do not reflect the deduction of any fees or expenses. Index returns reflect all items of income, gain and loss and the reinvestment of dividends and other income. Past performance does not guarantee future results.
2
ETF Industry Detail
GLOBAL ETF LISTING REGION
The United States had nearly $12.5BN of inflows in the month November, increasing its year to date inflows to $163.8BN. Europe experienced inflows of $3.3BN in November, increasing its year to date inflows to $16.8BN, while APAC had outflows of $0.2BN, decreasing its year-to-date inflows to $12.5BN.
GLOBAL REGIONS # OF ETFs
AUM (USD MM)
ASSET FLOWS (USD MTD MM)
ASSET FLOWS (USD YTD MM)
AMERICAS - CANADA 388 $57,769 -$78 $3,365
AMERICAS - LATIN AMERICA 36 $14,062 -$132 $377
AMERICAS - UNITED STATES 1,530 $1,669,020 $12,488 $163,846
APAC 621 $171,935 -$244 $12,489
EUROPE 2,383 $409,824 $3,299 $16,830
MIDDLE EAST & AFRICA 51 $6,894 -$1,075 -$478
MIDDLE EAST & AFRICA - ISRAEL 280 - - - TOTAL 5,289 $2,329,506 $14,257 $196,429
GLOBAL PERFORMANCE BY ASSET CLASS
MSCI AC World IMI increased 1.4%, while MSCI EAFE gained 0.8%. Emerging markets lost 1.5%, while Emerging Markets Small Cap dropped 1.9%. US Large Cap, Mid Cap and Small Cap markets were all positive, increasing 3.0%, 1.3% and 4.5%, respectively. The Global Aggregate fell 0.8% and the Global Treasury Ex US decreased 1.5%. The US Aggregate, the US Treasury and the US Corporate Bond markets were all slightly negative, while the US High Yield market was slightly positive in November. The US REIT market was down 5.5%. Commodities were negative, with the Dow Jones-UBS Commodity Index losing 0.8% and Gold dropping 5.4%.
INDEX/ASSET CLASS 1 MONTH
(%) 1 QUARTER
(%) YTD (%)
1 YEAR (%)
BARCLAYS US HIGH YIELD - CORPORATE INDEX 0.5 4.0 6.9 8.6
BARCLAYS US GOVT INFLATION-LINKED INDEX -1.2 0.8 -7.9 -8.5
BARCLAYS US AGGREGATE CREDIT - CORPORATE - INVESTMENT GRADE INDEX -0.2 2.0 -1.4 -1.4
BARCLAYS US AGGREGATE INDEX -0.4 1.4 -1.5 -1.6
BARCLAYS US AGGREGATE GOVERNMENT – TREASURY INDEX -0.3 0.9 -1.9 -2.3
DB GLOBAL GOVERNMENT EX US INFLATION-LINKED BOND CAPPED INDEX -1.1 4.1 -3.8 -1.8
BARCLAYS GLOBAL AGGREGATE INDEX -0.8 2.2 -2.0 -2.3
BARCLAYS GLOBAL TREASURY EX US INDEX -1.5 2.1 -4.0 -5.0
DOW JONES US SELECT REIT INDEX -5.5 1.5 0.7 4.4
S&P 500 INDEX 3.0 11.2 29.1 30.3
S&P MIDCAP INDEX 1.3 10.6 29.5 32.3
S&P SMALLCAP INDEX 4.5 15.0 39.3 43.9
MSCI AC WORLD IMI INDEX 1.4 11.1 21.4 24.3
MSCI EAFE INDEX 0.8 11.9 21.0 24.8
MSCI EM (EMERGING MARKETS) INDEX -1.5 10.0 -1.2 3.7
S&P DEVELOPED EX UNITED STATES <2B INDEX -0.3 10.4 18.7 23.5
S&P EMERGING MARKETS <2B INDEX -1.9 8.3 3.0 8.8
GOLD (LONDON PM FIX) INDEX -5.4 -10.2 -24.4 -27.4
DOW JONES-UBS COMMODITY INDEX -0.8 -4.8 -10.6 -13.0
3
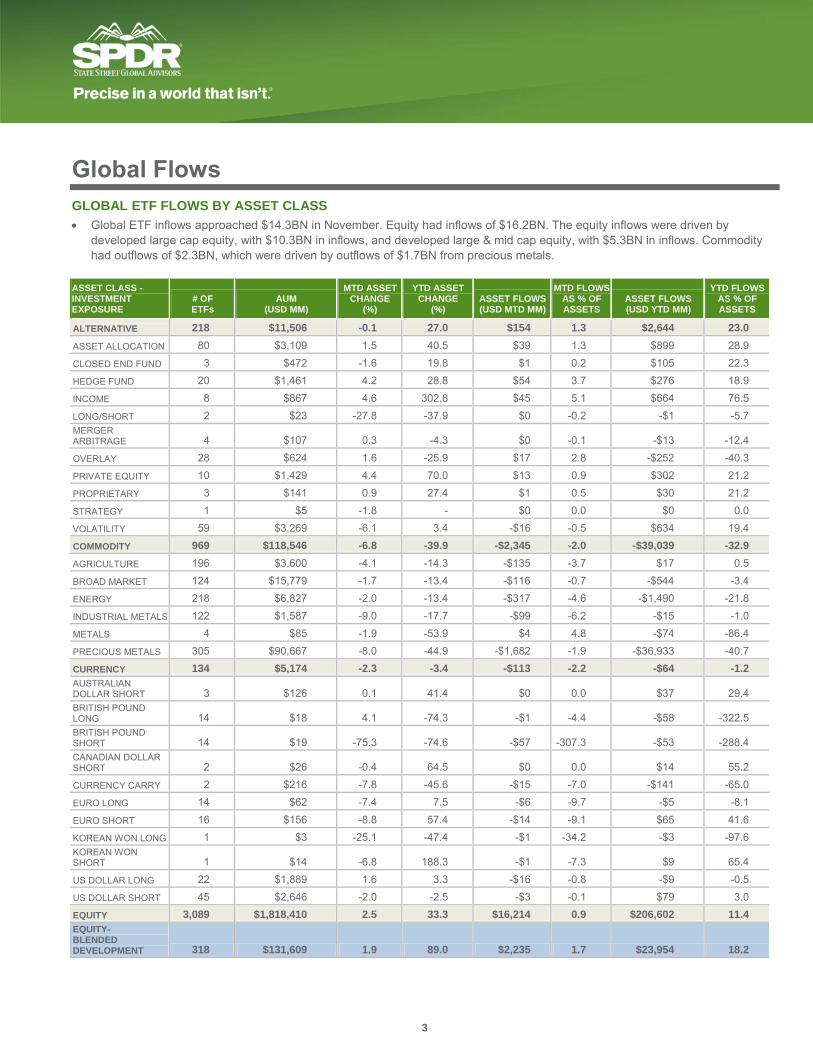
Global Flows
GLOBAL ETF FLOWS BY ASSET CLASS
Global ETF inflows approached $14.3BN in November. Equity had inflows of $16.2BN. The equity inflows were driven by developed large cap equity, with $10.3BN in inflows, and developed large & mid cap equity, with $5.3BN in inflows. Commodity had outflows of $2.3BN, which were driven by outflows of $1.7BN from precious metals.
ASSET CLASS - INVESTMENT EXPOSURE
# OF ETFs
AUM (USD MM)
MTD ASSET CHANGE
(%)
YTD ASSET CHANGE
(%) ASSET FLOWS (USD MTD MM)
MTD FLOWS AS % OF ASSETS
ASSET FLOWS (USD YTD MM)
YTD FLOWS AS % OF ASSETS
ALTERNATIVE 218 $11,506 -0.1 27.0 $154 1.3 $2,644 23.0
ASSET ALLOCATION 80 $3,109 1.5 40.5 $39 1.3 $899 28.9
CLOSED END FUND 3 $472 -1.6 19.8 $1 0.2 $105 22.3
HEDGE FUND 20 $1,461 4.2 28.8 $54 3.7 $276 18.9
INCOME 8 $867 4.6 302.8 $45 5.1 $664 76.5
LONG/SHORT 2 $23 -27.8 -37.9 $0 -0.2 -$1 -5.7 MERGER ARBITRAGE 4 $107 0.3 -4.3 $0 -0.1 -$13 -12.4
OVERLAY 28 $624 1.6 -25.9 $17 2.8 -$252 -40.3
PRIVATE EQUITY 10 $1,429 4.4 70.0 $13 0.9 $302 21.2
PROPRIETARY 3 $141 0.9 27.4 $1 0.5 $30 21.2
STRATEGY 1 $5 -1.8 - $0 0.0 $0 0.0
VOLATILITY 59 $3,269 -6.1 3.4 -$16 -0.5 $634 19.4
COMMODITY 969 $118,546 -6.8 -39.9 -$2,345 -2.0 -$39,039 -32.9
AGRICULTURE 196 $3,600 -4.1 -14.3 -$135 -3.7 $17 0.5
BROAD MARKET 124 $15,779 -1.7 -13.4 -$116 -0.7 -$544 -3.4
ENERGY 218 $6,827 -2.0 -13.4 -$317 -4.6 -$1,490 -21.8
INDUSTRIAL METALS 122 $1,587 -9.0 -17.7 -$99 -6.2 -$15 -1.0
METALS 4 $85 -1.9 -53.9 $4 4.8 -$74 -86.4
PRECIOUS METALS 305 $90,667 -8.0 -44.9 -$1,682 -1.9 -$36,933 -40.7
CURRENCY 134 $5,174 -2.3 -3.4 -$113 -2.2 -$64 -1.2
AUSTRALIAN DOLLAR SHORT 3 $126 0.1 41.4 $0 0.0 $37 29.4 BRITISH POUND LONG 14 $18 4.1 -74.3 -$1 -4.4 -$58 -322.5 BRITISH POUND SHORT 14 $19 -75.3 -74.6 -$57 -307.3 -$53 -288.4 CANADIAN DOLLAR SHORT 2 $26 -0.4 64.5 $0 0.0 $14 55.2
CURRENCY CARRY 2 $216 -7.8 -45.6 -$15 -7.0 -$141 -65.0
EURO LONG 14 $62 -7.4 7.5 -$6 -9.7 -$5 -8.1
EURO SHORT 16 $156 -8.8 57.4 -$14 -9.1 $65 41.6
KOREAN WON LONG 1 $3 -25.1 -47.4 -$1 -34.2 -$3 -97.6 KOREAN WON SHORT 1 $14 -6.8 188.3 -$1 -7.3 $9 65.4
US DOLLAR LONG 22 $1,889 1.6 3.3 -$16 -0.8 -$9 -0.5
US DOLLAR SHORT 45 $2,646 -2.0 -2.5 -$3 -0.1 $79 3.0
EQUITY 3,089 $1,818,410 2.5 33.3 $16,214 0.9 $206,602 11.4
EQUITY- BLENDED DEVELOPMENT 318 $131,609 1.9 89.0 $2,235 1.7 $23,954 18.2

4
GLOBAL ETF FLOWS BY ASSET CLASS (Continued)
ASSET CLASS - INVESTMENT EXPOSURE
# OF ETFs
AUM (USD MM)
MTD ASSET CHANGE
(%)
YTD ASSET CHANGE
(%) ASSET FLOWS (USD MTD MM)
MTD FLOWS AS % OF ASSETS
ASSET FLOWS (USD YTD MM)
YTD FLOWS AS % OF ASSETS
SECTOR CONSUMER GOODS 14 $1,189 1.9 69.4 $10 0.8 $313 26.4 CONSUMER SERVICES 1 $73 4.4 -7.2 $2 3.4 -$6 -8.4
ENERGY 17 $1,738 3.2 39.6 $36 2.1 $189 10.9
FINANCIALS 25 $7,511 -1.6 41.0 $63 0.8 $2,126 28.3
HEALTH CARE 7 $1,136 7.5 78.8 $39 3.4 $251 22.1
INDUSTRIALS 10 $511 3.6 98.1 $8 1.6 $170 33.3
MATERIALS 55 $11,923 -7.8 -29.0 $446 3.7 $3,512 29.5
TECHNOLOGY 14 $1,416 8.5 36.2 $86 6.1 $172 12.2
UTILITIES 5 $282 -1.3 -5.3 $0 0.0 -$35 -12.4
SIZE AND STYLE
BROAD MARKET 28 $17,918 8.3 143.0 $1,199 6.7 $5,768 32.2
LARGE & MID CAP 16 $18,529 2.2 19.1 $377 2.0 $2,718 14.7
LARGE CAP 19 $46,188 3.0 1259.3 -$173 -0.4 $3,808 8.2
MID & SMALL CAP 1 $1,668 -3.2 50.5 -$50 -3.0 $378 22.7
MID CAP 1 $4 0.6 5.0 $0 0.0 $0 0.0
SMALL CAP 5 $873 3.3 60.1 $32 3.7 $212 24.3
STRATEGY
BETA 7 $2,142 0.5 127.7 $17 0.8 $1,015 47.4
DIVIDEND 35 $6,136 -0.1 52.0 $54 0.9 $1,804 29.4
EARNINGS 1 $0 - - $0 - $0 -
LONG/SHORT 2 $62 3.8 25.8 $1 1.9 $12 19.2
THEMATIC
AGRICULTURE 10 $5,271 2.2 -15.2 -$8 -0.2 -$1,035 -19.6
ENVIRONMENT 9 $420 3.2 15.4 $10 2.4 -$61 -14.6
INFRASTRUCTURE 12 $1,420 -1.1 41.2 $0 0.0 $302 21.3 MASTER LIMITED PARTNERSHIP 2 $268 0.7 - $10 3.7 $171 63.9 NATURAL RESOURCES 7 $3,716 0.1 110.9 $46 1.2 $2,007 54.0
NUCLEAR 3 $99 2.2 -15.0 $0 0.0 $16 16.6
RELIGION 2 $30 2.9 -15.2 $0 0.0 -$11 -38.0 SOCIALLY RESPONSIBLE 3 $122 1.4 118.1 $0 0.0 $55 45.0
WATER 7 $966 4.3 36.0 $28 2.9 $101 10.4 EQUITY- DEVELOPED MARKETS 2,082 $1,452,384 3.4 40.3 $19,097 1.3 $200,973 13.8
SECTOR
CONSUMER GOODS 59 $25,629 4.6 43.6 $508 2.0 $2,922 11.4 CONSUMER SERVICES 24 $2,986 20.6 105.7 $406 13.6 $845 28.3
ENERGY 54 $19,887 0.7 -21.5 $247 1.2 $699 3.5
FINANCIALS 186 $78,275 0.1 26.9 $627 0.8 $9,017 11.5
HEALTH CARE 49 $27,058 10.2 90.6 $939 3.5 $5,771 21.3
INDUSTRIALS 47 $14,779 13.3 115.6 $1,254 8.5 $5,138 34.8
MATERIALS 52 $8,767 3.1 23.4 $246 2.8 $1,384 15.8

5
GLOBAL ETF FLOWS BY ASSET CLASS (Continued)
ASSET CLASS - INVESTMENT EXPOSURE
# OF ETFs
AUM (USD MM)
MTD ASSET CHANGE
(%)
YTD ASSET CHANGE
(%) ASSET FLOWS (USD MTD MM)
MTD FLOWS AS % OF ASSETS
ASSET FLOWS (USD YTD MM)
YTD FLOWS AS % OF ASSETS
TECHNOLOGY 87 $29,791 2.1 62.6 -$247 -0.8 $6,464 21.7
UTILITIES 28 $8,335 -7.7 -5.7 -$537 -6.4 -$1,142 -13.7
SIZE AND STYLE
BROAD MARKET 233 $141,048 3.3 90.7 $1,531 1.1 $30,927 21.9
LARGE & MID CAP 220 $200,195 4.5 44.3 $5,283 2.6 $32,763 16.4
LARGE CAP 583 $607,970 4.2 23.6 $10,268 1.7 $50,687 8.3
MICRO CAP 2 $102 2.3 140.9 -$3 -3.2 $34 33.3
MID & SMALL CAP 85 $74,213 -0.7 65.7 -$2,737 -3.7 $12,124 16.3
MID CAP 69 $66,119 1.4 61.0 -$61 -0.1 $12,234 18.5
SMALL CAP 49 $26,188 5.9 66.3 $416 1.6 $5,087 19.4
STRATEGY
BETA 33 $8,590 4.9 83.5 $302 3.5 $2,633 30.7 CORPORATE ACTION 4 $3,249 17.6 967.9 $387 11.9 $2,525 77.7
DIVIDEND 121 $83,701 0.9 50.6 -$282 -0.3 $14,538 17.4
EARNINGS 2 $70 3.5 23.6 $0 0.0 -$2 -2.9
INSIDER SENTIMENT 2 $210 16.4 101.3 $23 11.1 $75 35.5
LONG/SHORT 6 $301 4.6 -49.9 $5 1.8 $147 48.7
PROPRIETARY 4 $64 5.3 -0.6 $2 3.4 -$18 -29.1
RESEARCH 17 $1,909 7.7 116.2 $99 5.2 $838 43.9
TECHNICAL 2 $1,675 8.6 103.7 $90 5.4 $557 33.2
TREND FOLLOWING 5 $83 24.0 382.3 $16 18.9 $60 72.3
THEMATIC
ELECTRONICS 3 $44 4.4 23.5 $0 0.0 $0 0.0
ENVIRONMENT 6 $334 -2.5 94.6 -$9 -2.6 $67 20.1
INFRASTRUCTURE 8 $460 2.1 -57.2 $11 2.3 $301 65.4 INTERNATIONAL GEOGRAPHIC EXPOSURE 1 $3 2.3 19.5 $0 0.0 $0 0.0 MASTER LIMITED PARTNERSHIP 17 $16,055 1.2 - $256 1.6 $3,923 24.4 NATURAL RESOURCES 5 $2,204 -0.2 19.8 $22 1.0 $145 6.6
RELIGION 3 $21 3.4 -32.6 $0 0.9 -$1 -4.5 SOCIALLY RESPONSIBLE 14 $903 5.4 50.0 $30 3.3 $171 18.9
WATER 2 $1,164 2.5 29.9 $7 0.6 $62 5.3 EQUITY- EMERGING MARKETS 685 $234,202 -2.6 -9.4 -$5,119 -2.2 -$18,335 -7.8
SECTOR
CONSUMER GOODS 21 $1,932 1.7 35.0 $47 2.4 $232 12.0 CONSUMER SERVICES 1 $12 -9.7 465.9 $1 4.9 $19 150.0
ENERGY 8 $88 -9.0 282.9 -$9 -10.1 -$52 -59.2
FINANCIALS 31 $1,003 29.8 115.6 -$942 -93.8 -$914 -91.1
HEALTH CARE 6 $269 22.9 967.0 -$6 -2.2 -$125 -46.4
INDUSTRIALS 8 $20 -33.1 -86.2 -$11 -53.5 -$143 -710.8
MATERIALS 10 $93 -1.2 -10.6 -$2 -2.3 -$50 -53.3

6
GLOBAL ETF FLOWS BY ASSET CLASS (Continued)
ASSET CLASS - INVESTMENT EXPOSURE
# OF ETFs
AUM (USD MM)
MTD ASSET CHANGE
(%)
YTD ASSET CHANGE
(%) ASSET FLOWS (USD MTD MM)
MTD FLOWS AS % OF ASSETS
ASSET FLOWS (USD YTD MM)
YTD FLOWS AS % OF ASSETS
TECHNOLOGY 8 $118 6.0 44.4 $4 3.4 $5 4.1
UTILITIES 3 $8 -3.2 -26.6 $0 0.0 $1 13.7
SIZE AND STYLE
BROAD MARKET 166 $33,564 -2.8 7.9 -$952 -2.8 $3,052 9.1
LARGE & MID CAP 199 $145,303 -4.2 -15.8 -$4,070 -2.8 -$21,605 -14.9
LARGE CAP 126 $30,846 4.5 -13.8 $942 3.1 -$2,685 -8.7
MICRO CAP 1 $18 2.9 51.6 $0 0.0 $2 11.8
MID & SMALL CAP 18 $1,845 1.8 8.1 $2 0.1 -$646 -35.0
MID CAP 7 $1,716 -6.0 -15.2 $22 1.3 $506 29.5
SMALL CAP 17 $2,804 0.0 85.1 -$51 -1.8 $102 3.6
STRATEGY
BETA 8 $3,183 -6.1 208.6 -$119 -3.7 $2,170 68.2
DIVIDEND 22 $8,781 -3.1 15.6 $11 0.1 $1,829 20.8
EARNINGS 3 $96 1.2 -33.7 $0 -0.1 -$48 -50.5
RESEARCH 1 $90 34.4 -2.8 $25 28.2 $3 3.0
TECHNICAL 1 $364 -1.4 51.9 $0 0.0 $143 39.4
TREND FOLLOWING 1 $2 -3.4 -6.5 $0 0.0 $0 0.0
THEMATIC
ENVIRONMENT 2 $1,335 -4.4 -18.9 $0 0.0 -$84 -6.3
INFRASTRUCTURE 8 $426 -3.0 -15.9 -$11 -2.5 -$40 -9.5 INTERNATIONAL GEOGRAPHIC EXPOSURE 1 $3 3.4 -18.8 $0 0.0 -$1 -29.9 NATURAL RESOURCES 2 $81 -3.0 -28.3 -$2 -2.0 -$9 -11.3
RELIGION 4 $124 -2.4 -6.7 $0 0.0 -$5 -3.8 SOCIALLY RESPONSIBLE 2 $77 0.2 10.9 $0 0.3 $8 11.0 EQUITY- FRONTIER MARKETS 2 $10 10.0 - $1 7.2 $10 97.7
SIZE AND STYLE
BROAD MARKET 2 $10 10.0 - $1 7.2 $10 97.7
FIXED INCOME 879 $375,869 -0.2 5.4 $347 0.1 $26,285 7.0
FIXED INCOME-BLENDED DEVELOPMENT 43 $14,106 0.0 22.4 $121 0.9 $2,917 20.7
BROAD MARKET
BROAD MARKET 7 $1,498 8.4 166.2 $131 8.8 $982 65.5
CORPORATE
CORPORATE 4 $590 5.4 52.1 $31 5.2 $206 34.9
HIGH YIELD 6 $2,145 3.1 406.1 $52 2.4 $1,533 71.5 INVESTMENT GRADE 7 $918 3.7 690.6 $9 1.0 $759 82.7
GOVERNMENT
GOVERNMENT 6 $3,470 -1.5 -9.4 $29 0.8 -$86 -2.5
SOVEREIGN 2 $524 -2.3 16.5 -$13 -2.5 $51 9.7
TREASURY 2 $2,305 0.9 3.3 $48 2.1 $171 7.4

7
GLOBAL ETF FLOWS BY ASSET CLASS (Continued)
ASSET CLASS - INVESTMENT EXPOSURE
# OF ETFs
AUM (USD MM)
MTD ASSET CHANGE
(%)
YTD ASSET CHANGE
(%) ASSET FLOWS (USD MTD MM)
MTD FLOWS AS % OF ASSETS
ASSET FLOWS (USD YTD MM)
YTD FLOWS AS % OF ASSETS
INFLATION
INFLATION 8 $2,622 -7.0 -22.8 -$166 -6.3 -$620 -23.7
PREFERRED STOCK
PREFERRED STOCK 1 $34 -3.0 -72.7 -$1 -3.7 -$79 -235.4 FIXED INCOME-DEVELOPED MARKETS 773 $341,795 0.0 5.0 $697 0.2 $23,013 6.7
ASSET BACKED
AGENCY MBS 4 $6,519 -2.0 -10.4 -$88 -1.4 -$588 -9.0
CMBS 1 $84 3.0 62.6 $3 3.0 $33 39.5
NON AGENCY MBS 2 $19 -48.8 46.2 -$18 -95.5 $5 25.4
BROAD MARKET
BROAD MARKET 47 $67,778 1.0 9.2 $978 1.4 $6,737 9.9
CORPORATE
CONVERTIBLE 5 $1,999 5.8 86.1 $96 4.8 $756 37.8
CORPORATE 72 $26,360 -1.7 3.5 -$391 -1.5 $959 3.6
COVERED BOND 10 $3,545 2.1 18.7 $57 1.6 $438 12.3
HIGH YIELD 43 $43,181 0.8 15.5 $357 0.8 $4,795 11.1 INVESTMENT GRADE 59 $53,955 -0.5 1.1 -$104 -0.2 $2,352 4.4
LEVERAGED LOAN 5 $7,113 3.4 362.7 $229 3.2 $5,524 77.7
CORPORATE - CREDIT
CROSSOVER 4 $358 -3.9 41.1 -$17 -4.7 $83 23.1
HIGH YIELD 5 $50 14.2 41.5 $6 11.7 $12 24.2 INVESTMENT GRADE 8 $184 -12.9 -26.6 -$28 -15.0 -$80 -43.6
SENIOR 4 $51 25.3 181.4 $11 20.9 $22 42.8
SUBORDINATED 2 $32 0.7 5.0 $0 0.0 $0 0.2
GOVERNMENT
AGENCY 3 $48 -1.8 56.1 $0 0.0 $20 41.3
GOVERNMENT 217 $26,713 -0.6 17.4 $185 0.7 $3,927 14.7
SOVEREIGN 71 $9,575 9.6 23.0 $458 4.8 $1,343 14.0
TREASURY 90 $33,637 0.2 -9.1 -$75 -0.2 $2,435 7.2
INFLATION
INFLATION 18 $3,107 -2.2 -14.3 -$62 -2.0 -$392 -12.6
TIPS 19 $20,286 -2.6 -25.6 -$347 -1.7 -$5,099 -25.1
MONEY MARKET
MONEY MARKET 31 $9,544 -3.4 49.5 -$330 -3.5 -$1,290 -13.5
MUNICIPAL
MUNICIPAL 33 $11,775 0.0 -9.3 $59 0.5 -$204 -1.7
PREFERRED STOCK
PREFERRED STOCK 18 $15,862 -1.9 1.0 -$283 -1.8 $1,235 7.8
YIELD CURVE
FLATTENING 1 $5 -2.3 -77.3 $0 0.0 -$15 -325.4
STEEPENING 1 $16 3.5 107.0 $0 0.2 $7 41.3

8
GLOBAL ETF FLOWS BY ASSET CLASS (Continued)
ASSET CLASS - INVESTMENT EXPOSURE
# OF ETFs
AUM (USD MM)
MTD ASSET CHANGE
(%)
YTD ASSET CHANGE
(%) ASSET FLOWS (USD MTD MM)
MTD FLOWS AS % OF ASSETS
ASSET FLOWS (USD YTD MM)
YTD FLOWS AS % OF ASSETS
FIXED INCOME-EMERGING MARKETS 63 $19,968 -4.6 1.2 -$471 -2.4 $355 1.8
BROAD MARKET
BROAD MARKET 8 $1,451 -5.9 -8.9 -$37 -2.6 $119 8.2
CORPORATE
CORPORATE 6 $647 -5.1 -15.6 -$22 -3.4 -$76 -11.8
HIGH YIELD 2 $431 -4.6 86.9 -$10 -2.3 $240 55.7 INVESTMENT GRADE 5 $606 -7.6 63.2 -$47 -7.7 -$294 -48.4
GOVERNMENT
GOVERNMENT 23 $3,832 -3.4 49.5 $8 0.2 $1,590 41.5
SOVEREIGN 10 $8,637 -4.5 -32.9 -$176 -2.0 -$2,851 -33.0
TREASURY 3 $1,211 -16.0 1.0 -$191 -15.8 -$747 -61.7
INFLATION
INFLATION 3 $92 -2.3 -29.0 $0 -0.5 -$8 -8.5
MONEY MARKET
MONEY MARKET 3 $3,062 0.2 119,406.
9 $4 0.1 $2,381 77.8 GRAND TOTAL 5,289 $2,329,506 1.5 20.6 $14,257 0.6 $196,429 8.4

9
ETF Manager & Fund Detail
MANAGER DETAIL
The top three families in the Global ETF marketplace were: BlackRock, State Street and Vanguard. Collectively, they account for approximately 71% of the Global ETF market.
ETF FAMILY # OF ETFs
AUM (USD MM)
MARKET SHARE (%)
ASSET FLOWS (USD MTD MM)
ASSET FLOWS (USD YTD MM)
STATE STREET 196 $403,033 17.3 $1,876 $11,307
BLACKROCK 741 $911,445 39.1 $5,781 $57,694
VANGUARD 100 $333,106 14.3 $3,495 $53,544
POWERSHARES 196 $97,906 4.2 $436 $12,424
DEUTSCHE BANK 371 $52,858 2.3 -$1,286 -$4,882
SOCIÉTÉ GÉNÉRALE 255 $42,069 1.8 $412 -$1,141
NOMURA ASSET MANAGEMENT 52 $36,395 1.6 $557 $5,015
WISDOMTREE 56 $34,486 1.5 $1,242 $13,989
PROSHARES 144 $26,419 1.1 $364 $4,849
VAN ECK SECURITIES CORPORATION 61 $22,566 1.0 -$153 $1,633
GUGGENHEIM INVESTMENTS 71 $20,939 0.9 $984 $6,429
ETF SECURITIES LIMITED 323 $18,953 0.8 -$331 -$4,250
FIRST TRUST 90 $18,326 0.8 $699 $7,097
UBS AG 394 $18,194 0.8 $313 $3,016
DAIWA ASSET MANAGEMENT 23 $17,004 0.7 $424 $5,381

10
Appendix
Index Definitions†
BARCLAYS GLOBAL AGGREGATE
The Global Aggregate Index provides a broad-based measure of the global investment grade fixed-rate debt markets. The Global Aggregate Index contains three major components: the U.S. Aggregate (USD 300mn), the Pan-European Aggregate (EUR 300mn), and the Asian-Pacific Aggregate Index (JPY 35bn). In addition to securities from these three benchmarks (94.0% of the overall Global Aggregate market value as of December 31, 2010), the Global Aggregate Index includes Global Treasury, Eurodollar (USD 300mn), Euro-Yen (JPY 25bn), Canadian (USD 300mn equivalent), and Investment Grade 144A (USD 300mn) index-eligible securities not already in the three regional aggregate indices.
BARCLAYS GLOBAL TREASURY EX-U.S. CAPPED INDEX
The Barclays Global Treasury Ex-U.S. Capped Index tracks fixed-rate, local currency sovereign debt of investment-grade countries outside the United States.
BARCLAYS U.S. AGGREGATE CREDIT - CORPORATE - INVESTMENT GRADE
The Index is designed to measure the performance of U.S. corporate bonds that have a maturity of greater than or equal to 1 year. The Index is a component of the Barclays U.S. Aggregate Index and includes investment grade, fixed-rate, taxable, U.S. dollar-denominated debt with $250 million or more par amount outstanding, issued by U.S. and non-U.S. industrial, utility, and financial institutions. The Index is rebalanced monthly, on the last day business day of the month.
BARCLAYS U.S. AGGREGATE GOVERNMENT - TREASURY
The Barclays U.S. Aggregate Index provides a measure of the performance of the U.S. dollar denominated investment grade bond market, which includes investment grade (must be Baa3/BBB- or higher using the middle rating of Moody’s Investor Service, Inc., Standard & Poor’s, and Fitch Inc.) government bonds, investment grade corporate bonds, mortgage pass through securities, commercial mortgage backed securities and asset backed securities that are publicly for sale in the United States. The securities in the U.S. Aggregate Index must have at least 1 year remaining to maturity and must have $250 million or more of outstanding face value. Asset backed securities must have a minimum deal size of $500 million and a minimum tranche size of $25 million. For commercial mortgage backed securities, the original aggregate transaction must have a minimum deal size of $500 million, and a minimum tranche size of $25 million; the aggregate outstanding transaction sizes must be at least $300 million to remain in the index. In addition, the securities must be U.S. dollar denominated, fixed rate, non convertible, and taxable. Certain types of securities, such as flower bonds, TINs, and state and local government series bonds are excluded from the U.S. Aggregate Index. Also excluded from the U.S. Aggregate Index are structured notes with embedded swaps or other special features, private placements, floating rate securities and Eurobonds. The U.S. Aggregate Index is market capitalization weighted and the securities in the Index are updated on the last business day of each month.
BARCLAYS U.S. AGGREGATE INDEX
The Barclays U.S. Aggregate Index represents the securities of the U.S. dollar-denominated, investment grade bond market. The Index provides a measure of the performance of the U.S. dollar-denominated, investment grade, bond market, which includes investment grade (must be Baa3/BBB- or higher using the middle rating of Moody’s Investor Service, Inc., Standard & Poor’s, and Fitch Rating) government bonds, investment grade corporate bonds, mortgage pass through securities, commercial mortgage backed securities and asset backed securities that are publicly offered for sale in the United States.
† One cannot invest directly in an index.

11
BARCLAYS U.S. GOVERNMENT INFLATION-LINKED BOND INDEX
The Barclays U.S. Government Inflation-linked Bond Index measures the performance of the inflation-protected public obligations of the U.S. Treasury. Inflation-protected public obligations of the U.S. Treasury, commonly known as “TIPS,” are securities issued by the U.S. Treasury that are designed to provide inflation protection to investors. The Index includes publicly-issued, U.S. Treasury inflation-protected securities that have at least 1 year remaining to maturity on index rebalancing date, with an issue size equal to or in excess of $500 million.
BARCLAYS U.S. HIGH YIELD – CORPORATE
The Index measures the market of USD-denominated, non-investment grade, fixed-rate, taxable corporate bonds. Securities are classified as high yield if the middle rating of Moody’s, Fitch, and S&P is Ba1/BB+/BB+ or below, excluding emerging market debt. The U.S. Corporate High-Yield Index was created in 1986.
DB GLOBAL GOVERNMENT EX-US INFLATION-LINKED BOND CAPPED INDEX
The DB Global Government ex-US Inflation-Linked Bond Capped Index measures the total return performance of inflation-linked government bonds from developed and emerging market countries outside of the United States. The Index includes government debt (direct obligations of the issuer country) but does not include quasi-government debt or corporate debt.
DOW JONES-UBS COMMODITY INDEX
The Dow Jones-UBS Commodity Index (DJ-UBSCI) is a broadly diversified index that allows investors to track commodity futures through a single, simple measure. The index is composed of futures contracts on physical commodities. Commodity weightings are based on production and liquidity, subject to weighting restrictions applied annually such that no related group of commodities constitutes more than 33% of the index and no single commodity constitutes more than 15% or less than 2% of the index.
DOW JONES US SELECT REIT INDEX
The Dow Jones US Select REIT Index is comprised of companies whose charters are the equity ownership and operation of commercial real estate and which operate under the REIT Act of 1960. The Index is generally rebalanced monthly, and returns are calculated on a buy and hold basis except as necessary to reflect the occasional occurrence of Index changes in the middle of the month. Each REIT in the Index is weighted by its float-adjusted market capitalization. That is, each security is weighted to reflect the attainable market performance of the security which reflects that portion of securities shares that are accessible to investors.
GOLD (LONDON PM FIX)
The London Gold Fix involves gold dealers from London's five biggest bullion banks establishing a common transaction price for a large pool of purchase and sale orders. They do this twice each business day - first at 10:30am (the Morning Fix) and then again at 3pm (the Afternoon Fix).
MSCI AC WORLD IMI
The MSCI ACWI IMI Index is a free float-adjusted market capitalization-weighted index that is designed to measure the combined equity market performance of developed and emerging markets. The Index covers approximately 98% of the global equity investment opportunity set.
MSCI EAFE INDEX
The MSCI EAFE Index (Europe, Australasia, Far East) is a free float-adjusted market capitalization index that is designed to measure the equity market performance of developed markets, excluding the US & Canada. As of May 30, 2011, the MSCI EAFE Index consists of the following 22 developed market country indices: Australia, Austria, Belgium, Denmark, Finland, France, Germany, Greece, Hong Kong, Ireland, Israel, Italy, Japan, the Netherlands, New Zealand, Norway, Portugal, Singapore, Spain, Sweden, Switzerland, and the United Kingdom.

12
MSCI EMERGING MARKETS (EM) INDEX
The MSCI Emerging Markets Index is a free float-adjusted market capitalization index that is designed to measure equity market performance of emerging markets. As of May 30, 2011, the MSCI Emerging Markets Index consists of the following 21 emerging market country indices: Brazil, Chile, China, Colombia, Czech Republic, Egypt, Hungary, India, Indonesia, Korea, Malaysia, Mexico, Morocco, Peru, Philippines, Poland, Russia, South Africa, Taiwan, Thailand, and Turkey.
S&P 500® INDEX
The S&P 500 Index is composed of 500 selected stocks, all of which are listed on the Exchange, the NYSE or NASDAQ, and spans over 24 separate industry groups. Since 1968, the S&P 500 Index has been a component of the US Commerce Department’s list of Leading Indicators that track key sectors of the US economy. Current information regarding the market value of the S&P 500 Index is available from market information services. The S&P 500 Index is determined, comprised and calculated without regard to the Trust.
S&P® DEVELOPED EX UNITED STATES <2BN
The S&P Developed Ex–US Under USD 2 Billion is a market capitalization weighted index that defines and measures the investable universe of publicly traded companies domiciled in developed countries outside the US The Developed Small Cap Index is “float adjusted”, meaning that only those shares publicly available to investors are included in the Developed Small Cap Index calculation.
S&P® EMERGING MARKETS <2BN INDEX
S&P Emerging Markets Under USD 2 Billion Index is a float-adjusted, market cap-weighted index that represents the small capitalization segment of emerging countries included in the S&P Global BMI Index. The Global BMI Index captures the full universe of institutionally investable stocks in developed and emerging markets with float-adjusted market capitalizations of at least $100 million.
S&P® MIDCAP 400 INDEX
The S&P MidCap 400 Index covers over 7% of the US equities market, and is part of a series of S&P US indices. Included in the index are companies with market cap in the range of US $1 billion to US $4.5 billion. This range is reviewed from time to time to ensure consistency with market conditions. The index also includes companies that should have four consecutive quarters of positive as-reported earnings, where as-reported earnings are defined as GAAP Net Income excluding discontinued operations and extraordinary items.
S&P® SMALLCAP 600 INDEX
The S&P SmallCap 600 Index measures the performance of the small-capitalization sector in the US equity market. The selection universe for the Index includes all US common equities listed on the NYSE, NASDAQ Global Select Market, NASDAQ Select Market and NASDAQ Capital Market with market capitalizations between $250 million and $1.2 billion. The Index is float-adjusted and market capitalization weighted.

13
Important Risk Information THIS MATERIAL IS FOR YOUR PRIVATE INFORMATION. In Hong Kong, this material is published by State Street Global Advisors Asia Limited and has not been reviewed by the Securities and Futures Commission of Hong Kong. In Singapore, this is published by State Street Global Advisors Singapore, Limited (Co. registration no. 200002719D). This material or any portion thereof may not be reprinted or redistributed without the written consent of State Street Global Advisors. ETFs trade like stocks, are subject to investment risk, fluctuate in market value and may trade at prices above or below the ETFs net asset value. Brokerage commissions and ETF expenses will reduce returns. The views expressed here are those of the Intermediary Business Group of State Street Global Advisors and are subject to change based on market and other conditions. The information we provide does not constitute investment advice and it should not be relied on as such. It should not be considered a solicitation to buy or an offer to sell any security. It does not take into account any investor’s particular investment objectives, strategies, tax status or investment horizon. All material has been obtained from sources believed to be reliable but its accuracy is not guaranteed. There is no representation nor warranty as to the current accuracy of such information, nor liability for decisions based on such information. Past performance is no guarantee of future results. Unless otherwise noted, all data and statistical information was obtained from Markit and SSgA as of 10/31/2013. Barclays is a trademark of Barclays, the investment banking division of Barclays Bank PLC (“Barclays”), and has been licensed for use in connection with the listing and trading of the SPDR Barclays ETFs. The products are not sponsored by, endorsed, sold or promoted by Barclays and Barclays makes no representation regarding the advisability of investing in them. Source: Barclays POINT/Global Family of Indices. (c) 2013 Barclays Inc. Used with permission. The Dow Jones-UBS Commodity IndexesSM are a joint product of DJI Opco, LLC (Dow Jones Opco”), a subsidiary of S&P Dow Jones Indices LLC, and UBS Securities LLC (“UBS”), and have been licensed for use by SSgA. Dow Jones® and DJ are trademarks of Dow Jones Trademark Holdings LLC. UBS® is a registered trademark of UBS AG. Standard & Poor’s and S&P® are registered trademarks of Standard & Poor’s Financial Services LLC (“S&P”) and Dow Jones is a registered trademark of Dow Jones Trademark Holdings LLC (“Dow Jones”) and have been licensed for use by S&P Dow Jones Indices LLC and sublicensed by SSGA. The Dow Jones US Select REIT Index is a product of S&P Dow Jones Indices LLC and has been licensed by SSGA. The MSCI EAFE Index, MSCI EM (EMERGING MARKETS) Index and MSCI ACWISM EX USA INDEX are trademarks of MSCI Inc. Neither MSCI nor any other party involved in or related to compiling, computing or creating the MSCI data makes any express or implied warranties or representations with respect to such data (or the results to be obtained by the use thereof), and all such parties hereby expressly disclaim all warranties of originality, accuracy, completeness, merchantability or fitness for a particular purpose with respect to any of such data. Without limiting any of the foregoing, in no event shall MSCI, any of its affiliates or any third party involved in or related to compiling, computing or creating the data have any liability for any direct, indirect, special, punitive, consequential or any other damages (including lost profits) even if notified of the possibility of such damages. No further distribution or dissemination of the MSCI data is permitted without MSCI’s express written consent. “SPDR” is a registered trademark of Standard & Poor Financial Services LLC (“S&P”) and has been licensed for use by State Street Corporation. No financial product offered by State Street Corporation or its affiliates is sponsored, endorsed, sold or promoted by S&P or its Affiliates, and S&P and its affiliates make no representation, warranty or condition regarding the advisability of buying, selling or holding units/shares in such products. Further limitations and important information that could affect investors’ rights are described in the prospectus for the applicable product.
© 2013 State Street Corporation. All Rights Reserved.
IBGAP-1578 Exp. Date: 31/01/2014