Embed Size (px)
Citation preview

Global Entrepreneurship Monitor
the Netherlands 2019
National Report

Jan de Kok; Paul van der Zeijden; André van Stel; Amber van der Graaf; Jacqueline
Snijders; Nora Cheikh
Zoetermeer , 14 October 2020
The responsibility for the contents of this report lies with Panteia. Quoting numbers or
text in papers, essays and books is permitted only when the source is clearly mentioned.
No part of this publication may be copied and/or published in any form or by any means,
or stored in a retrieval system, without the prior written permission of Panteia. Panteia
does not accept responsibility for printing errors and/or other imperfections.
This research has been financed by the Dutch Ministry of Economic Affairs and Climate Policy.

3
Table of contents
Summary 5
1 Introduction 7 1.1 The Global Entrepreneurship Monitor (GEM) 7 1.2 Income levels 8 1.3 The entrepreneurship process 8 1.4 Adult Population Survey and National Expert Survey 10 1.5 Outline of the Dutch GEM report 2019 13
2 Entrepreneurial perceptions, attitudes, and intentions 15 2.1 Entrepreneurial perceptions and potential entrepreneurship 15 2.2 Entrepreneurial attitudes 18 2.3 Entrepreneurial intentions 20 2.4 Comparing potential and intentional entrepreneurs 22
3 Entrepreneurial activity 25 3.1 Total early-stage entrepreneurial activity (TEA) 25 3.2 Aspirations of early-stage entrepreneurs 34 3.3 Established entrepreneurship 39 3.4 Entrepreneurial Employee Activity (EEA) 40 3.5 Entrepreneurial exit 44 3.6 Triggers and barriers of entrepreneurship: Results of the Dutch NES 46
References 49


5
Summary
The Global Entrepreneurship Monitor (GEM) is a research program with the aim of
obtaining internationally comparative data on entrepreneurial activity. By consistently
using proven indicators, global and longitudinal comparisons of entrepreneurial activity
can be made. Most indicators discussed in the present report are from GEM’s Adult
Population Survey (APS), while a few indicators are taken from GEM’s National Expert
Survey (NES). The most remarkable GEM 2019 results for the Netherlands are presented
in the following paragraphs.
The Total early-stage Entrepreneurial Activity (TEA) rate is defined as the percentage
of adults between 18 and 64 years of age who are either actively trying to start a new
business (nascent entrepreneurs), or who own and manage a business younger than
3.5 years (young business entrepreneurs). The TEA rate decreased, from 12.3% in 2018
to 10.4% in 2019. This decrease primarily reflected a drop in young business
entrepreneurship and much less so a drop in nascent entrepreneurship. Where in 2018,
the Netherlands ranked eighth out of the high-income countries, this year, the TEA-
ranking dropped to nineteenth. Still, the TEA rate in the Netherlands remains higher
than the EU average (9.6%). From a long-term perspective, the TEA rate has doubled
since the Netherlands joined the GEM project in 2001. Additionally, entrepreneurial
intent in the Netherlands has reached a peak in 2019, with 12.2% of the adult population
expecting to start a business within the next three years.
Although the TEA rate has seen a decline in 2019, TEA entrepreneurs have become more
ambitious in terms of job growth. The last year has seen a shift from mainly solo
entrepreneurial ambitions to the majority of entrepreneurs expecting to create job
growth. While less than half of TEA entrepreneurs in 2018 expected to create at least
one job in the next five years, in 2019, 70% of TEA entrepreneurs in the Netherlands
expect to do so. Although this is a positive development, as a word of caution we also
mention that research has shown that actual job creation is often (much) smaller than
job creation ambitions due to overconfidence on the part of early-stage entrepreneurs.
One in three early-stage entrepreneurs in the Netherlands cited making a difference in
the world as their motivation to start a business. However, early-stage entrepreneurs
in the Netherlands tend to be less ambitious about the scope of their impact. Compared
to other entrepreneurs in the EU, entrepreneurs in the Netherlands tend to have less of
a potential impact on the national and global scale, meaning their potential impact tends
to be more local.
The established entrepreneurship rate has remained high in 2019 at 11%, though it is
a slight decrease from 2018 (12%). For this metric of entrepreneurship, the Netherlands
remains to score higher than the EU-average (8%). This is also reflected by the exit
rate, which has remained low at 2.6% in 2019.
Entrepreneurial perceptions in the Netherlands, which improved considerably in 2017
and remained stable at high levels in 2018, have slightly declined in 2019. Amongst
entrepreneurs and non-entrepreneurs, perceptions of opportunities and capabilities
have worsened somewhat. However, the fear of failure index has fallen from 35% of the
adult population in 2018 to 27% in 2019. Compared to the whole group of high-income
economies, the Netherlands scores much better on perceived opportunities and fear of
failure, while perceived capabilities in the Netherlands are below the average high-
income economy. While entrepreneurial perceptions have deteriorated to some extent,

6
entrepreneurial attitudes in terms of entrepreneurship being a desirable career choice,
a high-status activity, or an activity attracting much media attention, have improved in
2019.
Employees may also exhibit entrepreneurial activities. This is monitored by the
Entrepreneurial Employee Activity rate (EEA). EEA is a measure that accounts for the
situation where an employee in the past three years was actively involved in and had a
leading role in either the idea development for a new activity or the preparation and
implementation of a new activity. In short, it refers to intrapreneurship. The EEA rate
for the Netherlands is 6.0%, which is above the average value for high-income
economies (4.2%).
In sum, the results of GEM APS 2019 show that in spite of the slowdown of economic
growth, entrepreneurship remains central to the economy and culture of the
Netherlands. Entrepreneurial perception of opportunities and entrepreneurial attitudes
as well as entrepreneurial employee activity are well above the averages of high-income
economies. Notably though, the TEA rate of the Netherlands fell below the average TEA
rate of high-income economies in 2019. More specifically, the Dutch nascent
entrepreneurship rate is below par whereas the young business entrepreneurship rate
is at par with the high-income economies. Established entrepreneurship and
entrepreneurial exit both remained fairly stable.
Finally, the results of the National Expert Survey (NES) show that the Netherlands
scores higher across all entrepreneurial framework conditions than the averages of the
high-income economies. Overall, this suggests that while entrepreneurship rates in the
early and established stages are somewhat lower than in the previous year, the
conditions to start a business in the Netherlands remain relatively good.

7
1 Introduction
This research report is structured in a fashion similar to recent Dutch publications under
the Global Entrepreneurship Monitor banner1.
1.1 The Global Entrepreneurship Monitor (GEM)
History
The Global Entrepreneurship Monitor (GEM) is a research programme executed annually
with the aim of obtaining internationally comparative high quality research data on
entrepreneurial activity at the national level. This academic research consortium started
as a partnership between the London Business School and Babson College in 1999 with
10 participating countries. Over the years, GEM has expanded to comprise 50 economies
in 2019. Currently, GEM is the largest study of entrepreneurial activity in the world. The
GEM research programme provides a harmonised assessment of the level of national
entrepreneurial activity and conditions to which it is subject for each participating
country. In 2019, the Netherlands participated in GEM for the nineteenth time since it
joined the GEM project in 2001.
Object ives
Although it is widely acknowledged that entrepreneurship is an important force in
shaping a country’s economy, the understanding of the exact roles that entrepreneurs
play in modern economies is still far from complete (Wennekers and Van Stel, 2017).
The quest to unravel the complex relationship between entrepreneurship and economic
development has been hampered particularly by a lack of cross-national harmonised
data on entrepreneurship. Since 1999, the GEM research programme has sought to
address this by collecting relevant cross-national harmonised data on an annual basis.
GEM focuses on three main objectives:
To measure differences in the level of entrepreneurial activity between countries.
To uncover factors that determine national levels of entrepreneurial activity.
To identify policies that may enhance the national level of entrepreneurial activity.
In addition to these three main objectives, GEM studies the contribution of
entrepreneurship to national economic growth. Traditional analyses of economic growth
and competitiveness have tended to neglect the role played by new and small firms in
the economy. GEM takes a comprehensive approach and considers the extent of
involvement in entrepreneurial activity within a country, distinguishing three types of
economies based on income level (section 1.2) and different phases of entrepreneurship
(section 1.3).
1 See De Kok, Van der Zeijden, Kruithof, van Stel, van der Graaf, & Snijders (2019), De Kok, Kruithof, Snijders,
Van der Graaf, Van Stel & Van der Zeijden (2018), Van der Zeijden, Van der Graaf & Snijders (2017), Van der
Zeijden, Van Stel & Wong (2016), Span, Van Stel & Van den Berg (2015), Van Stel, Span & Hessels (2014) and
Van der Zwan, Hessels, Hoogendoorn & De Vries (2013). Furthermore, throughout the report, general descriptions of GEM-related phenomena have been taken over from these reports.

8
1.2 Income levels
For distinguishing different economies, GEM follows the World Economic Forum (WEF)
and World Bank who classify countries based on income level2. The following three
economies are distinguished3:
Low-income economies.
Middle-income economies.
High-income economies.
1.3 The entrepreneurship process
GEM acknowledges that entrepreneurial activity is best seen as a process rather than a
single time event (see also Van der Zwan, Thurik and Grilo, 2010). Therefore, data are
collected across several phases of entrepreneurship. Such a dynamic view provides
valuable information to policy makers because individuals may respond differently to
policy interventions depending on their specific position in the entrepreneurship
process. For example, it may happen that substantial awareness for entrepreneurship
as a career choice exists in a country and that many people expect to start a business
within the next few years. In that same country, however, low rates of nascent
entrepreneurship may exist as compared to countries with similar levels of economic
development. Such a discrepancy in entrepreneurship involvement rates across several
phases may call for targeted policy interventions to ameliorate the transformation
between phases, in this example from intentions to actual steps to start a new business.
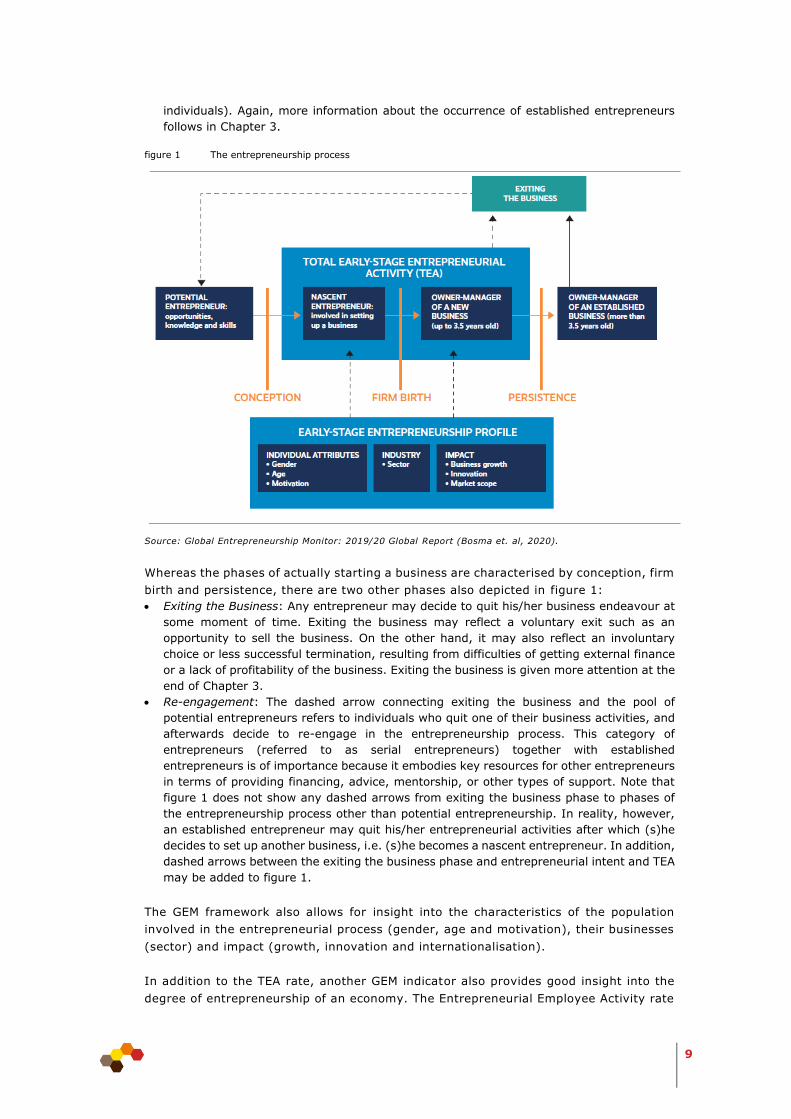
GEM operationalises the entrepreneurship process as depicted in figure 1, which is taken
from the 2019/20 Global Report (Bosma et al., 2020).
Hence, the following phases of entrepreneurship can be distinguished:
Potential entrepreneurs: Potential entrepreneurs are individuals who have not yet taken
steps to start a business, but they have the beliefs and abilities to start a business.
Specifically, individuals are considered to be potential entrepreneurs when they believe
they have the knowledge and skills to start a business and when they see opportunities
for setting up a business in the area in which they live. Furthermore, they should not be
afraid of business failure. Section 2.1 of this report focuses on potential entrepreneurship.
Additionally, their intention to start a business is underpinned by the perceptions society
holds of entrepreneurs. Attitudes towards entrepreneurship are the subject of section 2.2.
Entrepreneurial intent: Potential entrepreneurship is followed by entrepreneurial intent:
individuals who have actual intentions – alone or together with other individuals – to start
a new business within the next three years. Information about the prevalence of
entrepreneurial intent in the Netherlands is provided in section 2.3.
Total Early-stage Entrepreneurial Activity (TEA): GEM’s primary measure of
entrepreneurship is total early-stage entrepreneurial activity. TEA consists of both nascent
entrepreneurs and new entrepreneurs. Specifically, the group of nascent entrepreneurs
refers to individuals within the adult population (18-64 years of age) who are currently
trying to start a new business. For this start-up effort, the individual expects to own at
least a part of this new business, and salaries or wages have not yet been paid for the past
three months. New entrepreneurs are currently involved in owning and managing a new
existing business. Salaries or wages have been paid for between 3 and 42 months (3.5
years). Self-employed individuals may also be included in this group. A significant part of
Chapter 3 of this report is devoted to early-stage entrepreneurship.
Established entrepreneurship: The cycle continues with established business owners, who
have been owner-managers of a business for at least 42 months (including self-employed
2 http://datatopics.worldbank.org/world-development-indicators/stories/the-classification-of-countries-by-
income.html 3 As of July 2019, low-income economies are defined as those with a gross national income (GNI) per capita of
$1,025 or less in 2018; middle-income economies are those with a GNI per capita between $1,025 and $12,375; high-income economies are those with a GNI per capita of $12,376 or more.
9
individuals). Again, more information about the occurrence of established entrepreneurs
follows in Chapter 3.
figure 1 The entrepreneurship process
Source: Global Entrepreneurship Monitor: 2019/20 Global Report (Bosma et. al, 2020).
Whereas the phases of actually starting a business are characterised by conception, firm
birth and persistence, there are two other phases also depicted in figure 1:
Exiting the Business: Any entrepreneur may decide to quit his/her business endeavour at
some moment of time. Exiting the business may reflect a voluntary exit such as an
opportunity to sell the business. On the other hand, it may also reflect an involuntary
choice or less successful termination, resulting from difficulties of getting external finance
or a lack of profitability of the business. Exiting the business is given more attention at the
end of Chapter 3.
Re-engagement: The dashed arrow connecting exiting the business and the pool of
potential entrepreneurs refers to individuals who quit one of their business activities, and
afterwards decide to re-engage in the entrepreneurship process. This category of
entrepreneurs (referred to as serial entrepreneurs) together with established
entrepreneurs is of importance because it embodies key resources for other entrepreneurs
in terms of providing financing, advice, mentorship, or other types of support. Note that
figure 1 does not show any dashed arrows from exiting the business phase to phases of
the entrepreneurship process other than potential entrepreneurship. In reality, however,
an established entrepreneur may quit his/her entrepreneurial activities after which (s)he
decides to set up another business, i.e. (s)he becomes a nascent entrepreneur. In addition,
dashed arrows between the exiting the business phase and entrepreneurial intent and TEA
may be added to figure 1.
The GEM framework also allows for insight into the characteristics of the population
involved in the entrepreneurial process (gender, age and motivation), their businesses
(sector) and impact (growth, innovation and internationalisation).
In addition to the TEA rate, another GEM indicator also provides good insight into the
degree of entrepreneurship of an economy. The Entrepreneurial Employee Activity rate

10
(EEA) measures involvement of employees in entrepreneurial activities, such as
developing or launching new goods or services, or setting up a new business unit, a new
establishment or subsidiary.
1.4 Adult Population Survey and National Expert Survey
1.4.1 Adult Populat ion Survey (APS)
GEM consists of two survey components. Data collected as part of the Adult Population
Survey (APS) are used to provide indicators of entrepreneurial activity, entrepreneurial
attitudes, and entrepreneurial aspirations within an economy. These indicators can then
be compared between economies. The APS data collection covers the complete life cycle
of the entrepreneurship process as depicted in figure 1. In addition, the APS
distinguishes between several types of entrepreneurs based on start-up motives, growth
aspirations, etc. These types will be discussed in Chapter 3.
The APS data are collected by standardised telephone surveys in each participating
economy (or by means of face-to-face interviews in some economies). Each economy’s
sample must consist of at least 2,000 respondents of 18 years and older. For 2019, the
Dutch sample consists of 2,252 respondents that was acquired by means of a mixture
between fixed-line and mobile-line telephone interviews. The survey was held in July
and August 2019. In the remainder of this report, all data are reweighted by the actual
distribution of the Dutch population in terms of gender, age and education to make the
sample representative along these dimensions for the Dutch adult population between
18 and 64 years of age.
The GEM questionnaires are constantly under review and necessary enhancements are
introduced to ensure the continuity and relevance of the questions. In 2019, the
following changes were introduced to the APS questionnaire:
Improved distinction between different forms of entrepreneurial activity (i.e. independent
early-stage entrepreneurial activity, sponsored early-stage activity, employee
entrepreneurial activity).
Improved method of measuring perceptions and attitudes via a five-point Likert scale
(from strongly agree to strongly disagree), instead of a yes/no answer4.
Expand the understanding and improve the measurement of entrepreneurial motivation
by including a broader selection of reasons for starting or running a business.
Introduce broader measurement of impact, which includes geographic dimension and
both product and process innovation.
These alterations to the APS questionnaire have resulted in a few changes to the
national report. Notably, section 3.1 now includes a part on motivations, which replaces
the part concerning opportunity and necessity TEA from previous years. The new part
on motivations provides a broader perspective of entrepreneurial motivations. Section
3.1 now also includes a part on the distinction between independent and sponsored
early-stage entrepreneurial activity. The new measurements of impact (including
geographic dimension and the distinction between product and process innovation) are
discussed in a new part in section 3.2. This part replaces the part on perceived
competition level from previous years.
4 Among others, the introduction of this Likert scale reduced the number of respondents answering “don’t know” to these questions.

11
1.4.2 National Expert Survey (NES)
For the National Expert Survey (NES) at least 36 experts in each participating country
are asked about their opinions about nine topics which are believed to have an impact
on a nation’s entrepreneurial activity. In this way, the start-up environments in the
participating countries can be compared on the basis of these nine so-called
“entrepreneurial framework conditions” (EFCs). Four experts – entrepreneurs or
professionals – in each nation’s NES sample should be active in each EFC category. The
nine categories are financing, government policies, governmental programs, education
and training, R&D transfer, commercial infrastructure, internal market openness,
physical infrastructure and cultural and social norms.
The present report focuses mainly on the findings from the Adult Population Survey.
The results of the Dutch NES are discussed in Section 3.6.
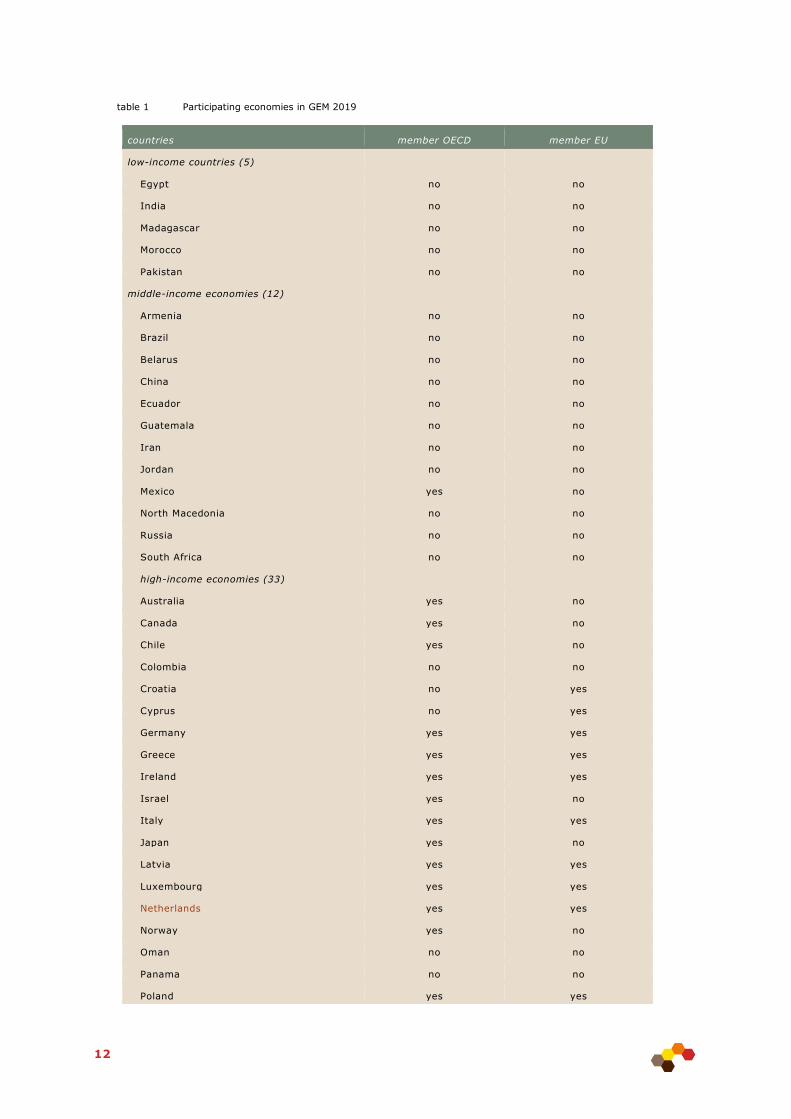
1.4.3 Part ic ipat ing countries in 2019
Table 1 contains an overview of the 50 economies that participated in the 2019 APS5
survey. Among these economies, there are 24 Member Countries of the Organisation for
Economic Co-operation and Development (OECD) and 16 Member States of the
European Union (EU). A classification into the following three country income groups is
provided: low-income countries, middle-income countries, and high-income countries
(see table 1).
5 In 2019, 50 countries conducted both the APS and NES surveys. In addition, four countries only conducted the NES survey.
12
table 1 Participating economies in GEM 2019
countries member OECD member EU
low-income countries (5)
Egypt no no
India no no
Madagascar no no
Morocco no no
Pakistan no no
middle-income economies (12)
Armenia no no
Brazil no no
Belarus no no
China no no
Ecuador no no
Guatemala no no
Iran no no
Jordan no no
Mexico yes no
North Macedonia no no
Russia no no
South Africa no no
high-income economies (33)
Australia yes no
Canada yes no
Chile yes no
Colombia no no
Croatia no yes
Cyprus no yes
Germany yes yes
Greece yes yes
Ireland yes yes
Israel yes no
Italy yes yes
Japan yes no
Latvia yes yes
Luxembourg yes yes
Netherlands yes yes
Norway yes no
Oman no no
Panama no no
Poland yes yes

13
countries member OECD member EU
Portugal yes yes
Puerto Rico no no
Qatar no no
Saudi Arabia no no
Slovak Republic yes yes
Slovenia yes yes
Republic of Korea yes no
Spain yes yes
Sweden yes yes
Switzerland yes no
Taiwan no no
United Arab Emirates no no
United Kingdom yes yes
United States yes no
Source: GEM APS 2019.
1.5 Outline of the Dutch GEM report 2019
This Dutch GEM report is structured as follows. Chapter 2 focuses on entrepreneurial
perceptions and attitudes of the Dutch adult population, and compares the 2019
situation with earlier years. In addition, Chapter 2 reports on the evolution of
entrepreneurial intentions over time. Chapter 3 describes the latest Dutch developments
regarding entrepreneurial activity, and focuses on early-stage and established
entrepreneurs. Chapter 3 also pays attention to entrepreneurial employee activity
(EEA). Furthermore, attention is devoted to entrepreneurs exiting the business. This
chapter ends with a discussion of the results from the Dutch NES survey.


15
2 Entrepreneurial perceptions, attitudes, and
intentions
The present chapter focuses on entrepreneurial perceptions, attitudes, and intentions
among the Dutch adult population in 2019. A longitudinal view of these measures is
provided by comparing the Dutch figures from 2019 with those from previous years.
Additionally, the Dutch results are compared with international results. For this purpose,
the averages of the 33 high-income countries serve as the benchmark.
First of all, entrepreneurial perceptions indicate whether individuals perceive
entrepreneurial opportunities in their environment, how they perceive their own
entrepreneurial ability, and what their perception is towards business failure. Secondly,
entrepreneurial attitudes refer to the general image of entrepreneurship in the
Netherlands, and reveal the extent to which entrepreneurship is considered a favourable
occupational choice. Third, entrepreneurial intentions provide a concrete dynamic
measure of entrepreneurial activity in a country. Specifically, GEM asks individuals
about their intentions to start a business within the next three years.
2.1 Entrepreneurial perceptions and potential entrepreneurship
The decision to become an entrepreneur, or the progression of an individual through
the several phases of the entrepreneurship process (figure 1), depends on a wide range
of characteristics of the potential entrepreneur. One category of relevant, determining
factors refers to an individual’s perception about entrepreneurship. Indeed, perception
variables appear to be relevant in explaining the propensity towards being a nascent or
an established entrepreneur. While the relationship between the individual’s perceptions
about entrepreneurship and their behaviour is considered to be important, research on
this topic has been limited, partly because of problems with acquiring good data on the
subject (Carsrud and Brännback, 2011).
The objective state of the environment in terms of its favourability towards pursuing
entrepreneurial endeavours is important. An individual’s subjective perception about
this environment, however, may be even more relevant. The first element of
entrepreneurial perception under study refers to the extent to which individuals see
good opportunities for starting a new business in the area they live in. In addition to
this perception about entrepreneurial opportunities in the environment, an individual’s
belief concerning one’s own capabilities of starting a business is also relevant. Indeed,
studies report that so-called entrepreneurial self-efficacy is a predictor of
entrepreneurial entry (e.g. Wennberg, Pathak and Autio, 2013). However, fear of failure
may prevent individuals who perceive opportunities or believe they have the skills
necessary for entrepreneurship to actually start a business. Hence, the third element of
entrepreneurial perception deals with an individual’s fear of business failure.
Individuals are considered to be potential entrepreneurs when they see enough
opportunities in their living area for setting up a business, when they have the belief
they have the capabilities to start a business, and when they are not afraid of business
failure.

16
Entrepreneuria l perceptions in 2019
The values in table 2 show the three dimensions of potential entrepreneurship and their
developments over time from 2010 onwards. Throughout the years, we observe a
variation in the level of perceived opportunities that clearly correlates with macro-
economic developments6. Levels first dropped in 2010, during the years of the first
recession that initiated the recent economic and financial crises. Two years of slight
economic recovery followed with modest growth levels in GDP and perceived
opportunities improving. GDP growth again was negative during the second recession
that followed in 2012 and 2013 and the level of perceived opportunities followed suit.
Since then, the level of perceived opportunities increased each year up until 2019. The
relationship between GDP and perceived opportunities is plotted in figure 2.
In 2019, the level of perceived opportunities is 65%. This is slightly lower than in 2018,
and thus seems to mark the end of a period (starting in 2013) in which the level of
perceived opportunities increased every year. However, as mentioned in the
introduction, the formulation of the underlying questions on entrepreneurial perceptions
has slightly changed in 2019. The differences between 2018 and 2019 might therefore
also – at least partially – reflect the impact of the change in the methodology applied.
This applies to all three dimensions of potential entrepreneurship included in table 2.
table 2 Entrepreneurial perceptions in the Netherlands, 2010-2019, percentage of adult population (18-64
years of age) that agrees with the statement
Item 2010 2011 2012 2013 2014 2015 2016 2017 2018 2019
perceived opportunities:
“In the next six months, there
will be good opportunities for
starting a business in the area
where I live”
45 48 34 33 46 48 54 64 67 65
perceived capabilities:
“I have the knowledge, skill and
experience required to start a
new business”
46 42 42 42 44 41 41 45 46 42
fear of failure:
“Fear of failure prevents me
from starting a business”
26 37 39 43 39 38 35 33 35 27
Note: Until 2018 respondents had to answer yes or no to these statements. As of 2019, respondents can indicate
on a five-point Likert scale to which extent they agree with these statements. The percentage of
respondents that agrees is determined by the share of respondents that replies ‘agree’ or ‘strongly agree’
to these statements.
Source: GEM APS 2019.
In a somewhat similar vein, the fear of failure indicator increased dramatically in 2011,
and increased further until 2013 when it reached its highest point since the Netherlands’
participation in the GEM in 2001. Also, in 2013 the level of perceived opportunities
reached its lowest point since 2003. These numbers provide an indication of the fact
that in 2013 the economic environment for starting a business was relatively poor. The
increase in perceived opportunities and decrease of the fear of failure index suggest
that the perception of economic circumstances improved in 2014. This increase in
6 See recent Macro Economische Verkenning and Centraal Economisch Plan publications (Netherlands Bureau for Economic Policy Analysis) for numbers on GDP developments.

17
perceived opportunities and decrease of the fear of failure index continued from 2013
to 2017. After a small increase in 2018, the fear of failure index strongly declined to 27
in 2019, the lowest level since 2011. This is specific for the Netherlands: across all
country groups distinguished in this report, the fear of failure index shows on average
a slight increase from 2018 to 2019. This makes it unlikely that the reported decline for
the Netherlands is mainly caused by the change in the methodology applied. One likely
explanation for the low level of fear of failure in the Netherlands is the thriving economy
in 2019 (see figure 2). Possibly, the stigma of failure is also lower in the Netherlands,
due to the high prevalence rate of entrepreneurs and the increasing role of
entrepreneurship education in the Netherlands over the past decade.
The level of self-perceived capabilities in 2019 was 42%. This is somewhat lower than
2018 (46%). Entrepreneurial capabilities are largely independent of the business cycle
(unlike the other two indicators described above). Thus, the difference in self-perceived
capabilities between 2018 and 2019 cannot be easily explained by macro-economic
developments. Instead, this difference may (at least partially) be due to the change in
the methodology applied.
figure 2 Plotted relationship between changes in GDP (indexed at 2008=100) and perceived opportunities in
the Netherlands, 2008-2019
Source: GEM APS 2019, Central Statistics Bureau and Netherlands Bureau for Economic Policy Analysis (2019) .
From an international perspective, the Dutch population scores better on perceived
opportunities and fear of failure when compared to the average scores for the OECD
and the average high-income countries (see table 3). On perceived capabilities, the
Dutch population scores lower than the OECD and high-income countries.

18
table 3 Entrepreneurial perceptions internationally compared (unweighted average of country scores),
2019, percentage of adult population (18-64 years of age)
low-income
countries
middle-
income
countries
high-
income
countries OECD EU Netherlands
perceived opportunities 51 52 53 52 52 65
perceived capabilities 56 63 55 51 53 42
fear of failure 42 45 43 43 45 27
Source: Panteia/GEM APS 2019.
Table 4 makes a distinction between non-entrepreneurs and entrepreneurs, where the
latter group of individuals consists of individuals with intentions to start a business,
nascent entrepreneurs, and new and established entrepreneurs. For predicting future
developments in entrepreneurship, particularly the entrepreneurial perceptions of the
non-entrepreneurs may be of interest. Not surprisingly, entrepreneurial perception
indicators are higher for entrepreneurs compared to non-entrepreneurs. The data shows
that the gap between non-entrepreneurs and entrepreneurs appears particularly
pronounced for perceived capabilities. Of the non-entrepreneurs, only 30% think they
have the capabilities to start a new business, whereas 77% of the entrepreneurs think
they have the capabilities to start a new business. Thus, the lack of confidence in
entrepreneurial capabilities in the Netherlands is concentrated amongst non-
entrepreneurs. Part of this gap in confidence reflects overconfidence on the part of
entrepreneurs, as a considerable proportion of entrepreneurs’ ambitions, including job
creation ambitions, are not realised in practice (Cieślik et al., 2018; Szerb and Vörös,
2019).
table 4 Entrepreneurial perceptions of (non-)entrepreneurs in the Netherlands, 2019, percentage of adult
population (18-64 years of age)
adult population non-entrepreneurs entrepreneurs
perceived opportunities 65 61 73
perceived capabilities 42 30 77
fear of failure 27 29 22
Source: Panteia/GEM APS 2019.
2.2 Entrepreneurial attitudes
Measuring attitudes towards entrepreneurship is important, because entrepreneurial
attitudes contain information about the image of entrepreneurs(hip) in a country. A
more favourable image of entrepreneurs and entrepreneurship may indicate a higher
acceptance of entrepreneurship within a culture, which may influence the decision to
engage in entrepreneurship (Thornton, Ribeiro-Soriano & Urbano, 2011). GEM
distinguishes between three entrepreneurial attitudes in a society: individuals’ opinions
about entrepreneurship being a desirable career option, individuals’ opinions about the
level of respect and status that entrepreneurs have, and respondents’ assessments of
the media attention of successful entrepreneurs.
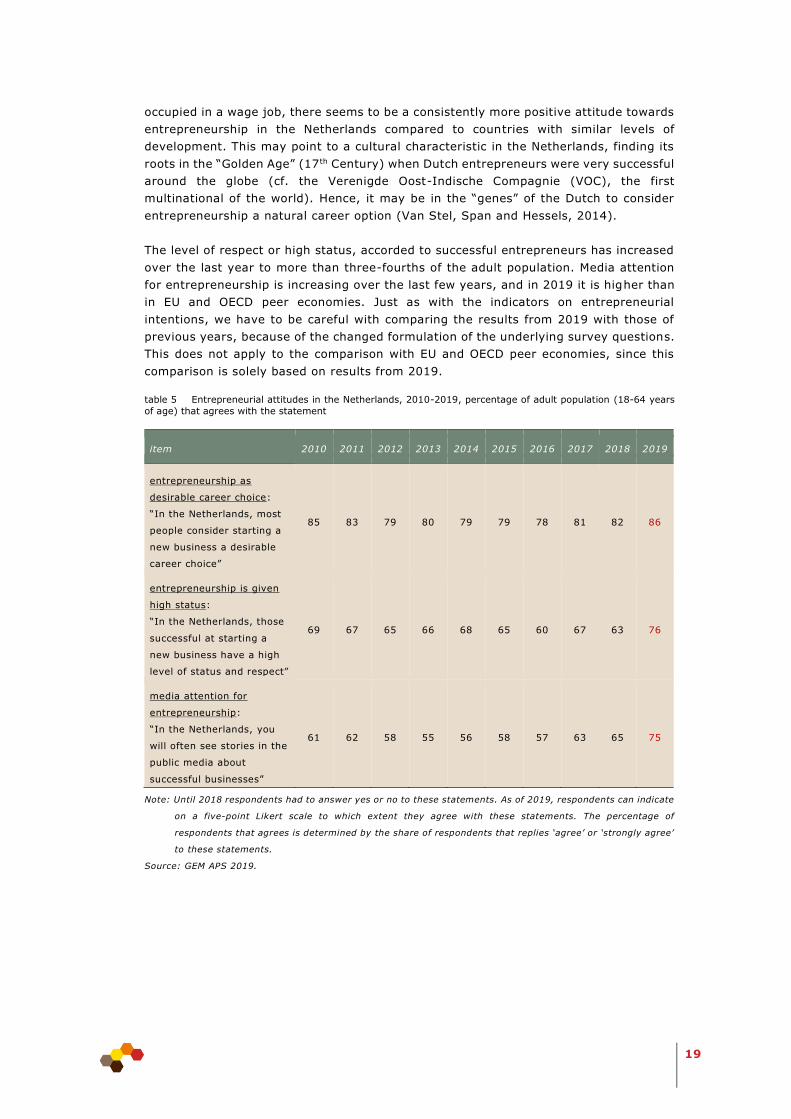
Table 5 shows that 86% of the Dutch adult population think that entrepreneurship is
considered a desirable career choice in the Netherlands. This percentage is rather stable
over time and much higher than in comparable countries in the EU, OECD, and high-
income countries (see table 6). Hence, even though most labour force participants are
19
occupied in a wage job, there seems to be a consistently more positive attitude towards
entrepreneurship in the Netherlands compared to countries with similar levels of
development. This may point to a cultural characteristic in the Netherlands, finding its
roots in the “Golden Age” (17th Century) when Dutch entrepreneurs were very successful
around the globe (cf. the Verenigde Oost-Indische Compagnie (VOC), the first
multinational of the world). Hence, it may be in the “genes” of the Dutch to consider
entrepreneurship a natural career option (Van Stel, Span and Hessels, 2014).
The level of respect or high status, accorded to successful entrepreneurs has increased
over the last year to more than three-fourths of the adult population. Media attention
for entrepreneurship is increasing over the last few years, and in 2019 it is higher than
in EU and OECD peer economies. Just as with the indicators on entrepreneurial
intentions, we have to be careful with comparing the results from 2019 with those of
previous years, because of the changed formulation of the underlying survey questions.
This does not apply to the comparison with EU and OECD peer economies, since this
comparison is solely based on results from 2019.
table 5 Entrepreneurial attitudes in the Netherlands, 2010-2019, percentage of adult population (18-64 years
of age) that agrees with the statement
item 2010 2011 2012 2013 2014 2015 2016 2017 2018 2019
entrepreneurship as
desirable career choice:
“In the Netherlands, most
people consider starting a
new business a desirable
career choice”
85 83 79 80 79 79 78 81 82 86
entrepreneurship is given
high status:
“In the Netherlands, those
successful at starting a
new business have a high
level of status and respect”
69 67 65 66 68 65 60 67 63 76
media attention for
entrepreneurship:
“In the Netherlands, you
will often see stories in the
public media about
successful businesses”
61 62 58 55 56 58 57 63 65 75
Note: Until 2018 respondents had to answer yes or no to these statements. As of 2019, respondents can indicate
on a five-point Likert scale to which extent they agree with these statements. The percentage of
respondents that agrees is determined by the share of respondents that replies ‘agree’ or ‘strongly agree’
to these statements.
Source: GEM APS 2019.

20
table 6 Entrepreneurial attitudes internationally compared (unweighted average of country scores), 2019,
percentage of adult population (18-64 years of age) that agrees with the statement
item
low-income
countries
middle-
income
countries
high-
income
countries OECD EU Netherlands
entrepreneurship as
desirable career choice 69 74 60 58 58 86
entrepreneurship is given
high status 66 77 70 69 63 76
media attention for
entrepreneurship 56 70 64 62 58 75
Source: GEM APS 2019.
2.3 Entrepreneurial intentions
This section reports on the entrepreneurial intentions of the Dutch adult population.
This is an important indicator of entrepreneurship dynamics, which may predict the
future level of actual entrepreneurial activity in a country (Davidsson, 2006). Between
2010 and 2015, the level of entrepreneurial intentions has almost doubled (from 7.1%
to 11.1%). Possibly, the increased attention in education curricula given to
entrepreneurship in the Netherlands over these years (European Commission, 2012)
has contributed to positive intentions towards entrepreneurship. 2016 and 2017 showed
a slight decrease in the level of entrepreneurial intentions, but in 2018 and 2019
entrepreneurial intent increased again. In 2019, 12.2% of the adult population
expressed their intent to start a business within the next three years (see table 7).
table 7 Entrepreneurial intentions in the Netherlands, 2010-2019, percentage of adult population (18-64
years of age) that agrees with the statement
Item 2010 2011 2012 2013 2014 2015 2016 2017 2018 2019
entrepreneurial intent:
“Are you, alone or with
others, expecting to
start a new business,
including any type of
self-employment, within
the next three years?”
7.1 9.8 10.1 10.3 10.8 11.1 10.9 10.4 10.9 12.2
Source: GEM APS 2019.
From an international perspective, the Dutch entrepreneurial intentions are still
relatively low (see table 8). Notably, the average rate of entrepreneurial intent in high
income countries (24.4%) is twice as large as the rate in the Netherlands (12.2%).

21
table 8 Entrepreneurial intentions internationally compared (unweighted average of country scores), 2019,
percentage of adult population (18-64 years of age)
low-
income
countries
middle-
income
countries
high-income
countries OECD EU Netherlands
entrepreneurial intent 42.5 30.3 24.4 18.4 16.4 12.2
Source: Panteia/GEM APS 2019.
Perceptions of different subgroups
Of special interest is how the prevalence rate of intentional entrepreneurship differs
across various subgroups. The adult population can be decomposed into two groups,
based on whether a person is actually an entrepreneur or not (i.e. a nascent, new,
and/or established entrepreneur). Within the group of “non-entrepreneurs”, a further
distinction is possible between potential entrepreneurs and non-potential
entrepreneurs7. A non-entrepreneur is considered a potential entrepreneur if this
individual is not involved in any entrepreneurial activity yet, but
perceives good opportunities for starting a new business in their area8,
believes he or she has the capabilities to start a business9,
and is not afraid of business failure10.
The decomposition of entrepreneurial intent among the entire adult population and the
three categories of non-potential entrepreneurs, potential entrepreneurs and actual
entrepreneurs is provided in table 9. Not surprisingly, the potential entrepreneurs have
entrepreneurial intentions considerably more often than the non-potential
entrepreneurs. The levels of entrepreneurial intent for the non-potential entrepreneurs,
potential entrepreneurs, and actual entrepreneurs are slightly higher than the levels
observed in 2018. A further observation is that more than one in five actual
entrepreneurs intends to start a business within the next three years. This may hint at
so-called portfolio entrepreneurs, who run several businesses simultaneously, or serial
entrepreneurs, who have a clear exit strategy in mind for their current business and
intend to set up a subsequent business.
7 In the National Report for 2018, this group was labelled “true non-entrepreneurs”. This is however a
misleading label, since this group includes non-entrepreneurs that have the intention to start a business within
the next three years. We therefore use the more neutral label “non-potential entrepreneurs”, which was also
used in the National Reports before 2018. 8 The respondent (strongly) agrees with the statement “In the next six months, there will be good opportunities
for starting a business in the area where I live”. 9 The respondents (strongly) agrees with the statement “I have the knowledge, skill and experience required to
start a new business”. 10 The respondent (somewhat or strongly) disagrees with the statement “Fear of failure prevents me from starting a business”, or neither agrees nor disagrees.

22
table 9 Entrepreneurial intentions of non-potential entrepreneurs, potential entrepreneurs and actual
entrepreneurs in the Netherlands, 2019, percentage of adult population (18-64 years of age)
adult
population
non-potential
entrepreneurs
potential
entrepreneurs
actual
entrepreneurs
entrepreneurial intent 12.2 8.0 19.8 23.8
Note: the group of potential entrepreneurs excludes individuals who are also involved in TEA or established
entrepreneurship.
Source: Panteia/GEM APS 2019.
2.4 Comparing potential and intentional entrepreneurs
In this section, we take a further look at individuals with entrepreneurial potential and
entrepreneurial intentions. What is the overlap between these groups of individuals?
And how do the gender, age and education distributions differ between these two groups
of individuals? Such analyses provide information as to which individuals are more likely
to have entrepreneurial potential or intentions.
More than four out of every five non-entrepreneurs have neither the potential nor the
intention to start a new business in the foreseeable future (table 10). Most of the
remaining non-entrepreneurs either have the potential to start a new business or have
the intention to start a new business, but only a small part combines both. In other
words: the majority of the potential entrepreneurs have no intention to start a new
business in the next three years, and the majority of the “pure” intentional
entrepreneurs are not credited with the potential to become an entrepreneur (“pure”
intentional entrepreneurs exclude nascent, new, and established entrepreneurs). This
finding is slightly worrisome. Ideally, potential and intentional entrepreneurs overlap so
that those individuals intending to start a business are also the ones with the (self -
perceived) potential to make such a new business a success. Table 10 suggests that
79% (7.3/9.2) of individuals intending to start a new business in the next three years
do not meet at least one of the three conditions to qualify as a potential entrepreneur,
which raises questions about how realistic their intentions are. On the other hand,
among those who qualify as potential entrepreneurs, only 19% (1.9/9.8) have the
intention to act on their (self-perceived) potential by actually starting up a business.
table 10 The share of potential and intentional individuals within the group of non-entrepreneurs in the
Netherlands, 2019, percentage of non-entrepreneurs (18-64 years of age)
“pure” intentional entrepreneur
potential entrepreneur Yes no total
yes 1.9 7.8 9.8
no 7.3 83.0 90.2
total 9.2 90.8 100
Note: the groups of potential and “pure” intentional entrepreneurs exclude individuals who are also involved in
TEA or established entrepreneurship.
Source: Panteia/GEM APS 2019.
Next, table 11 presents a gender, age and education decomposition for the non-potential
entrepreneurs, the potential entrepreneurs, and the “pure” intentional entrepreneurs. A
different approach to investigating the prevalence of entrepreneurial intentions across
the demographic subgroups is illustrated in figure 3. The figure shows the percentage

23
of individuals intending to start a business within the next three years for each
subgroup. Specific attention is devoted to “pure intentions”.
Compared to last year, the share of female potential entrepreneurs has decreased (from
39% in 2018 to 37% in 2019) while the share of female “pure” intentional entrepreneurs
has slightly increased (from 48% in 2018 to 49% in 2019). As can be seen in table 11,
the potential entrepreneurship indicator still indicates that males are more likely to
consider themselves as potential entrepreneurs (63% versus 37%). This difference is
greater than last year (61% versus 39% in 2018), though the “pure” intentional
entrepreneurs indicator suggests that this gender difference disappears when actual
intentions to start a business are considered.
table 11 Demographic structure of non-potential entrepreneurs, potential entrepreneurs and “pure” intentional
entrepreneurs in the Netherlands, 2019
Note: Potential entrepreneurs are defined as those individuals who are not involved in any entrepreneurial
activity yet but report to observe business opportunities, to possess entrepreneurial skills and not to be
afraid of business failure. The group of “pure” intentional entrepreneurs are defined as those individuals
who are not involved in any entrepreneurial activity yet but report to expect to start a business in the
next three years.
Source: Panteia/GEM APS 2019.
The prevalence of entrepreneurial intentions tends to decrease with age group, as can
be seen in figure 3. This decline with age group is consistent over the years. This gap
in entrepreneurial intent amongst age groups has continued to widen. Compared to
2018, the share of 45-54 years and 55-64 years for both entrepreneurial and “pure”
entrepreneurial intent has declined while the share of 18-24 years, 25-34 years, and
35-44 years have increased.
Furthermore, when comparing the “potential entrepreneurs” with the “pure intentional
entrepreneurs”, table 11 demonstrates that the two youngest age groups make up a
larger proportion of the “pure" intentional entrepreneurs compared to the potential
entrepreneurs (31% versus 14% and 34% versus 25%, respectively). This may point to
some degree of overconfidence among young individuals as a part of them indicates
expecting to start a business within three years whereas they do not have the
characteristics that would qualify them as a potential entrepreneur. For the two oldest
non-potential
entrepreneurs
potential
entrepreneurs
“pure” intentional
entrepreneurs
gender
male 46% 63% 51%
female 54% 37% 49%
age
18-24 years 15% 14% 31%
25-34 years 19% 25% 34%
35-44 years 20% 21% 18%
45-54 years 24% 24% 12%
55-64 years 23% 17% 5%
educati
on
no degree (incl. some secondary) 24% 19% 20%
secondary degree (middelbare school) 45% 39% 42%
post-secondary degree (HBO) 20% 24% 26%
graduate degree (universiteit) 11% 17% 12%

24
age groups, the data shows a reversed pattern, suggesting that entrepreneurial
potential in these age groups might remain unexploited.
Regarding educational levels, figure 3 demonstrates that entrepreneurial intentions are
highest for the post-secondary and graduate level. Notably, the share of entrepreneurial
and “pure” entrepreneurial intent for the graduate level has decreased from 2018 to
2019 (for entrepreneurial intent, 19.1% to 14.8%; for “pure” entrepreneurial intent,
9.4% to 7.6%). Whereas, for the other education levels, the share of entrepreneurial
and “pure” entrepreneurial intent has increased.
Figure 3 Entrepreneurial intentions in the Netherlands, 2019, percentage of a given subgroup
Note: the group of individuals with “pure” entrepreneurial intentions excludes individuals who are also involved
in TEA or established entrepreneurship.
Source: Panteia/GEM APS 2019.

25
3 Entrepreneurial activity
The present chapter focuses mainly on total early-stage entrepreneurial activity (TEA).
TEA consists of individuals who are taking steps to start a business (nascent
entrepreneurs) and owner-managers of businesses less than 3.5 years in existence (new
entrepreneurs). This chapter hones in on the prevalence rate of TEA, and on the
demographic composition of these early-stage entrepreneurs. In addition, the
characteristics of early-stage entrepreneurs are further unravelled by focusing on their
aspirations along a number of dimensions.
Beyond the discussion of this measure of entrepreneurial activity, this chapter devotes
some attention to established entrepreneurs, i.e. individuals who have been owner-
managers of a business for more than 3.5 years. Again, the demographic composition
of this group of entrepreneurs is examined. The present chapter also deals with
entrepreneurial employee activity (EEA) and entrepreneurial exit.
Finally, this chapter discusses the results of the Dutch National Expert Survey that
contains experts’ assessments regarding the conditions that support or hamper
entrepreneurial activity in the Netherlands.
3.1 Total early-stage entrepreneurial activity (TEA)
Total early-stage entrepreneurial activity captures nascent entrepreneurs and new
entrepreneurs. Nascent entrepreneurs are those adults between 18 and 64 years of age
who are trying to start a new business, which they will partially or fully own. The
individuals should be actively involved in this start-up activity. For example, they could
have developed a specific business plan, they could be searching for a location from
where the future business will be active, and/or they could be involved in the
organisation of a start-up team.
New entrepreneurs are individuals between 18 and 64 years of age who currently own
and manage a business and have been doing so for less than 3.5 years. It is important
to note here that an individual could be an owner-manager of a new business and
simultaneously be involved in start-up activities for the launch of a new business. Such
an individual will be counted as one active person in the calculation of the TEA rates.
Table 12 shows that the increase of the TEA rate from 9.9% in 2017 to 12.3% in 2018
has been followed by a drop to 10.4% in 2019. Table 12 also shows that the decrease
in TEA is due to a decrease in both the nascent entrepreneurship rate (which decreased
from 6.0% in 2018 to 5.6% in 2019) and the new entrepreneurship rate (which
decreased from 6.5% in 2018 to 4.8% in 2019). Hence, the drop in new
entrepreneurship is clearly bigger, with this rate decreasing by about a quarter. This
drop partly reflects error-correction as the new entrepreneurship rate was relatively
high in 2018, both from a historical perspective (see table 12) and in comparison with
peer countries. Indeed, for the last four years, the new entrepreneurship rate in the
Netherlands has been above the average of similar countries ( i.e., high-income, OECD
and EU countries) (as is shown in table 13).

26
table 12 Total early-stage entrepreneurial activity (TEA) in the Netherlands, 2010-2019, percentage of adult
population (18-64 years of age)
item 2010 2011 2012 2013 2014 2015 2016 2017 2018 2019
TEA:
aggregate of nascent and
new entrepreneurship
7.2 8.2 10.3 9.3 9.5 7.2 11.0 9.9 12.3 10.4
nascent
entrepreneurship:
“Are you, alone or with
others, currently trying
to start a new business?”
4.0 4.3 4.1 4.7 5.2 4.3 5.7 4.7 6.0 5.6
new entrepreneurship:
“Are you, alone or with
others, currently the
owner of a business you
help manage?”*
3.4 4.1 6.3 4.8 4.5 3.0 5.4 5.4 6.5 4.8
* Wages, profits, or payments in kind from this business should have been received after January 1, 2019.
Furthermore, respondents partially or fully own this new business.
Source: Panteia/GEM APS 2019.
table 13 TEA rates internationally compared (unweighted average of country scores), 2019, percentage of
adult population (18-64 years of age)
low-
income
countries
middle-
income
countries
high-income
countries OECD EU Netherlands
TEA 11.2 14.9 12.3 11.5 9.6 10.4
nascent entrepreneurship 6.2 8.7 7.8 7.3 6.0 5.6
new entrepreneurship 5.2 6.6 4.7 4.4 3.7 4.8
Source: Panteia/GEM APS 2019.
The Dutch TEA ranked nineteenth out of 33 high income countries in 2019 (see figure
4). This is a significant drop from last year, with the Netherlands taking eighth place
out of 31 high-income countries in 2018.

27
figure 4 Total early-stage entrepreneurial activity (TEA) in high-income countries, 2019, percentage of adult
population (18-64 years of age)
Note: UAE is United Arab Emirates.
Source: Panteia/GEM APS 2019.
Demographics
Table 14 shows a decomposition across gender, age and education for three subgroups
of individuals (non-potential entrepreneurs, potential entrepreneurs, and “pure”
intentional entrepreneurs). The table replicates table 11, and adds the decomposition
across gender, age and education for the early-stage entrepreneurs.
By comparing the demographic structures of the “pure” intentional entrepreneurs and
the early-stage entrepreneurs, one can get a glimpse of potential demographic
developments of entrepreneurial activity. For instance, while only 44% of early-stage
entrepreneurs are female, 49% of “pure” intentional entrepreneurs are female. This
may indicate that in the next few years the share of female early-stage entrepreneurs
may increase. Additionally, 31% of “pure” intentional entrepreneurs are between the
ages of 18 and 24, while only 19% of early-stage entrepreneurs are within this age
group. A possible explanation for this pattern is that it takes a few years before “pure”
entrepreneurial intentions result in concrete activities to try to start a new business.

28
table 14 Demographic structure of non-potential entrepreneurs, potential, “pure” intentional, and early-stage
entrepreneurs in the Netherlands, 2019
non-potential
entrepreneurs
potential
entrepreneurs
“pure”
intentional
entrepreneurs
early-stage
entrepreneurs
gender
male 46% 63% 51% 56%
female 54% 37% 49% 44%
age
18-24 years 15% 14% 31% 19%
25-34 years 19% 25% 34% 30%
35-44 years 20% 21% 18% 22%
45-54 years 24% 24% 12% 16%
55-64 years 23% 17% 5% 12%
educati
on
none (incl. some
secondary)
24% 19% 20% 20%
secondary degree
(middelbare school)
45% 39% 42% 43%
post-secondary (HBO) 20% 24% 26% 25%
graduate degree
(universiteit)
11% 17% 12% 12%
Note: Potential entrepreneurs are defined as those individuals who are not involved in any entrepreneurial
activity yet but report to observe business opportunities, to possess entrepreneurial skills and not
to be afraid of business failure. The group of “pure” intentional entrepreneurs are defined as those
individuals who are not involved in any entrepreneurial activity yet but report to expect to start a
business in the next three years.
Source: Panteia/GEM APS 2019.
Another way to investigate the prevalence rates of early-stage entrepreneurship across
the demographic subgroups is presented in figure 5. Overall, TEA rates differ slightly
between the Netherlands and the high-income countries as displayed in table 13, i.e.
12.3% versus 10.4%. For each demographic subgroup, figure 5 shows the TEA rate,
both for the Netherlands and for the high-income countries (unweighted averages of
country scores are used).
In the past four years, the gap in TEA rates between men and women shows a rather
erratic pattern. In 2016, the male TEA rate was 4.7 percentage points higher than the
female TEA rate. In 2017, the difference between the male and female TEA rate reduced
to only 1.1 percentage points. In 2018, this difference increased to 7.9 percentage
points, as the male TEA rate increased to 16.2% while the female TEA rate decreased
to 8.3%. In 2019, these changes were largely compensated: the male TEA rate
decreased to 11.5% and the female TEA rate increased to 9.2, resulting in a difference
between the male and female TEA rate of 2.3 percentage points.

29
figure 5 Total early-stage entrepreneurial activity (TEA) in the Netherlands and high-income countries, 2019,
percentage of a given subgroup
Source: Panteia/GEM APS 2019.
Figure 5 also shows that regarding TEA rates by age group, the general pattern for high-
income countries is that the TEA rate is highest among individuals aged 25-34 years,
followed by individuals aged 35-44 years and 18-24 years. The TEA rates are lowest for
the oldest age groups. For the Netherlands, the pattern in 2019 is quite similar, as can
also be seen in figure 6. During the past five years, the TEA rate in the Netherlands was
the highest for either individuals aged 18-24 years or 25-34 years. The lowest TEA rates
tend to occur among individuals aged 45-54 years and 55-64 years.
Furthermore, figure 5 shows that TEA rates increase with educational level. This
relationship between educational level and TEA rate is weaker for the Netherlands than
for high-income countries in 2019. The TEA rate for individuals with graduate level in
high-income countries is 6.2 percentage points higher than for individuals with less than
secondary level; for the Netherlands, this difference is only 2 percentage points.

30
figure 6 Total early-stage entrepreneurial activity (TEA) in the Netherlands, 2015-2019, percentage of a
given age category
Source: Panteia/GEM APS 2019.
Motivations
Previously, the GEM asked individuals in the Adult Population Survey whether they were
driven by opportunity or necessity to start a business. It was recognised that this
division did not fully reflect the scope of entrepreneurial motivations. Thus, after a
review, in 2019, respondents who were actively engaged in starting or running a
business were asked to consider the following statements as motives for starting a
business:
To make a difference in the world.
To build great wealth or very high income.
To continue a family tradition.
To earn a living because jobs are scarce.
The two most prevalent motives (striving for autonomy and independence) are not
included in this. While these are important motives to consider, they are considered
‘universal’ and shared amongst nearly all early-stage entrepreneurs (Bosma et al.,
2020, p. 44). Consequently, the answers to these motives hardly vary between different
groups of entrepreneurs, and collecting this information would not provide significant
insights. Therefore, while noteworthy, these motivations are excluded from the Adult
Population Survey.
Table 15 compares early-stage entrepreneurs from the Netherlands with early-stage
entrepreneurs from other economies regarding these four motives. The most cited
motivation to get involved in entrepreneurial activities in the Netherlands was to make
a difference in the world (32%). The second most popular motivation was to earn a
living because jobs are scarce (24%). Compared to EU, OECD, and high-income
countries, early-stage entrepreneurs from the Netherlands mention each of the four
motivations less often. In contrast, 36% of the early-stage entrepreneurs from the
Netherlands did not report any of the four statements as a motivation to starting a
business. Perhaps for these early-stage entrepreneurs, autonomy and independence
provided enough motivation to start their enterprise, as argued by Van Gelderen and
Jansen (2006). Such autonomy motivation may extend towards striving for self-

31
actualisation (Maslow, 1970) through achieving self-expression and creativity in work.
As such self-expression in work may best be realised by operating as a solo self-
employed in the Knowledge-Intensive Services (KIS) sectors (Van Stel et al., 2020),
the advanced level of development of this part of the economy in the Netherlands may
be part of the explanation (see also the high share of business services in table 17).
Admittedly though, we are not able to provide a full explanation of the deviating
percentages for the Netherlands in table 15.
table 15 Motivation for the decision to be entrepreneurially active (TEA) internationally compared
(unweighted average of country scores), 2019, percentage of adult population (18-64 years of age)
involved in TEA
Motivation
low-income
countries
middle-income
countries
high-income
countries OECD EU Netherlands
“to make a difference in
the world” 56 47 46 44 42 32
“to build great wealth or
a very high income” 61 59 52 48 46 22
“to continue a family
tradition” 58 37 32 31 35 18
“to earn a living
because jobs are
scarce”
65 81 54 50 52 24
Note: Respondents can indicate on a five-point Likert scale to which extent these motivations apply to them.
The percentages reported in this table are determined by the share of respondents that replies ‘agree’ or
‘strongly agree’ to these motivations.
Source: Panteia/GEM APS 2019.
Sponsored entrepreneurship
While entrepreneurship is primarily known for its independent nature, most
entrepreneurial activities are conducted for and in collaboration with others. The GEM
already captures some of these joint entrepreneurial activities by measuring the rate of
entrepreneurial employee activities (EEA), which is further examined in section 3.4. In
the case of EEA, no new enterprise is being created. Another possibility is that an
employee starts a new enterprise11, and that the current employer becomes part owner
of this new enterprise (the initiative for this new enterprise may be taken by the
employee, the employer, or both). Rather than becoming a fully independent
entrepreneur, the employee remains in employment, and manages the new enterprise
in addition to his or her job as employee. In the 2019/20 Global Report, this type of
entrepreneurship is labelled ‘sponsored entrepreneurship’, since the new business is
sponsored (through shared ownership) by the employer (Bosma et al., 2020, page 42).
To measure the extent to which this kind of ‘sponsored entrepreneurship’ occurs, the
2019 Adult Population Survey introduced a new question, asking whether respondents
currently own a business (solely or with others) which they help manage for their
employer as part of their main employment. Using this new question, in combination
with existing questions, it is possible to identify whether entrepreneurs are independent
or sponsored by a large business. One objective of this addition to the GEM APS is to
allow “the levels of entrepreneurship to be balanced against levels of intrapreneurship
in a more informed way” (Bosma et al., 2020).
11 This includes becoming part owner of the new enterprise.

32
Table 16 compares the distribution of early-stage entrepreneurship among independent
TEA and sponsored TEA from the Netherlands with other economies in 2019. The
majority of Dutch early-stage entrepreneurs pursued entrepreneurship independently
(87%; 9% of the adult population), and only 13% of Dutch early-stage entrepreneurs
were sponsored (1.4% of the adult population). In comparable high-income countries
and EU counterparts, the sponsored TEA rate is higher while the independent TEA rate
is lower. For the average EU country, around 68% of TEA is independent (6.5% of adult
population); for the average high-income country, around 64% of TEA is independent.
table 16 Sponsored and independent early-stage entrepreneurship, 2019, internationally compared
(unweighted average of country scores), 2019, percentage of adult population (18-64 years of age).
low-income
countries
middle-
income
countries
high-income
countries OECD EU Netherlands
independent TEA:
“early-stage
entrepreneurship with
independent business”
5.1 10.7 7.7 7.4 6.5 9.0
sponsored TEA: “early-
stage entrepreneur with
sponsored business
(part-owned with
employer)”
6.2 4.3 4.6 4.1 3.0 1.4
Source: Panteia/GEM APS 2019.
Figure 7 shows a decomposition across gender, age and education for sponsored and
independent early-stage entrepreneurship. Notably, three out of four sponsored early-
stage entrepreneurs are male. While, the composition of independent early-stage
entrepreneurs is more evenly split (53% are male; 47% are female). There is not an
evident relationship between age and TEA autonomy. Half of sponsored entrepreneurs
have a post-secondary or graduate degree while only 35% of independent entrepreneurs
have one of these higher degrees.

33
figure 7 Demographic structure of independent and sponsored early-stage entrepreneurs in the Netherlands,
2019
Source: Panteia/GEM APS 2019.
Sectors of Industry
Table 17 compares the Netherlands with other economies regarding the sector
distribution of early-stage entrepreneurship. A distinction is made between four sectors:
extractive sectors (e.g., agriculture, forestry, fishing, mining); transformative sectors
(e.g., construction, manufacturing, transportation); business services (e.g., finance,
insurance, real estate); and consumer services (e.g., health, retail, restaurants). We
find that the share of early-stage entrepreneurs in the business services sector is higher
than that of peer economies. In contrast, the shares of early-stage entrepreneurs in the
other three sectors (extractive, transformative and consumer services) are slightly
lower than the shares found in peer economies.
When comparing the sector distributions, in 2018, there was an apparent shift from
business services to transformative sector. In 2019, this trend seems to have reversed,
where there is a possible shift from the transformative sector (from 22% to 20%) to
business services (from 30% to 34%).

34
table 17 Sector distribution of early-stage entrepreneurs, internationally compared (unweighted average of
country scores), 2019, percentage of adult population (18-64 years of age) involved in TEA
low-
income
countries
middle-
income
countries
high-income
countries OECD EU Netherlands
extractive sectors 10 7 4 5 5 4
transformative sectors 29 25 21 20 21 20
business services 3 10 25 27 28 34
consumer services 58 58 50 48 45 43
Source: Panteia/GEM APS 2019.
3.2 Aspirations of early-stage entrepreneurs
The previous sections focused on the rate of early-stage entrepreneurship without
taking into account the entrepreneur’s aspirations. These aspirations, however, are
important because they contain information about the quality of a business (Hermans
et al., 2015) and the potential influence a business will have. We focus on three
dimensions of aspirations: the expected growth of the business in the next five years,
the expected export intensity and the scope of potential impact (i.e. local, national,
global).
Job growth expectat ions
GEM asks early-stage entrepreneurs about the expected growth in the number of
employees in the next five years. As shown in table 18, in the Netherlands 7.3% of the
adult population, or 70% of early-stage entrepreneurs12, expects to create at least one
job in the next five years. While this is (still) below the average of high-income
countries, it is a remarkable increase compared to 2018, when less than half of early-
stage entrepreneurs had this ambition. This suggests that the decrease in the TEA rate
from 2018 to 2019 is mainly due to a decrease in early-stage self-employed individuals.
table 18 Job growth expectations of early-stage entrepreneurs for the next five years, internationally compared (unweighted average of country scores), 2019, percentage of adult population (18-64
years of age)
low-income
countries
middle-income
countries
high-income
countries OECD EU Netherlands
any jobs 8.2 12.0 9.9 8.8 7.2 7.3
more than 19 jobs 0.7 1.5 1.9 1.4 1.1 1.2
Source: Panteia/GEM APS 2019.
The rate of ambitious entrepreneurs in terms of job growth expectations is comparable
to the average EU-level (7.3% and 7.2%, respectively). However, because the TEA rate
of the Netherlands is higher than that of the EU (10.4% versus 9.6%), the percentage
of early-stage entrepreneurs that expect to create at least one job in the next five years,
is below the average of EU-countries (70% versus 75%).
After the decrease in the percentage of the adult population expecting to create more
than 19 jobs, from 0.9% in 2015 to 0.4% in 2016, it increased to 0.7% in 2017, then
0.8% in 2018, and then to 1.2% in 2019. This is encouraging as high-growth-
12 As the percentage of early-stage entrepreneurs is 10.4% (TEA rate), see table 12.
35
expectation entrepreneurs are considered important for realising high rates of economic
growth (Hermans et al., 2015).
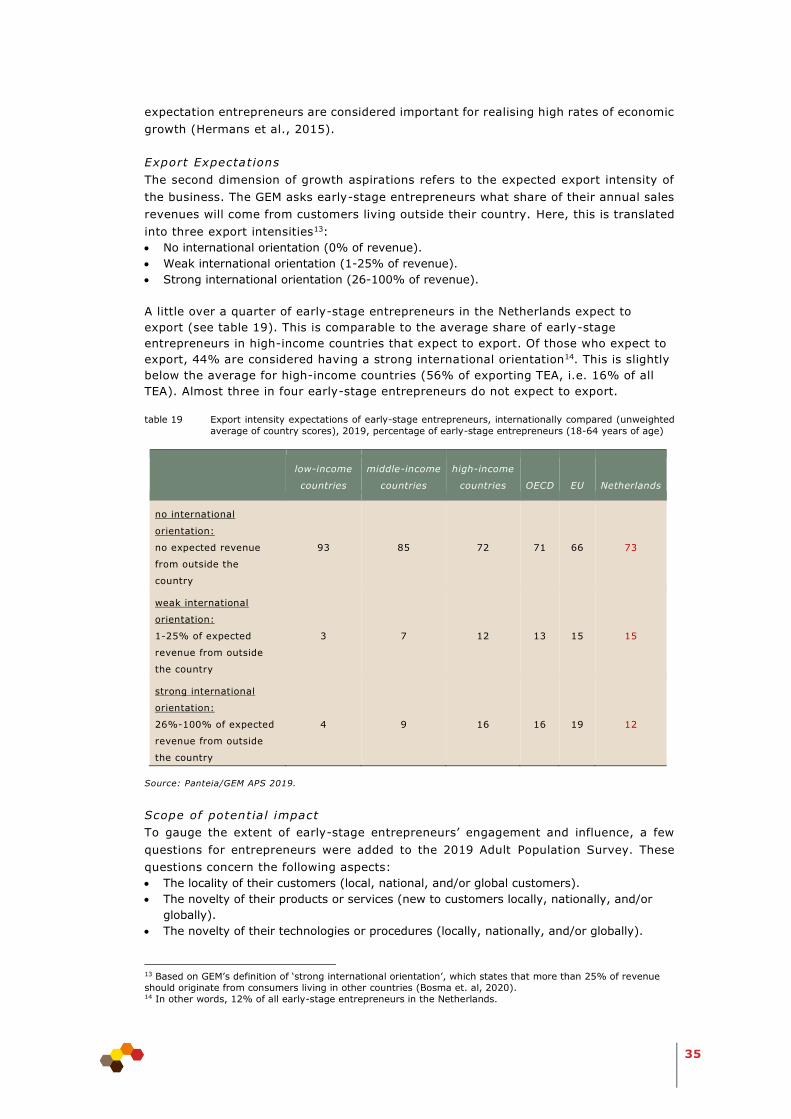
Export Expectat ions
The second dimension of growth aspirations refers to the expected export intensity of
the business. The GEM asks early-stage entrepreneurs what share of their annual sales
revenues will come from customers living outside their country. Here, this is translated
into three export intensities13:
No international orientation (0% of revenue).
Weak international orientation (1-25% of revenue).
Strong international orientation (26-100% of revenue).
A little over a quarter of early-stage entrepreneurs in the Netherlands expect to
export (see table 19). This is comparable to the average share of early-stage
entrepreneurs in high-income countries that expect to export. Of those who expect to
export, 44% are considered having a strong international orientation14. This is slightly
below the average for high-income countries (56% of exporting TEA, i.e. 16% of all
TEA). Almost three in four early-stage entrepreneurs do not expect to export.
table 19 Export intensity expectations of early-stage entrepreneurs, internationally compared (unweighted
average of country scores), 2019, percentage of early-stage entrepreneurs (18-64 years of age)
low-income
countries
middle-income
countries
high-income
countries OECD EU Netherlands
no international
orientation:
no expected revenue
from outside the
country
93 85 72 71 66 73
weak international
orientation:
1-25% of expected
revenue from outside
the country
3 7 12 13 15 15
strong international
orientation:
26%-100% of expected
revenue from outside
the country
4 9 16 16 19 12
Source: Panteia/GEM APS 2019.
Scope of potentia l impact
To gauge the extent of early-stage entrepreneurs’ engagement and influence, a few
questions for entrepreneurs were added to the 2019 Adult Population Survey. These
questions concern the following aspects:
The locality of their customers (local, national, and/or global customers).
The novelty of their products or services (new to customers locally, nationally, and/or
globally).
The novelty of their technologies or procedures (locally, nationally, and/or globally).
13 Based on GEM’s definition of ‘strong international orientation’, which states that more than 25% of revenue
should originate from consumers living in other countries (Bosma et. al, 2020). 14 In other words, 12% of all early-stage entrepreneurs in the Netherlands.

36
The responses from early-stage entrepreneurs were combined to create two new
indicators: whether the potential impact of the entrepreneur is national, and whether
it is global. An entrepreneur’s potential impact is considered national if their customer
base is at least national and their new products or processes are novel at least at the
national level. An entrepreneur’s potential impact is considered international if their
customer base is international and their new products or processes are novel at a
global level.
Table 20 provides the location of customers of early-stage entrepreneurs as a
percentage of the Dutch adult population15. The majority of Dutch early-stage
entrepreneurs have customers outside of the local area, within the Netherlands (70%;
7.3% of adult population). 23% of early-stage entrepreneurs only have local
customers (2.4% of adult population). Approximately 35% of early-stage
entrepreneurs have at least one customer outside of the Netherlands (3.6% of adult
population).
table 20 Customer location of early-stage entrepreneurs in the Netherlands, 2019, percentage of adult
population (18-64 years of age)
Customer location
Local only: “do you have customers in the area where you live?” 2.4
National: “do you have customers elsewhere in your country? 7.3
Global: “do you have any customers outside your country?” 3.6
Note: ‘Local only’ does not include entrepreneurs who have local customers as well as national and/or global
customers. In total, 8.8% of the adult population in 2019 had customers in the area where they live .
Source: Panteia/GEM APS 2019.
Table 21 provides the geographical scope of innovation of Dutch early-stage
entrepreneurs. Around two/thirds of all early-stage entrepreneurs (69%) have not
provided any new products, services, technologies or procedures. The share of
entrepreneurs reporting product and/or service innovation is very similar to the share
of entrepreneurs reporting process and/or technology innovation. The geographical
scope is also comparable for both types of innovation. Overall, 11.5% of early-stage
entrepreneurs report having a product/service or process/technology that is novel at
the national level (1.2% of adult population), and 6% of Dutch early-stage
entrepreneurs report having an innovation that is new to the world (0.6% of adult
population).
15 The % of adult population is used as main indicator for the scope of the potential impact, because this
combines two different factors: the share of early-stage entrepreneurs with (for example) global customers, and
the share of the adult population involved in early-stage entrepreneurship. Both factors affect the extent of the potential impact of early-stage entrepreneurs.

37
table 21 Geographic scope of innovation of early-stage entrepreneurs in the Netherlands, for different types
of innovation, 2019, percentage of adult population (18-64 years of age)
product or service process or technology
product/service or
process/technology
New to the area: “new to
people in the area where I
live”
1.2 1.1 1.7
New to the Netherlands: “new
to people in your country” 0.9 0.7 1.2
New to the world: “new to
the world” 0.4 0.4 0.6
Source: Panteia/GEM APS 2019.
Table 22 compares the Netherlands with other economies regarding the scope of
potential impact, in terms of customers and innovation. Overall, the levels of potential
impact at a national or global level tend to be low across all economies. This indicates
that many early-stage entrepreneurs do not meet the minimum requirements for
potential impact. In the case of the Netherlands, for example, around two/thirds of all
early-stage entrepreneurs (69%) have not provided any new products, services,
technologies or procedures and therefore do not meet the minimum requirements for
potential impact. Furthermore, the larger the country (in terms of territory and/or
inhabitants), the more difficult it may be for (early-stage) entrepreneurs to have a
potential national impact.
The share of early-stage entrepreneurs in the Netherlands with a potential national
impact is lower than the average share found in other high-income countries (1.7% and
2.2% of the adult population, respectively). On a global scale, early-stage entrepreneurs
in the Netherlands tend to be only slightly less potentially impactful than their high-
income country counterparts (0.5% and 0.6% of the adult population, respectively).
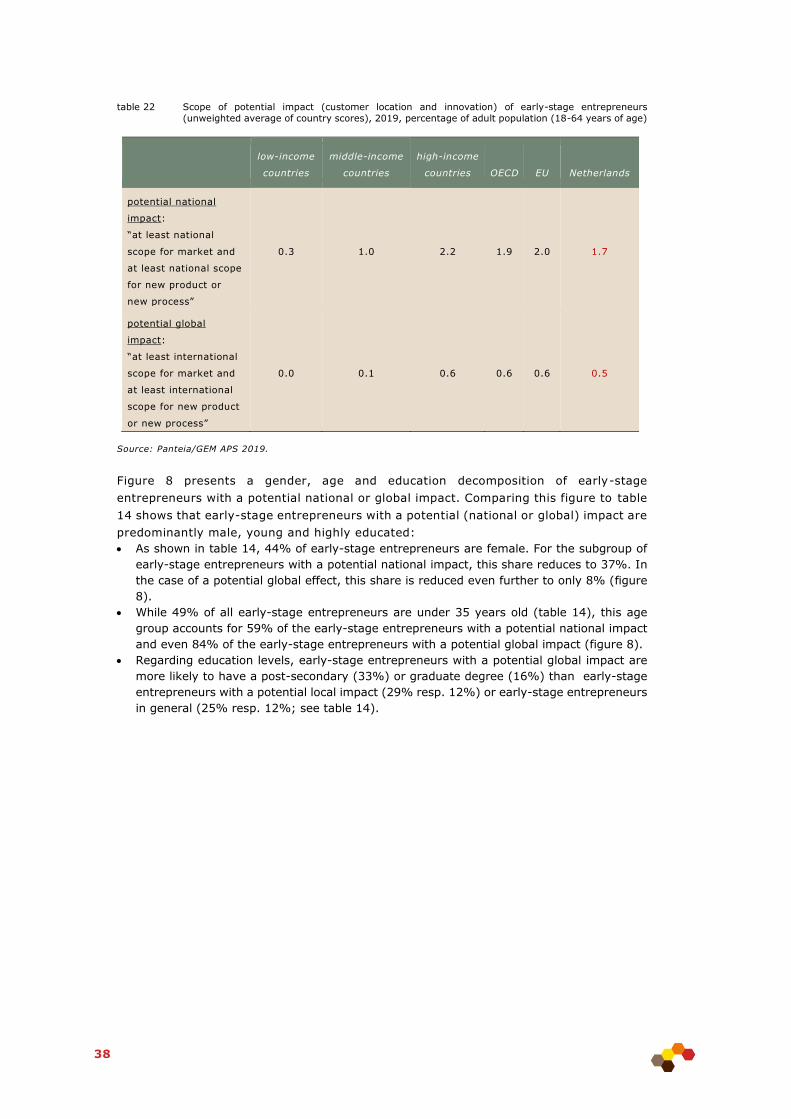
38
table 22 Scope of potential impact (customer location and innovation) of early-stage entrepreneurs
(unweighted average of country scores), 2019, percentage of adult population (18-64 years of age)
low-income
countries
middle-income
countries
high-income
countries OECD EU Netherlands
potential national
impact:
“at least national
scope for market and
at least national scope
for new product or
new process”
0.3 1.0 2.2 1.9 2.0 1.7
potential global
impact:
“at least international
scope for market and
at least international
scope for new product
or new process”
0.0 0.1 0.6 0.6 0.6 0.5
Source: Panteia/GEM APS 2019.
Figure 8 presents a gender, age and education decomposition of early-stage
entrepreneurs with a potential national or global impact. Comparing this figure to table
14 shows that early-stage entrepreneurs with a potential (national or global) impact are
predominantly male, young and highly educated:
As shown in table 14, 44% of early-stage entrepreneurs are female. For the subgroup of
early-stage entrepreneurs with a potential national impact, this share reduces to 37%. In
the case of a potential global effect, this share is reduced even further to only 8% (figure
8).
While 49% of all early-stage entrepreneurs are under 35 years old (table 14), this age
group accounts for 59% of the early-stage entrepreneurs with a potential national impact
and even 84% of the early-stage entrepreneurs with a potential global impact (figure 8).
Regarding education levels, early-stage entrepreneurs with a potential global impact are
more likely to have a post-secondary (33%) or graduate degree (16%) than early-stage
entrepreneurs with a potential local impact (29% resp. 12%) or early-stage entrepreneurs
in general (25% resp. 12%; see table 14).

39
figure 8 Demographic structure of early-stage entrepreneurs with a potential national or global impact in
the Netherlands, 2019
Note: potential national impact is defined as “at least national scope for market and at least nati onal scope for
new product or new process’; potential global impact is defined as “at least international scope for market
and at least international scope for new product or new process”.
Source: Panteia/GEM APS 2019.
3.3 Established entrepreneurship
This section reports on established entrepreneurship, namely: owner-managers of
businesses that have been in existence for at least 3.5 years. It follows from table 23
that the rate of established entrepreneurship is fluctuating somewhat in the last few
years. Since 2011, it has swung back and forth from 8.7% to 10.2% in 2016 and back
to 8.6% in 2017. In 2018, established entrepreneurship increased to its highest level
since 2008 with 12%. Over the last year, established entrepreneurship has slightly
declined to 10.8%.
table 23 Established entrepreneurship in the Netherlands, 2010-2019, percentage of adult population (18-
64 years of age)
Item 2010 2011 2012 2013 2014 2015 2016 2017 2018 2019
established
entrepreneurship:
“Are you, alone or with
others, currently the
owner of a business you
help manage?”
9.0 8.7 9.5 8.7 9.6 9.9 10.2 8.6 12.0 10.8
Source: Panteia/GEM APS 2019.
The Netherlands scores above average when compared to peer economies (table 24) in
terms of established entrepreneurship.

40
table 24 Established entrepreneurship internationally compared (unweighted average of country scores),
2019, percentage of adult population (18-64 years of age)
low-
income
countries
middle-
income
countries
high-
income
countries OECD EU Netherlands
established entrepreneurship 9.2 8.4 7.5 8.2 8.1 10.8
Source: Panteia/GEM APS 2019.
The results presented in figure 9 on the demographic distribution of established
entrepreneurs show that, relative to high-income countries, the Netherlands has a
particularly high rate of established entrepreneurs among the age groups 25-34 and 45-
54, among the male adult population and among the less than secondary education level
and the graduate level population.
figure 9 Established entrepreneurship in the Netherlands and high-income countries, 2019, percentage of a
given subgroup
Source: Panteia/GEM APS 2019.
3.4 Entrepreneurial Employee Activity (EEA)
Since 2011, the GEM captures entrepreneurial employee activity (EEA). This is a
measure that accounts for the situation where an employee in the past three years was
actively involved in, and had a leading role in, either the idea development for a new
activity or the preparation and implementation of a new activity. In short, it refers to
intrapreneurship. It is accepted as a relevant type of entrepreneurship in the sense that
it aims at new venture creation and the introduction of new products and services. This
type of activity also shares a lot of behavioural characteristics with the overall concept
of entrepreneurship, such as taking initiative and being innovative (Liebregts, 2018).

41
Intrapreneurship is receiving more and more attention from policy makers. However,
within an organisation, employees are often not considered as intrapreneurs. Around
4.2% of the adult population are seen as intrapreneurs within high-income countries
and much less in low- and middle-income countries. An interesting observation is that
intrapreneurs have higher job growth expectations for their new business activity than
independent entrepreneurs do for their own new business, which shows that
intrapreneurship can be an important driver for firm growth (Bosma, Stam & Wennekers,
2011). The performances of firms are enhanced by the proactivity and innovation of the
intrapreneurs. This not only applies to big firms, but also to medium-sized and smaller
firms (Augusto Felício, Rodrigues & Caldeirinha, 2012).
Despite the increasing literature on intrapreneurship, empirical studies investigating the
link between intrapreneurship and firm performance are scarce (Blanka, 2019). The few
studies that have investigated this relationship tend to focus on innovative or creative
outcomes but not on objective firm performance measures involving key financial data
(Blanka 2019, p. 942). The link between intrapreneurship and innovation seems clearly
supported by the literature though, see for instance also Stam (2013).
Table 25 presents an international comparison of the EEA rate. It shows that the
Netherlands have a relatively high EEA rate at 6.0% (though below the rate from 2018:
7.9%). This value is substantially higher than the EEA rate averages in the EU and OECD
countries and shows that there were relatively many employees involved in
intrapreneurship in the Netherlands.
table 25 EEA rates internationally compared (unweighted average of country scores), 2019, percentage of
adult population (18-64 years of age)
low-
income
countries
middle-
income
countries
high-income
countries OECD EU Netherlands
EEA 0.4 0.8 4.2 4.4 4.8 6.0
Source: Panteia/GEM APS 2019.
Figure 10 shows the EEA rate in the high-income countries in ascending order. The EEA
rate varies between 0.4% for Panama and 8.3% for Australia. The average EEA rate for
high-income countries is 4.2% in 2019. The Netherlands ranks tenth out of 33 high-
income countries in 2019.

42
figure 10 Entrepreneurial employee activity (EEA) in the high-income countries, 2019, percentage of adult
population (18-64 years of age)
Source: GEM APS 2019. UAE is United Arab Emirates
Table 26 presents the distribution of demographical characteristics within the EEA
population, and compares these with the distribution of early-stage entrepreneurs
(taken from table 14). The results show clear differences between these two groups in
gender, age and educational characteristics. Regarding gender, males are
overrepresented in both groups, but entrepreneurial employees are less often female
(35%) than early-stage entrepreneurs (44%). Looking at age, entrepreneurial
employees tend to be older than early-stage entrepreneurs: 31% of entrepreneurial
employees is less than 35 years old, as compared to 49% of early-stage entrepreneurs.
Finally, entrepreneurial employees are more likely to have a higher educational level
than early-stage entrepreneurs.
A different perspective is offered by table 27, which presents EEA rates within a
demographic group for the total adult population. It follows that 8% of the male adult
population is an entrepreneurial employee versus 4% among the female adult
population. In addition, the first column shows that intrapreneurship is more likely
among employees with a post-secondary or graduate degree than among employees
with secondary degree or less.
The entrepreneurial intent (expectations to start a new business within the next three
years, see section 2.3) within the EEA population is relatively high. Among
entrepreneurial employees or intrapreneurs, 20.5% has entrepreneurial intent. This is
considerably larger than among the general adult population (12.2%, see table 9), and
close to that of potential entrepreneurs and actual entrepreneurs (19.8% resp. 23.8,
see table 9). This suggests that entrepreneurial employee activity may act as a
springboard to early-stage entrepreneurship.

43
table 26 Demographic structure of entrepreneurial employees and early-stage entrepreneurs in the
Netherlands, 2019
entrepreneurial
employees
early-stage
entrepreneurs gender
male 65% 56%
female 35% 44%
age
18-24 years 9% 19%
25-34 years 22% 30%
35-44 years 30% 22%
45-54 years 21% 16%
55-64 years 18% 12%
educati
on
none (incl. some secondary) 10% 20%
secondary degree (middelbare school) 35% 43%
post-secondary (HBO) 29% 25%
graduate degree (universiteit) 26% 12%
Source: Panteia/GEM APS 2019.
table 27 Demographic structure of EEA rates among the total adult population in the Netherlands, 2019
EEA rate among
adult population
gender
male 8%
female 4%
age
18-24 years 4%
25-34 years 6%
35-44 years 9%
45-54 years 5%
55-64 years 5%
e d u c a t i o n
28%
educati
on
none (incl. some secondary) 2%
secondary degree (middelbare school) 5%
post-secondary (HBO) 8%
graduate degree (universiteit) 13%
Source: Panteia/GEM APS 2019.

44
3.5 Entrepreneurial exit
The present section elaborates on the fraction of the adult population that has exited
entrepreneurship in the past twelve months. These individuals have also indicated
whether the relevant business continued or discontinued its activities after the individual
exited the business. This distinction refers to the idea that an entrepreneurial exit does
not necessarily equal an entrepreneurial failure (DeTienne, 2010) or even a firm exit
(Parastuty, 2018). In addition to continued or discontinued activities, respondents
reveal the most important reason behind exiting the entrepreneurship process.
Table 28 presents the development of entrepreneurial exit in the Netherlands over time.
A distinction is made between businesses that continued their activities after the
individuals exited the entrepreneurship process, and businesses that did not continue
their activities. In total, 2.6% of the Dutch adult population experienced an
entrepreneurial exit in 2019. This is almost the same as in 2018 (with an exit rate of
2.5%). In about three out of five entrepreneurial exits, the exit coincides with firm exit:
1.6% of the Dutch adults experienced an entrepreneurial exit with business closure in
2019.
table 28 Entrepreneurial exit in the Netherlands, 2010-2019, percentage of adult population (18-64 years of
age)
Item 2010 2011 2012 2013 2014 2015 2016 2017 2018 2019
exit with business
closure:
Sold, shut down,
discontinued, or quit a
business in the past 12
months; business did not
continue its activities
after exit
0.9 1.4 1.5 1.6 1.3 1.7 2.1 2.1 1.9 1.6
exit without business
closure:
Sold, shut down,
discontinued, or quit a
business in the past 12
months; business
continued its activities
after exit
0.5 0.5 0.7 0.5 0.4 0.4 0.6 1.0 0.6 1.0
Source: Panteia/GEM APS 2019.
Table 29 compares entrepreneurial exit rates from an international point of view.
Overall, the probability of exit tends to decrease with the stage of economic
development. The exit rates for the Netherlands are slightly lower than the average exit
rates for the EU and lower than the averages for the high-income economies. In 2019,
the share of entrepreneurial exits with business continuation in the Netherlands is
around 38%, which is close to the average for high-income economies (37%).

45
table 29 Entrepreneurial exit internationally compared (unweighted average of country scores), 2019,
percentage of adult population (18-64 years of age)
low-
income
countries
middle-
income
countries
high-income
countries OECD EU Netherlands
exit with business closure 3.7 4.2 2.9 2.4 2.0 1.6
exit without business closure 1.2 1.7 1.7 1.3 1.1 1.0
Source: Panteia/GEM APS 2019.
The share of entrepreneurial exits involving continuation of the business has increased
over time in the Netherlands (from 19% in 2015 to 38% in 2019). There are two possible
explanations for increases in the share of exits with business continuation. First, the
number of business transfers may have increased. However, given the low percentage
(13%) of entrepreneurial exits declaring ‘an opportunity to sell’ as their main exit reason
(see table 30), this explanations seems unlikely to be the main reason. The second
possibility is that many entrepreneurial exits involve team entrepreneurs, where the
remaining business owners continue the business.
table 30 Main exit reason internationally compared, 2019, percentage of exits
low-
income
countries
middle-
income
countries
high-
income
countries OECD EU Netherlands
an opportunity to sell 7 3 8 9 8 13
business was not profitable 40 35 27 26 24 23
problems getting finance 17 18 10 10 9 9
other job/business
opportunity
6 9 12 13 13 24
exit was planned in advance 2 3 4 4 4 5
Retirement 1 2 6 7 8 6
personal reasons 20 20 20 19 19 15
an incident 3 4 3 4 2 0
government/tax
policy/bureaucracy
4 7 9 8 12 5
other reason/don’t know 0 0 0 0 0 0
Source: Panteia/GEM APS 2019.
Main exit reason
There are several reasons, or combinations of reasons, why individuals decide to quit
their entrepreneurial initiatives. For example, a business may lack profitability, the
owner-managers may have difficulties in acquiring the relevant financial resources, or
an individual may simply retire. The GEM distinguishes between nine exit reasons in
total and respondents are asked to select the most important reason for quitting their
business. An overview of these nine reasons and corresponding percentages is given in
table 30. Internationally, the dominant reason for entrepreneurial exit tends to be lack
of profitability. In 2019, 23% of exits in the Netherlands were due to a lack of
profitability, which is less than the average share in high-income countries (27%). In

46
the Netherlands, one reason was mentioned more often than lack of profitability:
another job (or business) opportunity (24%).
Because the entrepreneurial exit rate is low, the GEM Adult Population Survey includes
few observations from respondents that had to discontinue their business in the past 12
months (46 observations in 2019 for the Netherlands). The percentages presented in
the rightmost column of table 30 (concerning the Netherlands) therefore have relatively
large confidence intervals. This makes it difficult to compare results over time.
3.6 Triggers and barriers of entrepreneurship: Results of the Dutch
NES
Whereas the majority of this report is devoted to the 2019 results of the Dutch Adult
Population Survey, one interesting component of GEM has remained unaddressed so
far: the results of the National Expert Survey (NES). Different sets of framework
conditions are of concern to the public and to policy-makers. The conditions that are
expected to stimulate and support entrepreneurial activity are captured by the
framework conditions as included in the NES (Xavier et al., 2013).
The NES distinguishes between nine areas (Entrepreneurial Framework Conditions,
EFCs) that are thought to stimulate or constrain the level and nature of entrepreneurial
activity. At least 36 experts have been asked to give their assessments about a wide
range of statements that can be classified according to these EFCs. For each EFC, the
experts were asked to give a score on a Likert scale with values from 1 (completely
false) to 9 (completely true), where 5 is neither true nor false. A high score for an EFC
(value 8 or 9) indicates that the particular factor encourages entrepreneurial activity
within a country whereas a low score (value 1 or 2) means that entrepreneurship is
hampered by this area.
Entrepreneuria l Framework Condit ions
The EFCs are explained below (mainly drawn from Xavier et al., 2013, Figure 3.1). For
three EFCs a further distinction is made between two sub-conditions.
Financing: The availability of financial resources, equity, and debt (including grants and
subsidies) for new and growing firms.
Government policies: The extent to which public policies support entrepreneurship. This
EFC has two sub-conditions:
general, i.e. entrepreneurship as a relevant issue,
regulation, i.e. whether taxes or regulations are size-neutral or encourage new
enterprises and SMEs.
Government programmes: The extent to which new and growing firms are assisted by
effective government programmes (with competent personnel), science parks and
incubators.
Education and training: The extent to which training on creating or managing new, small
or growing businesses is incorporated within the education and training system
at the primary or secondary school level (first sub-condition),
or at the post-secondary school level (second sub-condition).
R&D transfer: The extent to which national Research and Development (R&D) will lead to
new commercial opportunities, and whether or not these are available for new, small and
growing firms.
Commercial infrastructure: The presence of commercial, accounting and other legal
services and institutions that allow or promote the emergence of small, new and growing
business entities.
Internal market openness: there are two sub-conditions:
market dynamics, i.e. the extent to which markets change from year to year,

47
market openness, i.e. the extent to which new firms are free to enter existing markets.
Physical infrastructure: Ease of access to available physical resources – communication,
utilities, transportation, land or space – at a price that does not discriminate against new,
small or growing firms.
Cultural and social norms: The extent to which existing social and cultural norms
encourage entrepreneurial activities.
Figure 11 presents the scores for the 12 dimensions for the Netherlands and for the
high-income countries (unweighted average of country scores). Note that high scores
(8 and 9) indicate that the EFC being examined promotes a good entrepreneurial climate
whereas low scores (1 and 2) indicate that the particular EFC constrains the
entrepreneurial environment. The results for the Netherlands are discussed first,
followed by a comparison with international results.
figure 11 Average expert scores for the Entrepreneurial Framework Conditions (EFCs) for the Netherlands and
high-income countries, 2019
Source: Panteia/GEM NES 2019.
A first observation is that none of the entrepreneurial framework conditions stand out
as a particularly clear barrier for the Netherlands in terms of scores below 2. In general,
this suggests positive conditions for entrepreneurial activity in the Dutch context. The
Netherlands score particularly high on physical infrastructure, commercial infrastructure
and cultural and social norms. The well-regarded social and cultural norms are in line
with the results from table 6, showing that entrepreneurship is seen as a desirable
career choice by 86% of the adult population, much higher than in comparable
economies.
The lowest scores in 2019 are the scores for the framework condition relating to R&D
transfer, internal market openness (dynamic), secondary education and regulation
government policies. That being said, however, the Netherlands score relatively high on
these framework conditions compared to the average high-income country.
The figure shows that the Netherlands score above the average amongst high-income
countries across every EFC. The scores of the Netherlands are also higher than the

48
average of OECD countries and EU countries on every EFC. The largest difference16
between the Netherlands and the average high income country is found regarding
education at the secondary level. This underlines the increased attention for
entrepreneurship in the Dutch education system (e.g. European Commission, 2012).
16 relative as well as absolute.

49
References
Augusto Felício, J., Rodrigues, R. & Caldeirinha, V. (2012), The effect of
entrepreneurship on corporate performance, Management Decision, 50(10), 1717-
1738.
Blanka, C. (2019). An individual-level perspective on intrapreneurship: a review and
ways forward. Review of Managerial Science, 13(5), 919-961.
Bosma, N., Stam, E. & Wennekers, S. (2011), Intrapreneurship versus independent
entrepreneurship: A cross-national analysis of individual entrepreneurial behaviour,
Tjalling C. Koopmans Research Institute Discussion Paper Series, no. 11-04, Utrecht:
Utrecht School of Economics.
Bosma, N. & Kelley, D. (2019), Global Entrepreneurship Monitor: 2018/19 Global
Report, Wellesley, MA: Babson College.
Bosma, N., Hill, S., Ionescu-Somers, A., Kelley, D., Levie, J. & Tarnawa, A. (2020),
Global Entrepreneurship Monitor: 2019/20 Global Report, Wellesley, MA: Babson
College.
CPB (2018), Central Economic Plan 2018, CPB Policy Brief, 2018/06, The Hague: CPB
Netherlands Bureau for Economic Policy Analysis.
CPB (2019), Press Release: Economic growth down to 1.4% by 2020, 2019/08, The
Hague: CPB Netherlands Bureau for Economic Policy Analysis.
Carsrud, A. & Brännback, M. (2011), Entrepreneurial Motivations: What Do We Still
Need to Know?, Journal of Small Business Management, 49(1), 9-26.
Cieślik, J., Kaciak, E. and Van Stel, A. (2018). Country-level determinants and
consequences of overconfidence in the ambitious entrepreneurship segment.
International Small Business Journal, 36(5), 473-499.
Davidsson, P. (2006), Nascent Entrepreneurship: Empirical Studies and Developments,
Foundations and Trends in Entrepreneurship, 2(1), 1–76.
De Kok, J., B. Kruithof, J. Snijders, A. van der Graaf, A. van Stel and P. van der Zeijden
(2018), Global Entrepreneurship Monitor the Netherlands 2017: National Report,
Zoetermeer: Panteia.
DeTienne, D.R. (2010), Entrepreneurial exit as a critical component of the
entrepreneurial process: Theoretical development, Journal of Business Venturing,
25(2), 203-215.
European Commission (2012), Entrepreneurship Education at School in Europe; National
Strategies, Curricula and Learning Outcomes, Brussels: Eurydice.
Hermans, J., Vanderstraeten, J., Van Witteloostuijn, A., Dejardin, M., Ramdani, D., &
Stam, E. (2015), Ambitious entrepreneurship: A review of growth aspirations,
intentions, and expectations, In: A.C. Corbett, J.A. Katz and A. McKelvie (eds.),

50
Entrepreneurial Growth: Individual, Firm, and Region (pp. 127-160), Bingley, UK:
Emerald.
Liebregts, W.J. (2018), Hidden Entrepreneurship: Multilevel Analyses of the Determinants
and Consequences of Entrepreneurial Employee Activity, Doctoral thesis, Utrecht
University.
Maslow, A.H. (1970). Motivation and Personality. New York: Harper and Row.
Parastuty, Z. (2018), Systematic Review of Research on Exit: A Bibliometric Analysis
and Future Directions, International Review of Entrepreneurship 16(4), 587-626.
Span, T., Van Stel, A. & Van den Berg, R. (2015), Global Entrepreneurship Monitor the
Netherlands 2014: National Report, Zoetermeer: Panteia.
Stam, E. (2013). Knowledge and entrepreneurial employees: A country-level analysis.
Small Business Economics, 41(4), 887-898.
Statistics Netherlands (2019), Bevolking; kerncijfers, CBS Statline. Retrieved on: 6
February 2020
Szerb, L. and Vörös, Z. (2019). The changing form of overconfidence and its effect on
growth expectations at the early stages of startups. Small Business Economics,
forthcoming. Published online 30 November 2019.
Thornton, P., Ribeiro-Soriano, D. & Urbano, D. (2011), Socio-cultural factors and
entrepreneurial activity: An Overview, International Small Business Journal, 29(2),
1-14.
Van Gelderen, M., and Jansen, P. (2006). Autonomy as a start-up motive. Journal of
Small Business and Enterprise Development, 13(1), 23-32.
Van Stel, A., Span, T. & Hessels, J. (2014), Global Entrepreneurship Monitor the
Netherlands 2013: National Report, Zoetermeer: Panteia.
Van Stel, A., Kaciak, E., & Cieślik, J. (2020). Hiring plans by solo entrepreneurs at the
time of start-up: The role of education and the desire for self-expression. Journal of
Business Research, 119, 58-66.
Van der Zeijden P., Van der Graaf, A. & Snijders, J. (2017), Global Entrepreneurship
Monitor the Netherlands 2016: National Report, Zoetermeer: Panteia.
Van der Zeijden P., Van Stel, A. & Wong, M. (2016), Global Entrepreneurship Monitor
the Netherlands 2015: National Report, Zoetermeer: Panteia.
Van der Zwan, P., Hessels, J., Hoogendoorn, B. & De Vries, N. (2013), Global
Entrepreneurship Monitor the Netherlands 2012: National Report, Zoetermeer:
Panteia/EIM.
Van der Zwan, P., Thurik, R., & Grilo, I. (2010), The entrepreneurial ladder and its
determinants, Applied Economics, 42(17), 2183-2191.

51
Wennberg, K., Pathak, S. & Autio, E. (2013), How culture moulds the effects of self-
efficacy and fear of failure on entrepreneurship, Entrepreneurship & Regional
Development, 25(9), 756-780.
Wennekers, S. & Van Stel, A. (2017), Types and roles of productive entrepreneurship:
A conceptual study. In G. Ahmetoglu, T. Chamorro-Premuzic, B. Klinger and T.
Karcisky (Eds.), The Wiley Handbook of Entrepreneurship, pp. 37–69. Chichester,
UK: John Wiley & Sons Ltd.
World Economic Forum (2018), The Global Competitiveness Report 2018, Geneva: World
Economic Forum.
Xavier, S.R., Kelley, D., Kew, J., Herrington, M. & Vorderwuelbecke, A. (2013), Global
Entrepreneurship Monitor: 2012 Global Report, Wellesley, MA: Babson College.