Embed Size (px)
Citation preview
Global Employment Trends for Youth 2010
Sara ElderInternational Labour OrganizationADAPT Conference, “Productivity, Investment in Human Capital and the Challenge of Youth Employment”
Bergamo, 16 December 2010
Agenda1. Labour market trends for youth – the
pre-crisis picture
2. Impact of the global economic crisis on the youth labour market
3. Why are young people vulnerable in the labour market?
4. Why do we care about the youth labour market?
1. Labour market trends for youth – the pre-crisis picture
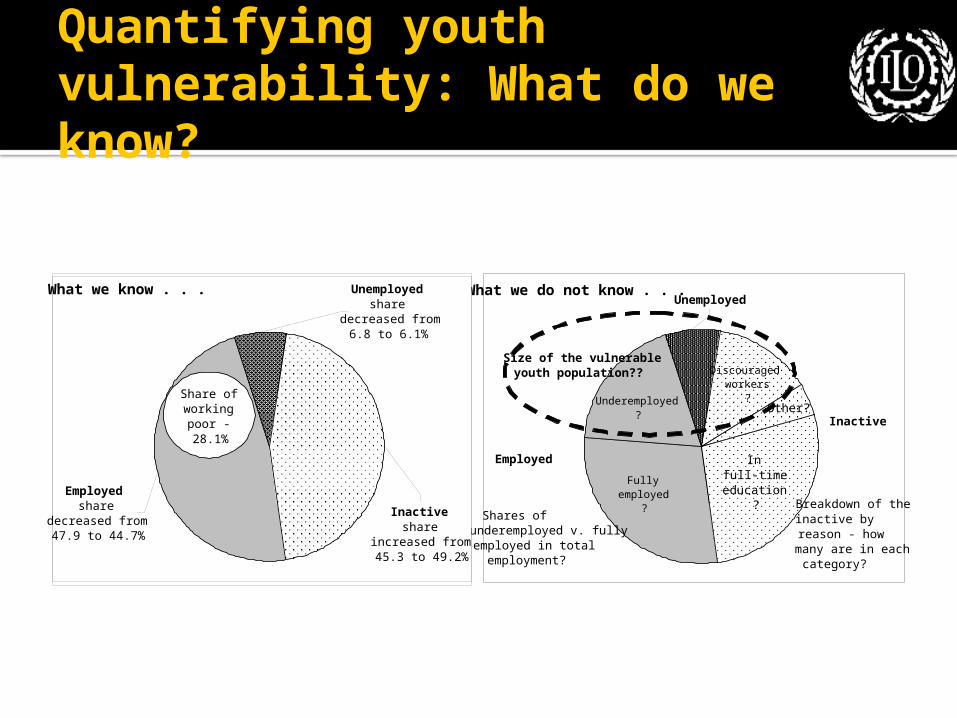
Quantifying youth vulnerability: What do we know?
What we do not know . . .Unemployed
Discouraged workers
?
Fully employed
?
Underemployed?
In full-time
education ?
Other?
Breakdown of the inactive by reason - how many are in each category?
Inactive
Employed
Shares of underemployed v. fully employed in total employment?
Size of the vulnerable youth population??
What we know . . .
Inactive share
increased from 45.3 to 49.2%
Employed share
decreased from 47.9 to 44.7%
Unemployed share
decreased from 6.8 to 6.1%
Share of working poor - 28.1%
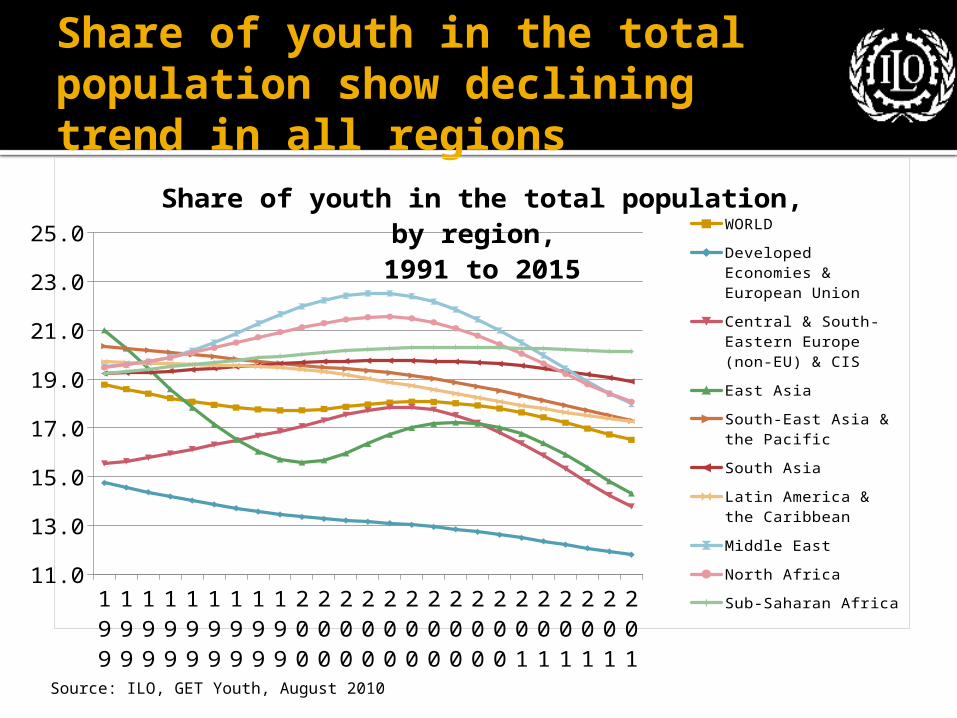
Share of youth in the total population show declining trend in all regions
1991
1992
1993
1994
1995
1996
1997
1998
1999
2000
2001
2002
2003
2004
2005
2006
2007
2008
2009
2010
2011
2012
2013
2014
2015
11.0
13.0
15.0
17.0
19.0
21.0
23.0
25.0
Share of youth in the total population, by region,
1991 to 2015WORLD
Developed Economies & European Union
Central & South-East-ern Europe (non-EU) & CIS
East Asia
South-East Asia & the Pacific
South Asia
Latin America & the Caribbean
Middle East
North Africa
Sub-Saharan Africa
Source: ILO, GET Youth, August 2010
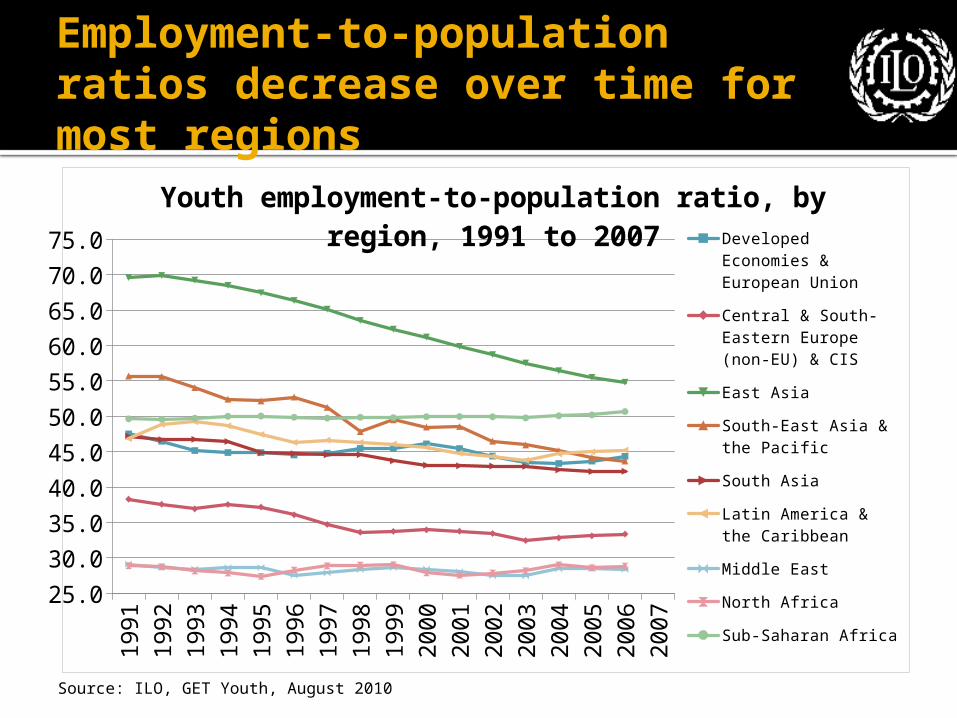
Employment-to-population ratios decrease over time for most regions1991
1992
1993
1994
1995
1996
1997
1998
1999
2000
2001
2002
2003
2004
2005
2006
2007
25.0
30.0
35.0
40.0
45.0
50.0
55.0
60.0
65.0
70.0
75.0
Youth employment-to-population ratio, by region, 1991 to 2007
Developed Economies & European Union
Central & South-East-ern Europe (non-EU) & CIS
East Asia
South-East Asia & the Pacific
South Asia
Latin America & the Caribbean
Middle East
North Africa
Sub-Saharan Africa
Source: ILO, GET Youth, August 2010
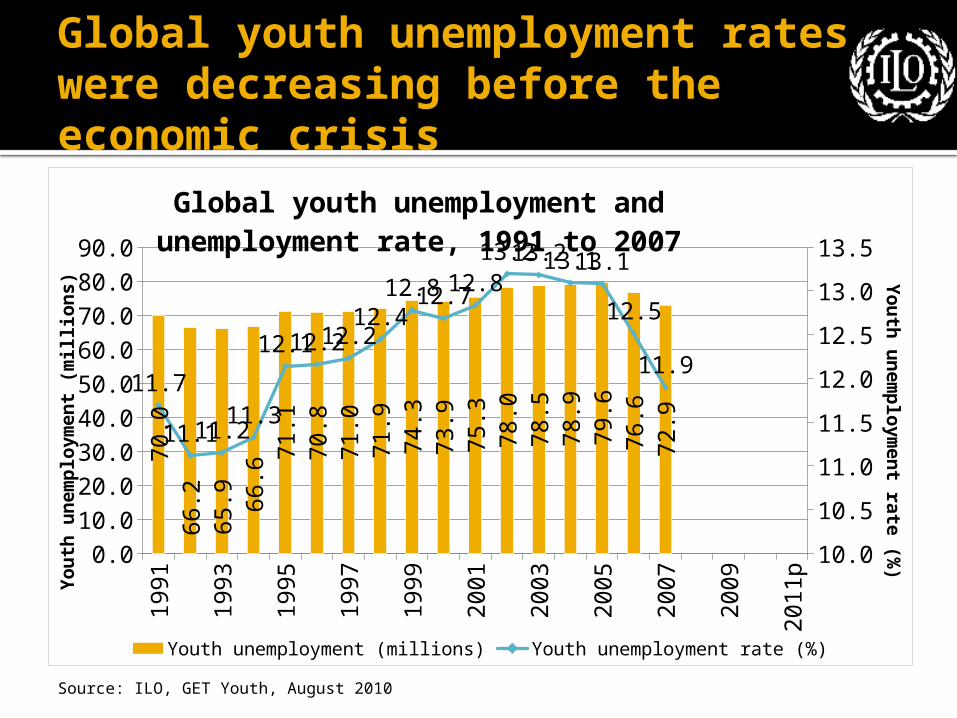
Global youth unemployment rates were decreasing before the economic crisis
1991
1992
1993
1994
1995
1996
1997
1998
1999
2000
2001
2002
2003
2004
2005
2006
2007
2008
2009
2010p
2011p
0.010.020.030.040.050.060.070.080.090.0
10.0
10.5
11.0
11.5
12.0
12.5
13.0
13.5
70.0
66.2
65.9 66.6
71.1
70.8
71.0
71.9
74.3
73.9
75.3
78.0
78.5
78.9
79.6
76.6
72.9
11.7
11.111.211.3
12.112.212.212.4
12.812.712.813.213.213.113.1
12.5
11.9
Global youth unemployment and un-employment rate, 1991 to 2007
Youth unemployment (millions) Youth unemployment rate (%)
Yo
uth
un
em
plo
ym
en
t (m
illi
on
s) Y
ou
th u
ne
mp
loym
en
t rate
(%)
Source: ILO, GET Youth, August 2010
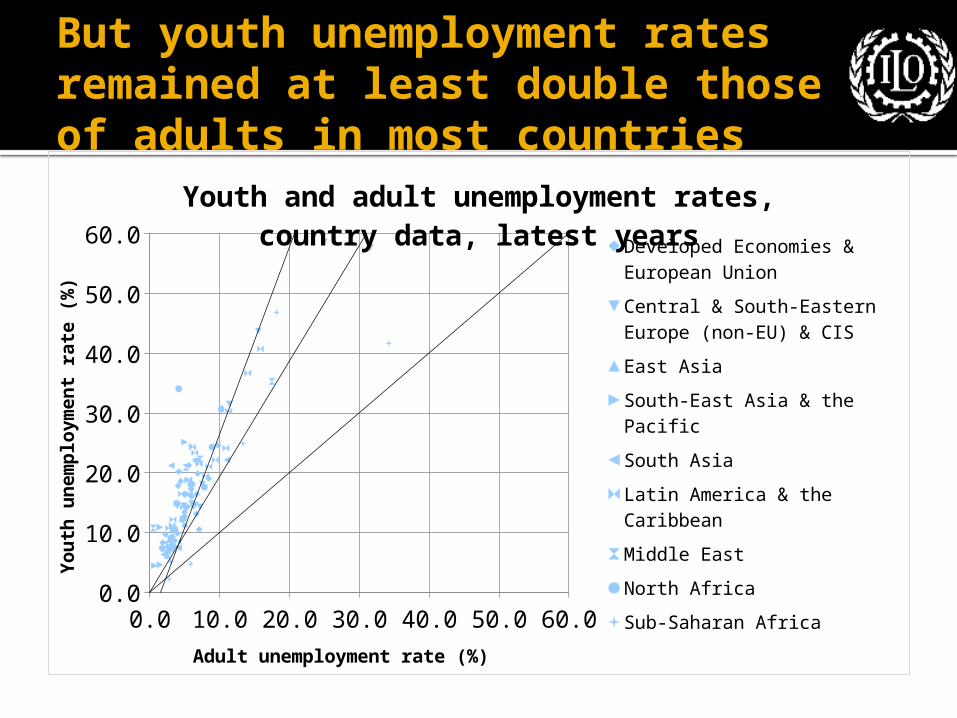
But youth unemployment rates remained at least double those of adults in most countries
0.0 10.0 20.0 30.0 40.0 50.0 60.00.0
10.0
20.0
30.0
40.0
50.0
60.0
Youth and adult unemployment rates, country data, latest years
Developed Economies & Eu-ropean Union
Central & South-Eastern Europe (non-EU) & CIS
East Asia
South-East Asia & the Pacific
South Asia
Latin America & the Caribbean
Middle East
North Africa
Sub-Saharan Africa
Adult unemployment rate (%)
Yo
uth
un
em
plo
ym
en
t ra
te (
%)
Inequalities in the chances of finding work
Young women tend to have more difficulty finding work than young men.
In most OECD countries, unemployment is higher among the lesser educated youth; in developing countries, it is the highly educated who face longer job searches.
Unemployment rates are higher among ethnic minorities.
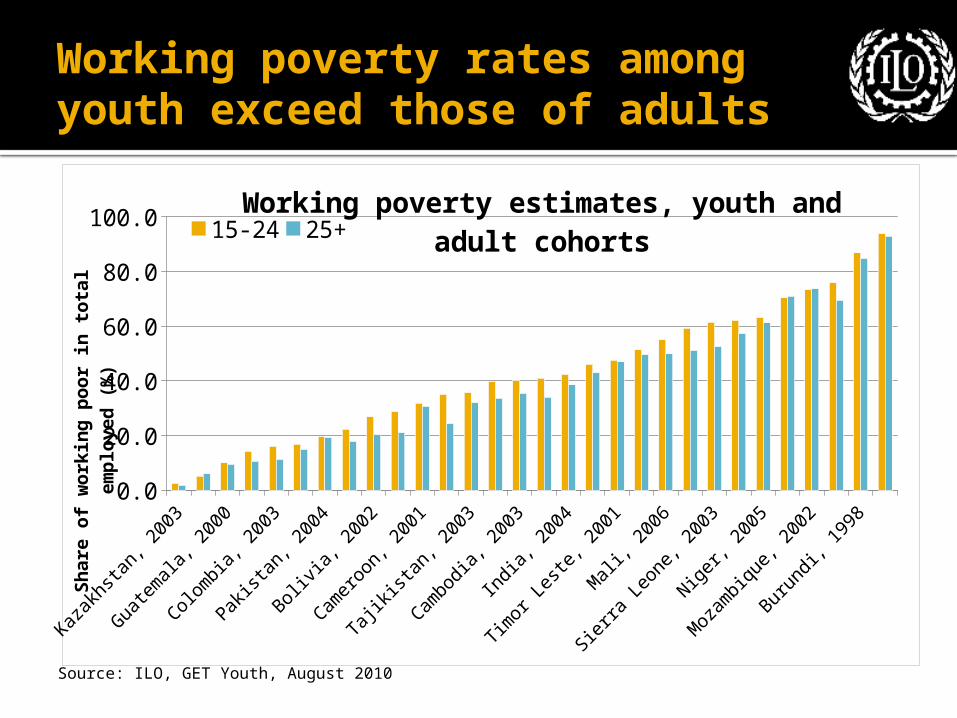
Working poverty rates among youth exceed those of adults
0.0
20.0
40.0
60.0
80.0
100.0Working poverty estimates, youth and
adult cohorts15-24 25+
Sh
are
of
work
ing
poor
in t
ota
l em
plo
ye
d (
%)
Source: ILO, GET Youth, August 2010
2. Impact of the global economic crisis on the youth labour market
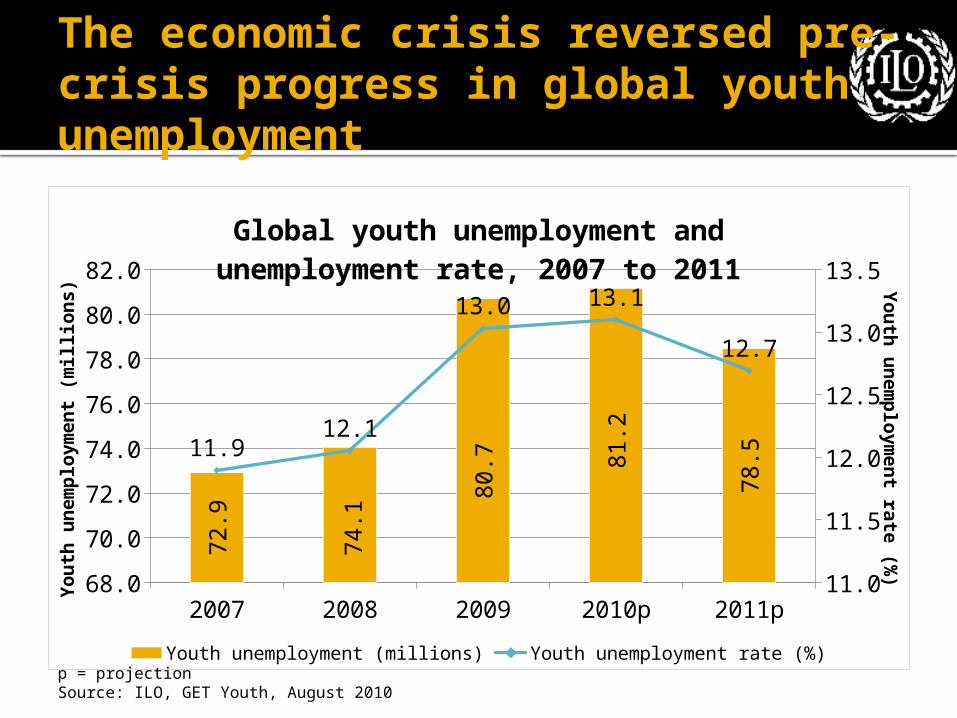
The economic crisis reversed pre-crisis progress in global youth unemployment
2007 2008 2009 2010p 2011p68.0
70.0
72.0
74.0
76.0
78.0
80.0
82.0
11.211.411.611.812.012.212.412.612.813.013.2
72.9
74.1
80.7 8
1.2
78.511.9
12.1
13.0 13.1
12.7
Global youth unemployment and un-employment rate, 2007 to 2011
Youth unemployment (millions) Youth unemployment rate (%)
Yo
uth
un
em
plo
ym
en
t (m
illi
on
s) Y
ou
th u
ne
mp
loym
en
t rate
(%)
p = projectionSource: ILO, GET Youth, August 2010
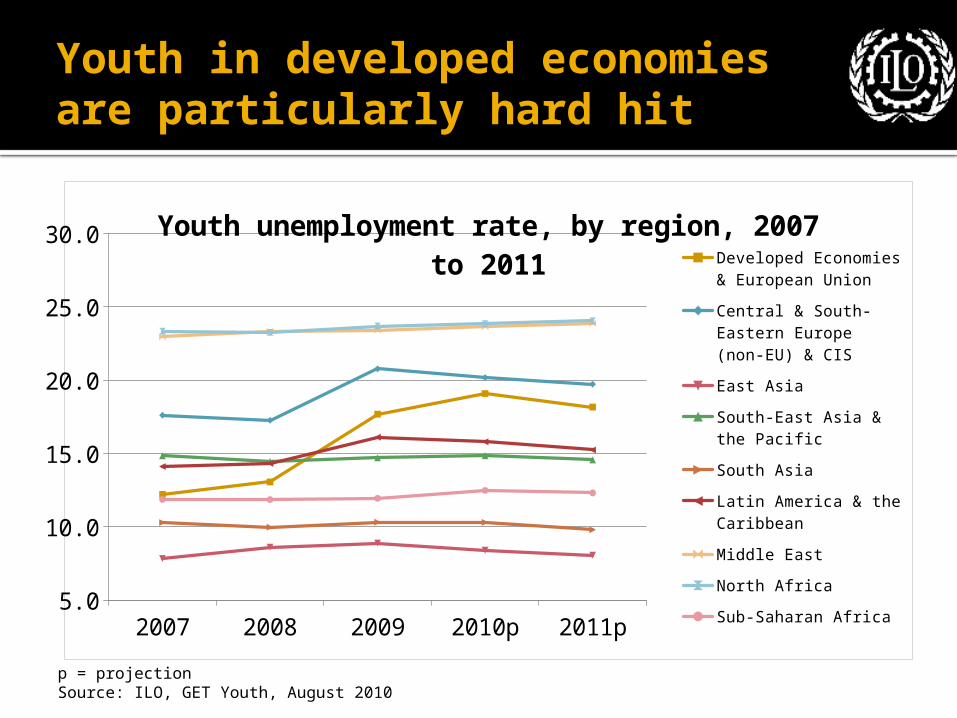
Youth in developed economies are particularly hard hit
2007 2008 2009 2010p 2011p5.0
10.0
15.0
20.0
25.0
30.0 Youth unemployment rate, by region, 2007 to 2011 Developed Economies
& European Union
Central & South-East-ern Europe (non-EU) & CIS
East Asia
South-East Asia & the Pacific
South Asia
Latin America & the Caribbean
Middle East
North Africa
Sub-Saharan Africa
p = projectionSource: ILO, GET Youth, August 2010
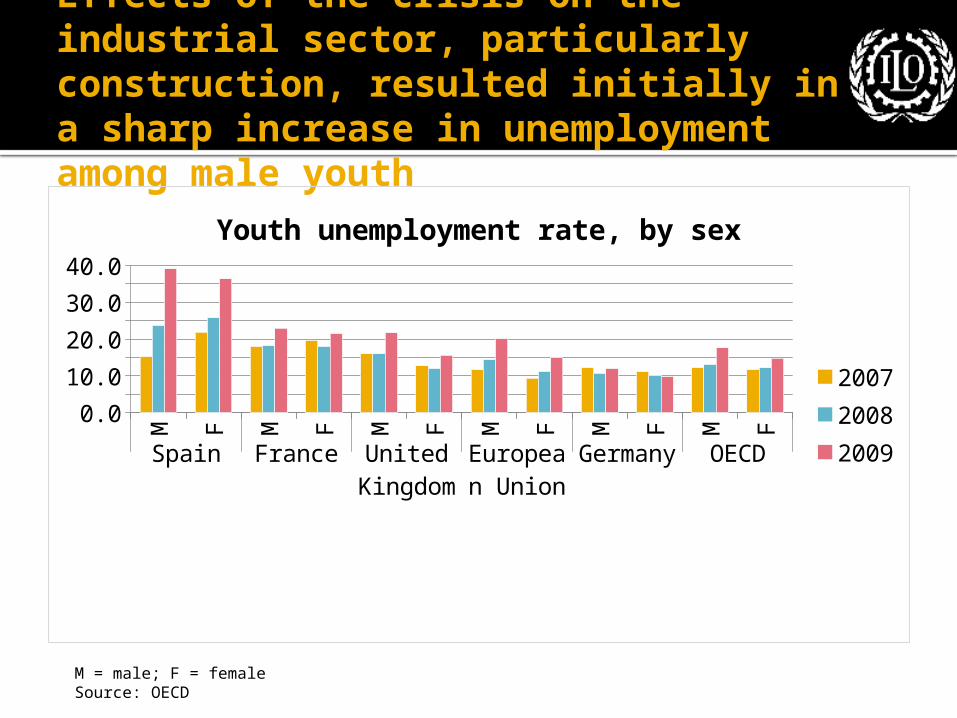
Effects of the crisis on the industrial sector, particularly construction, resulted initially in a sharp increase in unemployment among male youth
M F M F M F M F M F M F
Spain France United King-dom
Euro-pean Union
Ger-many
OECD
0.0
10.0
20.0
30.0
40.0
Youth unemployment rate, by sex
200720082009
M = male; F = femaleSource: OECD
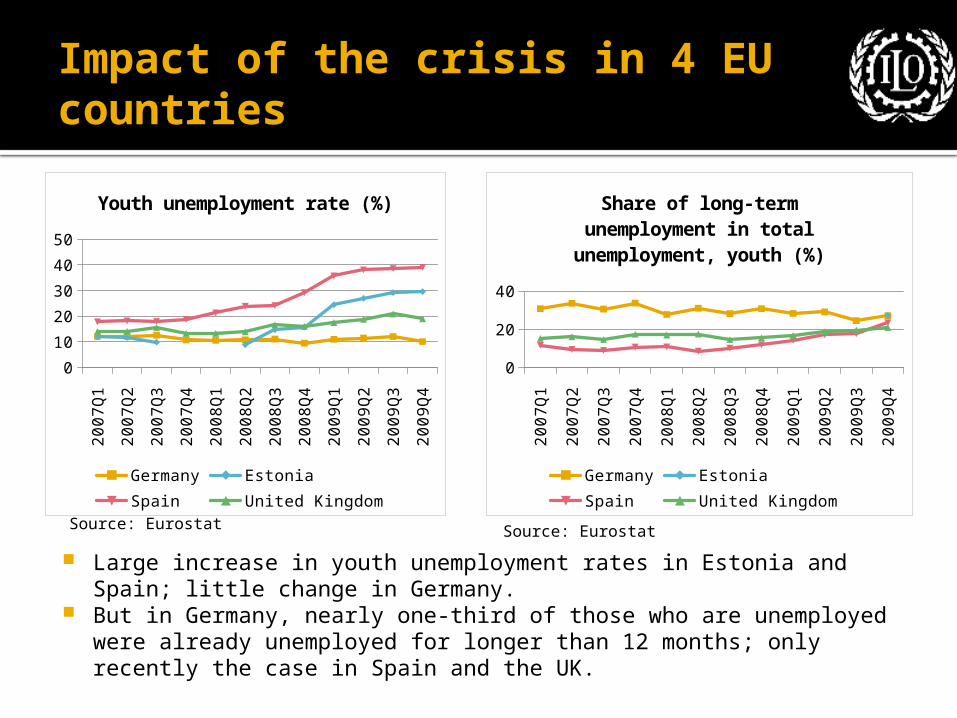
Impact of the crisis in 4 EU countries
2007Q
1
2007Q
2
2007Q
3
2007Q
4
2008Q
1
2008Q
2
2008Q
3
2008Q
4
2009Q
1
2009Q
2
2009Q
3
2009Q
4 0
10
20
30
40
50
Youth unemployment rate (%)
Germany Estonia Spain United Kingdom
2007Q
1
2007Q
2
2007Q
3
2007Q
4
2008Q
1
2008Q
2
2008Q
3
2008Q
4
2009Q
1
2009Q
2
2009Q
3
2009Q
4 0
10
20
30
40
Share of long-term unem-ployment in total unem-
ployment, youth (%)
Germany Estonia Spain United Kingdom
Large increase in youth unemployment rates in Estonia and Spain; little change in Germany.
But in Germany, nearly one-third of those who are unemployed were already unemployed for longer than 12 months; only recently the case in Spain and the UK.
Source: Eurostat Source: Eurostat
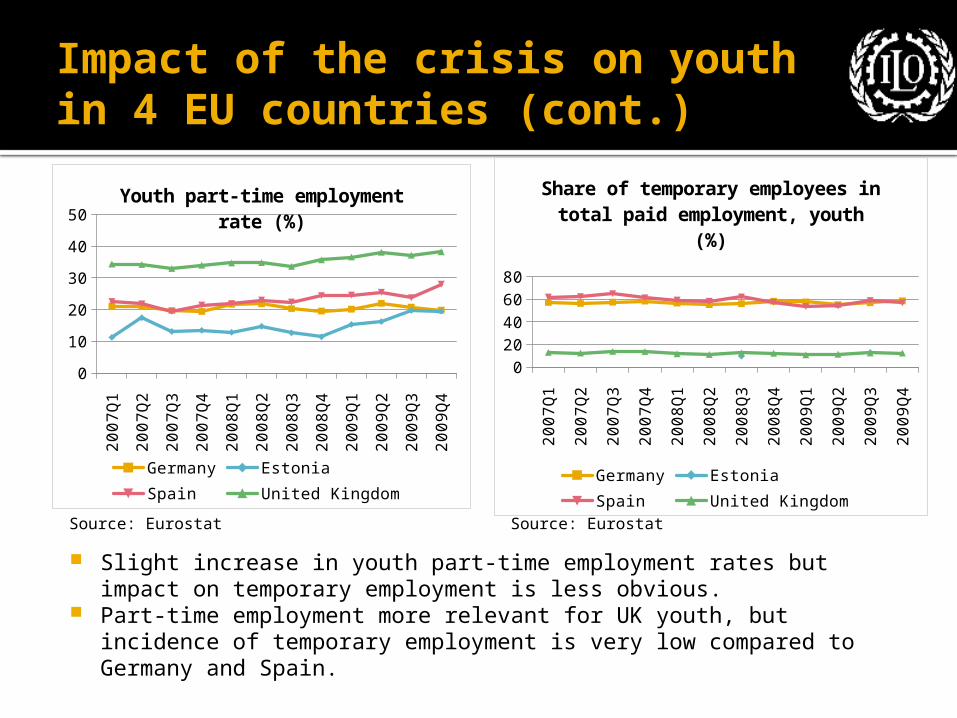
Impact of the crisis on youth in 4 EU countries (cont.)
Slight increase in youth part-time employment rates but impact on temporary employment is less obvious.
Part-time employment more relevant for UK youth, but incidence of temporary employment is very low compared to Germany and Spain.
2007Q
1
2007Q
2
2007Q
3
2007Q
4
2008Q
1
2008Q
2
2008Q
3
2008Q
4
2009Q
1
2009Q
2
2009Q
3
2009Q
4 0
10
20
30
40
50Youth part-time employment
rate (%)
Germany Estonia Spain United Kingdom
2007Q
1
2007Q
2
2007Q
3
2007Q
4
2008Q
1
2008Q
2
2008Q
3
2008Q
4
2009Q
1
2009Q
2
2009Q
3
2009Q
4 0
20
40
60
80
Share of temporary employees in total paid employment,
youth (%)
Germany Estonia Spain United Kingdom
Source: Eurostat Source: Eurostat
Impact of the crisis on youth in developing countries
Lack of decent work is nothing new for majority of youth
Dominance of self-employment acts as a buffer, unemployment rates do not significantly increase … increase in vulnerable employment and casual labour in an “increasingly crowded” informal economy
Secondary consequences on education and training, pregnancy and parenthood, health
Longer term impacts on youth entering the labour market during recession
Impacts timing of labour market entry (“hiding out” in education), the smoothness of the transition (multiple spells of unemployment), social norms adopted (mistrust in the State and economic system)
“Lost generation” ?
3. Why are young people vulnerable in the labour market?Labour demandBusiness cycleWork experience“Bad” educationSkills/talent mismatchTemporary employment/dual labour
marketsEntrepreneurshipDisempowerment
4. Why do we care about youth employment?
Inefficiencies in youth labour market (unemployment, discouragment, working poverty) are costly
Lack of decent work at an early age compromises future employment prospects and impacts behaviour
A young person with hopes and options is happy; take away the options and youth become angry
Future consumers, producers … societies

What can you do?
Advocate for continuing active labour market support of young people
Use your voiceEducate yourselfTake advantage of existing services
(e.g. career guidance, job placement)
Learn how to earn: combine work with studies
Stay engaged and stay positive !