Embed Size (px)
Citation preview
Global Economy and Economic Perceptions Indices
WAPOR Annual Congress (2015): Panel onGLOBAL INDICES OF OPINIONS AND PERCEPTIONS
Authors Team:
Umar Taj (Email: [email protected])
Taimur Saeed (Email: [email protected])
Presented at: WAPOR Annual Congress, 2015 (Buenos Aires, Argentina)
Note: Presentation is based on research in progress
WAPOR Annual Congress (2015): Panel onGLOBAL INDICES OF OPINIONS AND PERCEPTIONS
Global Economy and Economic Perceptions Indices
Panel Paper # 2
INTRODUCTION
This Presentation examines 3 Indices related to
National Economy. The first two are Indices of
Transactional activities. (GDP per capita and Gini
coefficient). The third measures sentiments
(Consumer Confidence). The first two have over a
period of time been globalized, the third has yet to
achieve that status
Page 2
WAPOR Annual Congress (2015): Panel onGLOBAL INDICES OF OPINIONS AND PERCEPTIONS
Global Economy and Economic Perceptions Indices

Page 3
GDPper Capita
Index of Transactional Activity measured by multi-method approach*
* only minor use of sample surveys
WAPOR Annual Congress (2015): Panel onGLOBAL INDICES OF OPINIONS AND PERCEPTIONS
Global Economy and Economic Perceptions Indices
GDP
Background:
An aggregate measure of production
No single number has become more central to society in the past 50 years than GDP
The concept of GDP was first developed by Simon Kuznets in 1934
Page 4
WAPOR Annual Congress (2015): Panel onGLOBAL INDICES OF OPINIONS AND PERCEPTIONS
Global Economy and Economic Perceptions Indices
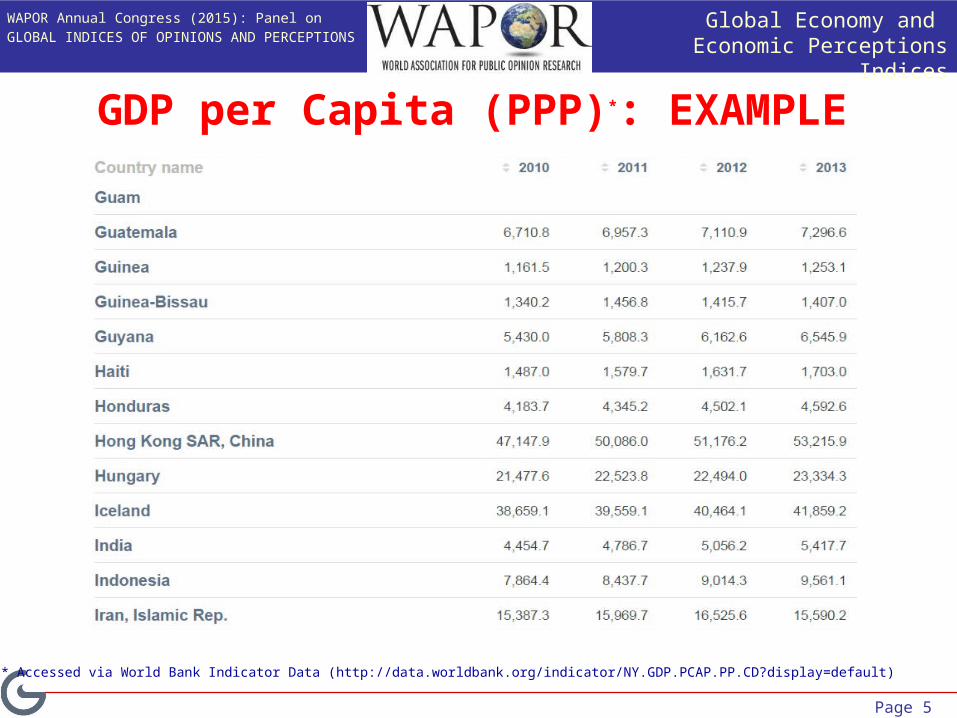
GDP per Capita (PPP)*: EXAMPLE
* Accessed via World Bank Indicator Data (http://data.worldbank.org/indicator/NY.GDP.PCAP.PP.CD?display=default)
Page 5
WAPOR Annual Congress (2015): Panel onGLOBAL INDICES OF OPINIONS AND PERCEPTIONS
Global Economy and Economic Perceptions Indices
DISCOURSE ON VALIDITY AND UTILITY OF A GLOBAL INDICATOR
It is measured frequently (most countries provide this data on quarterly basis), widely (almost all the countries in the world provide this data) and consistently (technical definition of GDP is relatively consistent among countries).
GDP per Capita often used as an indicator for living standards, with changes in living standards promptly detected through changes in per capita GDP.
The constituents of GDP calculation call for care when drawing conclusions about the welfare of the states and quality of life in different countries.
Page 6
GDP
WAPOR Annual Congress (2015): Panel onGLOBAL INDICES OF OPINIONS AND PERCEPTIONS
Global Economy and Economic Perceptions Indices
Page 7
Gini Index
Index of Transactional Activity Measured by Sample Survey Method
WAPOR Annual Congress (2015): Panel onGLOBAL INDICES OF OPINIONS AND PERCEPTIONS
Global Economy and Economic Perceptions Indices
GINI Index
Background:
Measures the extent to which the distribution of income or consumption expenditure among individuals or households within an economy deviates from a perfectly equal distribution
Gini index of 0 represents perfect equality, while an index of 100 implies perfect inequality
It was developed by the Italian statistician and sociologist Corrado Gini and published in his 1912 paper "Variability and Mutability“
Page 8
WAPOR Annual Congress (2015): Panel onGLOBAL INDICES OF OPINIONS AND PERCEPTIONS
Global Economy and Economic Perceptions Indices
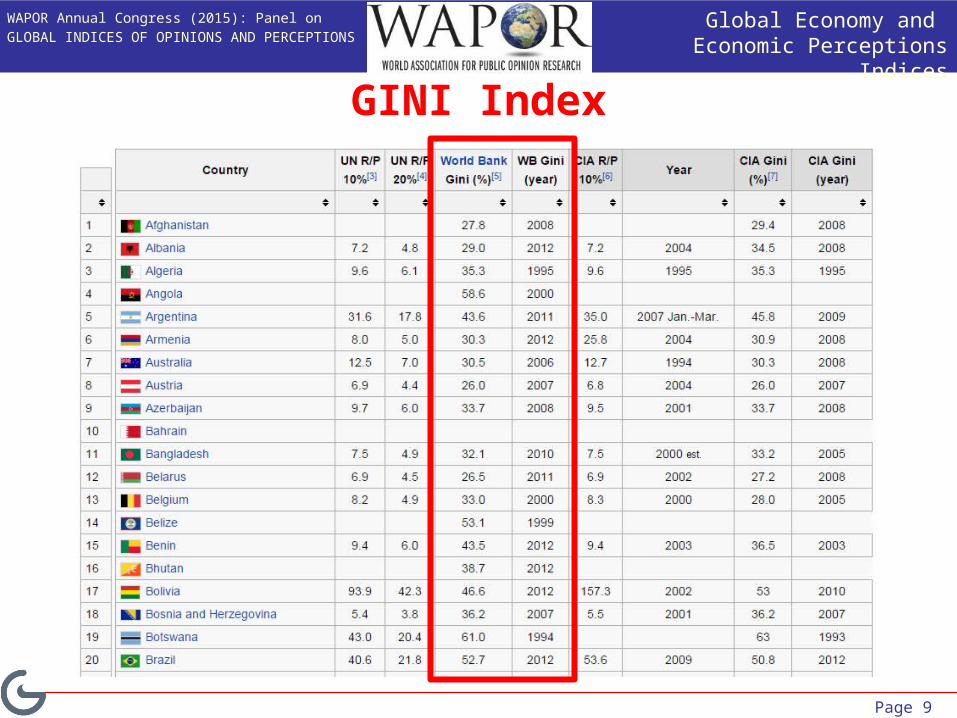
GINI Index
Page 9
WAPOR Annual Congress (2015): Panel onGLOBAL INDICES OF OPINIONS AND PERCEPTIONS
Global Economy and Economic Perceptions Indices

DISCOURSE ON VALIDITY AND UTILITY OF GINI INDEX AS A GLOBAL INDICATOR:
Can be used to compare diverse countries and different regions or groups within a country (caution: for a given time interval)
The Gini coefficient is a relative measure
Which means that it is possible for the Gini coefficient of a developing country to rise (due to increasing inequality of income) while the number of people in absolute poverty decreases.This is because the Gini coefficient measures relative, not absolute, wealth.
Gini coefficients are simple, and this simplicity can lead to oversights and can confuse the comparison of different populations;
For example, while both Bangladesh (per capita income of $1,693) and the Netherlands (per capita income of $42,183) had an income Gini index of 0.31 in 2010, the quality of life, economic opportunity and absolute income in these countries are very different, i.e. countries may have identical Gini coefficients, but differ greatly in wealth.
Page 10
WAPOR Annual Congress (2015): Panel onGLOBAL INDICES OF OPINIONS AND PERCEPTIONS
Global Economy and Economic Perceptions Indices

Page 11
Consumer Confidence Index
Index of Sentiments
WAPOR Annual Congress (2015): Panel onGLOBAL INDICES OF OPINIONS AND PERCEPTIONS
Global Economy and Economic Perceptions Indices
Consumer Confidence Index
Background:
Seeks to find how consumers view their own financial situation, short-term general economy and long-term general economy
Devised in the late 1940s by Professor George Katona at the University of Michigan
Index published monthly but has failed to grow into an important cross-national, regional or global survey
Page 12
WAPOR Annual Congress (2015): Panel onGLOBAL INDICES OF OPINIONS AND PERCEPTIONS
Global Economy and Economic Perceptions Indices
Consumer Confidence Index
DISCOURSE ON VALIDITY AND UTILITY:
Consumption expenditure accounts for a big share in the GDPs of many countries, hence making CCI a key indicator to look for
Helps us to predict consumer behaviour
Allows us to keep track of public pulse and corroborate with other key economic indicators
Page 13
WAPOR Annual Congress (2015): Panel onGLOBAL INDICES OF OPINIONS AND PERCEPTIONS
Global Economy and Economic Perceptions Indices
Consumer Confidence IndexGlobal Data
Unlike the GDP per capita and the Gini coefficient, there is no standard data series for Consumer Confidence (sentiments data) at a global level.
Based on our search we were not able to find Gallup Inc. Consumer Confidence data except for America. On the four others, a short introduction is provide.
1. Gallup Inc.2. Conference Board/ AC Nielsen 3. WIN Gallup International/ End of Year Survey Series
(not related to Gallup Inc.)4. Ipsos/MORI5. Pwc Page 14
WAPOR Annual Congress (2015): Panel onGLOBAL INDICES OF OPINIONS AND PERCEPTIONS
Global Economy and Economic Perceptions Indices
Page 15
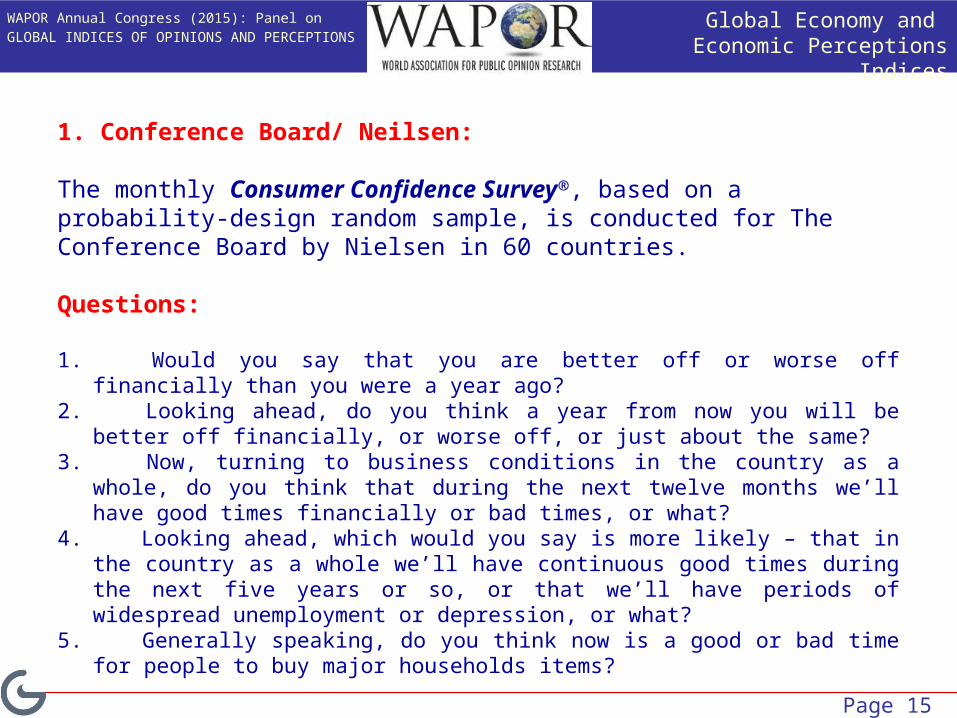
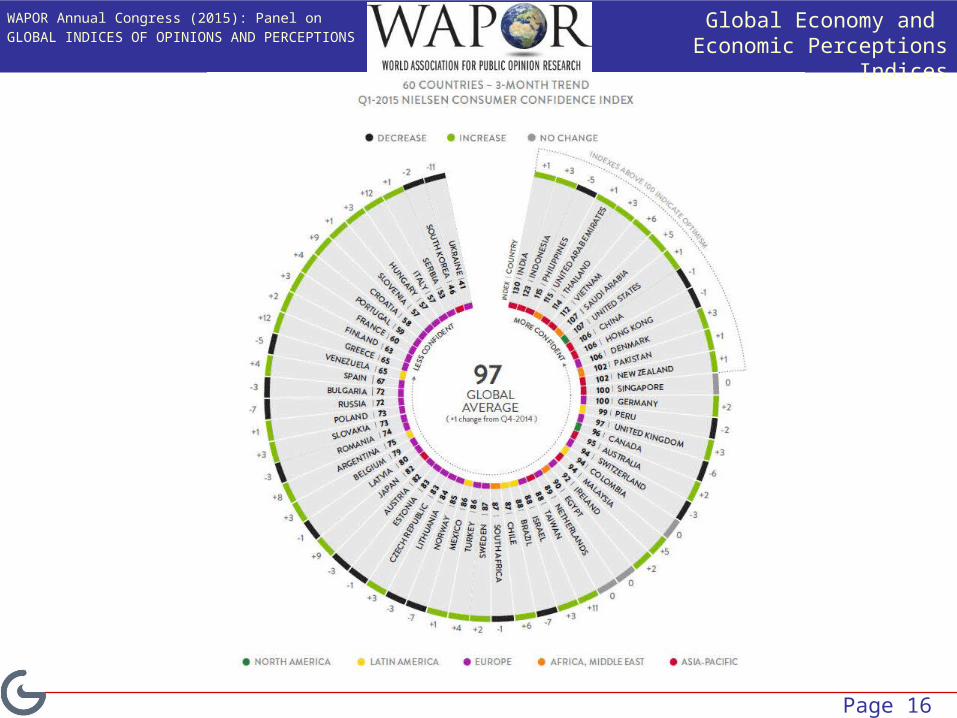
1. Conference Board/ Neilsen:
The monthly Consumer Confidence Survey®, based on a probability-design random sample, is conducted for The Conference Board by Nielsen in 60 countries.
Questions:
1. Would you say that you are better off or worse off financially than you were a year ago?
2. Looking ahead, do you think a year from now you will be better off financially, or worse off, or just about the same?
3. Now, turning to business conditions in the country as a whole, do you think that during the next twelve months we’ll have good times financially or bad times, or what?
4. Looking ahead, which would you say is more likely – that in the country as a whole we’ll have continuous good times during the next five years or so, or that we’ll have periods of widespread unemployment or depression, or what?
5. Generally speaking, do you think now is a good or bad time for people to buy major households items?
WAPOR Annual Congress (2015): Panel onGLOBAL INDICES OF OPINIONS AND PERCEPTIONS
Global Economy and Economic Perceptions Indices
Page 16
WAPOR Annual Congress (2015): Panel onGLOBAL INDICES OF OPINIONS AND PERCEPTIONS
Global Economy and Economic Perceptions Indices
Page 17
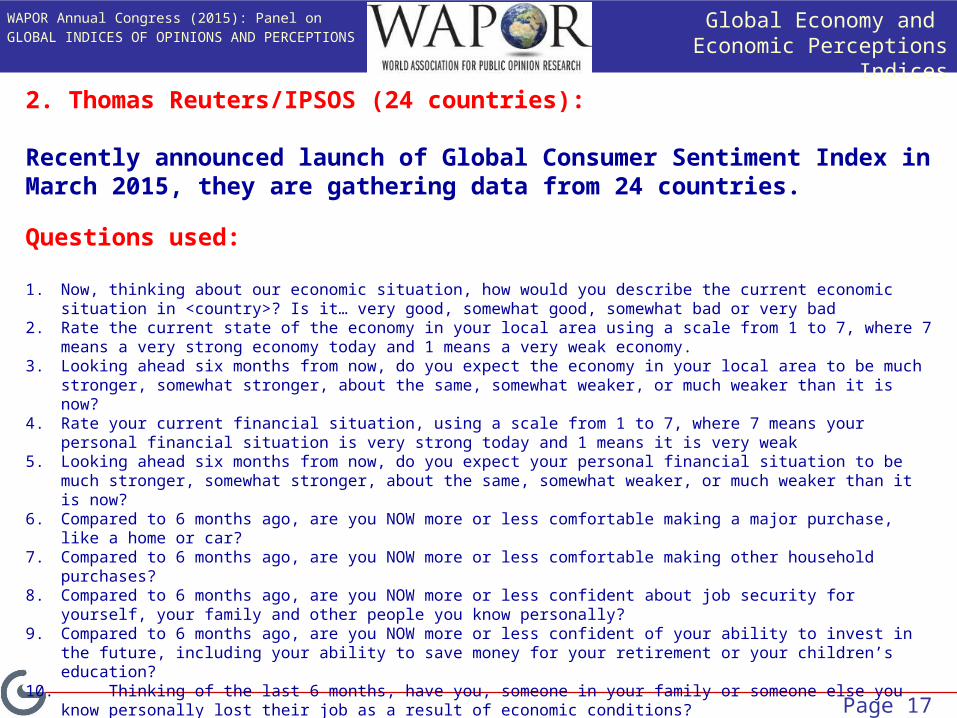
2. Thomas Reuters/IPSOS (24 countries):
Recently announced launch of Global Consumer Sentiment Index in March 2015, they are gathering data from 24 countries.
Questions used:
1. Now, thinking about our economic situation, how would you describe the current economic situation in <country>? Is it… very good, somewhat good, somewhat bad or very bad
2. Rate the current state of the economy in your local area using a scale from 1 to 7, where 7 means a very strong economy today and 1 means a very weak economy.
3. Looking ahead six months from now, do you expect the economy in your local area to be much stronger, somewhat stronger, about the same, somewhat weaker, or much weaker than it is now?
4. Rate your current financial situation, using a scale from 1 to 7, where 7 means your personal financial situation is very strong today and 1 means it is very weak
5. Looking ahead six months from now, do you expect your personal financial situation to be much stronger, somewhat stronger, about the same, somewhat weaker, or much weaker than it is now?
6. Compared to 6 months ago, are you NOW more or less comfortable making a major purchase, like a home or car? 7. Compared to 6 months ago, are you NOW more or less comfortable making other household purchases? 8. Compared to 6 months ago, are you NOW more or less confident about job security for yourself, your family and other
people you know personally? 9. Compared to 6 months ago, are you NOW more or less confident of your ability to invest in the future, including your ability
to save money for your retirement or your children’s education? 10. Thinking of the last 6 months, have you, someone in your family or someone else you know personally lost their job as a
result of economic conditions? 11. Now look ahead at the next six months. How likely is it that you, someone in your family or someone else you know
personally will lose their job in the next six months as a result of economic conditions?
WAPOR Annual Congress (2015): Panel onGLOBAL INDICES OF OPINIONS AND PERCEPTIONS
Global Economy and Economic Perceptions Indices
Page 18
3. PwC:
They calculate Global Consumer Index quarterly, using data gathered from 20 countries.
Category of Indicators:
Confidence indicators by consumer and businessesEquity marketsCommodity indicatorsActivity measures
Details are not available in the public domain
WAPOR Annual Congress (2015): Panel onGLOBAL INDICES OF OPINIONS AND PERCEPTIONS
Global Economy and Economic Perceptions Indices
Page 19
4. WIN Gallup International* End of Year Survey Series:
They gather Economic Expectation questions yearly from 65 countries.
Questions:
1- Do you think next year will be better or worse than last year?
2- Do you think next year will be one of economic prosperity or difficulty?
WAPOR Annual Congress (2015): Panel onGLOBAL INDICES OF OPINIONS AND PERCEPTIONS
Global Economy and Economic Perceptions Indices
* (Not related to Gallup Inc.)
Page 20
Reflection on the Process of Developing Global Indicators
WAPOR Annual Congress (2015): Panel onGLOBAL INDICES OF OPINIONS AND PERCEPTIONS
Global Economy and Economic Perceptions Indices
1- CUSTODIANSHIP ISSUE
There is a marked difference in the development process of GNP and Gini coefficient on the one hand and Consumer Confidence Index on the other. The Central Governments and International Organisations have assumed ownership and leadership in the case of the former (GNP and Gini) while this is absent in the case of Consumer Confidence. It is partly for this reason that Consumer Confidence could not grow to become a standardized global index.
Page 21
Reflection on the Process of Developing Global Indicators
WAPOR Annual Congress (2015): Panel onGLOBAL INDICES OF OPINIONS AND PERCEPTIONS
Global Economy and Economic Perceptions Indices
2- PROPRIETORY ISSUE
The GNP and Gini are produced by the public sector (governments) and provided to the users as a public service. Consumer Confidence data is produced in the corporate sector. As a result its detailed findings and data remain restricted.
The combined effect of these two reasons explains why the Perceptions or Sentiments based Indices of the Economy lag behind the Transactions based indices of the Economy in terms of standardization, acceptability and global coverage.

THANK YOU