Embed Size (px)
Citation preview
Global Economic Turmoil,Catastrophic Loss and Insurance:Implications for Risk Management
in the Post-Crisis WorldAmerican Institute of Marine Underwriters
Insurance Issues SeminarNew York, NY
Download at www.iii.org/presentationsRobert P. Hartwig, Ph.D., CPCU, President & Economist
Insurance Information Institute 110 William Street New York, NY 10038Tel: 212.346.5520 Cell: 917.453.1885 [email protected] www.iii.org
2
Presentation Outline
Is the World Becoming a Riskier Place?Recent Events and Implications for the Global P/C (Re)Insurance Industry
The Global Financial Crisis, Risk and the New World Order
Global Economic and Trade Outlook
The Unfortunate Nexus: Opportunity, Risk & InstabilityFuture growth is necessarily fraught with greater riskTypes, magnitude of risk inherent in future growth opportunities
Reshuffling the Global Economic DeckThe Ascendency of China
Foreign Direct Investment (FDI) and insurance exposure/demand
P/C Insurance Financial Overview & Outlook
Q&A

3
What in the World IsGoing On?
Is the World Becoming aRiskier Place?
Are We Really Crawling Out of theAbyss or Falling Into a New One?
4
Uncertainty, Risk and Fear Abound
Resurgent Terrorism Risk (e.g., Bin Laden Killing)Record Tornado Activity & Flooding in the USJapan, New Zealand, Haiti, Chile EarthquakesPolitical Upheaval in the Middle EastEchoes of the Financial CrisisHousing CrisisUS Debt and Budget CrisisSovereign Debt & Currency Crises InflationRunaway Energy & Commodity PricesEra of Fiscal AusterityReshuffling the Global Economic DeckChina Becomes #2 Economy in the WorldNuclear FearsManmade Disasters (e.g., Deepwater Horizon)
Are “Black Swans”everywhere or
does it just seemthat way?
5
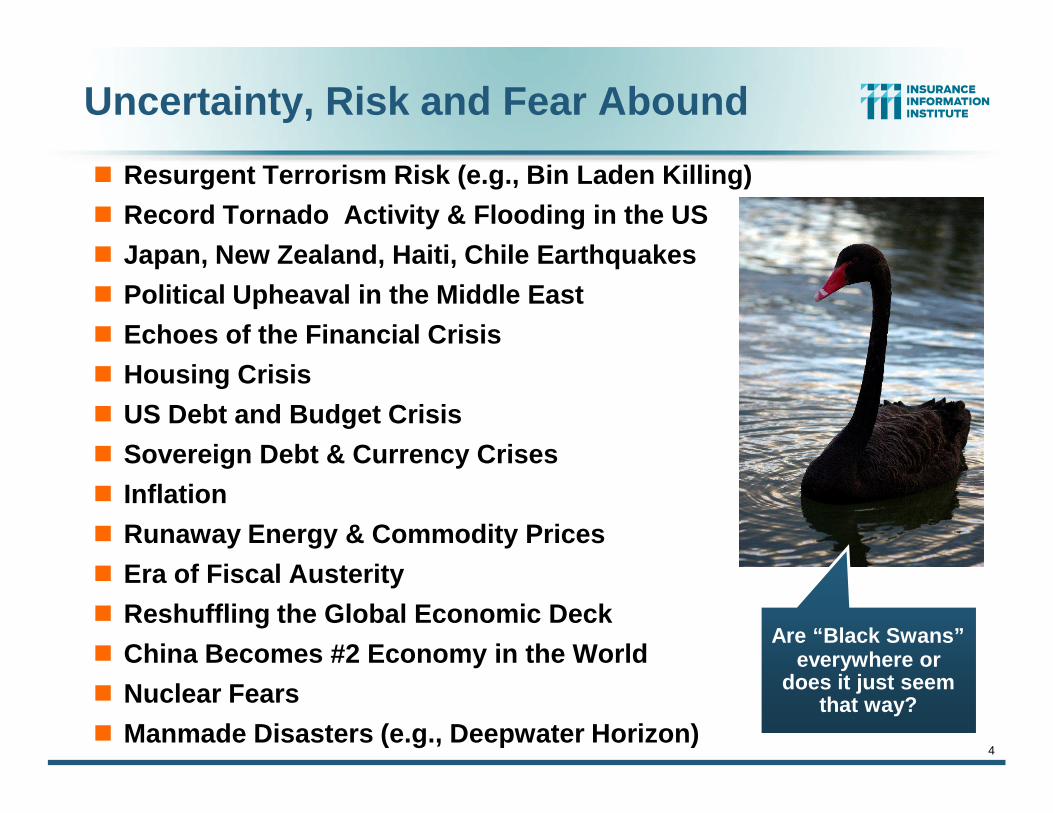
Mississippi River Floods: A Threat toNavigation
Memphis (May 5, 2011)—with theswollen Mississippi flooding fieldsin Arkansas across the river. Theriver is normally ½ mile across but
is now 3 miles wide in places.
Mississippi River just south ofMemphis (May 5, 2011). TN is to the
right, AR to the left. The wasexpected to crest on May at 48 ft., 14
ft. above flood stage and near therecord of 47.8 ft. set in 1937
Sources: Photos by Robert Hartwig, Insurance Information Institute, May 5, 2011.
6
Terrorism, Insurance and theKilling of Osama bin Laden
Is the World Less Risky and Do WeStill Need the Terrorism Risk
Insurance Program?
7
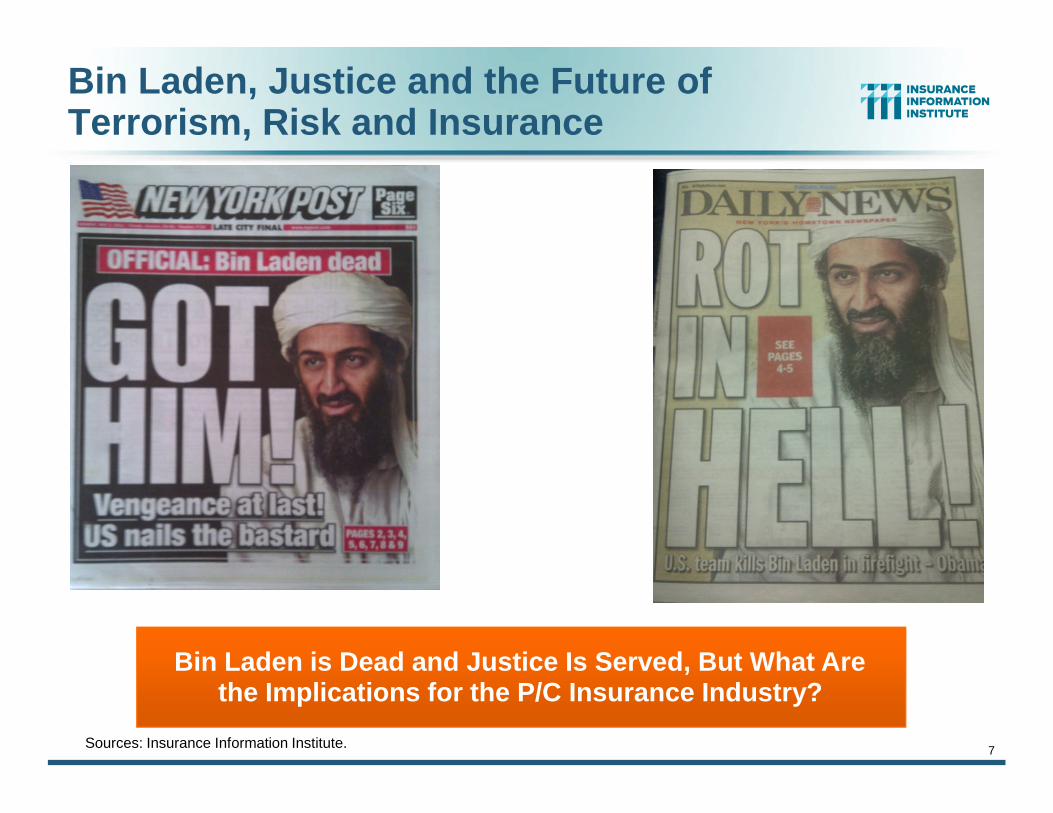
Bin Laden, Justice and the Future ofTerrorism, Risk and Insurance
Sources: Insurance Information Institute.
Property-WTCProperty -
Other
Bin Laden is Dead and Justice Is Served, But What Arethe Implications for the P/C Insurance Industry?
8
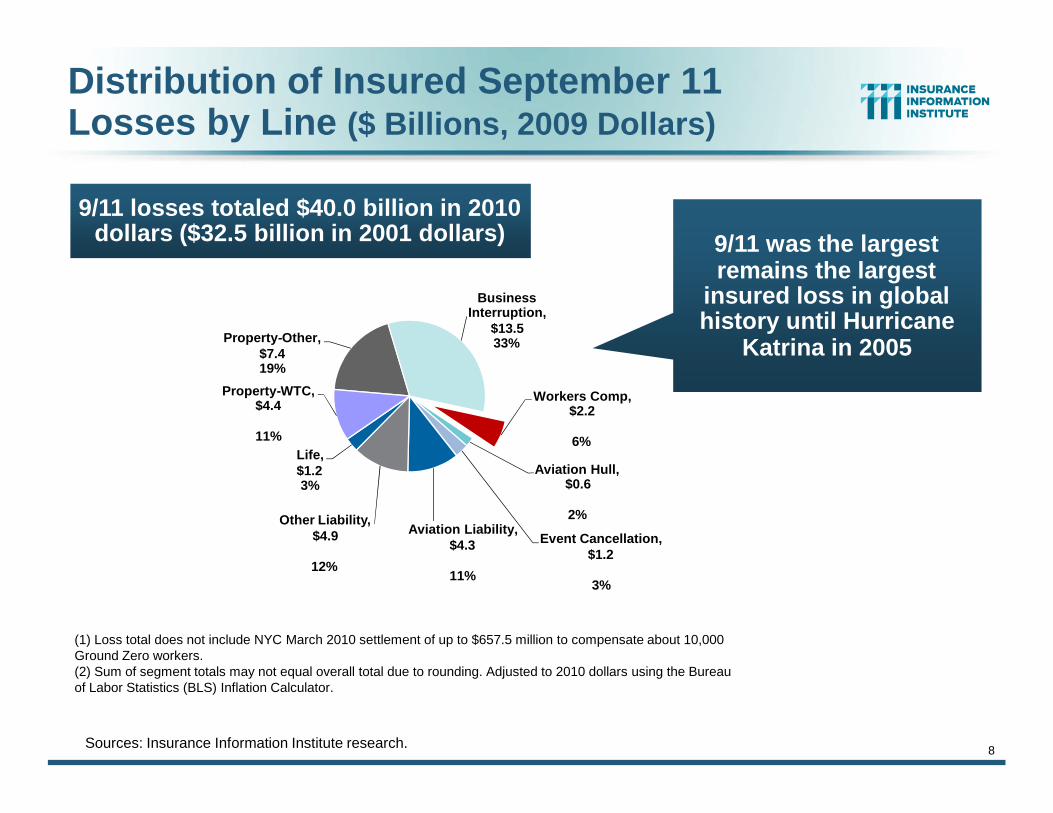
Distribution of Insured September 11Losses by Line ($ Billions, 2009 Dollars)
Sources: Insurance Information Institute research.
Property-WTCProperty -
Other
Property-Other,$7.419%
BusinessInterruption,
$13.533%
Workers Comp,$2.2
6%
Aviation Hull,$0.6
2%
Event Cancellation,$1.2
3%
Aviation Liability,$4.3
11%
Other Liability,$4.9
12%
Life,$1.23%
Property-WTC,$4.4
11%
(1) Loss total does not include NYC March 2010 settlement of up to $657.5 million to compensate about 10,000Ground Zero workers.(2) Sum of segment totals may not equal overall total due to rounding. Adjusted to 2010 dollars using the Bureauof Labor Statistics (BLS) Inflation Calculator.
9/11 losses totaled $40.0 billion in 2010dollars ($32.5 billion in 2001 dollars) 9/11 was the largest
remains the largestinsured loss in globalhistory until Hurricane
Katrina in 2005
9
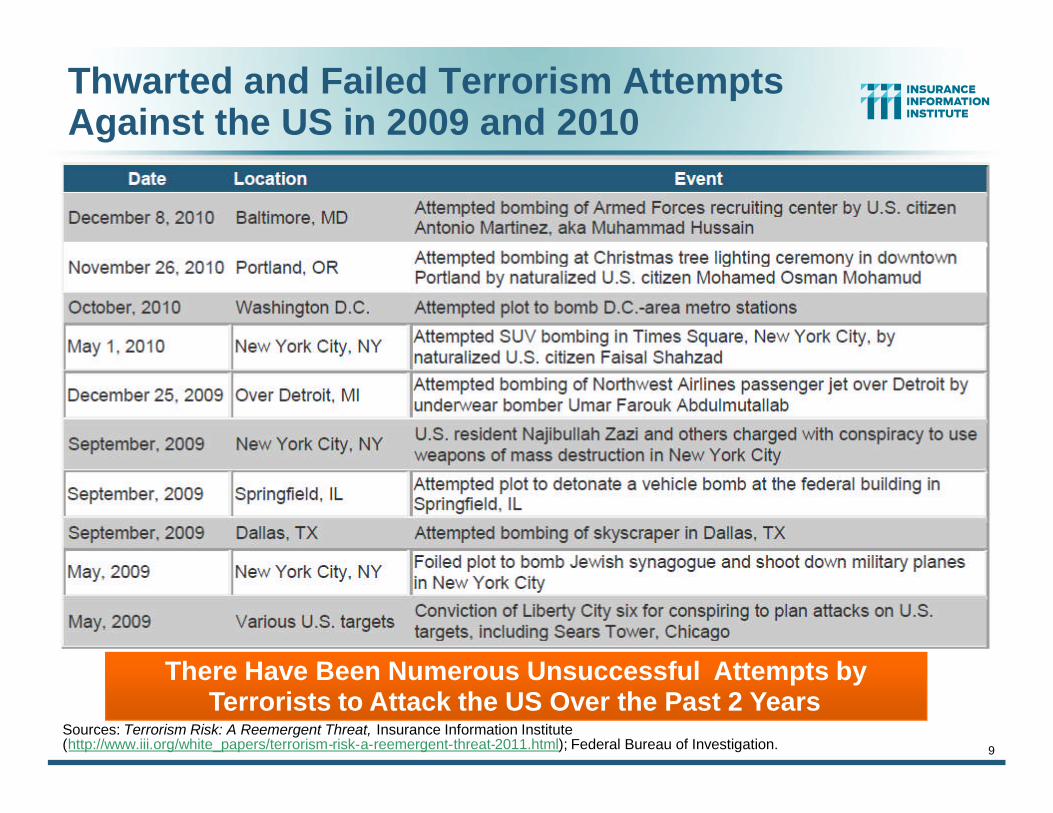
Thwarted and Failed Terrorism AttemptsAgainst the US in 2009 and 2010
Sources: Terrorism Risk: A Reemergent Threat, Insurance Information Institute(http://www.iii.org/white_papers/terrorism-risk-a-reemergent-threat-2011.html); Federal Bureau of Investigation.
Property-WTCProperty -
Other
9/11 remains the largestWC loss in US history($2.2 bn), even though
9/11 property losses weresurpassed by Hurricane
Katrina in 2005
There Have Been Numerous Unsuccessful Attempts byTerrorists to Attack the US Over the Past 2 Years
10
Summary of Japan Earthquake& Impacts on US P/C Markets
The March 11 Quake & Other MajorCATs Are Big Events, But Will They,Can They Impact US P/C Markets?
11
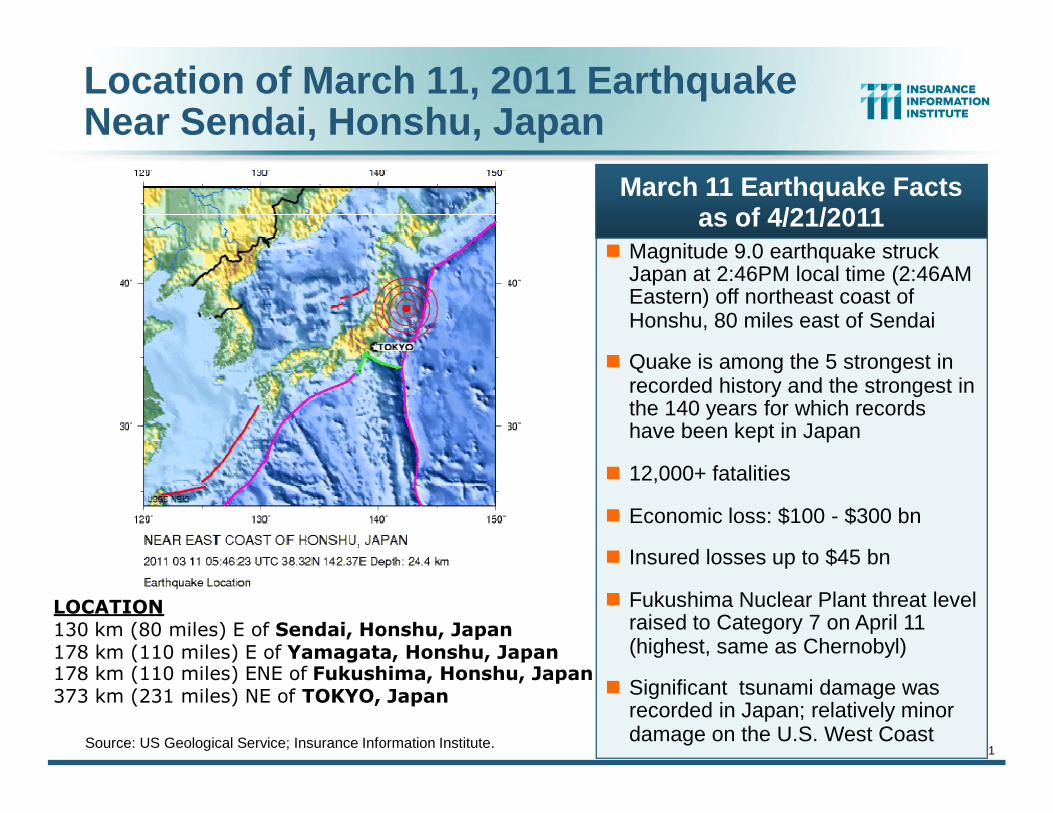
Location of March 11, 2011 EarthquakeNear Sendai, Honshu, Japan
Source: US Geological Service; Insurance Information Institute.
Magnitude 9.0 earthquake struckJapan at 2:46PM local time (2:46AMEastern) off northeast coast ofHonshu, 80 miles east of Sendai
Quake is among the 5 strongest inrecorded history and the strongest inthe 140 years for which recordshave been kept in Japan
12,000+ fatalities
Economic loss: $100 - $300 bn
Insured losses up to $45 bn
Fukushima Nuclear Plant threat levelraised to Category 7 on April 11(highest, same as Chernobyl)
Significant tsunami damage wasrecorded in Japan; relatively minordamage on the U.S. West Coast
March 11 Earthquake Factsas of 4/21/2011
LOCATION130 km (80 miles) E of Sendai, Honshu, Japan178 km (110 miles) E of Yamagata, Honshu, Japan178 km (110 miles) ENE of Fukushima, Honshu, Japan373 km (231 miles) NE of TOKYO, Japan
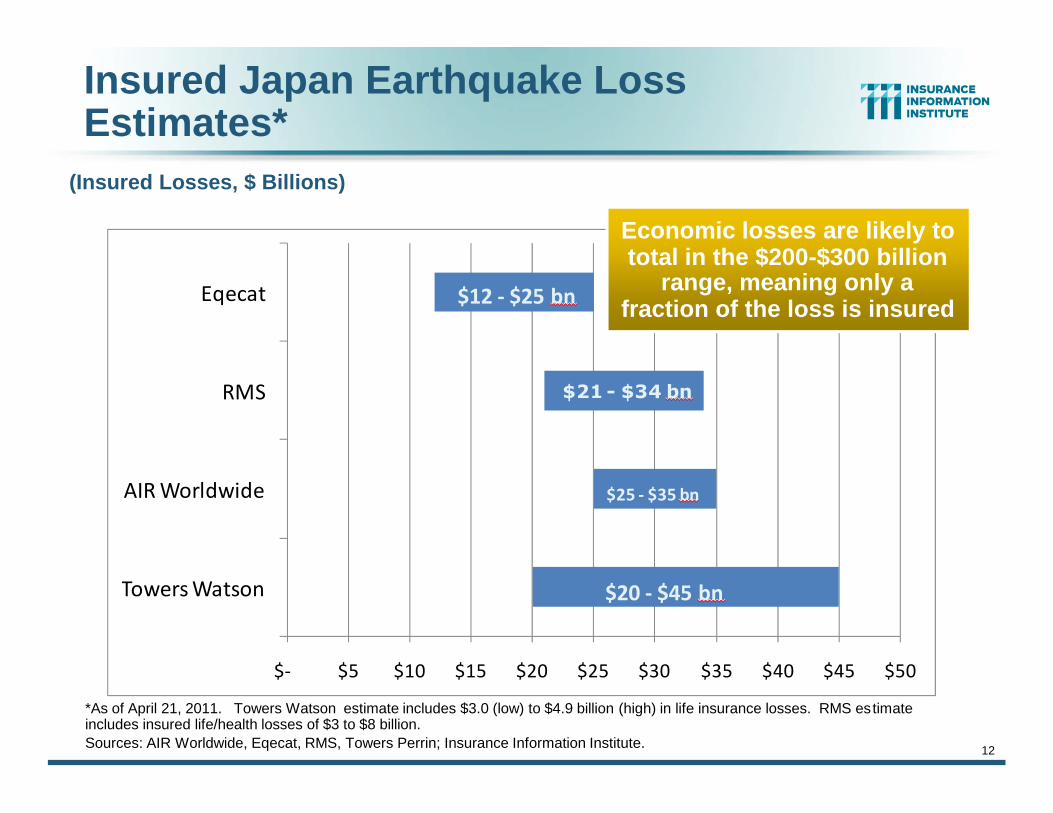
Insured Japan Earthquake LossEstimates*
$- $5 $10 $15 $20 $25 $30 $35 $40 $45 $50
Towers Watson
AIR Worldwide
RMS
Eqecat
$21 - $34 bn
$20 - $45 bn
$12 - $25 bn
$25 - $35 bn
12
*As of April 21, 2011. Towers Watson estimate includes $3.0 (low) to $4.9 billion (high) in life insurance losses. RMS estimateincludes insured life/health losses of $3 to $8 billion.Sources: AIR Worldwide, Eqecat, RMS, Towers Perrin; Insurance Information Institute.
(Insured Losses, $ Billions)
Economic losses are likely tototal in the $200-$300 billion
range, meaning only afraction of the loss is insured
13
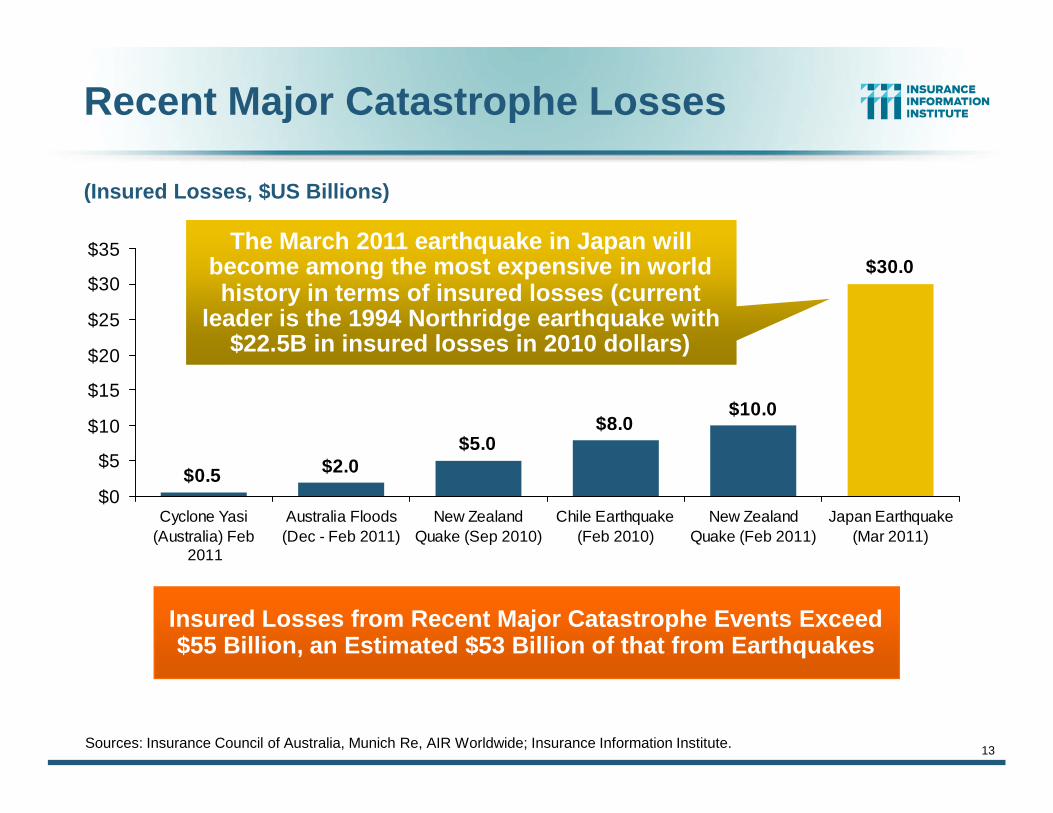
Recent Major Catastrophe Losses
(Insured Losses, $US Billions)
Sources: Insurance Council of Australia, Munich Re, AIR Worldwide; Insurance Information Institute.
$30.0
$10.0$8.0
$5.0$2.0$0.5
$0
$5
$10
$15
$20
$25
$30
$35
Cyclone Yasi(Australia) Feb
2011
Australia Floods(Dec - Feb 2011)
New ZealandQuake (Sep 2010)
Chile Earthquake(Feb 2010)
New ZealandQuake (Feb 2011)
Japan Earthquake(Mar 2011)
Insured Losses from Recent Major Catastrophe Events Exceed$55 Billion, an Estimated $53 Billion of that from Earthquakes
The March 2011 earthquake in Japan willbecome among the most expensive in worldhistory in terms of insured losses (current
leader is the 1994 Northridge earthquake with$22.5B in insured losses in 2010 dollars)
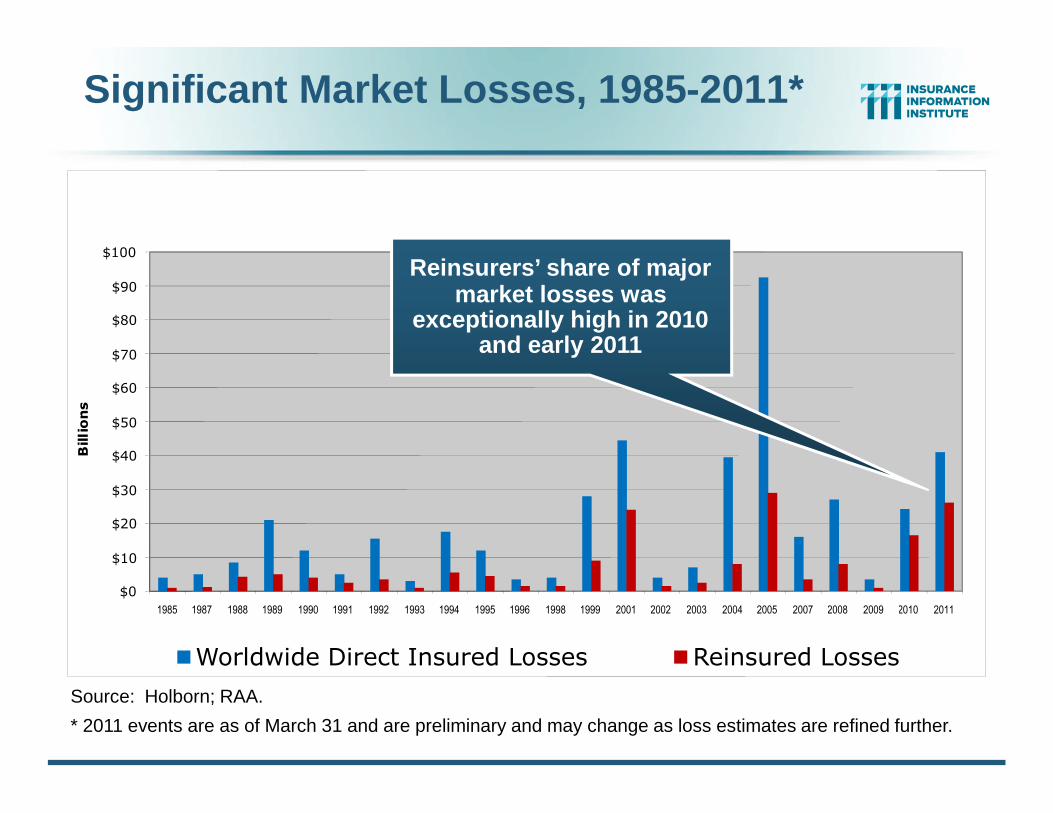
$0
$10
$20
$30
$40
$50
$60
$70
$80
$90
$100
1985 1987 1988 1989 1990 1991 1992 1993 1994 1995 1996 1998 1999 2001 2002 2003 2004 2005 2007 2008 2009 2010 2011
Bill
ion
s
Worldwide Direct Insured Losses Reinsured Losses
Reinsurers’ share of majormarket losses was
exceptionally high in 2010and early 2011
Source: Holborn; RAA.
* 2011 events are as of March 31 and are preliminary and may change as loss estimates are refined further.
Significant Market Losses, 1985-2011*
15
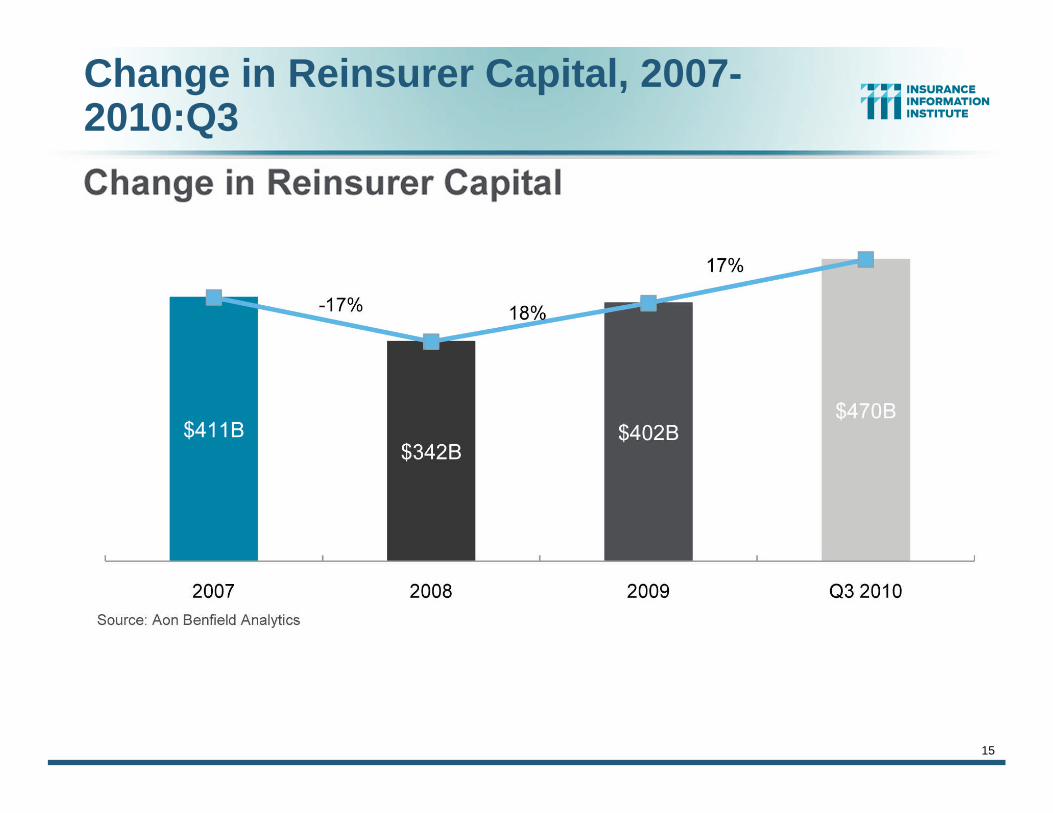
Change in Reinsurer Capital, 2007-2010:Q3
16
Potential Impacts of JapanQuake & Other Major CATs on
P/C (Re)Insurance Markets
Impacts Could Be Felt WellBeyond Japan
17
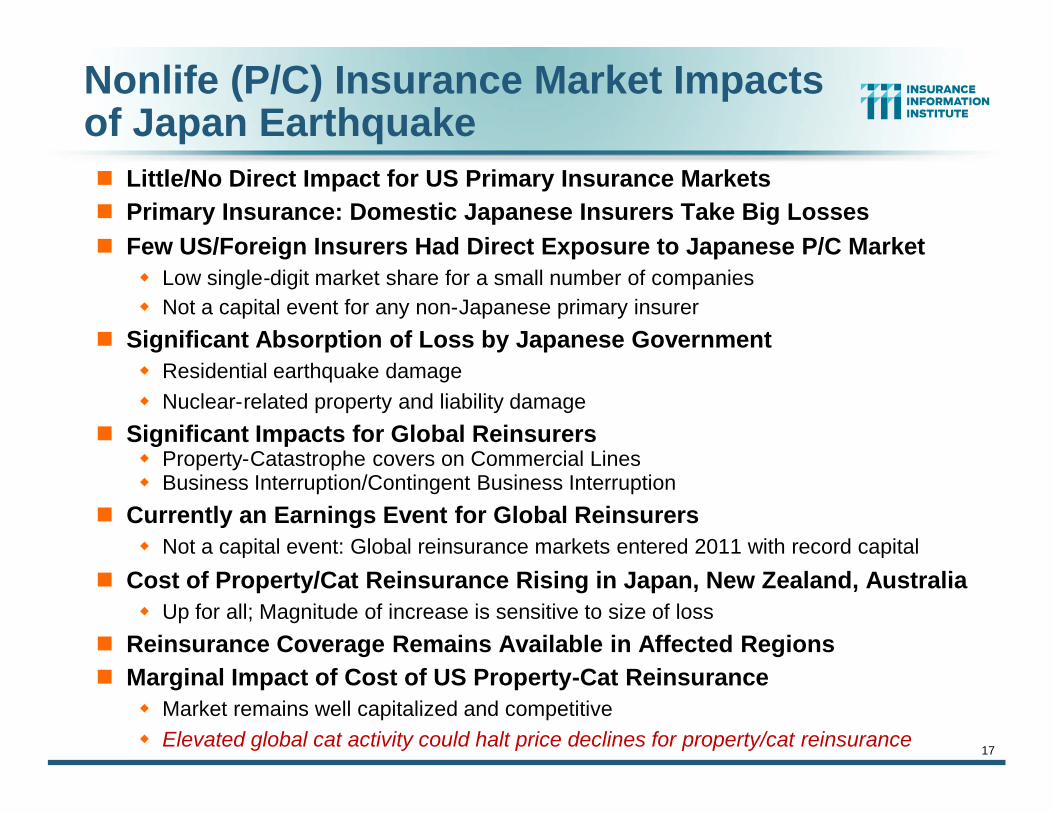
Nonlife (P/C) Insurance Market Impactsof Japan Earthquake Little/No Direct Impact for US Primary Insurance Markets Primary Insurance: Domestic Japanese Insurers Take Big Losses Few US/Foreign Insurers Had Direct Exposure to Japanese P/C Market
Low single-digit market share for a small number of companiesNot a capital event for any non-Japanese primary insurer
Significant Absorption of Loss by Japanese GovernmentResidential earthquake damageNuclear-related property and liability damage
Significant Impacts for Global ReinsurersProperty-Catastrophe covers on Commercial LinesBusiness Interruption/Contingent Business Interruption
Currently an Earnings Event for Global ReinsurersNot a capital event: Global reinsurance markets entered 2011 with record capital
Cost of Property/Cat Reinsurance Rising in Japan, New Zealand, AustraliaUp for all; Magnitude of increase is sensitive to size of loss
Reinsurance Coverage Remains Available in Affected Regions Marginal Impact of Cost of US Property-Cat Reinsurance
Market remains well capitalized and competitiveElevated global cat activity could halt price declines for property/cat reinsurance
18
Summary of April 2011Tornado Outbreak
2011 Will Be Among the MostDeadly and Expensive for
Tornadoes in History
19
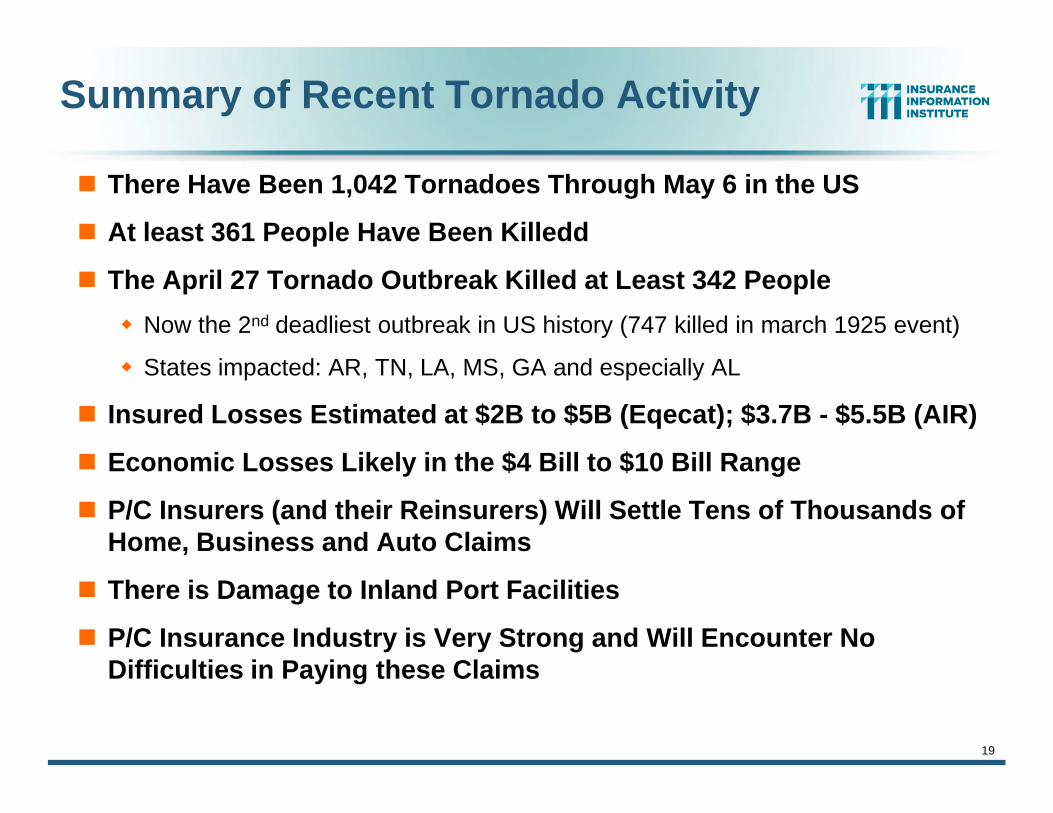
Summary of Recent Tornado Activity
There Have Been 1,042 Tornadoes Through May 6 in the US
At least 361 People Have Been Killedd
The April 27 Tornado Outbreak Killed at Least 342 People
Now the 2nd deadliest outbreak in US history (747 killed in march 1925 event)
States impacted: AR, TN, LA, MS, GA and especially AL
Insured Losses Estimated at $2B to $5B (Eqecat); $3.7B - $5.5B (AIR)
Economic Losses Likely in the $4 Bill to $10 Bill Range
P/C Insurers (and their Reinsurers) Will Settle Tens of Thousands ofHome, Business and Auto Claims
There is Damage to Inland Port Facilities
P/C Insurance Industry is Very Strong and Will Encounter NoDifficulties in Paying these Claims
20
1,1
33
1,13
2 1,2
97
1,17
3
1,08
2 1,2
34
1,17
3
1,1
48
1,42
4
1,34
5
1,0
71 1,2
16
941
1,37
6
1,26
4
1,10
3
1,0
98
1,69
2
1,15
6 1,2
82
1,819
1,04
2
361
0
200
400
600
800
1,000
1,200
1,400
1,600
1,800
2,000
90 91 92 93 94 95 96 97 98 99 00 01 02 03 04 05 06 07 08 09 10 11P
Nu
mbe
rof
Tor
nad
oes
0
50
100
150
200
250
300
350
400
Nu
mb
erofD
eaths
Number of Tornadoes
Number of Deaths
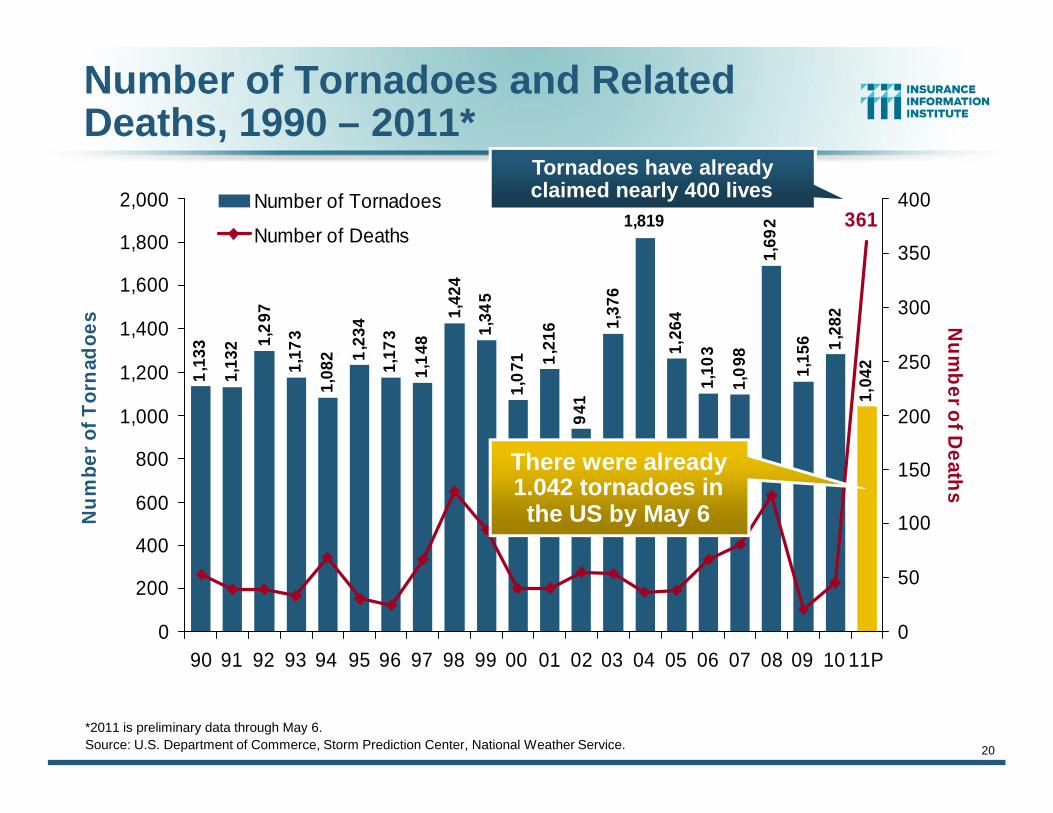
*2011 is preliminary data through May 6.Source: U.S. Department of Commerce, Storm Prediction Center, National Weather Service.
Number of Tornadoes and RelatedDeaths, 1990 – 2011*
Tornadoes have alreadyclaimed nearly 400 lives
There were already1.042 tornadoes inthe US by May 6
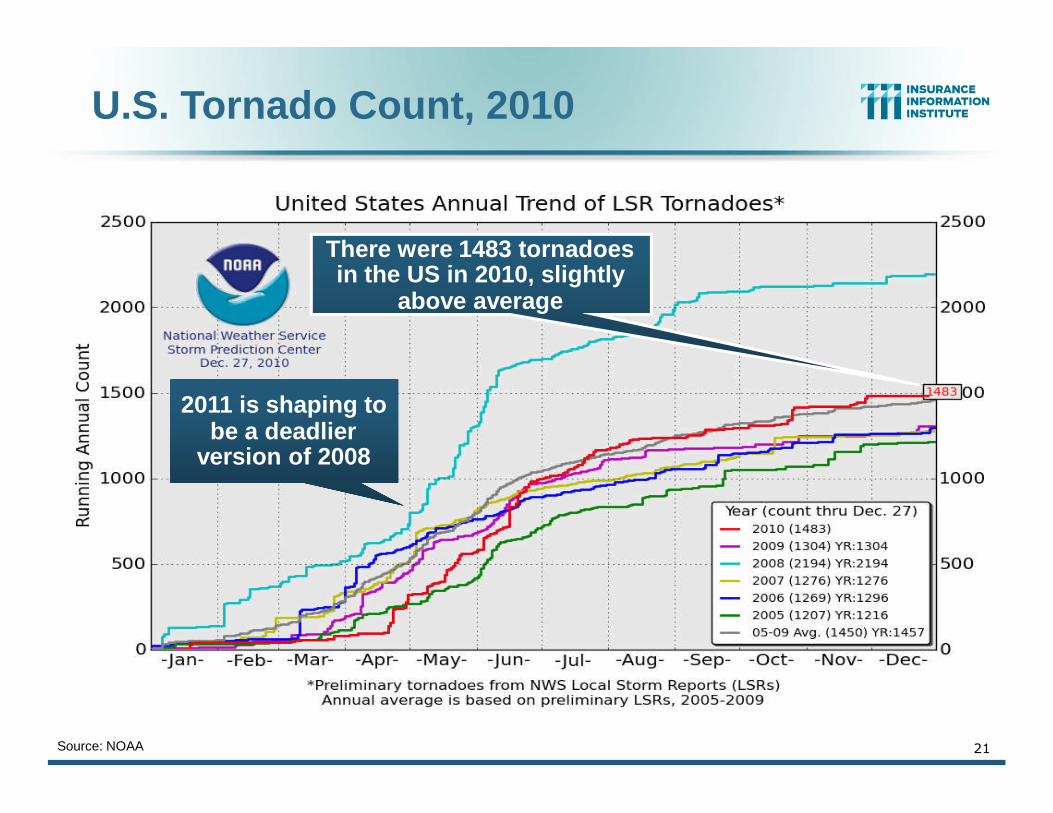
U.S. Tornado Count, 2010
Source: NOAA 21
There were 1483 tornadoesin the US in 2010, slightly
above average
2011 is shaping tobe a deadlier
version of 2008
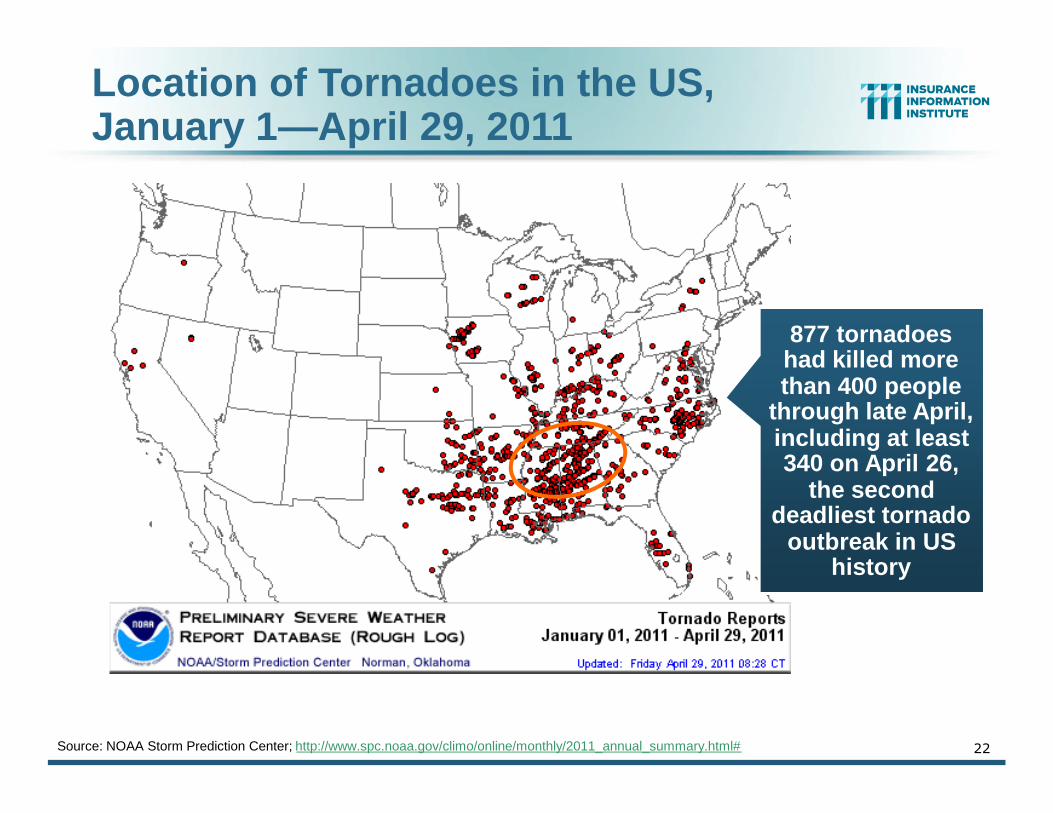
Location of Tornadoes in the US,January 1—April 29, 2011
Source: NOAA Storm Prediction Center; http://www.spc.noaa.gov/climo/online/monthly/2011_annual_summary.html# 22
877 tornadoeshad killed morethan 400 people
through late April,including at least340 on April 26,
the seconddeadliest tornado
outbreak in UShistory
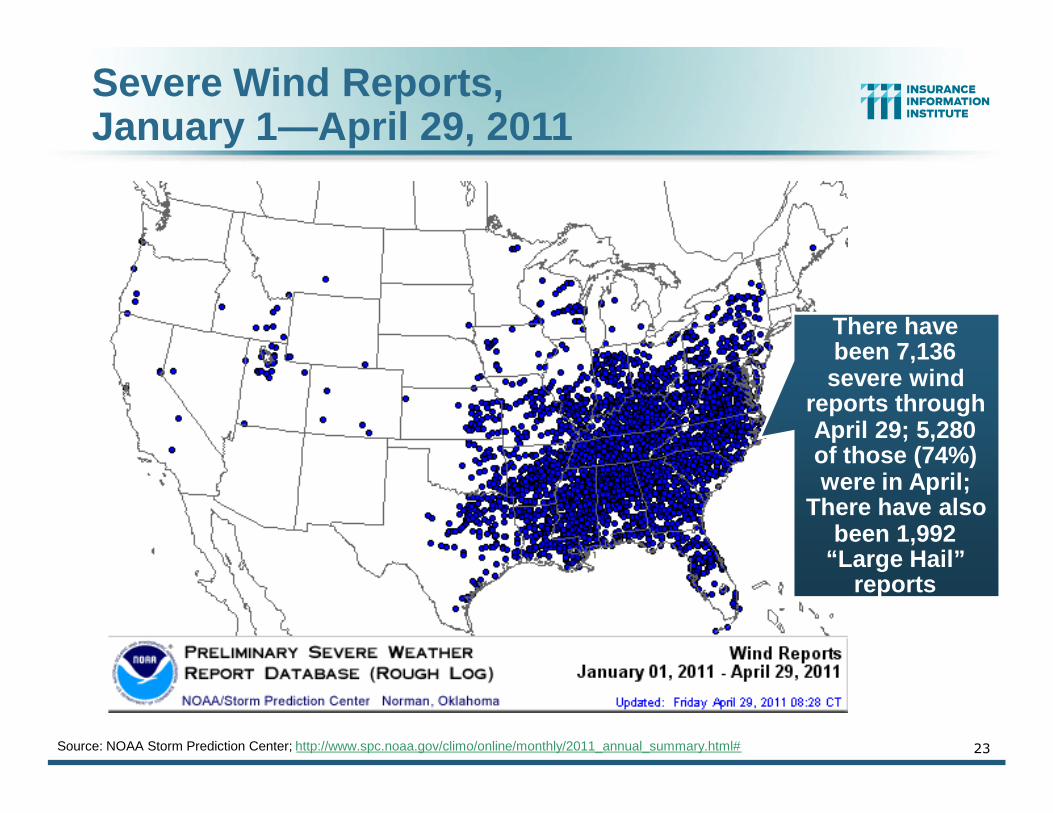
Severe Wind Reports,January 1—April 29, 2011
23
There havebeen 7,136severe wind
reports throughApril 29; 5,280of those (74%)were in April;
There have alsobeen 1,992
“Large Hail”reports
Source: NOAA Storm Prediction Center; http://www.spc.noaa.gov/climo/online/monthly/2011_annual_summary.html#
24
Global Catastrophe Losses HaveInterrupted Trade Flows
Ships, Ports Damaged
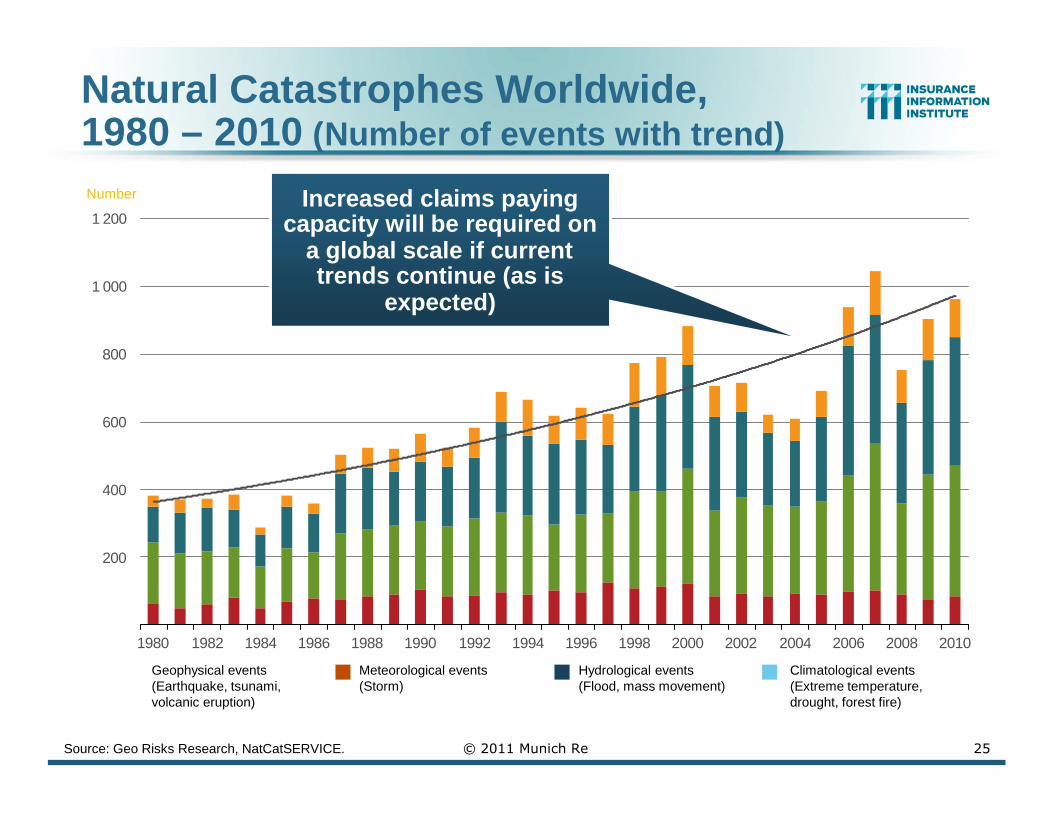
Natural Catastrophes Worldwide,1980 – 2010 (Number of events with trend)
Number
Meteorological events(Storm)
Hydrological events(Flood, mass movement)
Climatological events(Extreme temperature,drought, forest fire)
Geophysical events(Earthquake, tsunami,volcanic eruption)
200
400
600
800
1 000
1 200
1980 1982 1984 1986 1988 1990 1992 1994 1996 1998 2000 2002 2004 2006 2008 2010
Source: Geo Risks Research, NatCatSERVICE. 25© 2011 Munich Re
Increased claims payingcapacity will be required on
a global scale if currenttrends continue (as is
expected)
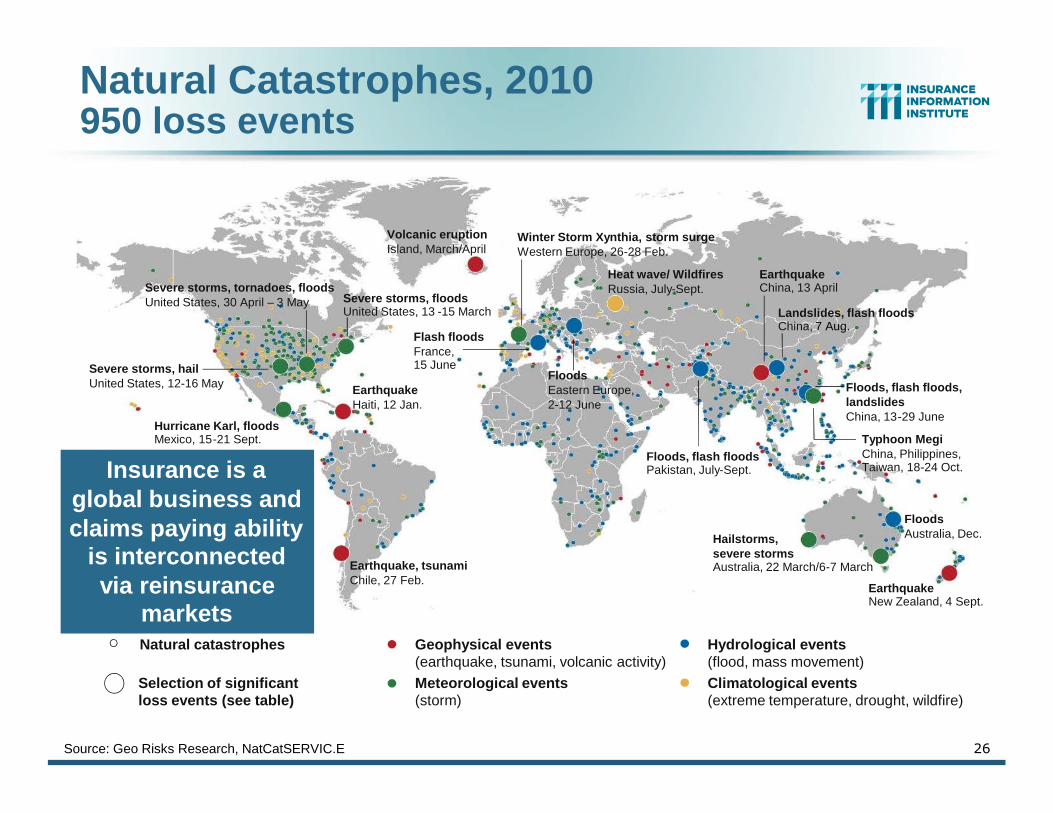
Geophysical events(earthquake, tsunami, volcanic activity)Meteorological events(storm)
Hydrological events(flood, mass movement)Climatological events(extreme temperature, drought, wildfire)
Selection of significantloss events (see table)
Natural catastrophes
Volcanic eruptionIsland, March/April
Heat wave/ WildfiresRussia, July-Sept.
Severe storms, floodsUnited States, 13 -15 March
EarthquakeHaiti, 12 Jan.
Hurricane Karl, floodsMexico, 15-21 Sept.
Earthquake, tsunamiChile, 27 Feb.
Winter Storm Xynthia, storm surgeWestern Europe, 26-28 Feb.
Flash floodsFrance,15 June
Floods, flash floodsPakistan, July-Sept.
EarthquakeChina, 13 April
FloodsEastern Europe,2-12 June
Floods, flash floods,landslidesChina, 13-29 June
Landslides, flash floodsChina, 7 Aug.
Hailstorms,severe stormsAustralia, 22 March/6-7 March
EarthquakeNew Zealand, 4 Sept.
Severe storms, hailUnited States, 12-16 May
Severe storms, tornadoes, floodsUnited States, 30 April – 3 May
Typhoon MegiChina, Philippines,Taiwan, 18-24 Oct.
FloodsAustralia, Dec.
Natural Catastrophes, 2010950 loss events
Source: Geo Risks Research, NatCatSERVIC.E 26
Insurance is aglobal business andclaims paying ability
is interconnectedvia reinsurance
markets
27
The Global Financial Crisis,Risk and the New World
Economic Order
The Crisis Made Insurers’ Path toGrowth More Challenging/Risky
28
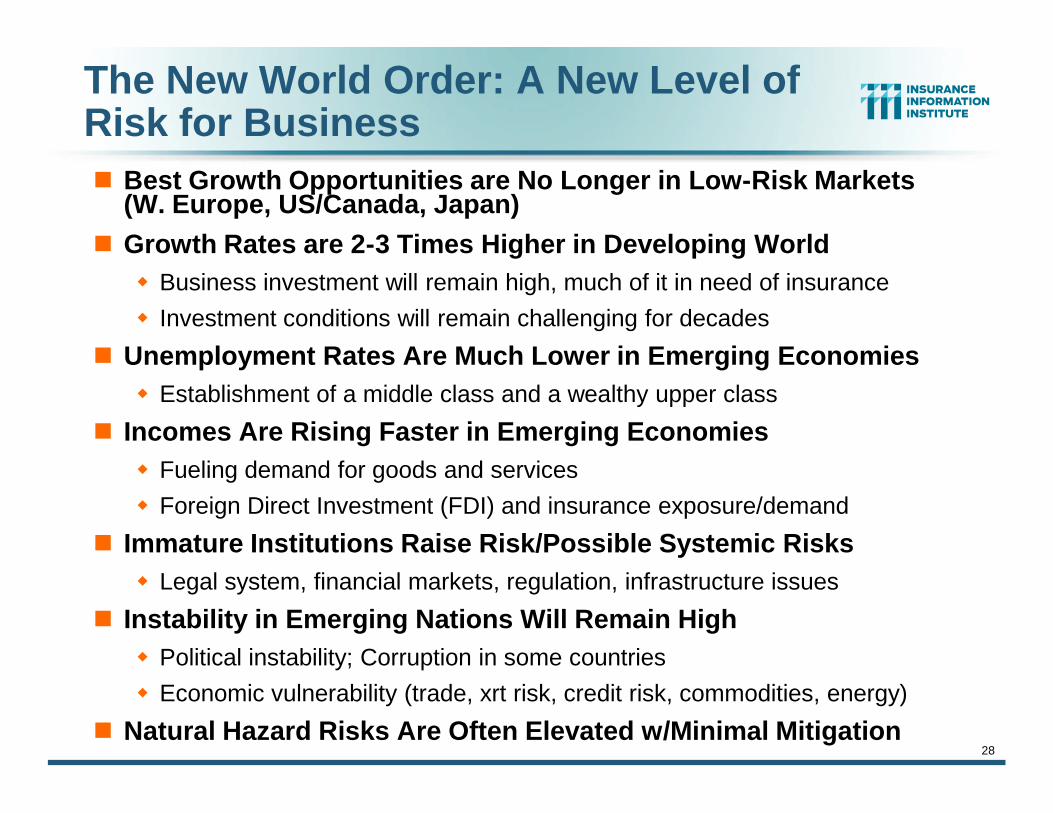
The New World Order: A New Level ofRisk for BusinessBest Growth Opportunities are No Longer in Low-Risk Markets
(W. Europe, US/Canada, Japan)Growth Rates are 2-3 Times Higher in Developing WorldBusiness investment will remain high, much of it in need of insuranceInvestment conditions will remain challenging for decades
Unemployment Rates Are Much Lower in Emerging EconomiesEstablishment of a middle class and a wealthy upper class
Incomes Are Rising Faster in Emerging EconomiesFueling demand for goods and servicesForeign Direct Investment (FDI) and insurance exposure/demand
Immature Institutions Raise Risk/Possible Systemic RisksLegal system, financial markets, regulation, infrastructure issues
Instability in Emerging Nations Will Remain HighPolitical instability; Corruption in some countriesEconomic vulnerability (trade, xrt risk, credit risk, commodities, energy)
Natural Hazard Risks Are Often Elevated w/Minimal Mitigation
29
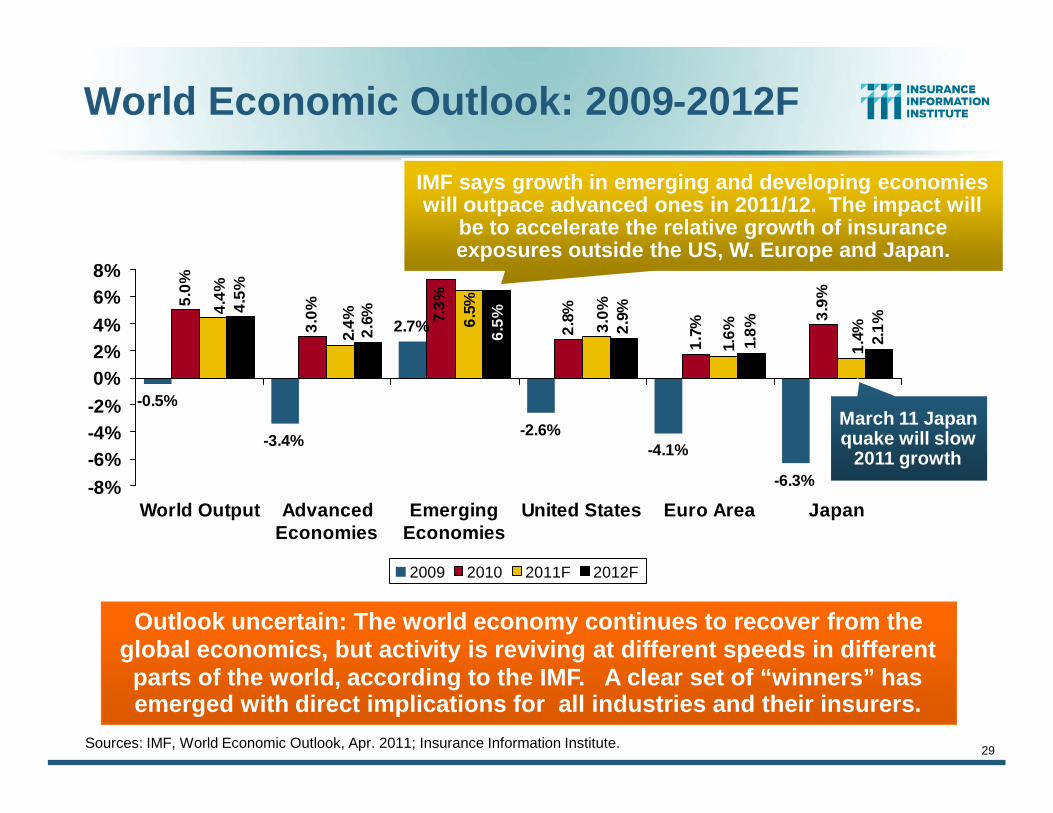
World Economic Outlook: 2009-2012F
Sources: IMF, World Economic Outlook, Apr. 2011; Insurance Information Institute.
5.0%
3.0%
2.8%
1.7%
3.9%4.5%
2.6% 2.9%
1.8% 2.1%
-0.5%
-3.4%
2.7%
-2.6%-4.1%
-6.3%
7.3%4.
4%
2.4% 6.
5%
3.0%
1.6%
1.4%6.
5%-8%-6%-4%-2%0%2%4%6%8%
World Output AdvancedEconomies
EmergingEconomies
United States Euro Area Japan
2009 2010 2011F 2012F
Outlook uncertain: The world economy continues to recover from theglobal economics, but activity is reviving at different speeds in differentparts of the world, according to the IMF. A clear set of “winners” hasemerged with direct implications for all industries and their insurers.
IMF says growth in emerging and developing economieswill outpace advanced ones in 2011/12. The impact will
be to accelerate the relative growth of insuranceexposures outside the US, W. Europe and Japan.
March 11 Japanquake will slow
2011 growth

30
World Trade Volume Outlook (Goodsand Services): 2009-2012F
Sources: IMF, World Economic Outlook, Apr. 2011; Insurance Information Institute.
-7.5%
12.4
%
13.5
%
8.8%
6.9% 9.
4%
5.9% 8.
7%
-10.9% -12.6%-8.3%
-12.2%
14.5
%
12.0
%
11.2
%
7.4%
5.8%
10.2
%
6.8%
6.5%
-15%-10%
-5%0%5%
10%15%20%
WorldTrade
Volume
AdvancedEconomies
EmergingEconomies
AdvancedEconomies
EmergingEconomies
2009 2010 2011F 2012F
Global trade in flows recovered sharply following the financialcrisis, with both imports and exports rising sharply
IMPORTS EXPORTS

31
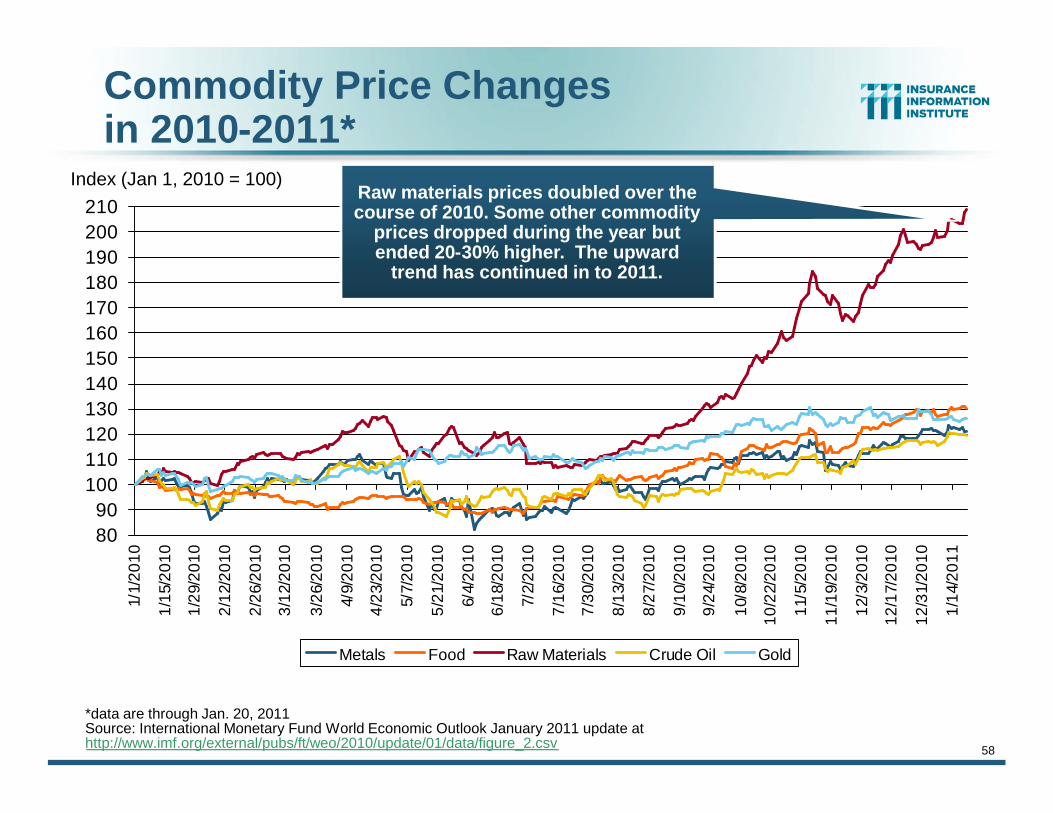
Commodity Price Changesin 2010-2011*
8090
100110120130140150160170180190200210
1/1/
2010
1/15
/201
0
1/29
/201
0
2/12
/201
0
2/26
/201
0
3/12
/201
0
3/26
/201
0
4/9/
2010
4/23
/201
0
5/7/
2010
5/21
/201
0
6/4/
2010
6/18
/201
0
7/2/
2010
7/16
/201
0
7/30
/201
0
8/13
/201
0
8/27
/201
0
9/10
/201
0
9/24
/201
0
10/8
/201
0
10/2
2/20
10
11/5
/201
0
11/1
9/20
10
12/3
/201
0
12/1
7/20
10
12/3
1/20
10
1/14
/201
1
Metals Food Raw Materials Crude Oil Gold
*data are through Jan. 20, 2011Source: International Monetary Fund World Economic Outlook January 2011 update athttp://www.imf.org/external/pubs/ft/weo/2010/update/01/data/figure_2.csv
Index (Jan 1, 2010 = 100)Raw materials prices doubled over thecourse of 2010. Some other commodity
prices dropped during the year butended 20-30% higher. The upward
trend has continued in to 2011.

65
70
75
80
85
90
95
100
105
110
115
Jan00
Jan01
Jan02
Jan03
Jan04
Jan05
Jan06
Jan07
Jan08
Jan09
Jan10
Jan11
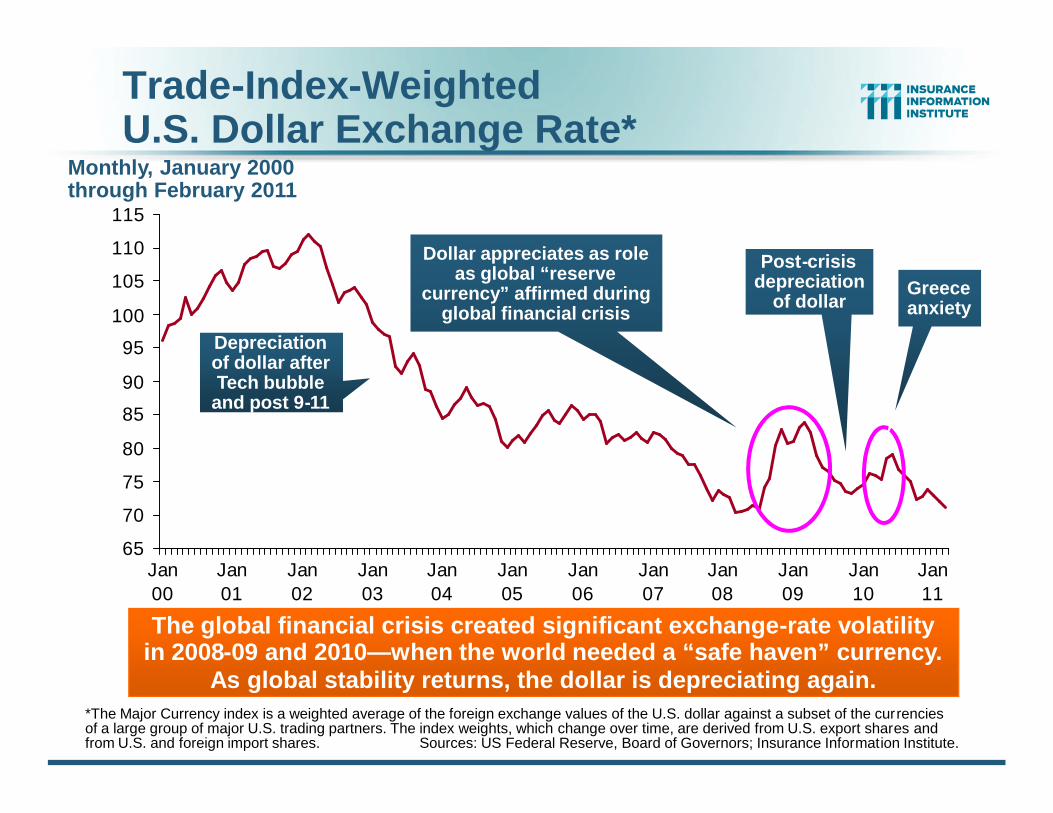
Trade-Index-WeightedU.S. Dollar Exchange Rate*
*The Major Currency index is a weighted average of the foreign exchange values of the U.S. dollar against a subset of the currenciesof a large group of major U.S. trading partners. The index weights, which change over time, are derived from U.S. export shares andfrom U.S. and foreign import shares. Sources: US Federal Reserve, Board of Governors; Insurance Information Institute.
The global financial crisis created significant exchange-rate volatilityin 2008-09 and 2010—when the world needed a “safe haven” currency.
As global stability returns, the dollar is depreciating again.
Monthly, January 2000through February 2011
Depreciationof dollar afterTech bubble
and post 9-11
Post-crisisdepreciation
of dollar
Dollar appreciates as roleas global “reserve
currency” affirmed duringglobal financial crisis
Greeceanxiety

33
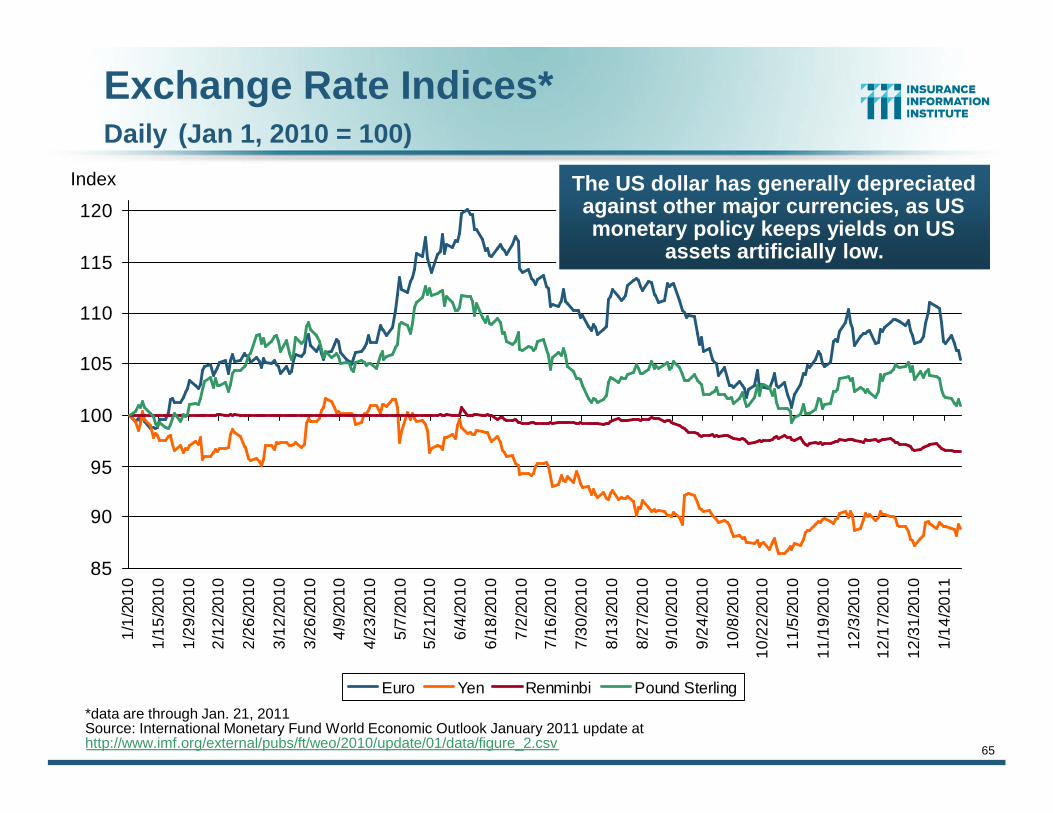
Exchange Rate Indices*Daily (Jan 1, 2010 = 100)
85
90
95
100
105
110
115
120
1/1/
2010
1/15
/201
0
1/29
/201
0
2/12
/201
0
2/26
/201
0
3/12
/201
0
3/26
/201
0
4/9/
2010
4/23
/201
0
5/7/
2010
5/21
/201
0
6/4/
2010
6/18
/201
0
7/2/
2010
7/16
/201
0
7/30
/201
0
8/13
/201
0
8/27
/201
0
9/10
/201
0
9/24
/201
0
10/8
/201
0
10/2
2/20
10
11/5
/201
0
11/1
9/20
10
12/3
/201
0
12/1
7/20
10
12/3
1/20
10
1/14
/201
1
Euro Yen Renminbi Pound Sterling
*data are through Jan. 21, 2011Source: International Monetary Fund World Economic Outlook January 2011 update athttp://www.imf.org/external/pubs/ft/weo/2010/update/01/data/figure_2.csv
Index The US dollar has generally depreciatedagainst other major currencies, as USmonetary policy keeps yields on US
assets artificially low.
34
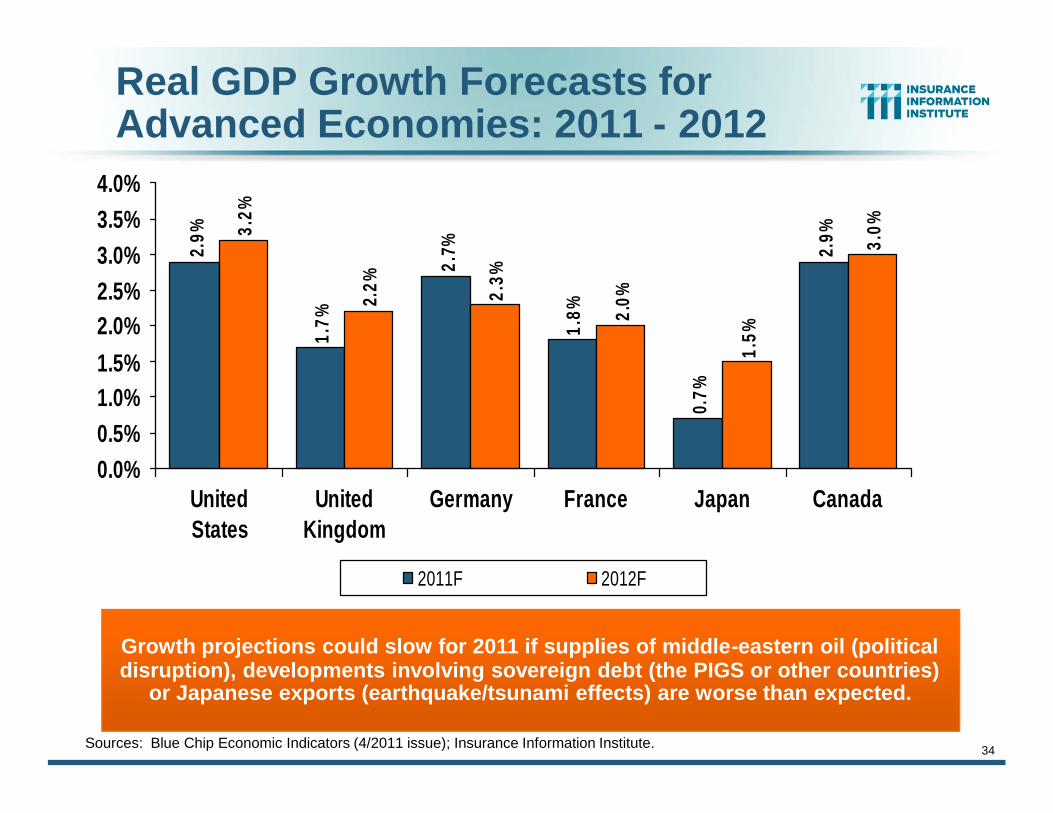
Real GDP Growth Forecasts forAdvanced Economies: 2011 - 2012
Sources: Blue Chip Economic Indicators (4/2011 issue); Insurance Information Institute.
2.9%
1.7%
2.7%
1.8%
0.7%
2.9%3.
2%
2.2% 2.3%
2.0%
1.5%
3.0%
0.0%0.5%1.0%1.5%2.0%2.5%3.0%3.5%4.0%
UnitedStates
UnitedKingdom
Germany France Japan Canada
2011F 2012F
Growth projections could slow for 2011 if supplies of middle-eastern oil (politicaldisruption), developments involving sovereign debt (the PIGS or other countries)
or Japanese exports (earthquake/tsunami effects) are worse than expected.
35
9.0%
8.0%
4.5%
4.4%
4.1%
9.0%
8.0%
4.5% 4.
8%
3.9%
0%
4%
8%
12%
China India Russia Brazil Mexico
2011F 2012F
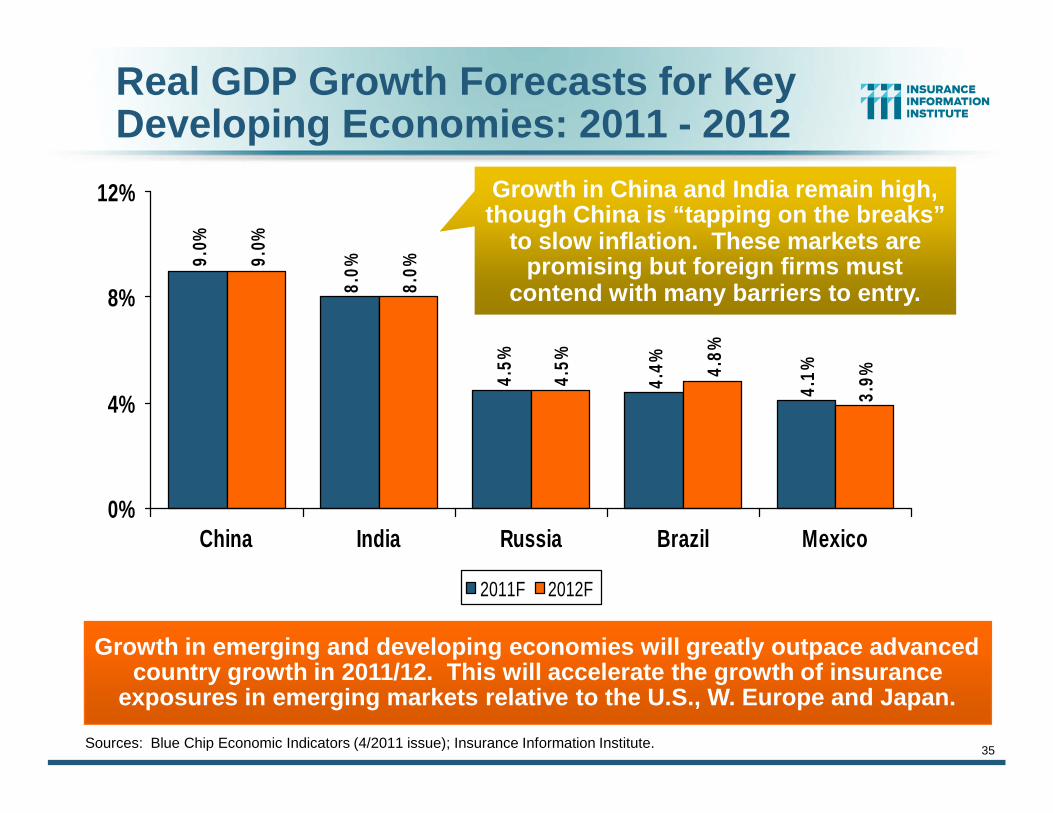
Growth in emerging and developing economies will greatly outpace advancedcountry growth in 2011/12. This will accelerate the growth of insurance
exposures in emerging markets relative to the U.S., W. Europe and Japan.
Real GDP Growth Forecasts for KeyDeveloping Economies: 2011 - 2012
Sources: Blue Chip Economic Indicators (4/2011 issue); Insurance Information Institute.
Growth in China and India remain high,though China is “tapping on the breaks”
to slow inflation. These markets arepromising but foreign firms must
contend with many barriers to entry.
36
4.3% 4.5%
1.8%
4.9%
3.0%
4.3% 4.
9%
1.8%
4.5%
3.6%
0%
4%
8%
South Korea Taiwan Netherlands Hong Kong Australia
2011F 2012F
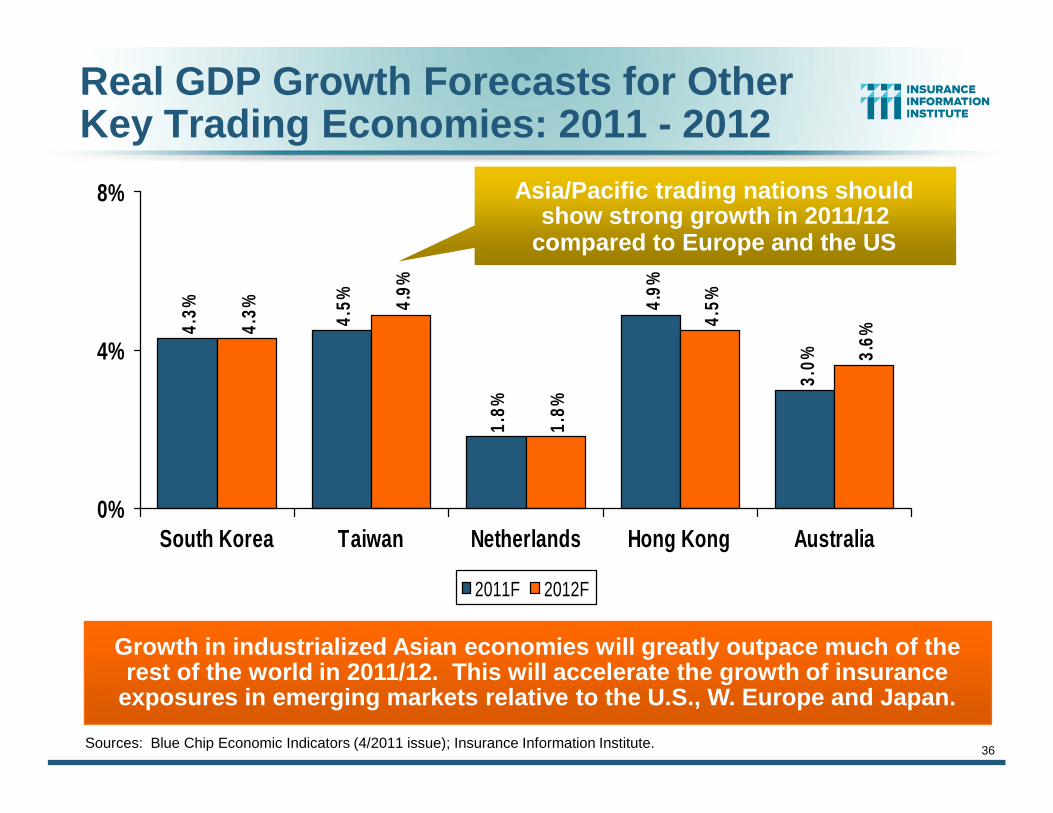
Growth in industrialized Asian economies will greatly outpace much of therest of the world in 2011/12. This will accelerate the growth of insurance
exposures in emerging markets relative to the U.S., W. Europe and Japan.
Real GDP Growth Forecasts for OtherKey Trading Economies: 2011 - 2012
Sources: Blue Chip Economic Indicators (4/2011 issue); Insurance Information Institute.
Asia/Pacific trading nations shouldshow strong growth in 2011/12
compared to Europe and the US
(4.0)
(2.0)
0.0
2.0
4.0
6.0
8.0
10.0
70 71 72 73 74 75 76 77 78 79 80 81 82 83 84 85 86 87 88 89 90 91 92 93 94 95 96 97 98 99 00 01 02 03 04 05 06 07 08 09 10 11 12
Advanced economies Emerging and developing economies World
Source: International Monetary Fund, World Economic Outlook Update, January 2011; Ins. Info. Institute.
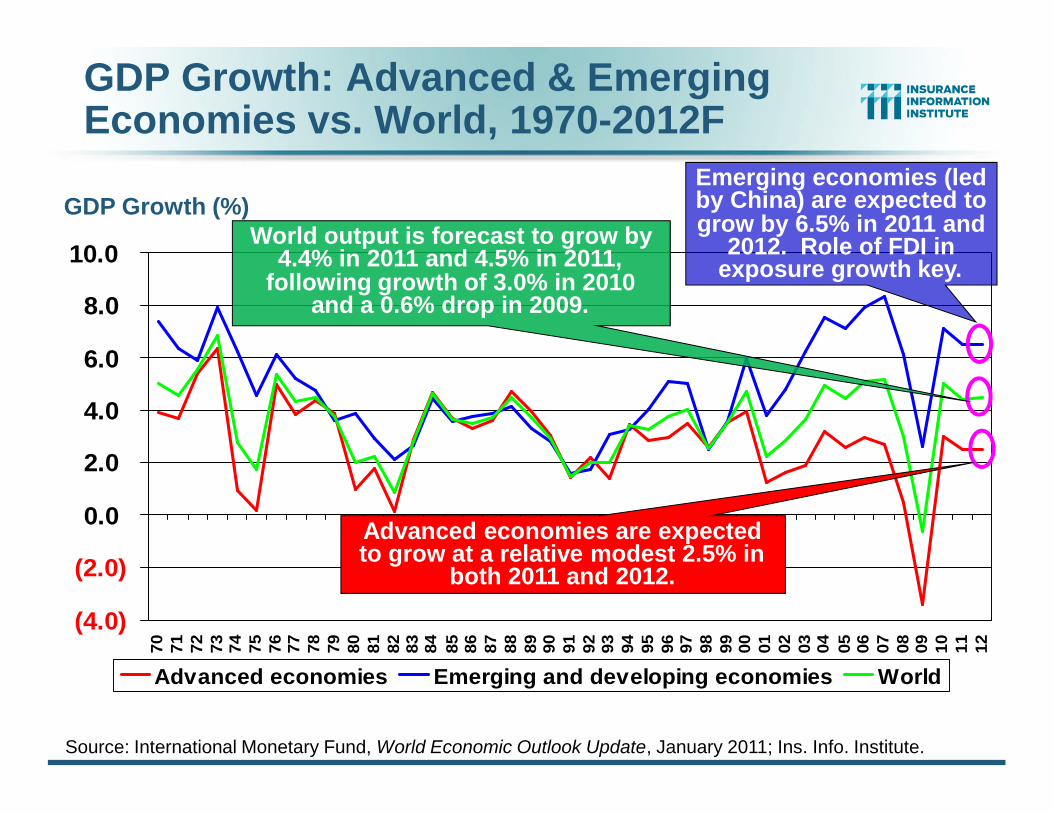
Emerging economies (ledby China) are expected togrow by 6.5% in 2011 and
2012. Role of FDI inexposure growth key.
GDP Growth: Advanced & EmergingEconomies vs. World, 1970-2012F
Advanced economies are expectedto grow at a relative modest 2.5% in
both 2011 and 2012.
World output is forecast to grow by4.4% in 2011 and 4.5% in 2011,
following growth of 3.0% in 2010and a 0.6% drop in 2009.
GDP Growth (%)
38
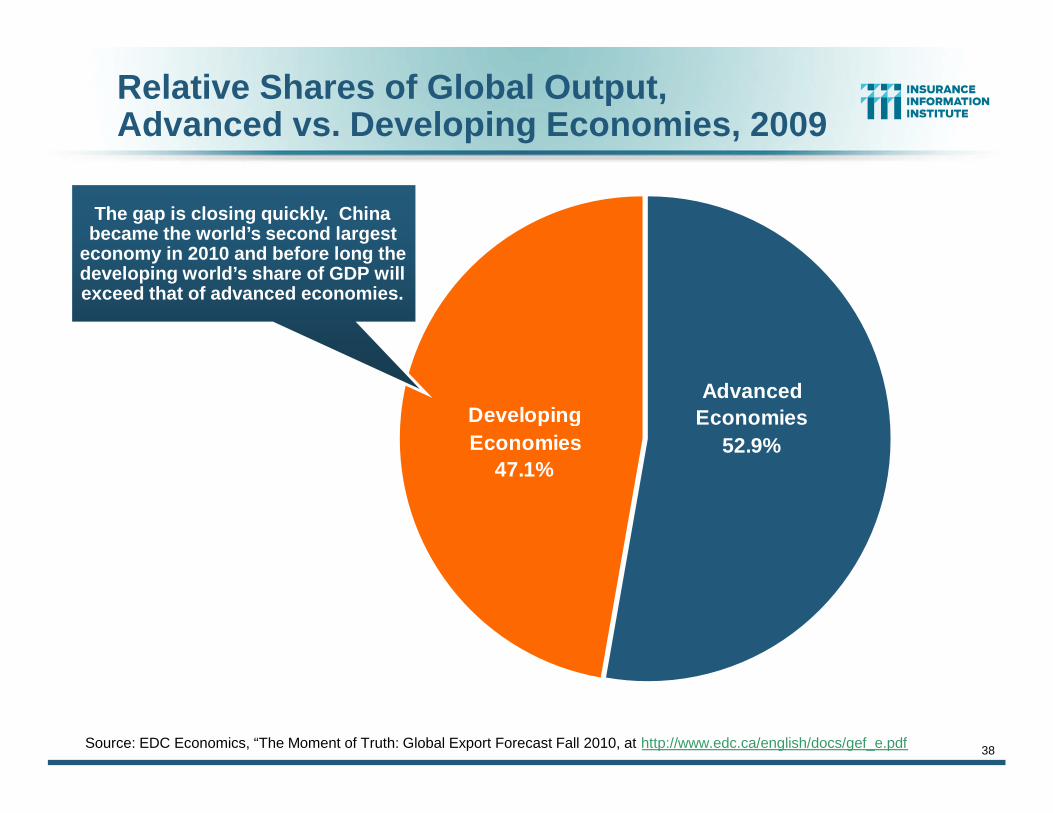
Relative Shares of Global Output,Advanced vs. Developing Economies, 2009
DevelopingEconomies
47.1%
AdvancedEconomies
52.9%
Source: EDC Economics, “The Moment of Truth: Global Export Forecast Fall 2010, at http://www.edc.ca/english/docs/gef_e.pdf
The gap is closing quickly. Chinabecame the world’s second largest
economy in 2010 and before long thedeveloping world’s share of GDP willexceed that of advanced economies.
(40)
(30)
(20)
(10)
0
10
20
30
2007
Q1
2007
Q2
2007
Q3
2007
Q4
2008
Q1
2008
Q2
2008
Q3
2008
Q4
2009
Q1
2009
Q2
2009
Q3
2009
Q4
2010
Q1
2010
Q2
2010
Q3
Advanced economies Emerging economies Machinery & Equipment
Source: International Monetary Fund, World Economic Outlook Update, January 2011; Ins. Info. Institute.
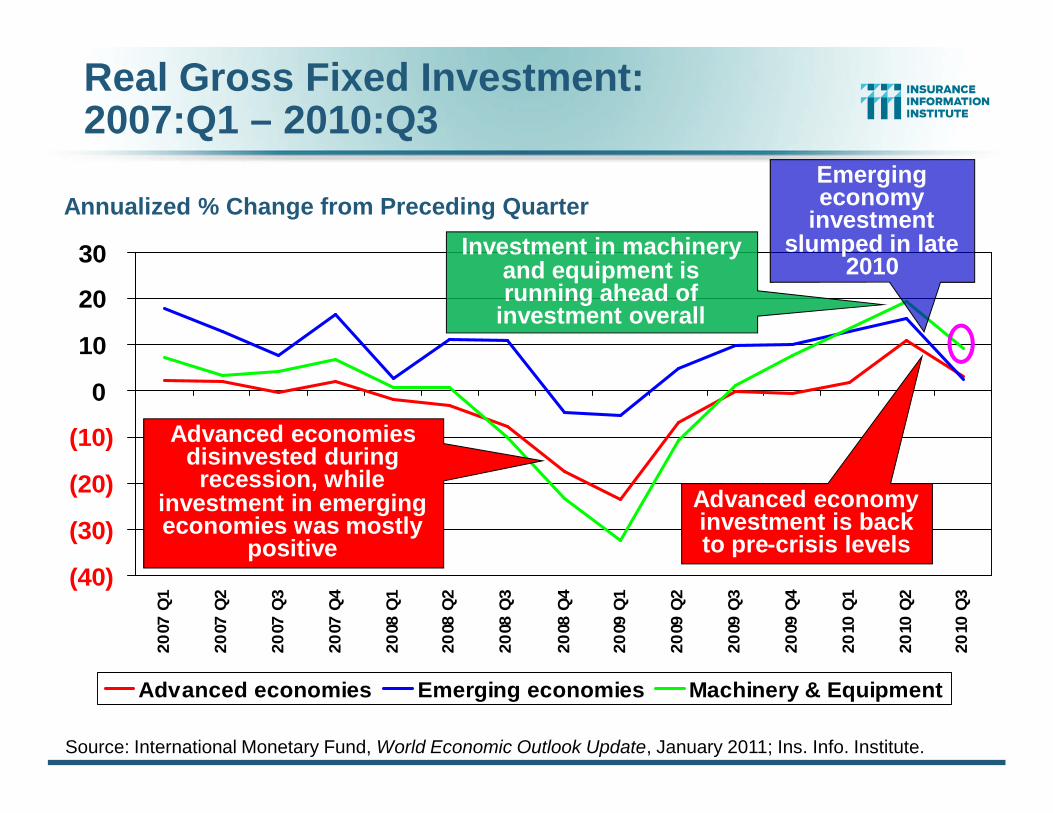
Emergingeconomy
investmentslumped in late
2010
Real Gross Fixed Investment:2007:Q1 – 2010:Q3
Advanced economyinvestment is backto pre-crisis levels
Investment in machineryand equipment isrunning ahead of
investment overall
Annualized % Change from Preceding Quarter
Advanced economiesdisinvested duringrecession, while
investment in emergingeconomies was mostly
positive

-30-25-20-15-10
-505
101520
1998 1999 2000 2001 2002 2003 2004 2005 2006 2007 2008 2009
Source: International Monetary Fund, World Economic Outlook Update, Jan. 26, 2010; Ins. Info. Institute.
Global Industrial Production ReboundsFrom a Tailspin; Global Trade Recovering
Global industrial production wasdown over 25% in early 2009, severeltcurtailing global trade, but growing at
a 9% clip in late 2009
Annualized 3-Month Percent Change
41
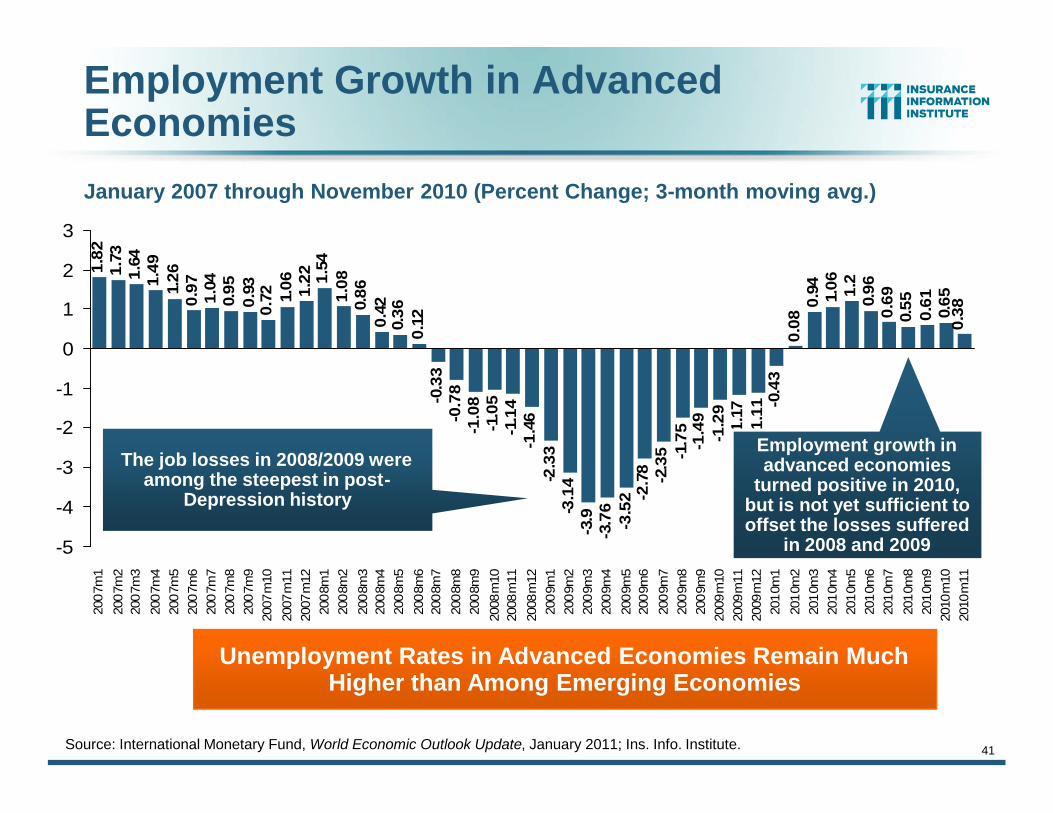
Employment Growth in AdvancedEconomies
1.82
1.73
1.64
1.49
1.26
0.97
1.04
0.95
0.93
0.72 1.
06 1.22 1.
541.
080.
860.
420.
360.
12-0
.33
-0.7
8-1
.08
-1.0
5-1
.14
-1.4
6-2
.33
-3.1
4-3
.9-3
.76
-3.5
2 -2.7
8 -2.3
5 -1.7
5-1
.49
-1.2
9-1
.17
-1.1
1 -0.4
30.
080.
94 1.06 1.2
0.96
0.69
0.55
0.61
0.65
0.38
-5
-4
-3
-2
-1
0
1
2
3
200
7m1
200
7m2
200
7m3
200
7m4
200
7m5
200
7m6
200
7m7
200
7m8
200
7m9
2007
m10
2007
m11
2007
m12
200
8m1
200
8m2
200
8m3
200
8m4
200
8m5
200
8m6
200
8m7
200
8m8
200
8m9
2008
m10
2008
m11
2008
m12
200
9m1
200
9m2
200
9m3
200
9m4
200
9m5
200
9m6
200
9m7
200
9m8
200
9m9
2009
m10
2009
m11
2009
m12
201
0m1
201
0m2
201
0m3
201
0m4
201
0m5
201
0m6
201
0m7
201
0m8
201
0m9
2010
m10
2010
m11
Employment growth inadvanced economies
turned positive in 2010,but is not yet sufficient tooffset the losses suffered
in 2008 and 2009
Unemployment Rates in Advanced Economies Remain MuchHigher than Among Emerging Economies
January 2007 through November 2010 (Percent Change; 3-month moving avg.)
The job losses in 2008/2009 wereamong the steepest in post-
Depression history
Source: International Monetary Fund, World Economic Outlook Update, January 2011; Ins. Info. Institute.

42Sources: IMF, World Economic Outlook, Oct. 2010; Insurance Information Institute.
8.3%
3.8%
10.1%
4.7%
9.7%9.3%
4.9%
9.4%
4.3%
8.0%9.6%
4.6%
10.0%
3.7%
8.2%
0%
2%
4%
6%
8%
10%
12%
AdvancedEconomies
NewlyIndustrializedEconomies
Euro Zone Asia US
2009 2010F 2011F
Persistently high unemployment is amongthe greatest obstacles to insurer
exposure/demand growth (nonlife and life)
Unemployment in Advanced Economies is more thandouble that of Emerging Economies
Unemployment Rates forMajor Global Economies, 2009-2011F
(6)
(4)
(2)
0
2
4
6
8
10
12
2007Q1
2007Q2
2007Q3
2007Q4
2008Q1
2008Q2
2008Q3
2008Q4
2009Q1
2009Q2
2009Q3
2009Q4
2010Q1
2010Q2
2010Q3
Advanced economies Emerging economies
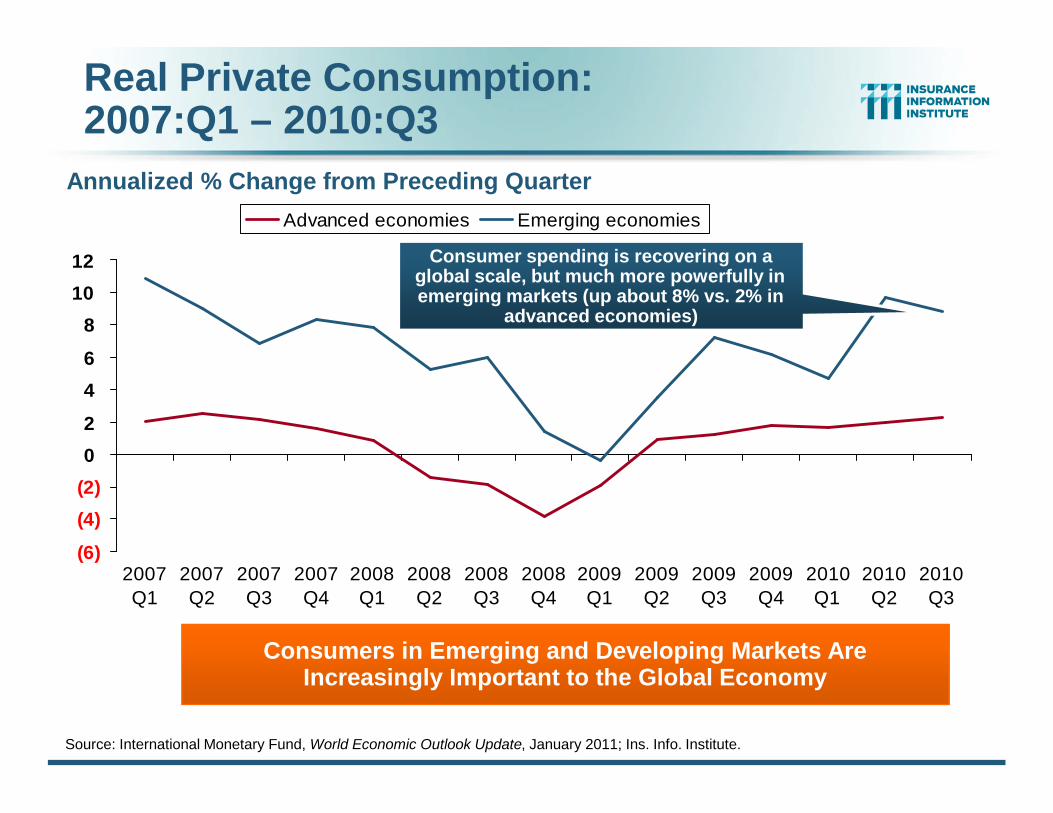
Consumers in Emerging and Developing Markets AreIncreasingly Important to the Global Economy
Consumer spending is recovering on aglobal scale, but much more powerfully inemerging markets (up about 8% vs. 2% in
advanced economies)
Real Private Consumption:2007:Q1 – 2010:Q3
Annualized % Change from Preceding Quarter
Source: International Monetary Fund, World Economic Outlook Update, January 2011; Ins. Info. Institute.
44
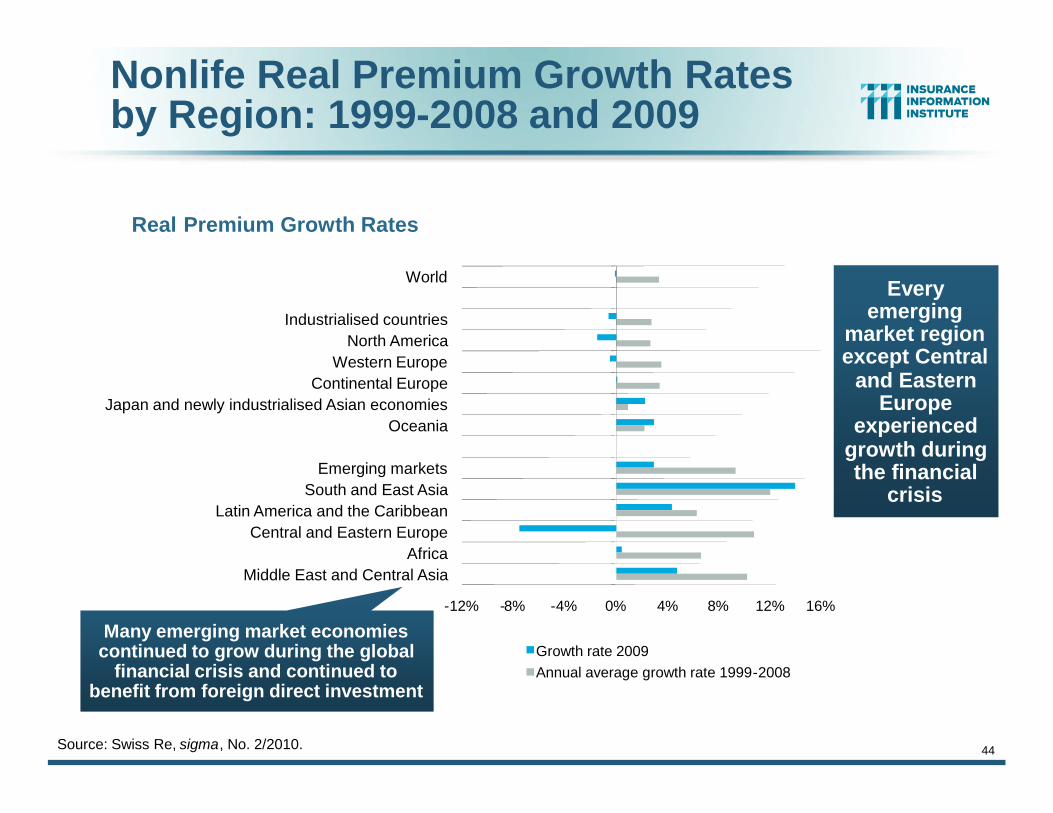
Nonlife Real Premium Growth Ratesby Region: 1999-2008 and 2009
Source: Swiss Re, sigma, No. 2/2010.
-12% -8% -4% 0% 4% 8% 12% 16%
World
Industrialised countriesNorth America
Western EuropeContinental Europe
Japan and newly industrialised Asian economiesOceania
Emerging marketsSouth and East Asia
Latin America and the CaribbeanCentral and Eastern Europe
AfricaMiddle East and Central Asia
Real Premium Growth Rates
Growth rate 2009Annual average growth rate 1999-2008
Everyemerging
market regionexcept Central
and EasternEurope
experiencedgrowth duringthe financial
crisis
Many emerging market economiescontinued to grow during the global
financial crisis and continued tobenefit from foreign direct investment
45
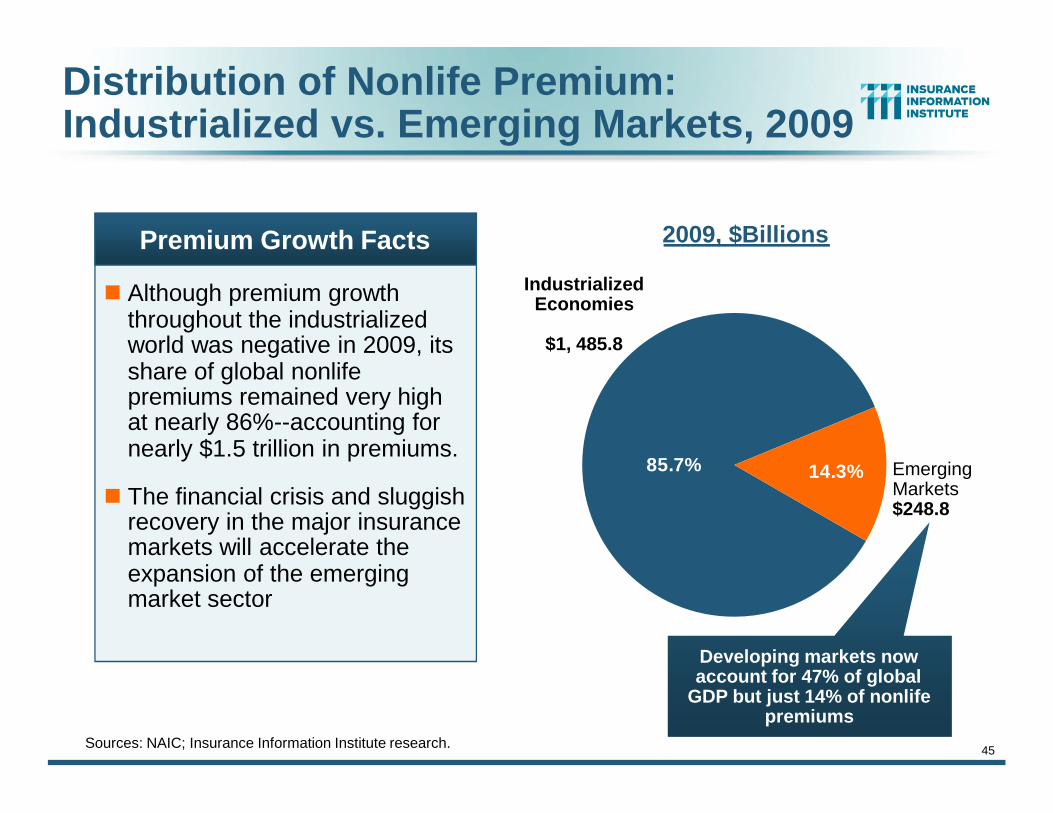
Distribution of Nonlife Premium:Industrialized vs. Emerging Markets, 2009
Sources: NAIC; Insurance Information Institute research.
Although premium growththroughout the industrializedworld was negative in 2009, itsshare of global nonlifepremiums remained very highat nearly 86%--accounting fornearly $1.5 trillion in premiums.
The financial crisis and sluggishrecovery in the major insurancemarkets will accelerate theexpansion of the emergingmarket sector
Premium Growth Facts
14.3%85.7%
IndustrializedEconomies
$1, 485.8
EmergingMarkets$248.8
2009, $Billions
Developing markets nowaccount for 47% of global
GDP but just 14% of nonlifepremiums
46
The Unfortunate Nexus:Opportunity, Risk & Instability
Most of the Global Economy’s FutureGains Will be Fraught with Much
Greater Risk and Uncertainty than inthe Past—Insurance Is There to Help
47
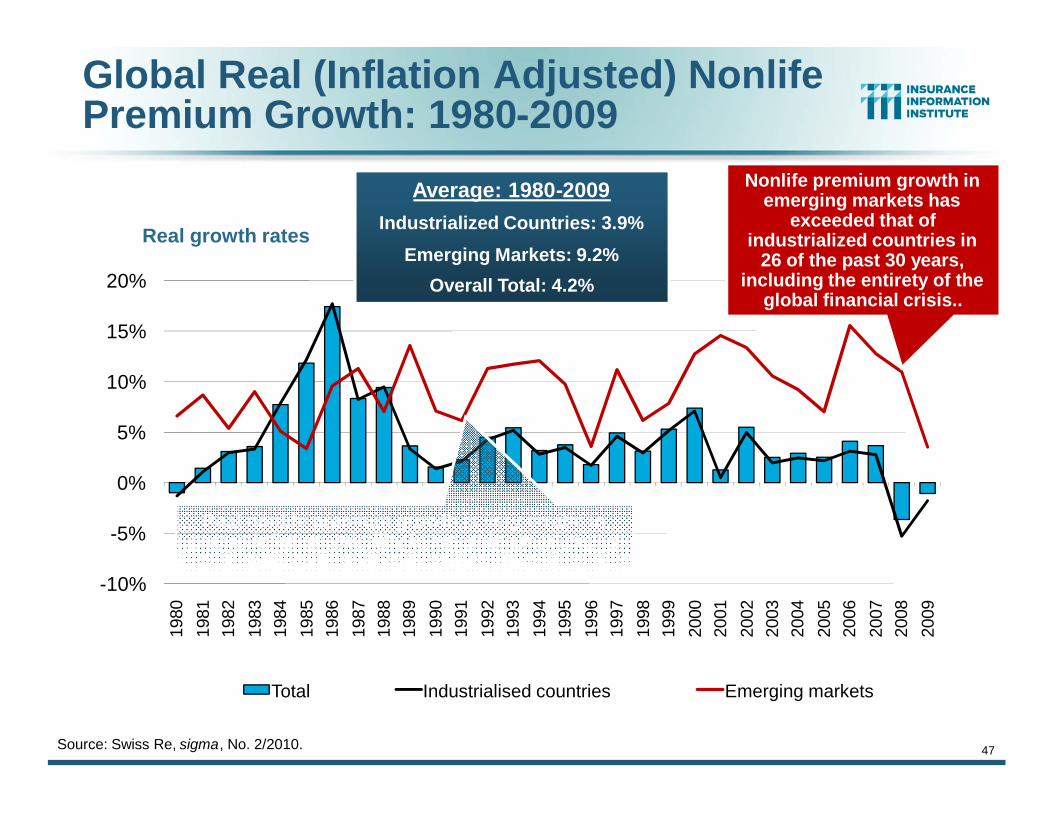
Global Real (Inflation Adjusted) NonlifePremium Growth: 1980-2009
Source: Swiss Re, sigma, No. 2/2010.
-10%
-5%
0%
5%
10%
15%
20%
1980
1981
1982
1983
1984
1985
1986
1987
1988
1989
1990
1991
1992
1993
1994
1995
1996
1997
1998
1999
2000
2001
2002
2003
2004
2005
2006
2007
2008
2009
Real growth rates
Total Industrialised countries Emerging markets
Nonlife premium growth inemerging markets has
exceeded that ofindustrialized countries in
26 of the past 30 years,including the entirety of the
global financial crisis..
Real nonlife premium growth is very erratic inpart to inflation volatility in emerging markets as
well as a lack of consistent cyclicality
Average: 1980-2009Industrialized Countries: 3.9%
Emerging Markets: 9.2%
Overall Total: 4.2%

48
Nonlife Real Premium Growth in 2009
Source: Swiss Re, sigma, No. 2/2010.
Latin and South Americanmarkets performed
relatively well during theglobal financial crisis in
terms of growth
There was alsogrowth in East and
South Asia andwell as Australiaand New Zealand
49
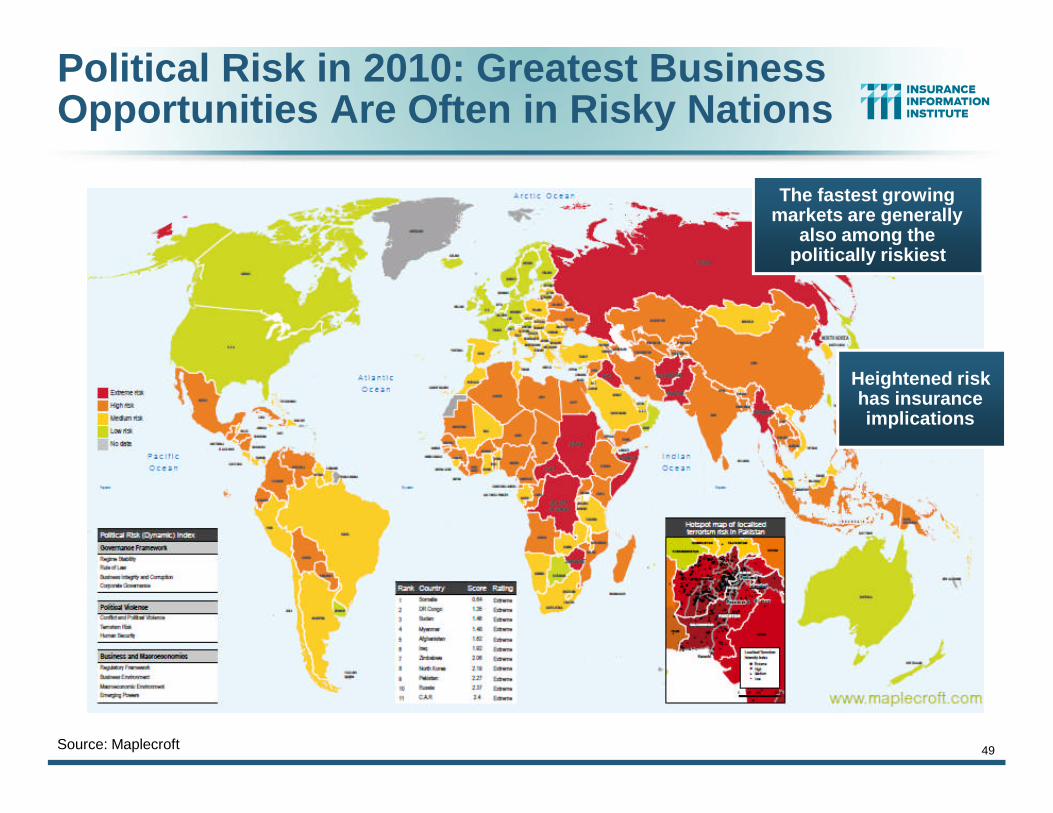
Political Risk in 2010: Greatest BusinessOpportunities Are Often in Risky Nations
Source: Maplecroft
The fastest growingmarkets are generally
also among thepolitically riskiest
Heightened riskhas insuranceimplications
50
Economic Threatsto Global Economy &
(Re)Insurance Industries
At Least Eight to Monitor:Near-Term and Longer-Term Risks
51
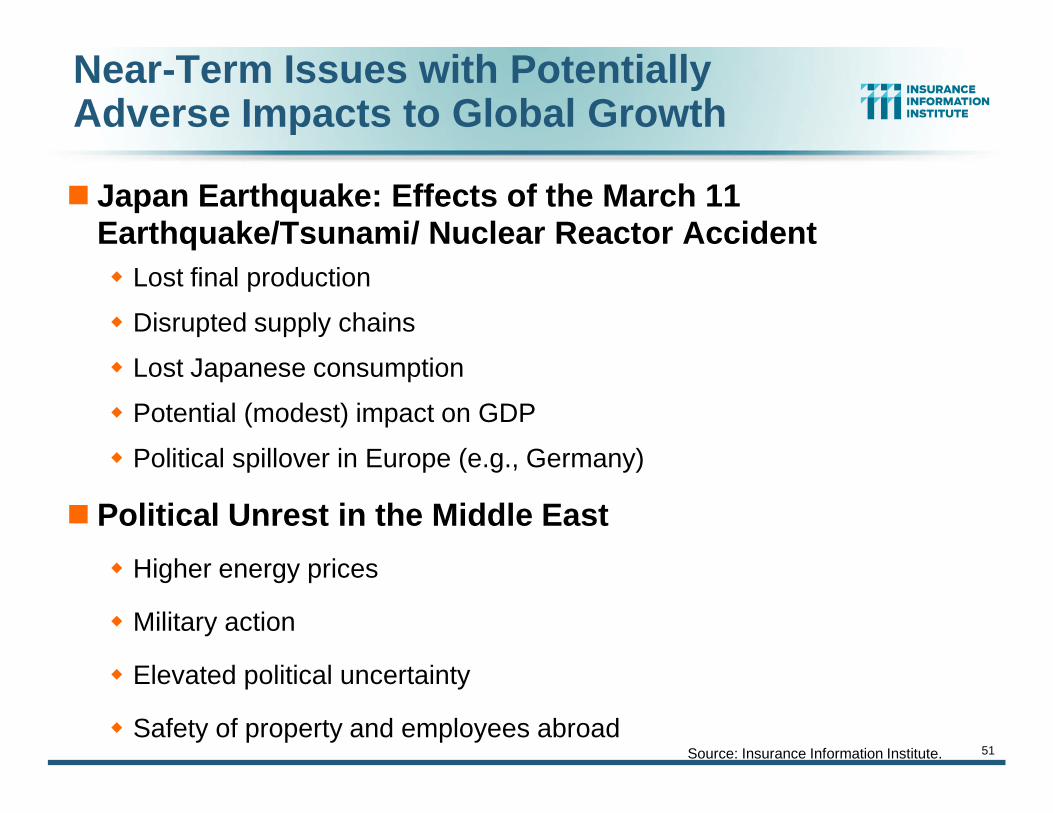
Near-Term Issues with PotentiallyAdverse Impacts to Global Growth
Japan Earthquake: Effects of the March 11Earthquake/Tsunami/ Nuclear Reactor AccidentLost final production
Disrupted supply chains
Lost Japanese consumption
Potential (modest) impact on GDP
Political spillover in Europe (e.g., Germany)
Political Unrest in the Middle East
Higher energy prices
Military action
Elevated political uncertainty
Safety of property and employees abroadSource: Insurance Information Institute.
52
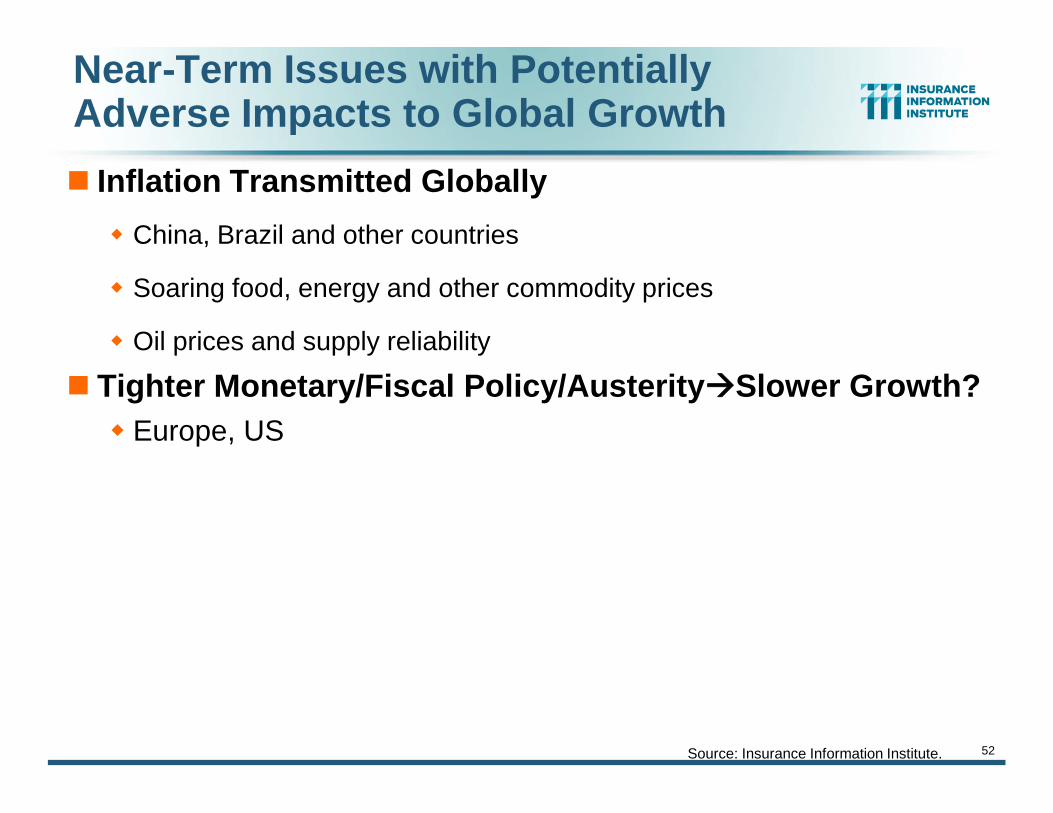
Near-Term Issues with PotentiallyAdverse Impacts to Global Growth
Inflation Transmitted Globally
China, Brazil and other countries
Soaring food, energy and other commodity prices
Oil prices and supply reliability
Tighter Monetary/Fiscal Policy/AusteritySlower Growth?Europe, US
Source: Insurance Information Institute.

53
Political Risk in 2010: Greatest BusinessOpportunities Are Often in Risky Nations
Source: Maplecroft
The fastest growingmarkets are generally
also among thepolitically riskiest
Heightened riskhas insuranceimplications
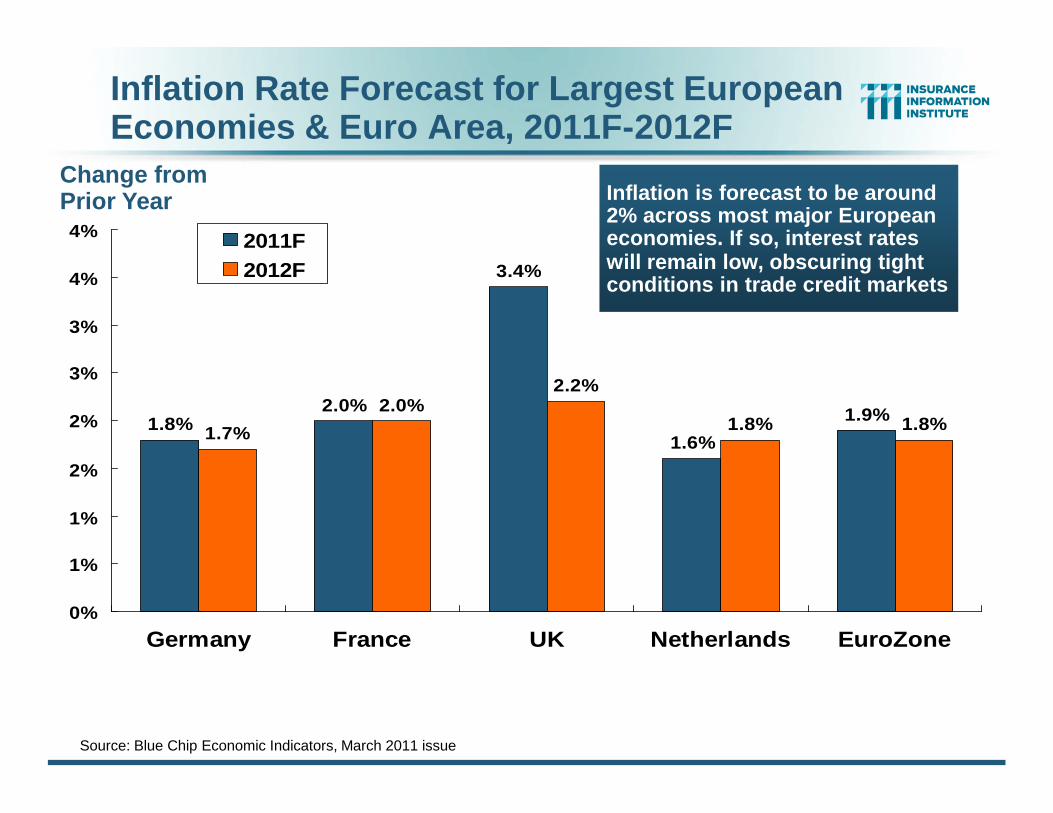
Inflation Rate Forecast for Largest EuropeanEconomies & Euro Area, 2011F-2012F
1.8%2.0%
3.4%
1.6%
1.9%1.7%
2.0%2.2%
1.8% 1.8%
0%
1%
1%
2%
2%
3%
3%
4%
4%
Germany France UK Netherlands EuroZone
2011F2012F
Source: Blue Chip Economic Indicators, March 2011 issue
Change fromPrior Year Inflation is forecast to be around
2% across most major Europeaneconomies. If so, interest rateswill remain low, obscuring tightconditions in trade credit markets
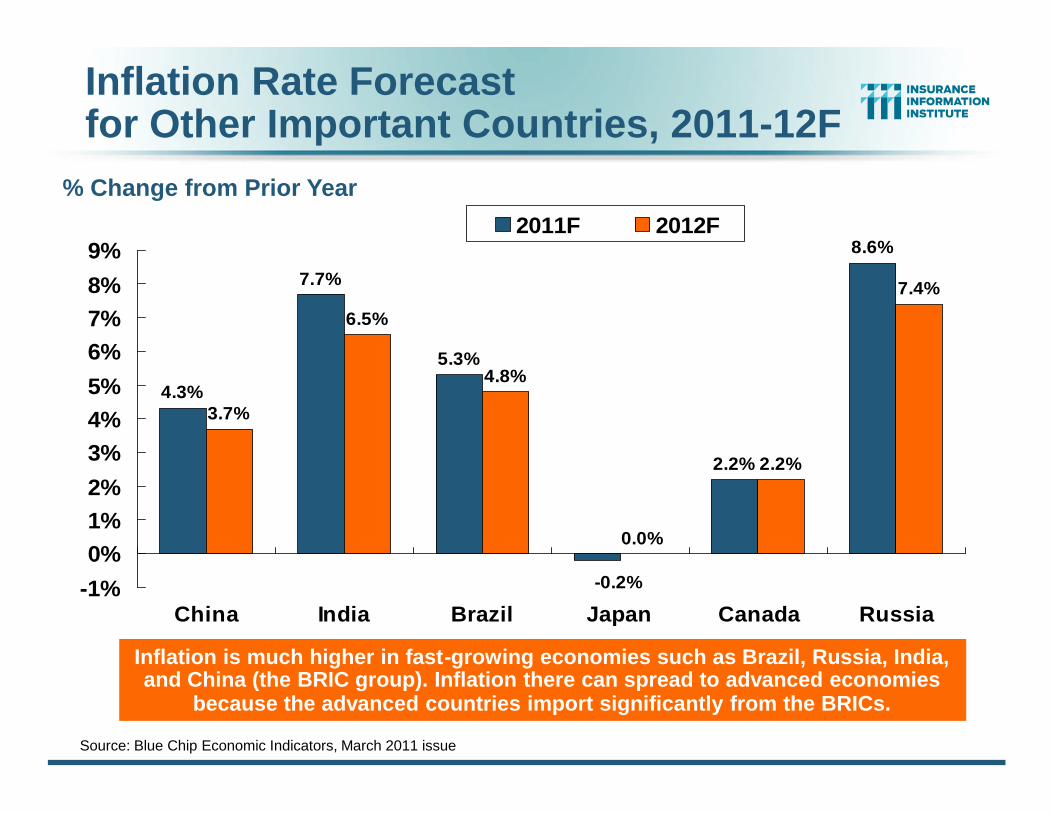
Inflation Rate Forecastfor Other Important Countries, 2011-12F
4.3%
7.7%
5.3%
2.2%
8.6%
3.7%
6.5%
4.8%
0.0%
2.2%
7.4%
-0.2%-1%
0%1%2%
3%4%5%
6%7%8%
9%
China India Brazil Japan Canada Russia
2011F 2012F
Source: Blue Chip Economic Indicators, March 2011 issue
% Change from Prior Year
Inflation is much higher in fast-growing economies such as Brazil, Russia, India,and China (the BRIC group). Inflation there can spread to advanced economies
because the advanced countries import significantly from the BRICs.
56
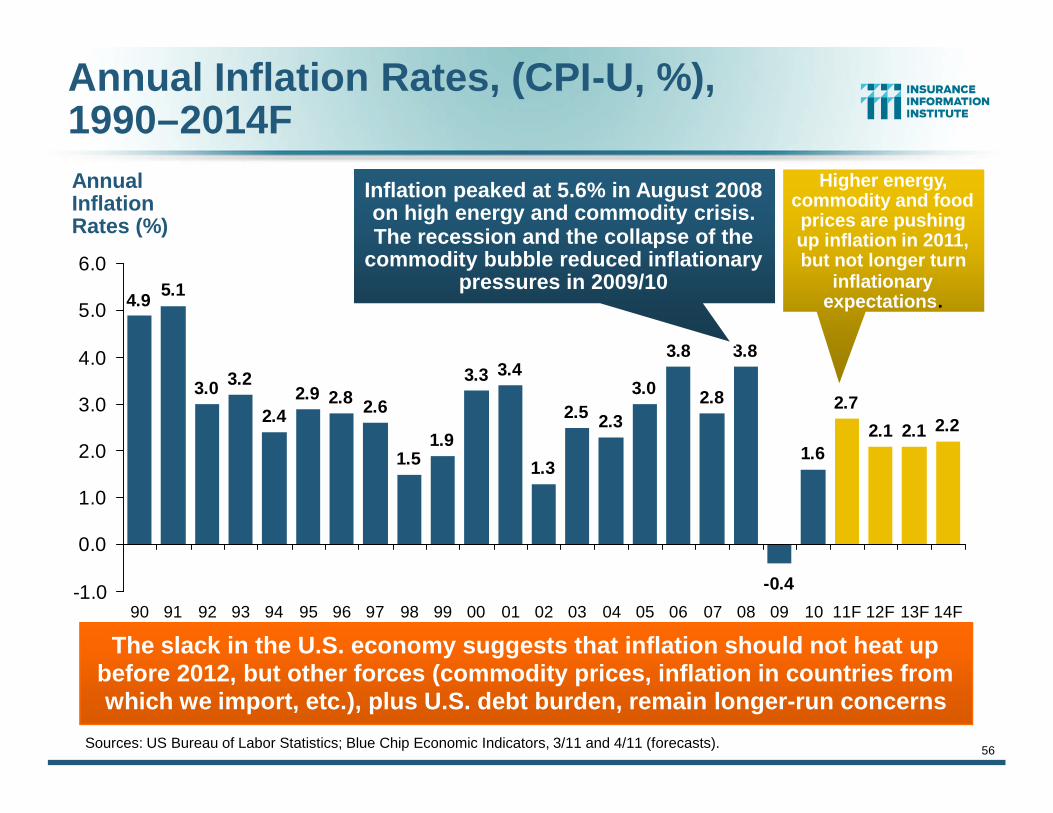
Annual Inflation Rates, (CPI-U, %),1990–2014F
2.8 2.6
1.51.9
3.3 3.4
1.3
2.5 2.3
3.0
3.8
2.8
3.8
-0.4
1.6
2.7
2.1 2.1 2.2
2.92.4
3.23.0
5.14.9
-1.0
0.0
1.0
2.0
3.0
4.0
5.0
6.0
90 91 92 93 94 95 96 97 98 99 00 01 02 03 04 05 06 07 08 09 10 11F 12F 13F 14F
Sources: US Bureau of Labor Statistics; Blue Chip Economic Indicators, 3/11 and 4/11 (forecasts).
The slack in the U.S. economy suggests that inflation should not heat upbefore 2012, but other forces (commodity prices, inflation in countries fromwhich we import, etc.), plus U.S. debt burden, remain longer-run concerns
AnnualInflationRates (%)
Inflation peaked at 5.6% in August 2008on high energy and commodity crisis.The recession and the collapse of the
commodity bubble reduced inflationarypressures in 2009/10
Higher energy,commodity and foodprices are pushingup inflation in 2011,but not longer turn
inflationaryexpectations.
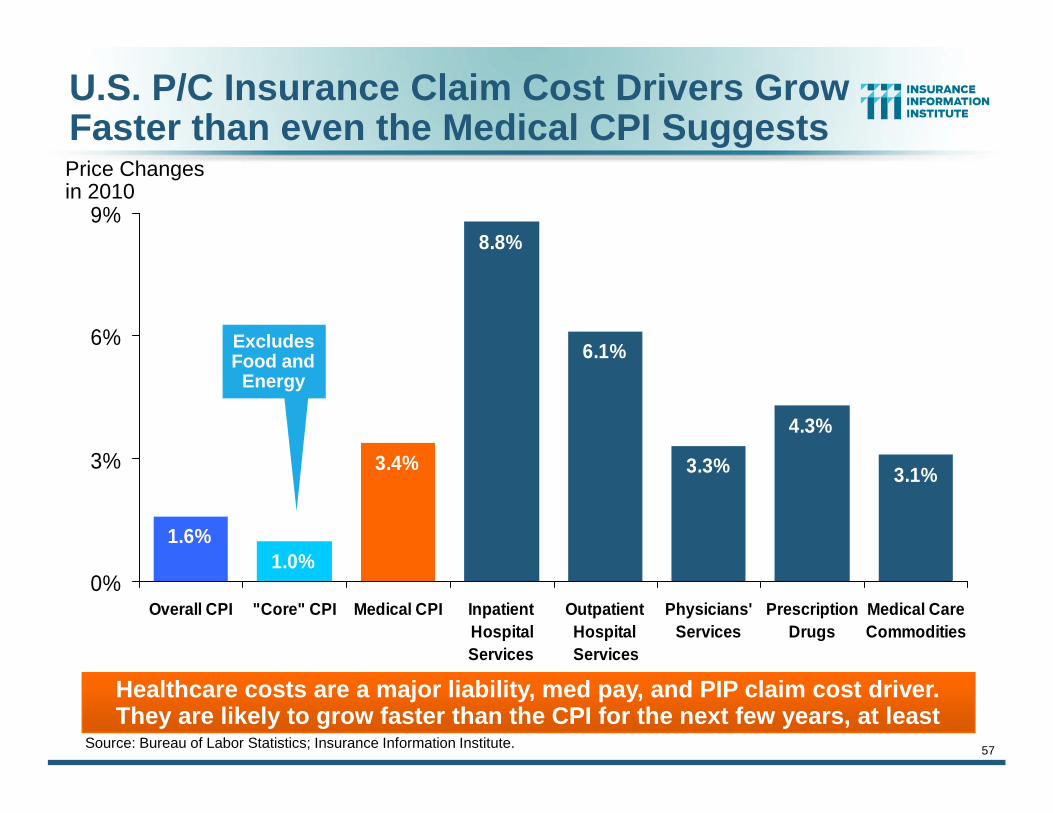
U.S. P/C Insurance Claim Cost Drivers GrowFaster than even the Medical CPI Suggests
Source: Bureau of Labor Statistics; Insurance Information Institute.
1.6%1.0%
3.4%
8.8%
6.1%
3.3%
4.3%
3.1%
0%
3%
6%
9%
Overall CPI "Core" CPI Medical CPI InpatientHospitalServices
OutpatientHospitalServices
Physicians'Services
PrescriptionDrugs
Medical CareCommodities
Price Changesin 2010
Healthcare costs are a major liability, med pay, and PIP claim cost driver.They are likely to grow faster than the CPI for the next few years, at least
57
ExcludesFood and
Energy
58
Commodity Price Changesin 2010-2011*
8090
100110120130140150160170180190200210
1/1/
2010
1/15
/201
0
1/29
/201
0
2/12
/201
0
2/26
/201
0
3/12
/201
0
3/26
/201
0
4/9/
2010
4/23
/201
0
5/7/
2010
5/21
/201
0
6/4/
2010
6/18
/201
0
7/2/
2010
7/16
/201
0
7/30
/201
0
8/13
/201
0
8/27
/201
0
9/10
/201
0
9/24
/201
0
10/8
/201
0
10/2
2/20
10
11/5
/201
0
11/1
9/20
10
12/3
/201
0
12/1
7/20
10
12/3
1/20
10
1/14
/201
1
Metals Food Raw Materials Crude Oil Gold
*data are through Jan. 20, 2011Source: International Monetary Fund World Economic Outlook January 2011 update athttp://www.imf.org/external/pubs/ft/weo/2010/update/01/data/figure_2.csv
Index (Jan 1, 2010 = 100)Raw materials prices doubled over thecourse of 2010. Some other commodity
prices dropped during the year butended 20-30% higher. The upward
trend has continued in to 2011.
59
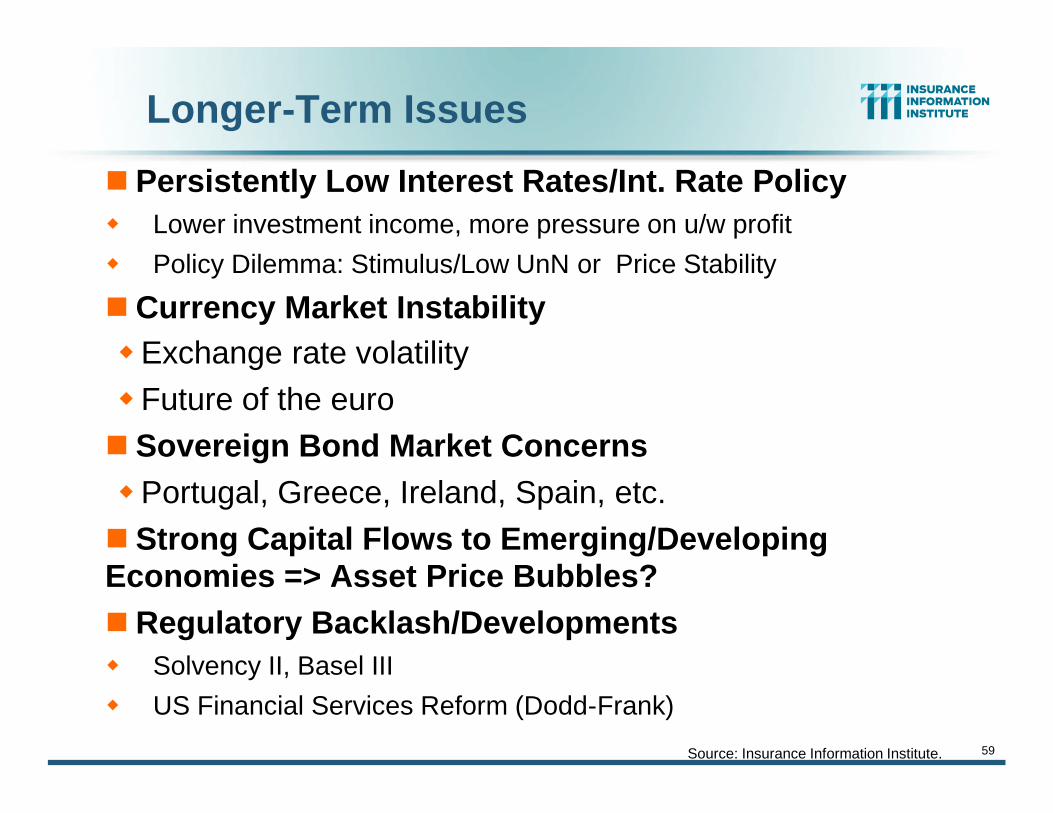
Longer-Term Issues
Persistently Low Interest Rates/Int. Rate Policy Lower investment income, more pressure on u/w profit Policy Dilemma: Stimulus/Low UnN or Price Stability
Currency Market InstabilityExchange rate volatilityFuture of the euroSovereign Bond Market ConcernsPortugal, Greece, Ireland, Spain, etc.Strong Capital Flows to Emerging/DevelopingEconomies => Asset Price Bubbles?Regulatory Backlash/Developments Solvency II, Basel III US Financial Services Reform (Dodd-Frank)
Source: Insurance Information Institute.
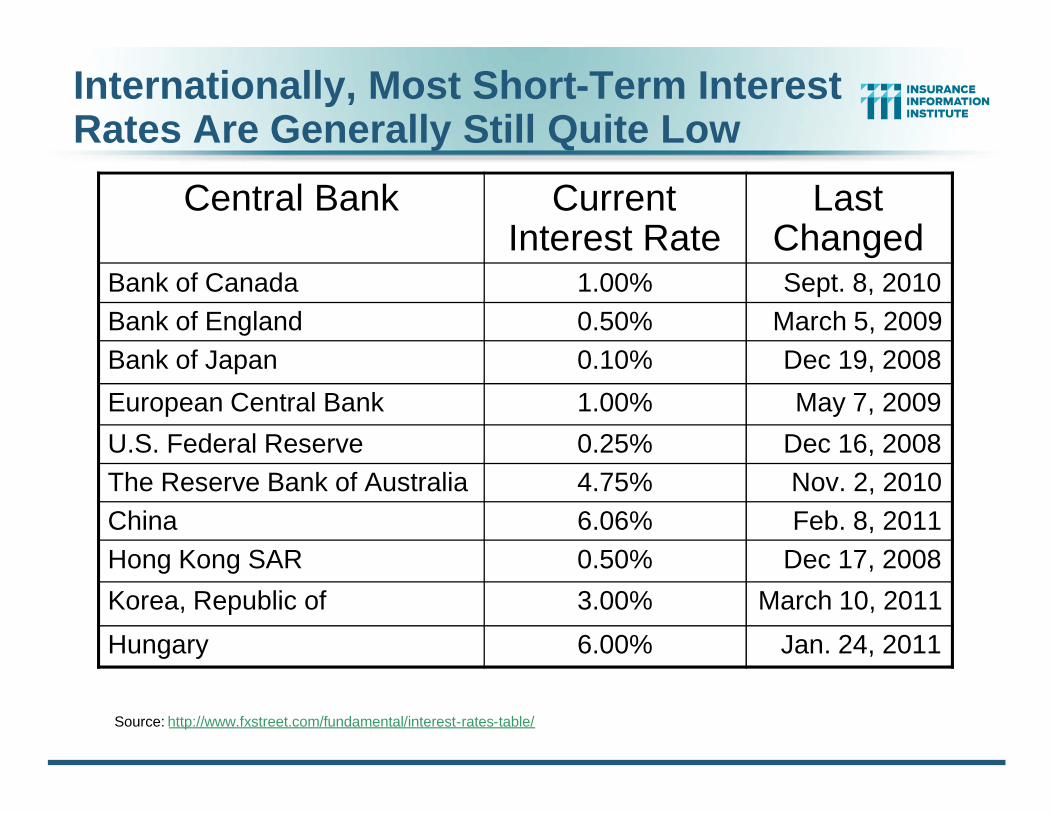
Internationally, Most Short-Term InterestRates Are Generally Still Quite Low
Central Bank CurrentInterest Rate
LastChanged
Bank of Canada 1.00% Sept. 8, 2010Bank of England 0.50% March 5, 2009Bank of Japan 0.10% Dec 19, 2008
European Central Bank 1.00% May 7, 2009
U.S. Federal Reserve 0.25% Dec 16, 2008The Reserve Bank of Australia 4.75% Nov. 2, 2010China 6.06% Feb. 8, 2011Hong Kong SAR 0.50% Dec 17, 2008
Korea, Republic of 3.00% March 10, 2011
Hungary 6.00% Jan. 24, 2011
Source: http://www.fxstreet.com/fundamental/interest-rates-table/

Forecast: End-of-Year 3-Month Interest Ratesfor Major Global Economies, 2011-2012F
1.30
%
0.24
% 1.0
9%
0.2
0%
4.5
7% 5.16
%
7.7
9%
2.1
8%
0.3
3%
2.14
%
1.1
0%
4.7
8% 5.
57%
7.23
%
0%
1%
2%
3%
4%
5%
6%
7%
8%
9%
Euro Area Japan U.K. U.S. China Australia India
2011F 2012F
Source: Blue Chip Economic Indicators, March 2011 issue
Interest rates remain generally low in muchof the world, depressing insurer investment
earnings. Some countries, including theU.S., are intentionally holding rates low.
Other countriesare intentionallyraising rates tofight inflation.
3.40%
3.60%
3.80%
4.00%
4.20%
4.40%
4.60%
2011:Q1 2011:Q2 2011:Q3 2011:Q4 2012:Q1 2012:Q2
U.S. Euroland U.K. Canada
Source: Wells Fargo Economics Group, Global Chartbook, March 2011
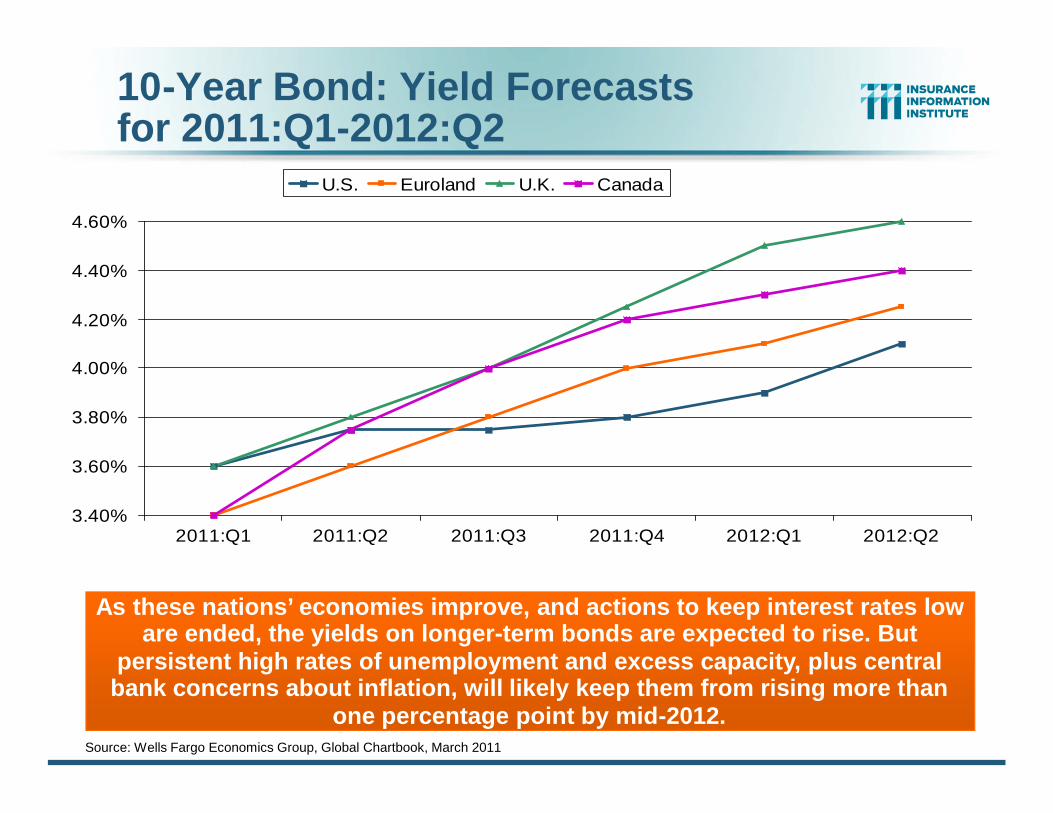
As these nations’ economies improve, and actions to keep interest rates loware ended, the yields on longer-term bonds are expected to rise. But
persistent high rates of unemployment and excess capacity, plus centralbank concerns about inflation, will likely keep them from rising more than
one percentage point by mid-2012.
10-Year Bond: Yield Forecastsfor 2011:Q1-2012:Q2
63
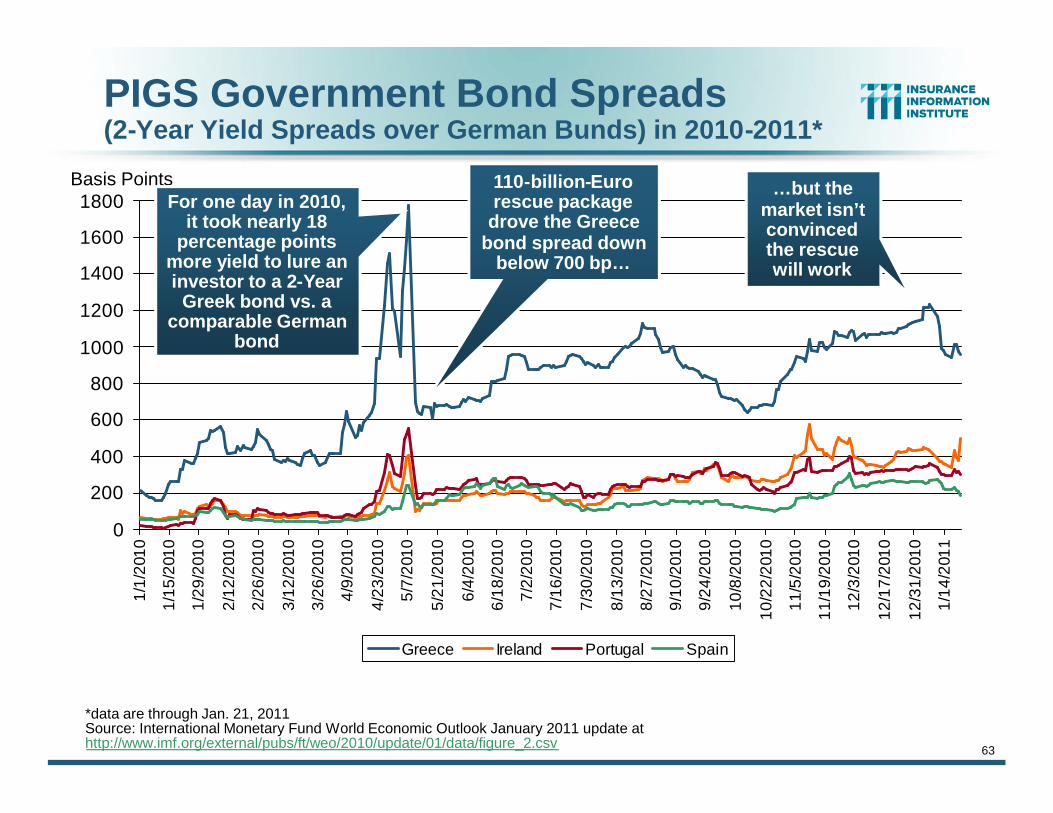
PIGS Government Bond Spreads(2-Year Yield Spreads over German Bunds) in 2010-2011*
0
200
400
600
800
1000
1200
1400
1600
1800
1/1/
2010
1/15
/201
0
1/29
/201
0
2/12
/201
0
2/26
/201
0
3/12
/201
0
3/26
/201
0
4/9/
2010
4/23
/201
0
5/7/
2010
5/21
/201
0
6/4/
2010
6/18
/201
0
7/2/
2010
7/16
/201
0
7/30
/201
0
8/13
/201
0
8/27
/201
0
9/10
/201
0
9/24
/201
0
10/8
/201
0
10/2
2/20
10
11/5
/201
0
11/1
9/20
10
12/3
/201
0
12/1
7/20
10
12/3
1/20
10
1/14
/201
1
Greece Ireland Portugal Spain
*data are through Jan. 21, 2011Source: International Monetary Fund World Economic Outlook January 2011 update athttp://www.imf.org/external/pubs/ft/weo/2010/update/01/data/figure_2.csv
Basis PointsFor one day in 2010,
it took nearly 18percentage points
more yield to lure aninvestor to a 2-Year
Greek bond vs. acomparable German
bond
110-billion-Eurorescue package
drove the Greecebond spread down
below 700 bp…
…but themarket isn’tconvincedthe rescuewill work
65
70
75
80
85
90
95
100
105
110
115
Jan00
Jan01
Jan02
Jan03
Jan04
Jan05
Jan06
Jan07
Jan08
Jan09
Jan10
Jan11
Trade-Index-WeightedU.S. Dollar Exchange Rate*
*The Major Currency index is a weighted average of the foreign exchange values of the U.S. dollar against a subset of the currenciesof a large group of major U.S. trading partners. The index weights, which change over time, are derived from U.S. export shares andfrom U.S. and foreign import shares. Sources: US Federal Reserve, Board of Governors; Insurance Information Institute.
The global financial crisis created significant exchange-rate volatilityin 2008-09 and 2010—when the world needed a “safe haven” currency.
As global stability returns, the dollar is depreciating again.
Monthly, January 2000through February 2011
Depreciationof dollar afterTech bubble
and post 9-11
Post-crisisdepreciation
of dollar
Dollar appreciates as roleas global “reserve
currency” affirmed duringglobal financial crisis
Greeceanxiety
65
Exchange Rate Indices*Daily (Jan 1, 2010 = 100)
85
90
95
100
105
110
115
120
1/1/
2010
1/15
/201
0
1/29
/201
0
2/12
/201
0
2/26
/201
0
3/12
/201
0
3/26
/201
0
4/9/
2010
4/23
/201
0
5/7/
2010
5/21
/201
0
6/4/
2010
6/18
/201
0
7/2/
2010
7/16
/201
0
7/30
/201
0
8/13
/201
0
8/27
/201
0
9/10
/201
0
9/24
/201
0
10/8
/201
0
10/2
2/20
10
11/5
/201
0
11/1
9/20
10
12/3
/201
0
12/1
7/20
10
12/3
1/20
10
1/14
/201
1
Euro Yen Renminbi Pound Sterling
*data are through Jan. 21, 2011Source: International Monetary Fund World Economic Outlook January 2011 update athttp://www.imf.org/external/pubs/ft/weo/2010/update/01/data/figure_2.csv
Index The US dollar has generally depreciatedagainst other major currencies, as USmonetary policy keeps yields on US
assets artificially low.
66
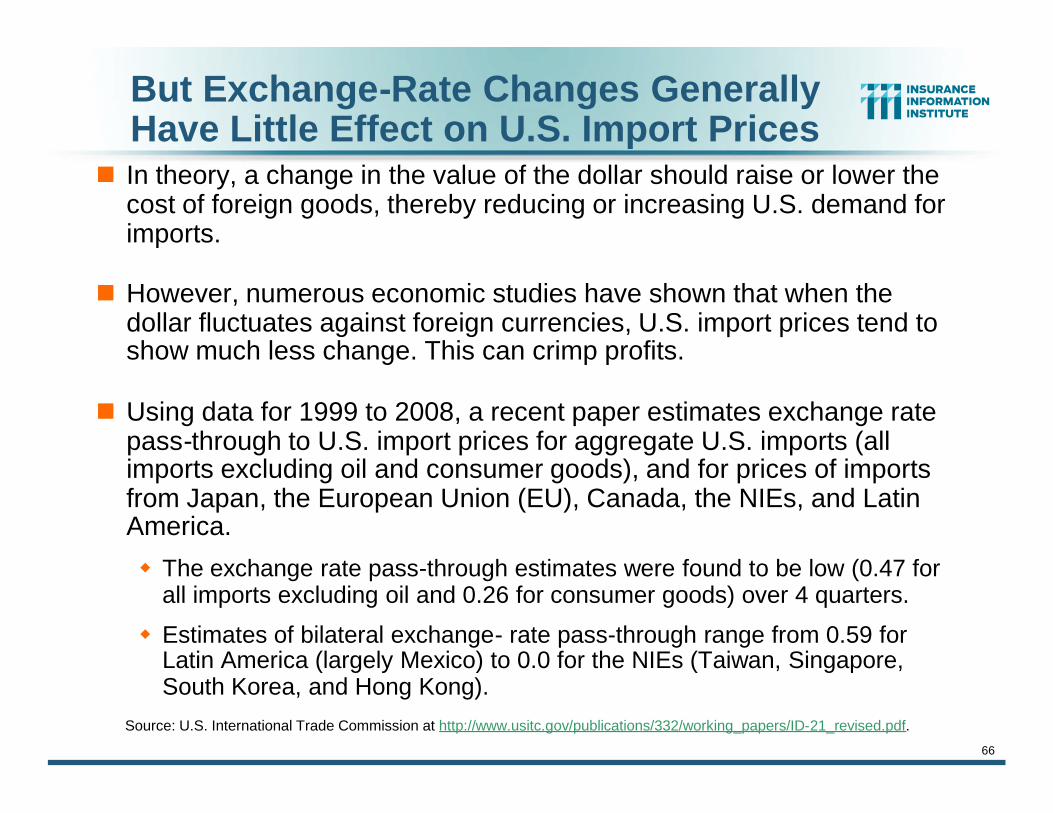
But Exchange-Rate Changes GenerallyHave Little Effect on U.S. Import Prices
In theory, a change in the value of the dollar should raise or lower thecost of foreign goods, thereby reducing or increasing U.S. demand forimports.
However, numerous economic studies have shown that when thedollar fluctuates against foreign currencies, U.S. import prices tend toshow much less change. This can crimp profits.
Using data for 1999 to 2008, a recent paper estimates exchange ratepass-through to U.S. import prices for aggregate U.S. imports (allimports excluding oil and consumer goods), and for prices of importsfrom Japan, the European Union (EU), Canada, the NIEs, and LatinAmerica.
The exchange rate pass-through estimates were found to be low (0.47 forall imports excluding oil and 0.26 for consumer goods) over 4 quarters.
Estimates of bilateral exchange- rate pass-through range from 0.59 forLatin America (largely Mexico) to 0.0 for the NIEs (Taiwan, Singapore,South Korea, and Hong Kong).
Source: U.S. International Trade Commission at http://www.usitc.gov/publications/332/working_papers/ID-21_revised.pdf.
67
Reshuffling the GlobalEconomic Deck ThroughForeign Direct Investment
The Global Financial CrisisConcentrates Growth Opportunities
in Risky Places/Industry Groups
$0.0
$0.5
$1.0
$1.5
$2.0
$2.5
80 81 82 83 84 85 86 87 88 89 90 91 92 93 94 95 96 97 98 99 00 01 02 03 04 05 06 07 08 09
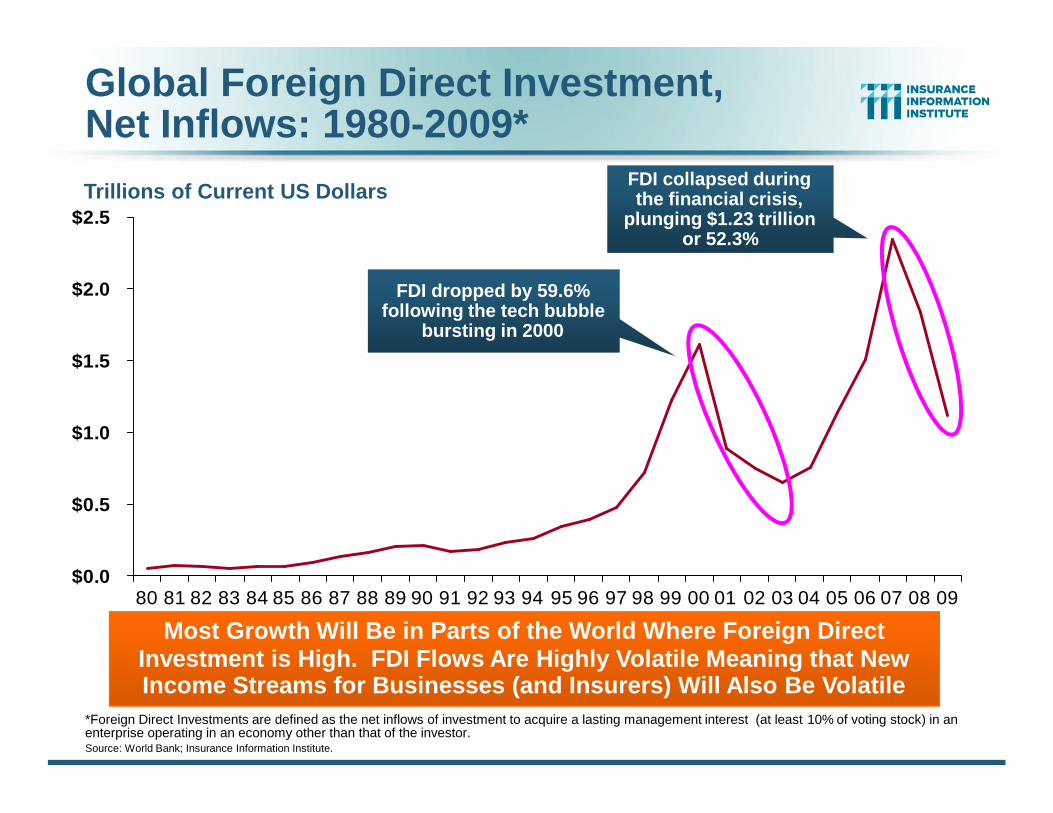
*Foreign Direct Investments are defined as the net inflows of investment to acquire a lasting management interest (at least 10% of voting stock) in anenterprise operating in an economy other than that of the investor.Source: World Bank; Insurance Information Institute.
Most Growth Will Be in Parts of the World Where Foreign DirectInvestment is High. FDI Flows Are Highly Volatile Meaning that NewIncome Streams for Businesses (and Insurers) Will Also Be Volatile
Trillions of Current US DollarsFDI collapsed duringthe financial crisis,
plunging $1.23 trillionor 52.3%
FDI dropped by 59.6%following the tech bubble
bursting in 2000
Global Foreign Direct Investment,Net Inflows: 1980-2009*
69
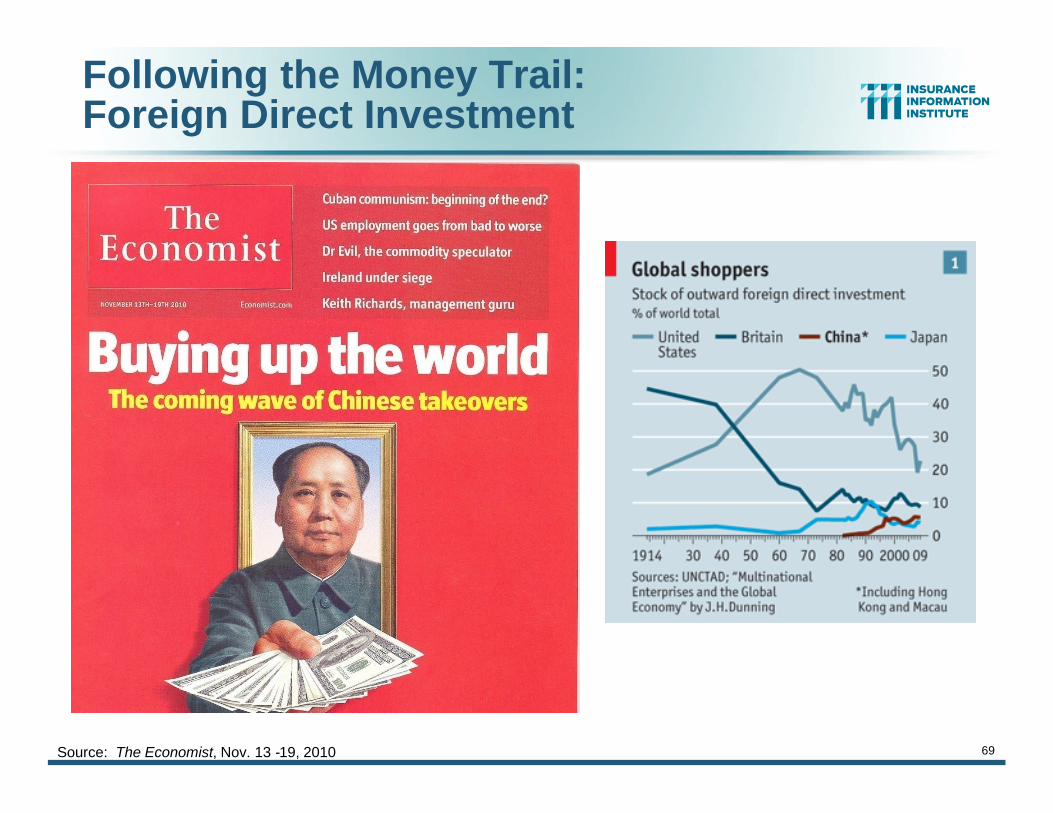
Following the Money Trail:Foreign Direct Investment
Source: The Economist, Nov. 13 -19, 2010

70
Following the Money Trail:Outward Foreign Direct Investment
Source: The Economist, Nov. 13 -19, 2010
The UK’s share ofFDI peaked at45% in 1914
The US’s share ofFDI peaked at50% in 1967
China’s share ofFDI stood at 6%
in 2009
71
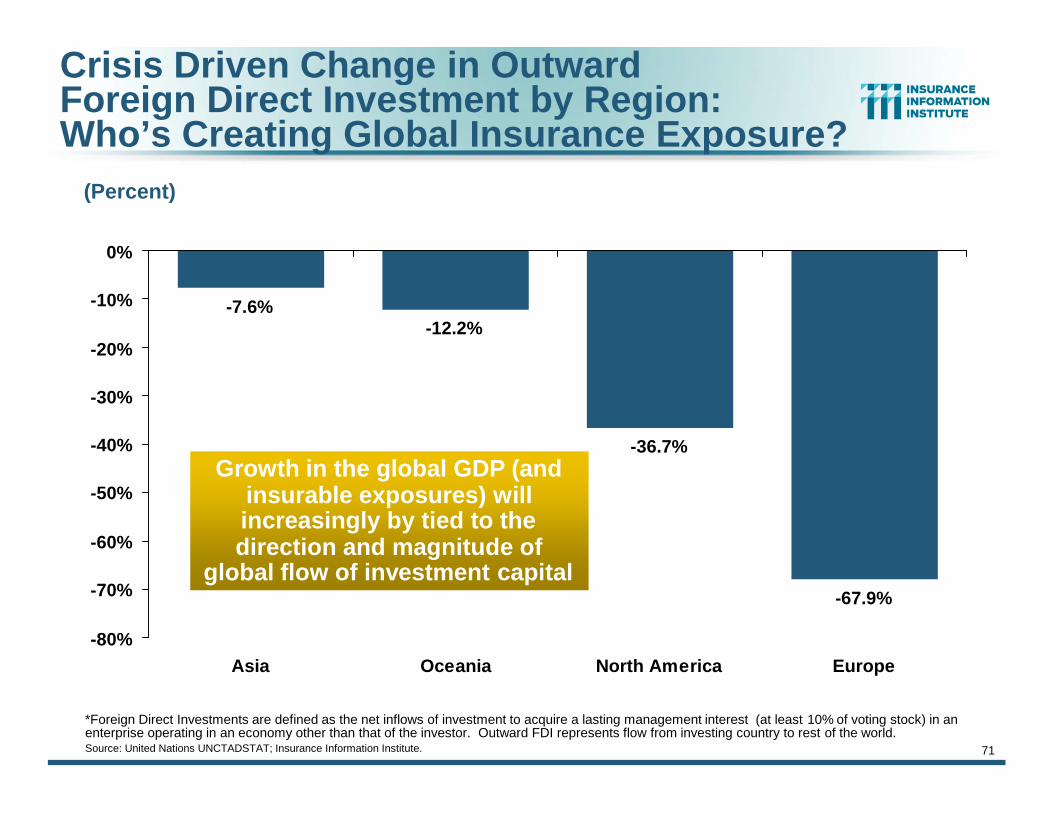
Crisis Driven Change in OutwardForeign Direct Investment by Region:Who’s Creating Global Insurance Exposure?
-7.6%-12.2%
-36.7%
-67.9%
-80%
-70%
-60%
-50%
-40%
-30%
-20%
-10%
0%
Asia Oceania North America Europe
(Percent)
*Foreign Direct Investments are defined as the net inflows of investment to acquire a lasting management interest (at least 10% of voting stock) in anenterprise operating in an economy other than that of the investor. Outward FDI represents flow from investing country to rest of the world.Source: United Nations UNCTADSTAT; Insurance Information Institute.
Growth in the global GDP (andinsurable exposures) willincreasingly by tied to thedirection and magnitude of
global flow of investment capital
$0
$10,000
$20,000
$30,000
$40,000
$50,000
$60,000
82 83 84 85 86 87 88 89 90 91 92 93 94 95 96 97 98 99 00 01 02 03 04 05 06 07 08 09
*Foreign Direct Investments are defined as the net inflows of investment to acquire a lasting management interest (at least 10% of voting stock) in anenterprise operating in an economy other than that of the investor. Outward FDI represents flow from investing country to rest of the world.Source: United Nations UNCTADSTAT; Insurance Information Institute.
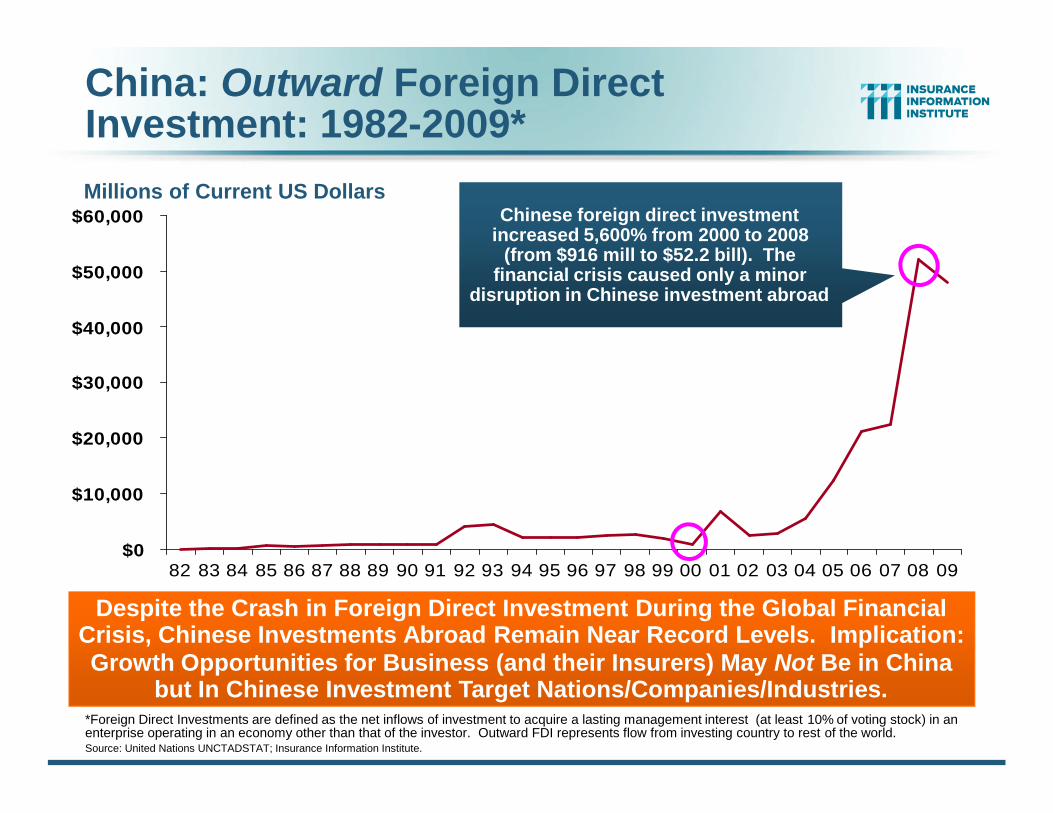
Despite the Crash in Foreign Direct Investment During the Global FinancialCrisis, Chinese Investments Abroad Remain Near Record Levels. Implication:Growth Opportunities for Business (and their Insurers) May Not Be in China
but In Chinese Investment Target Nations/Companies/Industries.
Millions of Current US DollarsChinese foreign direct investment
increased 5,600% from 2000 to 2008(from $916 mill to $52.2 bill). The
financial crisis caused only a minordisruption in Chinese investment abroad
China: Outward Foreign DirectInvestment: 1982-2009*
73
$0
$100
$200
$300
$400
$500
2006 2007 2008 2009
(Billions of US $)
Source: Data estimated from The Economist, Nov. 13-19, 2010 from: ICBC, China Construction Bank, China Development Bank, Bank of China and China Eximbank.
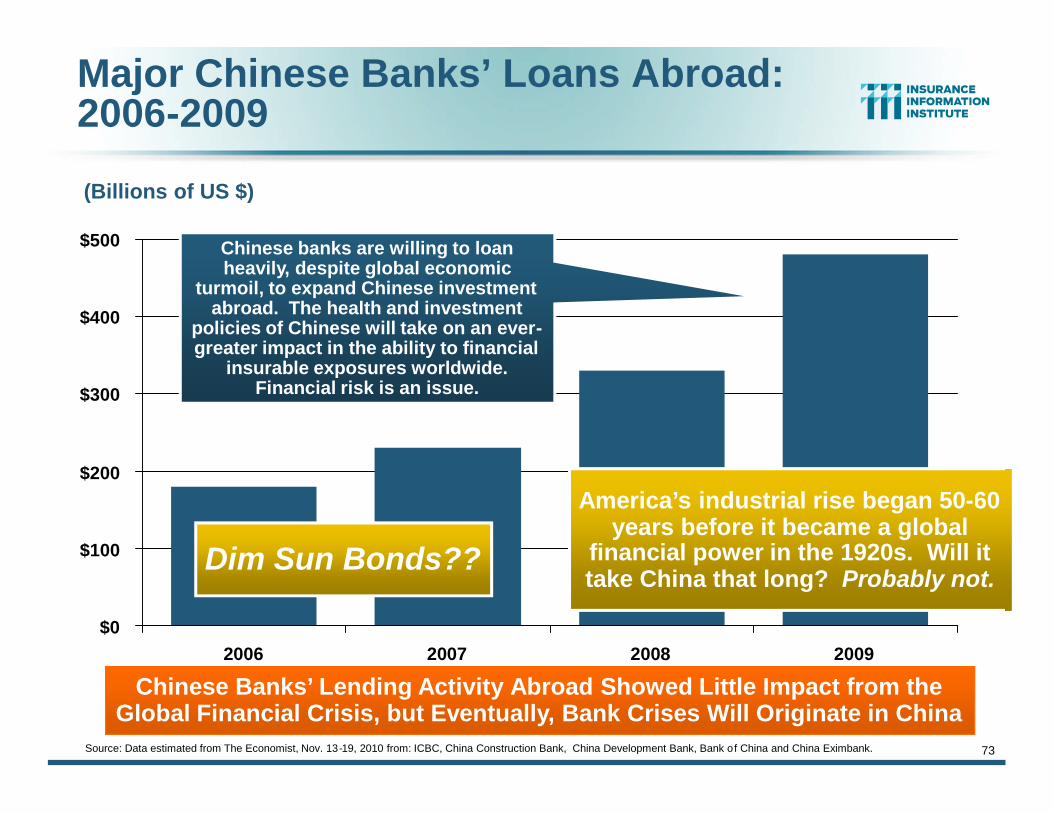
Major Chinese Banks’ Loans Abroad:2006-2009
Chinese banks are willing to loanheavily, despite global economic
turmoil, to expand Chinese investmentabroad. The health and investment
policies of Chinese will take on an ever-greater impact in the ability to financial
insurable exposures worldwide.Financial risk is an issue.
Chinese Banks’ Lending Activity Abroad Showed Little Impact from theGlobal Financial Crisis, but Eventually, Bank Crises Will Originate in China
Dim Sun Bonds??
America’s industrial rise began 50-60years before it became a global
financial power in the 1920s. Will ittake China that long? Probably not.
$0
$10,000
$20,000
$30,000
$40,000
$50,000
$60,000
$70,000
80 81 82 83 84 85 86 87 88 89 90 91 92 93 94 95 96 97 98 99 00 01 02 03 04 05 06 07 08 09
*Foreign Direct Investments are defined as the net inflows of investment to acquire a lasting management interest (at least 10% of voting stock) in anenterprise operating in an economy other than that of the investor. Outward FDI represents flow from investing country to rest of the world.Source: United Nations UNCTADSTAT; Insurance Information Institute.
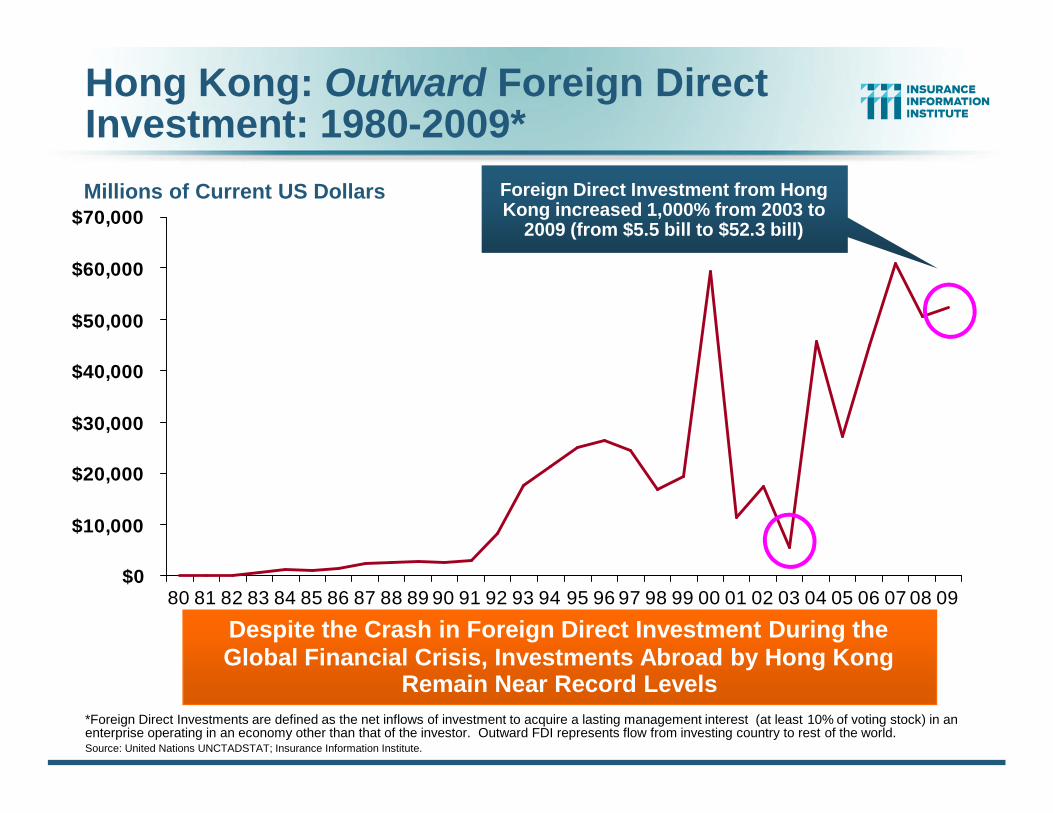
Despite the Crash in Foreign Direct Investment During theGlobal Financial Crisis, Investments Abroad by Hong Kong
Remain Near Record Levels
Millions of Current US Dollars Foreign Direct Investment from HongKong increased 1,000% from 2003 to
2009 (from $5.5 bill to $52.3 bill)
Hong Kong: Outward Foreign DirectInvestment: 1980-2009*

$0
$2,000
$4,000
$6,000
$8,000
$10,000
$12,000
$14,000
$16,000
$18,000
$20,000
80 81 82 83 84 85 86 87 88 89 90 91 92 93 94 95 96 97 98 99 00 01 02 03 04 05 06 07 08 09
*Foreign Direct Investments are defined as the net inflows of investment to acquire a lasting management interest (at least 10% of voting stock) in anenterprise operating in an economy other than that of the investor. Outward FDI represents flow from investing country to rest of the world.Source: United Nations UNCTADSTAT; Insurance Information Institute.
The Global Financial Crisis Hit South Korean Foreign Direct InvestmentAbroad Harder than Was the Case in Several of Its Neighbors
Millions of Current US DollarsForeign Direct Investment from SouthKorea increased 437% from 2001 to2009 (from $2.4 bill to $10.6 bill), but
plunged 44% during the financial crisis
South Korea: Outward Foreign DirectInvestment: 1980-2009*
$0
$50,000
$100,000
$150,000
$200,000
$250,000
$300,000
$350,000
$400,000
$450,000
80 81 82 83 84 85 86 87 88 89 90 91 92 93 94 95 96 97 98 99 00 01 02 03 04 05 06 07 08 09
*Foreign Direct Investments are defined as the net inflows of investment to acquire a lasting management interest (at least 10% of voting stock) in anenterprise operating in an economy other than that of the investor. Outward FDI represents flow from investing country to rest of the world.Source: United Nations UNCTADSTAT; Insurance Information Institute.
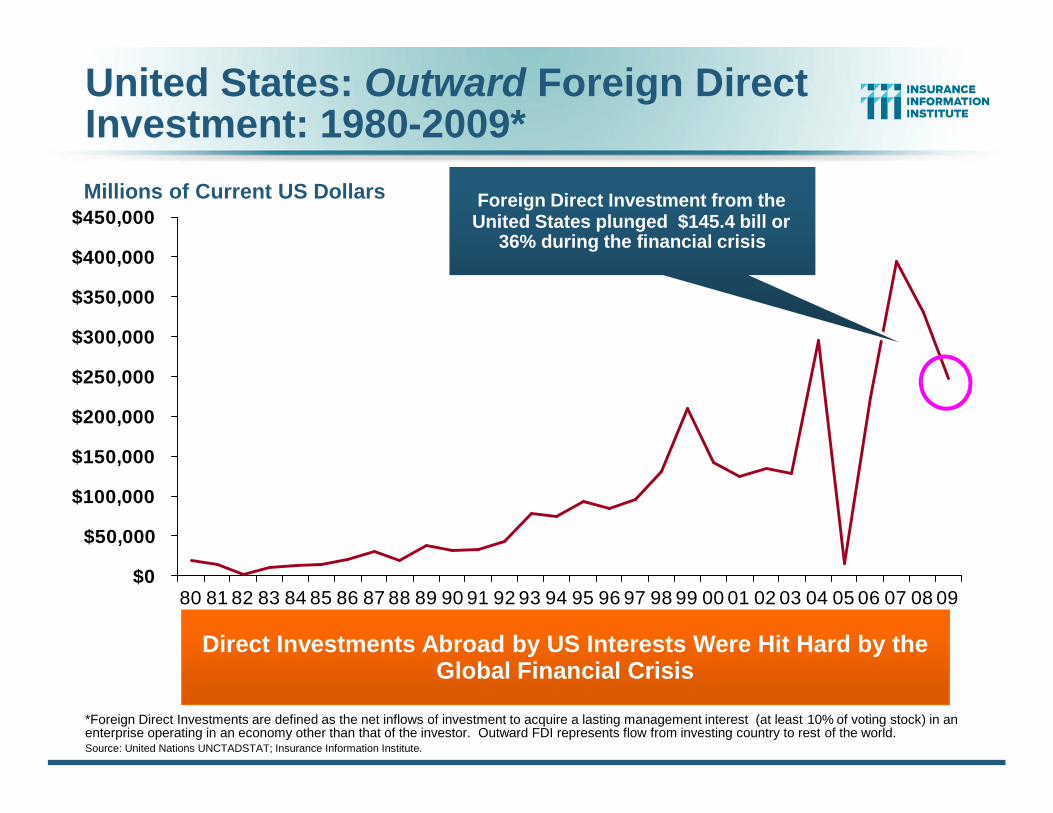
Direct Investments Abroad by US Interests Were Hit Hard by theGlobal Financial Crisis
Millions of Current US Dollars Foreign Direct Investment from theUnited States plunged $145.4 bill or
36% during the financial crisis
United States: Outward Foreign DirectInvestment: 1980-2009*
77
P/C Insurance IndustryFinancial Overview
Profit Recovery ContinuesEarly Stage Growth Begins
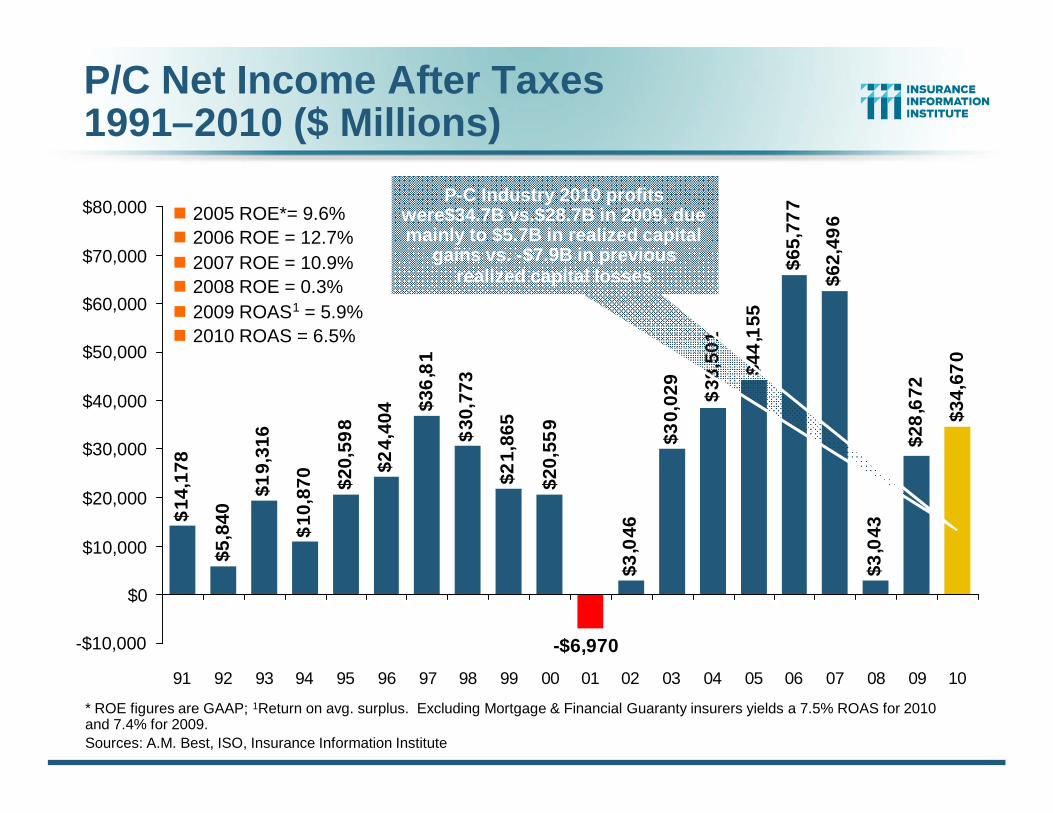
P/C Net Income After Taxes1991–2010 ($ Millions)
$14
,178
$5,8
40
$19,
316
$10
,870 $2
0,59
8
$24,
404 $3
6,8
19
$30
,773
$21,
865
$3,0
46
$30,
029
$62,
496
$3,0
43
$34,
670
$28
,672
-$6,970
$65,
777
$44
,155
$20,
559
$38
,501
-$10,000
$0
$10,000
$20,000
$30,000
$40,000
$50,000
$60,000
$70,000
$80,000
91 92 93 94 95 96 97 98 99 00 01 02 03 04 05 06 07 08 09 10
2005 ROE*= 9.6%2006 ROE = 12.7%2007 ROE = 10.9%2008 ROE = 0.3%2009 ROAS1 = 5.9%2010 ROAS = 6.5%
P-C Industry 2010 profitswere$34.7B vs.$28.7B in 2009, duemainly to $5.7B in realized capital
gains vs. -$7.9B in previousrealized capital losses
* ROE figures are GAAP; 1Return on avg. surplus. Excluding Mortgage & Financial Guaranty insurers yields a 7.5% ROAS for 2010and 7.4% for 2009.Sources: A.M. Best, ISO, Insurance Information Institute
79
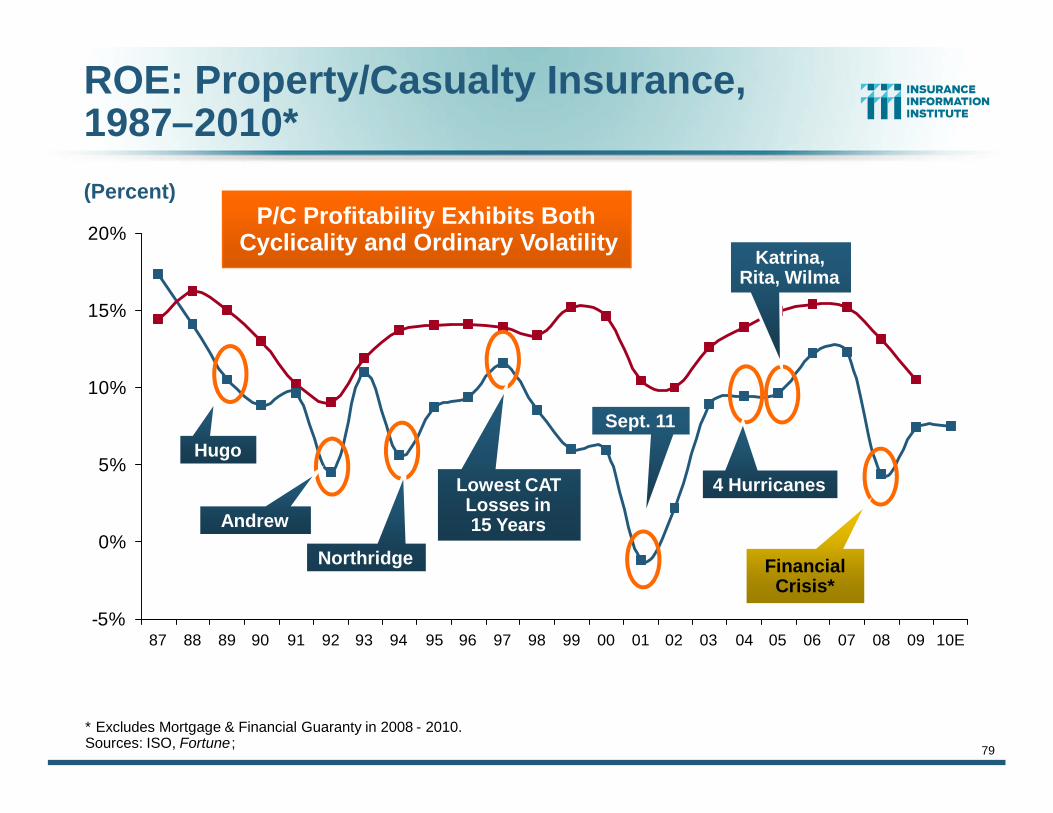
ROE: Property/Casualty Insurance,1987–2010*
* Excludes Mortgage & Financial Guaranty in 2008 - 2010.Sources: ISO, Fortune ;
-5%
0%
5%
10%
15%
20%
87 88 89 90 91 92 93 94 95 96 97 98 99 00 01 02 03 04 05 06 07 08 09 10E
P/C Profitability Exhibits BothCyclicality and Ordinary Volatility
Hugo
Andrew
Northridge
Lowest CATLosses in15 Years
Sept. 11
Katrina,Rita, Wilma
4 Hurricanes
FinancialCrisis*
(Percent)
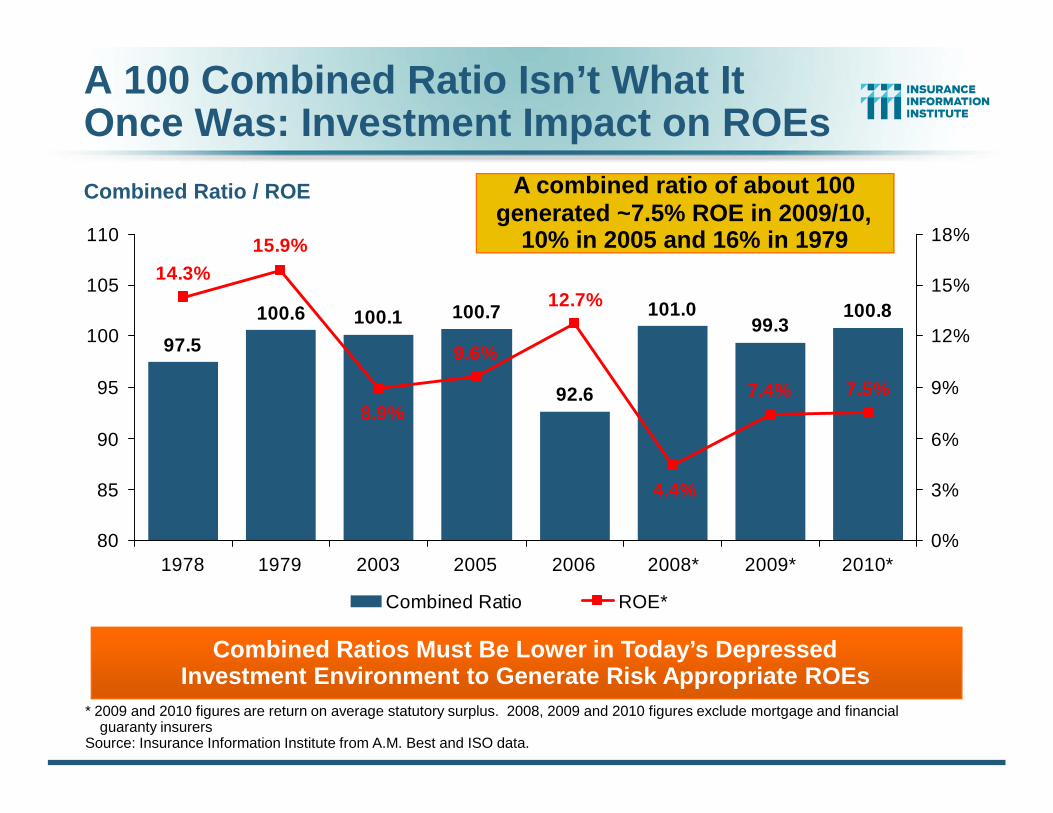
A 100 Combined Ratio Isn’t What ItOnce Was: Investment Impact on ROEs
Combined Ratio / ROE
* 2009 and 2010 figures are return on average statutory surplus. 2008, 2009 and 2010 figures exclude mortgage and financialguaranty insurers
Source: Insurance Information Institute from A.M. Best and ISO data.
97.5
100.6 100.1 100.7
92.6
99.3100.8101.0
7.5%7.4%
9.6%
15.9%14.3%
12.7%
4.4%
8.9%
80
85
90
95
100
105
110
1978 1979 2003 2005 2006 2008* 2009* 2010*0%
3%
6%
9%
12%
15%
18%
Combined Ratio ROE*
Combined Ratios Must Be Lower in Today’s DepressedInvestment Environment to Generate Risk Appropriate ROEs
A combined ratio of about 100generated ~7.5% ROE in 2009/10,
10% in 2005 and 16% in 1979

PREMIUM GROWTH TRENDS
81
Winds of Change orMoving Sideways?
82
-5%
0%
5%
10%
15%
20%
25%
71 72 73 74 75 76 77 78 79 80 81 82 83 84 85 86 87 88 89 90 91 92 93 94 95 96 97 98 99 00 01 02 03 04 05 06 07 08 0910
E11
F
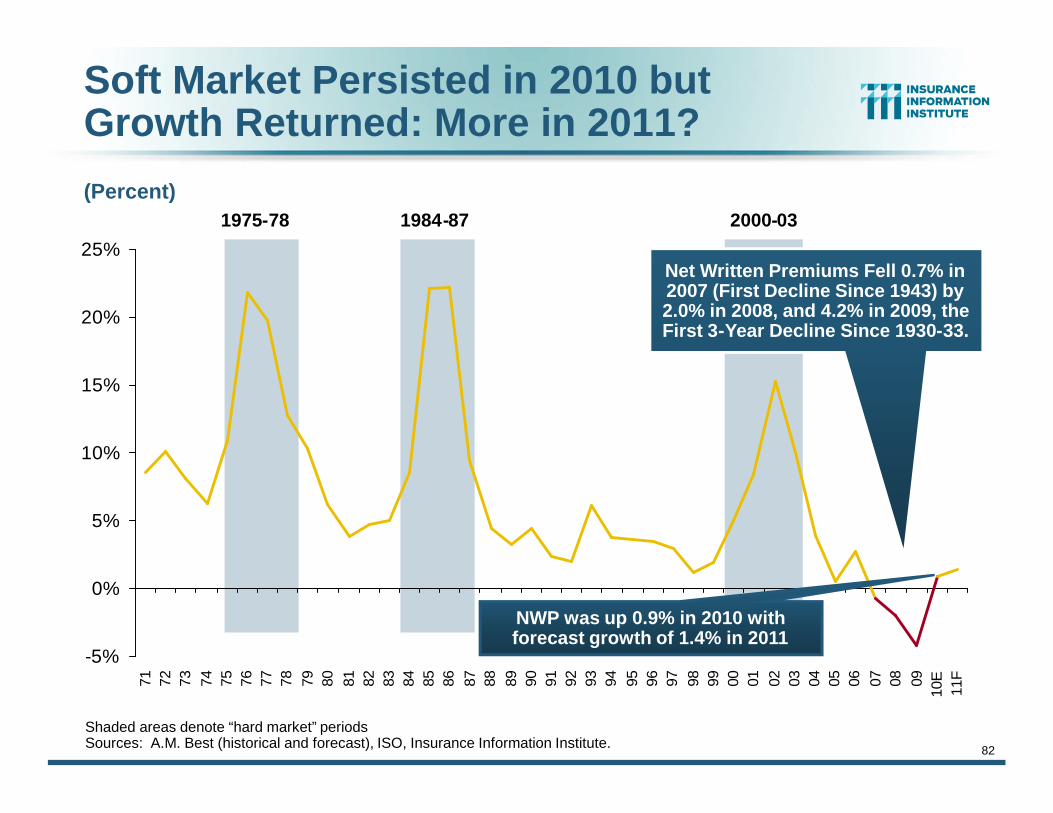
Soft Market Persisted in 2010 butGrowth Returned: More in 2011?
(Percent)1975-78 1984-87 2000-03
Shaded areas denote “hard market” periodsSources: A.M. Best (historical and forecast), ISO, Insurance Information Institute.
Net Written Premiums Fell 0.7% in2007 (First Decline Since 1943) by2.0% in 2008, and 4.2% in 2009, theFirst 3-Year Decline Since 1930-33.
NWP was up 0.9% in 2010 withforecast growth of 1.4% in 2011
83
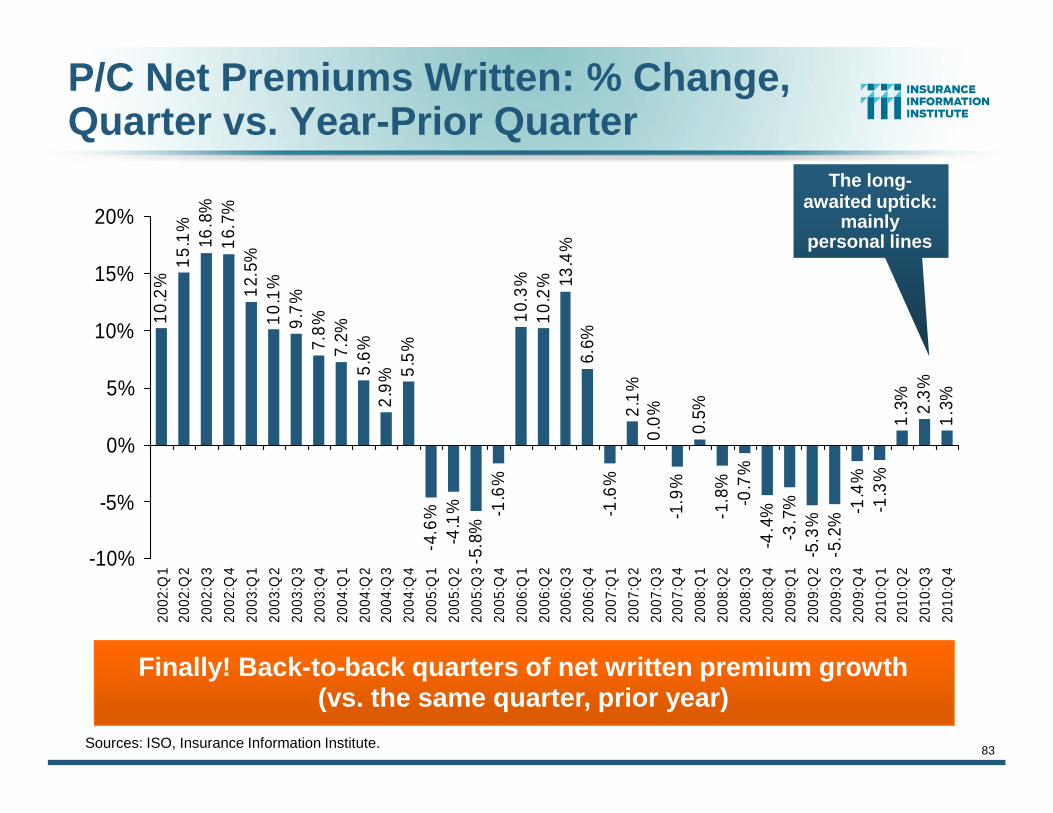
P/C Net Premiums Written: % Change,Quarter vs. Year-Prior Quarter
Sources: ISO, Insurance Information Institute.
Finally! Back-to-back quarters of net written premium growth(vs. the same quarter, prior year)
10.2
%15
.1%
16.8
%16
.7%
12.5
%10
.1%
9.7%
7.8%
7.2%
5.6%
2.9%
5.5%
-4.6
%-4
.1%
-5.8
%-1
.6%
10.3
%10
.2% 13
.4%
6.6%
-1.6
%2.
1%0.
0%-1
.9%
0.5%
-1.8
%-0
.7%
-4.4
%-3
.7%
-5.3
%-5
.2%
-1.4
%-1
.3%
1.3% 2.
3%1.
3%
-10%
-5%
0%
5%
10%
15%
20%
2002
:Q1
2002
:Q2
2002
:Q3
2002
:Q4
2003
:Q1
2003
:Q2
2003
:Q3
2003
:Q4
2004
:Q1
2004
:Q2
2004
:Q3
2004
:Q4
2005
:Q1
2005
:Q2
2005
:Q3
2005
:Q4
2006
:Q1
2006
:Q2
2006
:Q3
2006
:Q4
2007
:Q1
2007
:Q2
2007
:Q3
2007
:Q4
2008
:Q1
2008
:Q2
2008
:Q3
2008
:Q4
2009
:Q1
2009
:Q2
2009
:Q3
2009
:Q4
2010
:Q1
2010
:Q2
2010
:Q3
2010
:Q4
The long-awaited uptick:
mainlypersonal lines
84
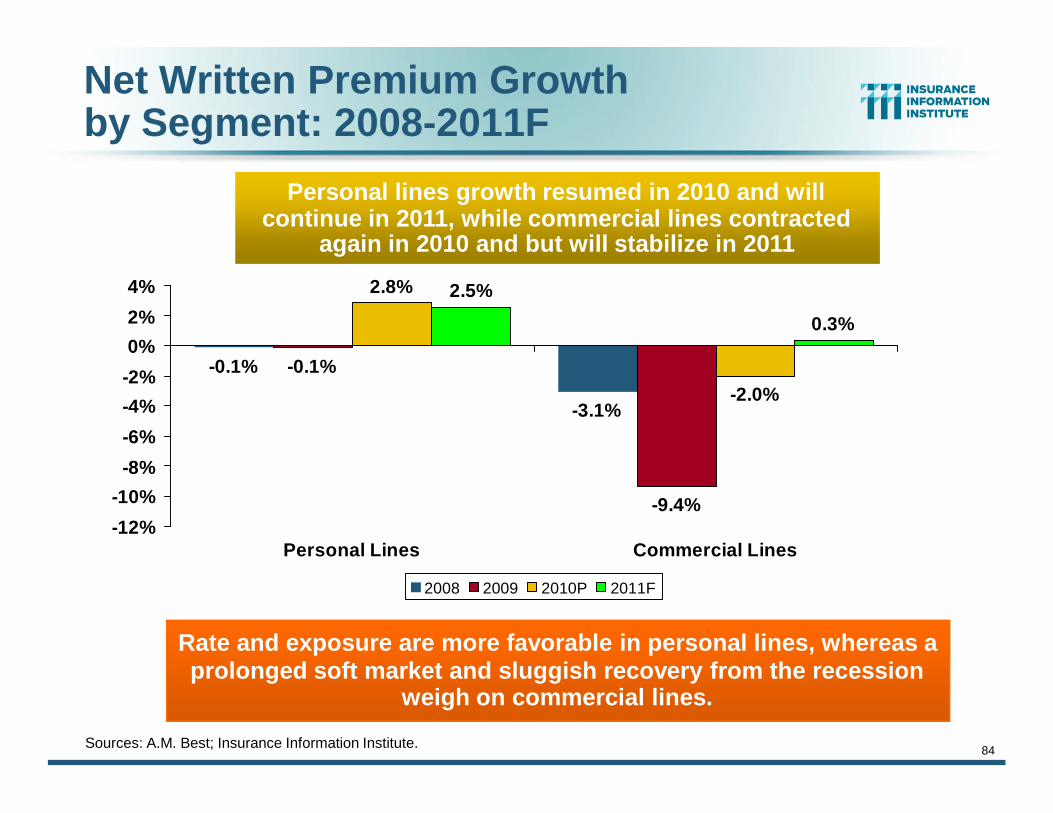
Net Written Premium Growthby Segment: 2008-2011F
-0.1%
-9.4%
2.8%
-2.0%
2.5%
0.3%
-3.1%
-0.1%
-12%
-10%
-8%
-6%
-4%
-2%
0%
2%
4%
Personal Lines Commercial Lines
2008 2009 2010P 2011F
Rate and exposure are more favorable in personal lines, whereas aprolonged soft market and sluggish recovery from the recession
weigh on commercial lines.
Personal lines growth resumed in 2010 and willcontinue in 2011, while commercial lines contracted
again in 2010 and but will stabilize in 2011
Sources: A.M. Best; Insurance Information Institute.
UNDERWRITING
85
Cyclicality is Driven Primarilyby the Industry’s Underwriting
Cycle, Not the Economy
86
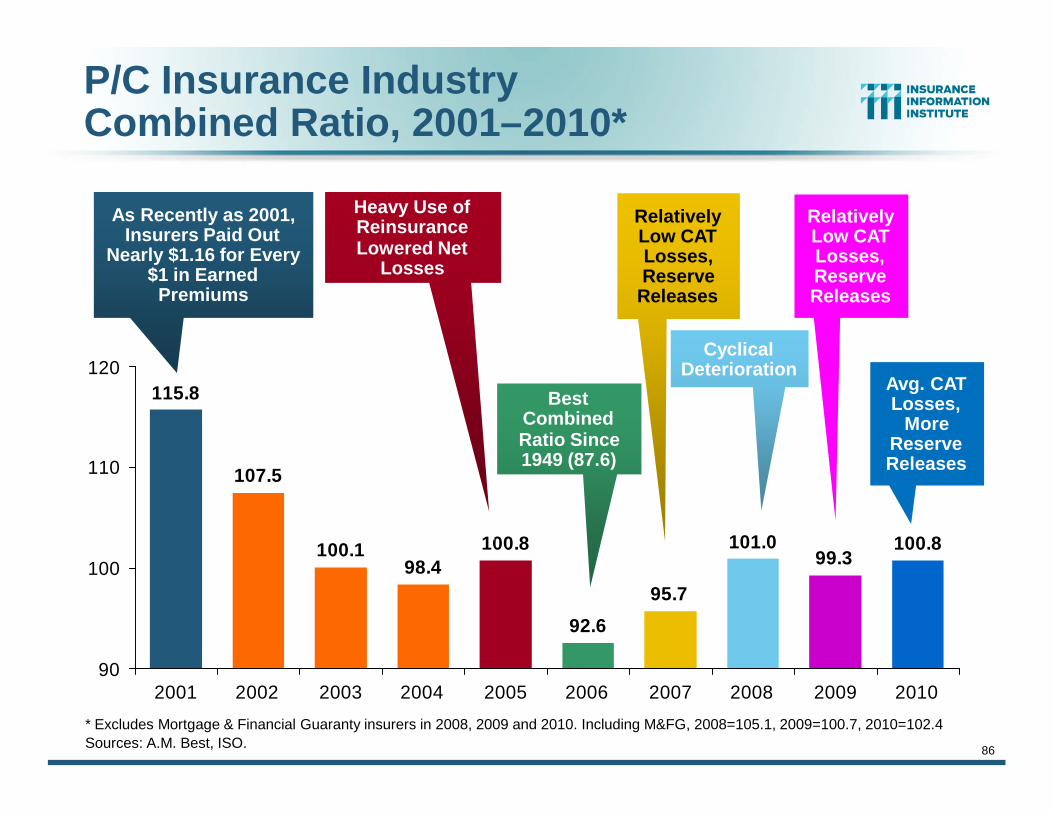
P/C Insurance IndustryCombined Ratio, 2001–2010*
* Excludes Mortgage & Financial Guaranty insurers in 2008, 2009 and 2010. Including M&FG, 2008=105.1, 2009=100.7, 2010=102.4Sources: A.M. Best, ISO.
95.7
99.3100.8101.0
92.6
100.898.4
100.1
107.5
115.8
90
100
110
120
2001 2002 2003 2004 2005 2006 2007 2008 2009 2010
BestCombinedRatio Since1949 (87.6)
As Recently as 2001,Insurers Paid Out
Nearly $1.16 for Every$1 in Earned
Premiums
RelativelyLow CATLosses,Reserve
Releases
CyclicalDeterioration
Heavy Use ofReinsuranceLowered Net
Losses
RelativelyLow CATLosses,ReserveReleases
Avg. CATLosses,
MoreReserveReleases
87
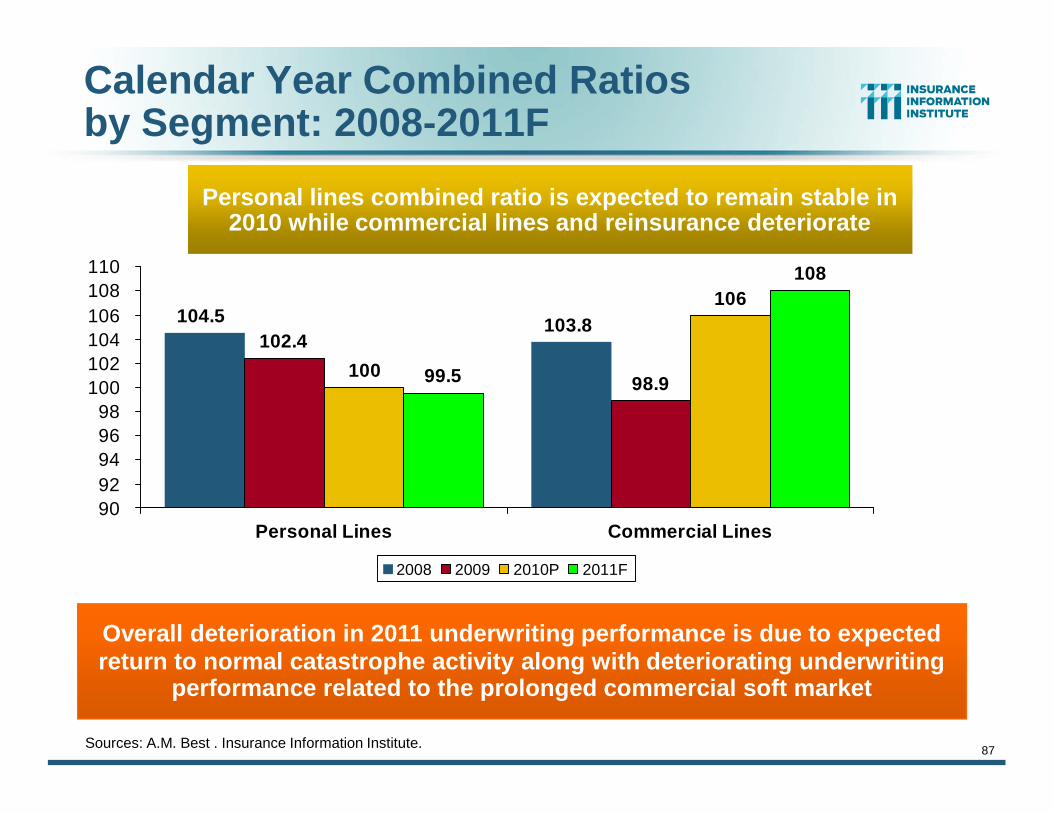
Calendar Year Combined Ratiosby Segment: 2008-2011F
Sources: A.M. Best . Insurance Information Institute.
102.4
98.9100
106
99.5
108
103.8104.5
9092949698
100102104106108110
Personal Lines Commercial Lines
2008 2009 2010P 2011F
Overall deterioration in 2011 underwriting performance is due to expectedreturn to normal catastrophe activity along with deteriorating underwriting
performance related to the prolonged commercial soft market
Personal lines combined ratio is expected to remain stable in2010 while commercial lines and reinsurance deteriorate
88
2.3
-2.1
-8.3
-2.6-6.6
-9.9-9.8
-4.1
1
11.7
23.2
13.79.9
7.3
-6.7-9.5
-14.6-16 -15
-5
-$20
-$15
-$10
-$5
$0
$5
$10
$15
$20
$25
$309
2
93
94
95
96
97
98
99
00
01
02
03
04
05
06
07
08
09
10E
11E
Pri
or
Yr.
Re
serv
eR
elea
se
($B
)
-6
-4
-2
0
2
4
6
8 Imp
acton
Co
mb
ined
Ra
tio(P
oin
ts)
Prior Yr. ReserveDevelopment ($B)
Impact onCombined Ratio
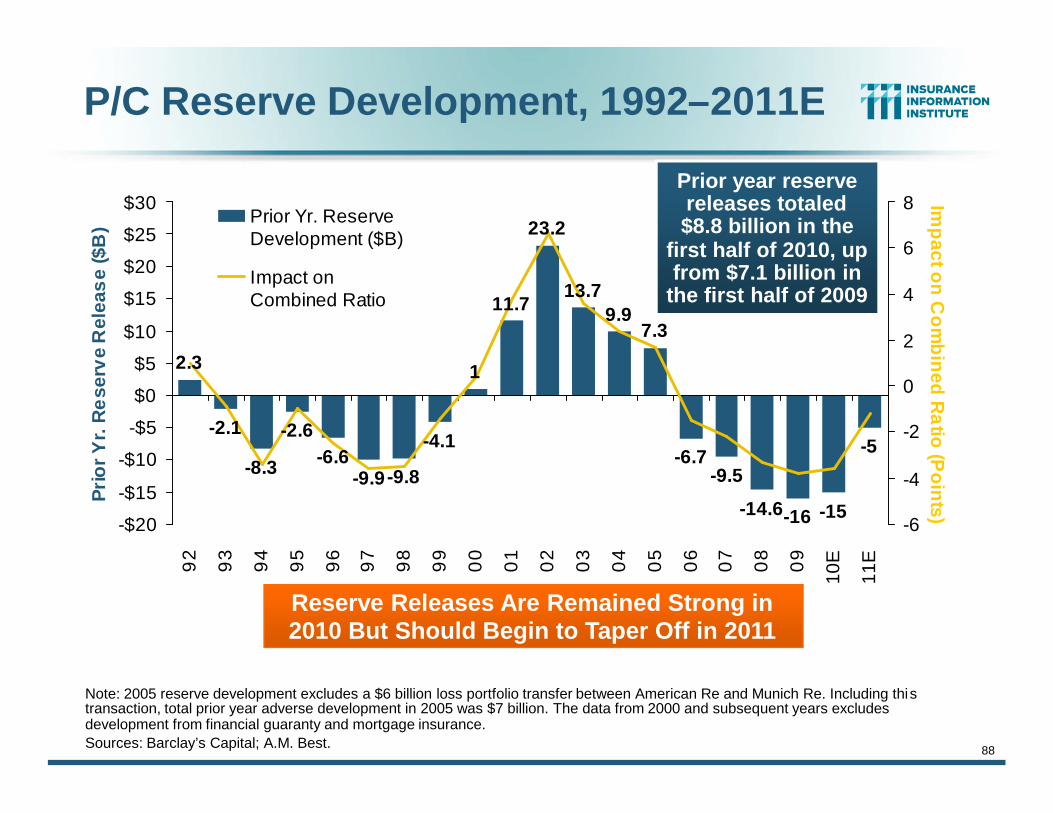
P/C Reserve Development, 1992–2011E
Reserve Releases Are Remained Strong in2010 But Should Begin to Taper Off in 2011
Note: 2005 reserve development excludes a $6 billion loss portfolio transfer between American Re and Munich Re. Including thistransaction, total prior year adverse development in 2005 was $7 billion. The data from 2000 and subsequent years excludesdevelopment from financial guaranty and mortgage insurance.Sources: Barclay’s Capital; A.M. Best.
Prior year reservereleases totaled$8.8 billion in the
first half of 2010, upfrom $7.1 billion in
the first half of 2009
EXPENSES
89
Expense Ratios Are Highly Cyclicaland Contribute DeterioratingUnderwriting Performance
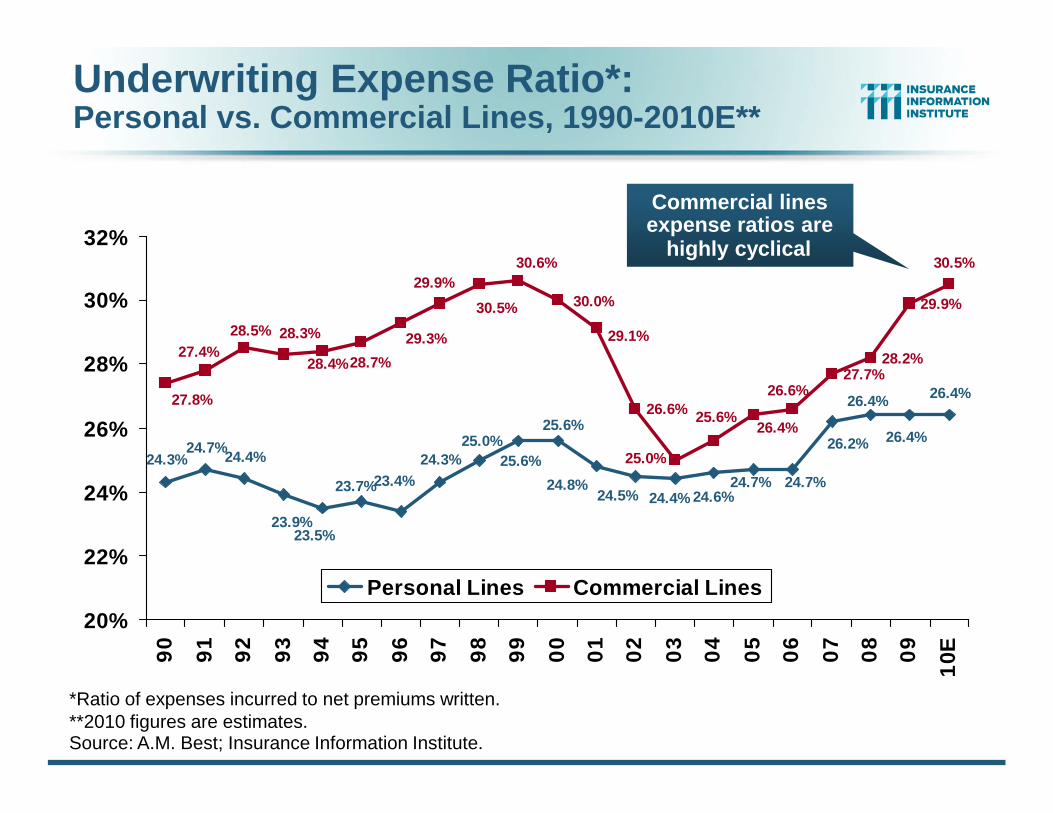
Underwriting Expense Ratio*:Personal vs. Commercial Lines, 1990-2010E**
24.3%24.7%
24.4% 24.3%
26.4%26.6%
27.7%28.2%
29.9%
24.5%
26.4%
26.4%26.2%
24.7%24.7%24.6%24.4%
23.4%23.7%
23.5%
25.0%
23.9%
25.6%
25.6%
24.8%
30.5%30.6%
25.6%
28.5%
26.4%
26.6%
25.0%
29.1%
30.0%30.5%
28.4%
28.3%27.4%
27.8%
28.7%
29.3%
29.9%
20%
22%
24%
26%
28%
30%
32%
90
91
92
93
94
95
96
97
98
99
00
01
02
03
04
05
06
07
08
09
10E
Personal Lines Commercial Lines
*Ratio of expenses incurred to net premiums written.**2010 figures are estimates.Source: A.M. Best; Insurance Information Institute.
Commercial linesexpense ratios are
highly cyclical

INVESTMENTS:THE NEW REALITY
91
Investment Performance is aKey Driver of Profitability
Does It InfluenceUnderwriting or Cyclicality?
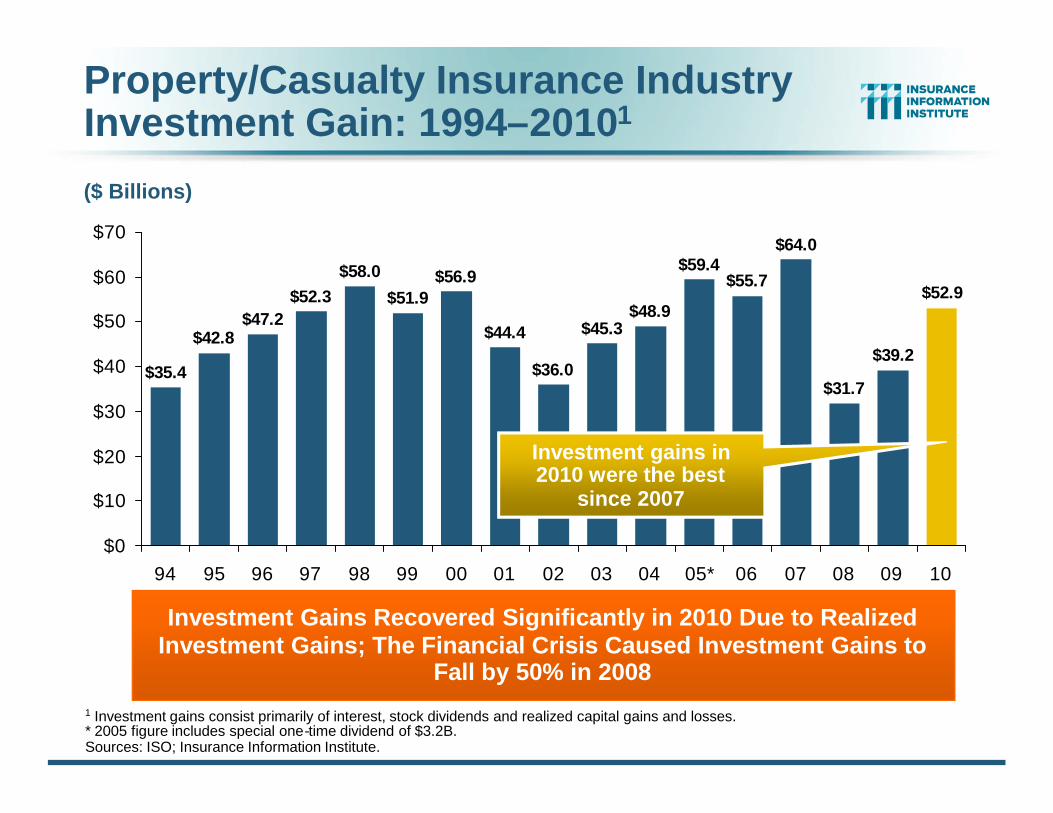
Property/Casualty Insurance IndustryInvestment Gain: 1994–20101
$35.4
$42.8$47.2
$52.3
$44.4
$36.0
$45.3$48.9
$59.4$55.7
$64.0
$31.7
$39.2
$52.9$58.0
$51.9$56.9
$0
$10
$20
$30
$40
$50
$60
$70
94 95 96 97 98 99 00 01 02 03 04 05* 06 07 08 09 10
Investment Gains Recovered Significantly in 2010 Due to RealizedInvestment Gains; The Financial Crisis Caused Investment Gains to
Fall by 50% in 20081 Investment gains consist primarily of interest, stock dividends and realized capital gains and losses.* 2005 figure includes special one-time dividend of $3.2B.Sources: ISO; Insurance Information Institute.
($ Billions)
Investment gains in2010 were the best
since 2007
93
-1.8
%
-1.8
%
-2.0
%
-3.6
%
-3.3
%
-3.3
%
-3.7
%
-4.3
%
-5.2
%
-5.7
%
-7.3%
-1.9
%
-2.1
%
-3.1
%
-8%-7%-6%-5%-4%-3%-2%-1%0%
Perso
nal L
ines
PvtPass
Auto
PersPro
p
Commer
cial
Comm
lAuto
Credit
CommPro
p
Comm
Cas
Fidelity/
Surety
Warra
nty
Surplu
s Lines
MedM
al
WC
Reinsura
nce**
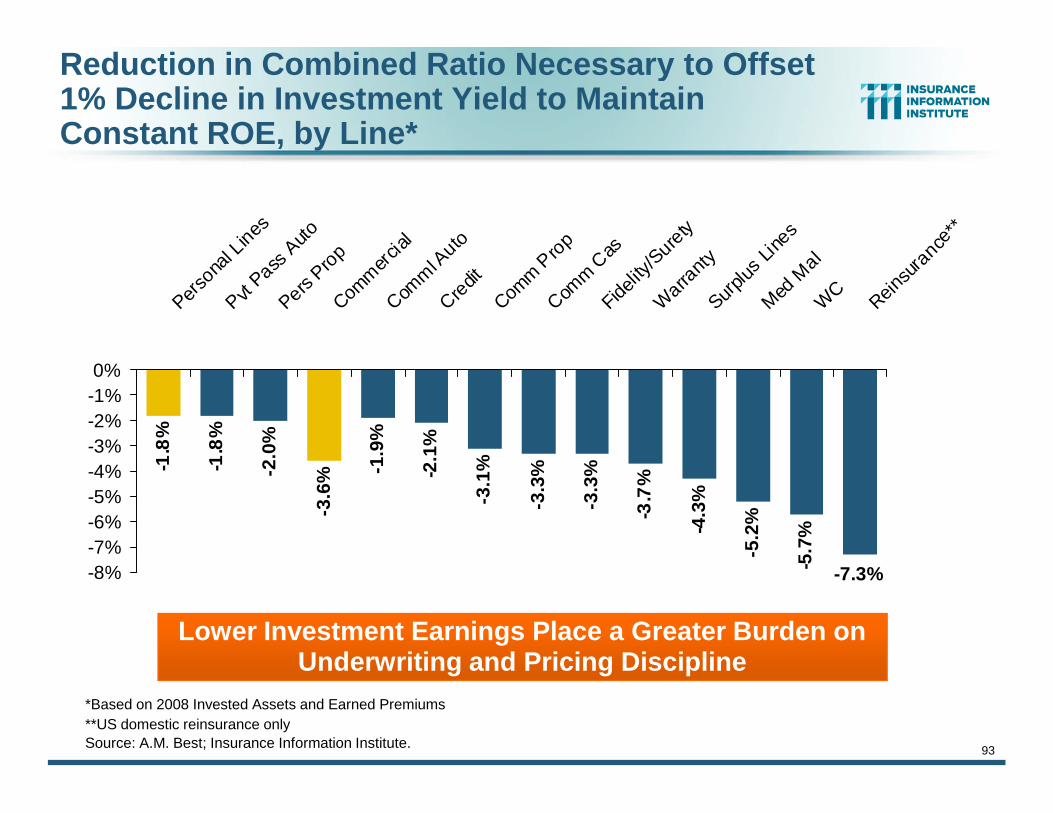
Lower Investment Earnings Place a Greater Burden onUnderwriting and Pricing Discipline
*Based on 2008 Invested Assets and Earned Premiums**US domestic reinsurance onlySource: A.M. Best; Insurance Information Institute.
Reduction in Combined Ratio Necessary to Offset1% Decline in Investment Yield to MaintainConstant ROE, by Line*

Financial Strength &Underwriting
94
Cyclical Pattern is P-C ImpairmentHistory is Directly Tied to
Underwriting, Reserving & Pricing
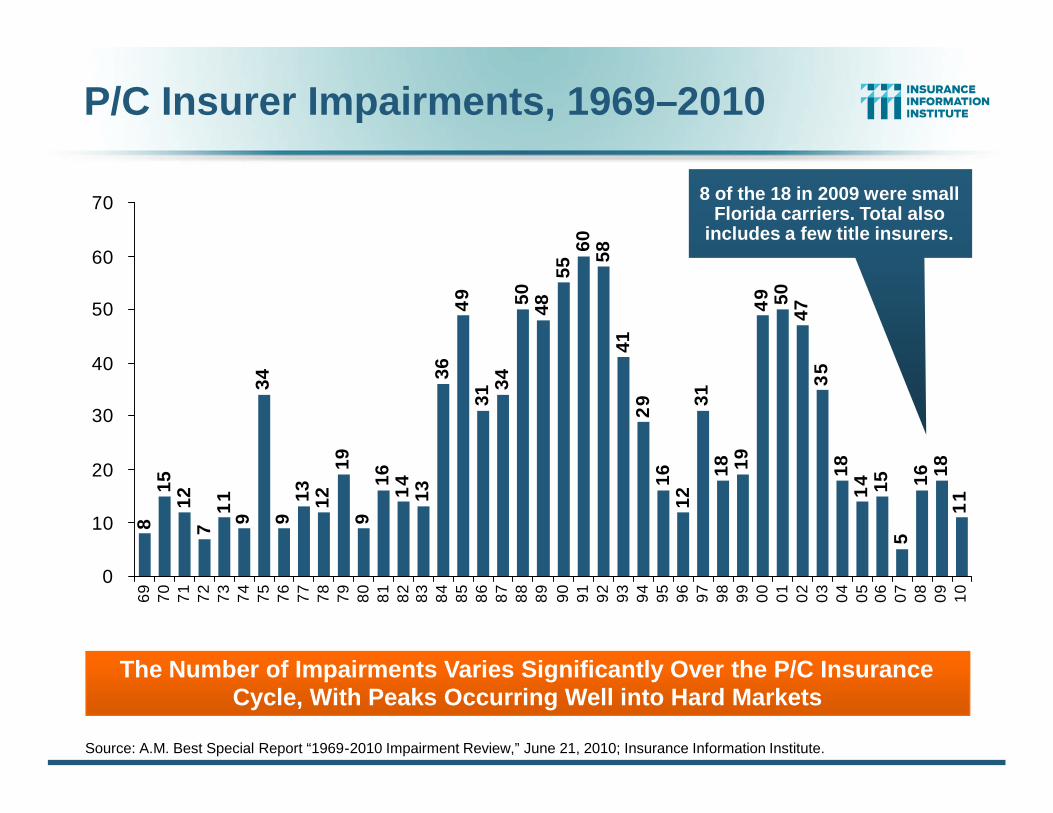
P/C Insurer Impairments, 1969–20108
1512
71
19
349
13 1219
916
14
1336
49
3134
50 4855
60 5841
29
1612
3118 19
49 50
473
518
14 15 16 18
11
5
0
10
20
30
40
50
60
70
69 70 71 72 73 74 75 76 77 78 79 80 81 82 83 84 85 86 87 88 89 90 91 92 93 94 95 96 97 98 99 00 01 02 03 04 05 06 07 08 09 10
Source: A.M. Best Special Report “1969-2010 Impairment Review,” June 21, 2010; Insurance Information Institute.
The Number of Impairments Varies Significantly Over the P/C InsuranceCycle, With Peaks Occurring Well into Hard Markets
8 of the 18 in 2009 were smallFlorida carriers. Total also
includes a few title insurers.
96
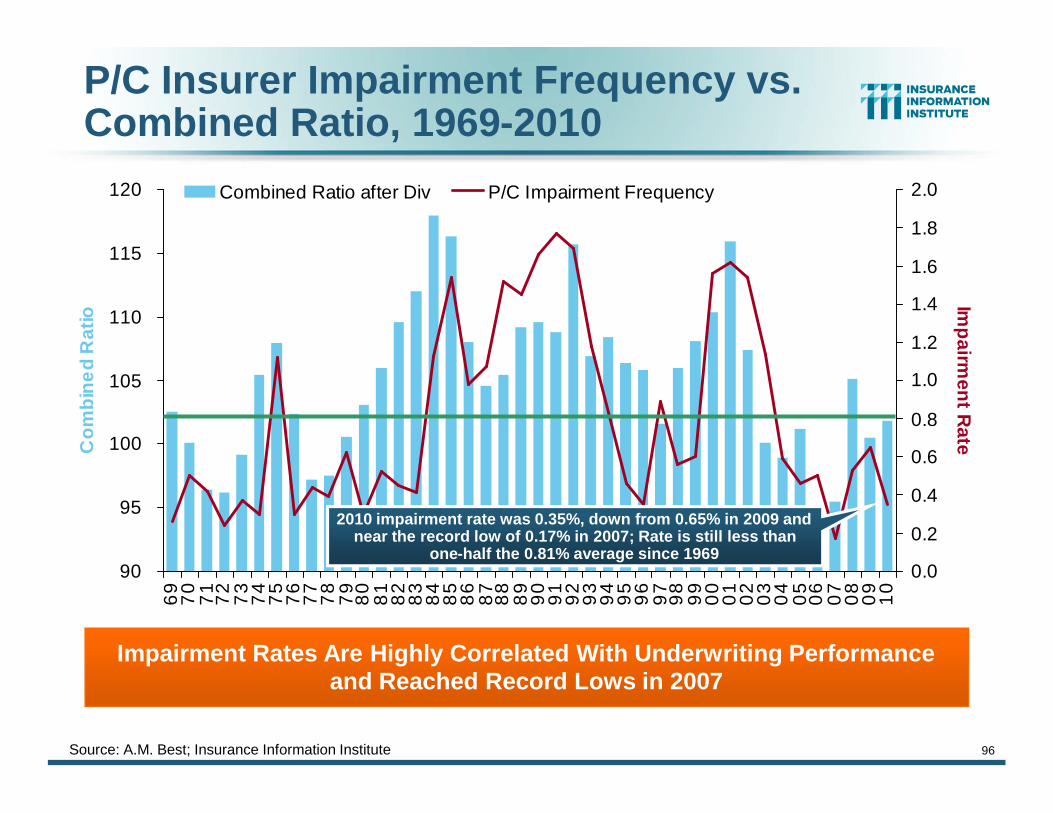
P/C Insurer Impairment Frequency vs.Combined Ratio, 1969-2010
90
95
100
105
110
115
1206
97
07
17
27
37
47
57
67
77
87
98
08
18
28
38
48
58
68
78
88
99
09
19
29
39
49
59
69
79
89
90
00
10
20
30
40
50
60
70
80
91
0
Co
mb
ine
dR
atio
0.0
0.2
0.4
0.6
0.8
1.0
1.2
1.4
1.6
1.8
2.0
Imp
airmen
tR
ate
Combined Ratio after Div P/C Impairment Frequency
Source: A.M. Best; Insurance Information Institute
2010 impairment rate was 0.35%, down from 0.65% in 2009 andnear the record low of 0.17% in 2007; Rate is still less than
one-half the 0.81% average since 1969
Impairment Rates Are Highly Correlated With Underwriting Performanceand Reached Record Lows in 2007
97
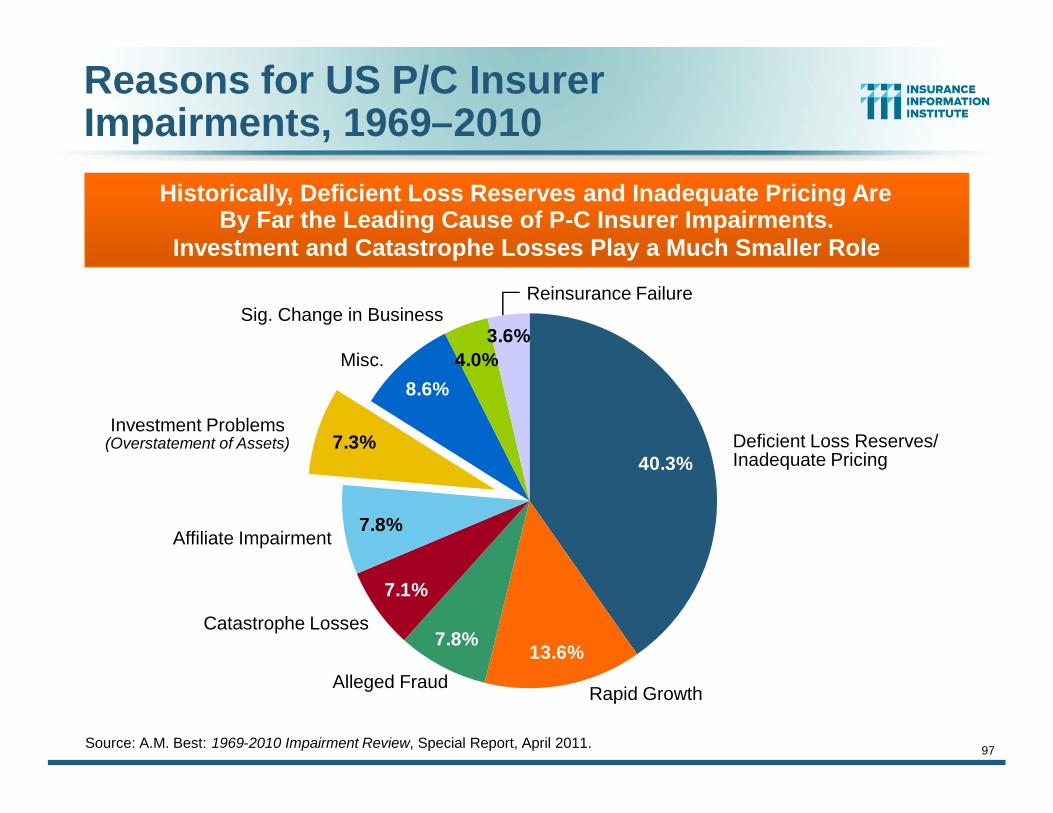
Reasons for US P/C InsurerImpairments, 1969–2010
3.6%4.0%
8.6%
7.3%
7.8%
7.1%
7.8%13.6%
40.3%
Source: A.M. Best: 1969-2010 Impairment Review, Special Report, April 2011.
Historically, Deficient Loss Reserves and Inadequate Pricing AreBy Far the Leading Cause of P-C Insurer Impairments.
Investment and Catastrophe Losses Play a Much Smaller Role
Deficient Loss Reserves/Inadequate Pricing
Reinsurance Failure
Rapid GrowthAlleged Fraud
Catastrophe Losses
Affiliate Impairment
Investment Problems(Overstatement of Assets)
Misc.
Sig. Change in Business
98
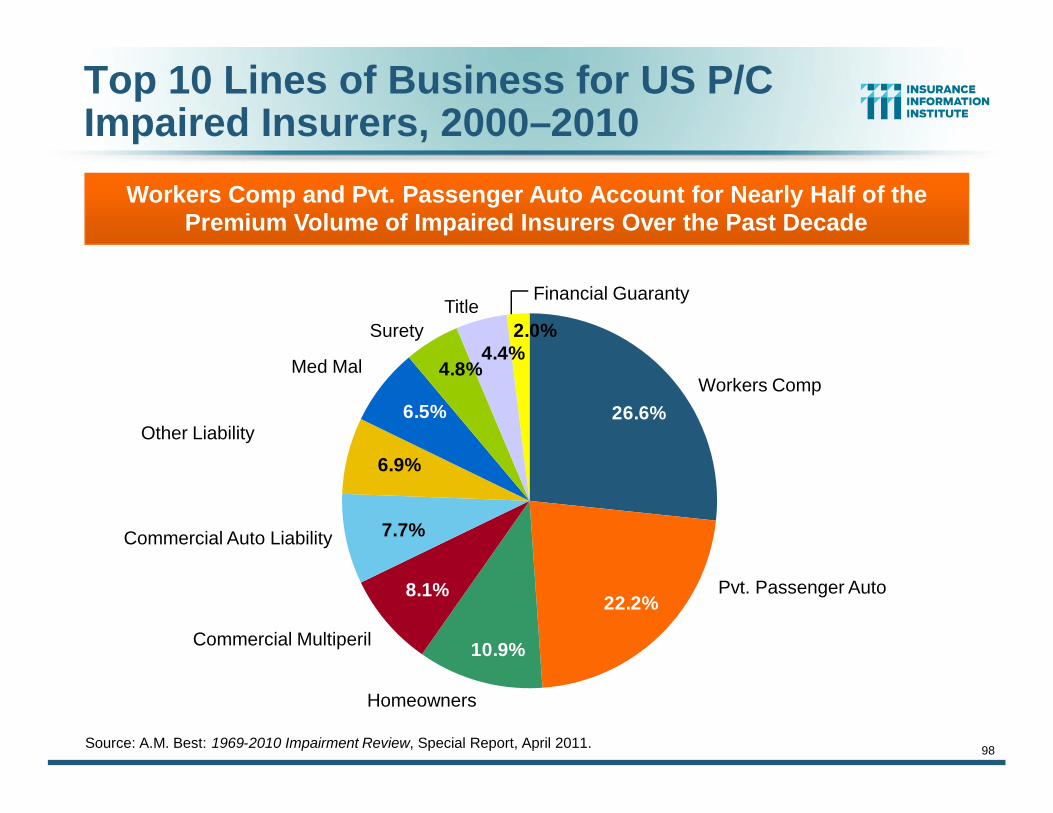
Top 10 Lines of Business for US P/CImpaired Insurers, 2000–2010
2.0%4.4%
4.8%
6.5%
6.9%
7.7%
8.1%
10.9%
22.2%
26.6%
Source: A.M. Best: 1969-2010 Impairment Review, Special Report, April 2011.
Workers Comp and Pvt. Passenger Auto Account for Nearly Half of thePremium Volume of Impaired Insurers Over the Past Decade
Workers Comp
Financial Guaranty
Pvt. Passenger Auto
Homeowners
Commercial Multiperil
Commercial Auto Liability
Other Liability
Med Mal
SuretyTitle

CAPITAL MANAGEMENT &LEVERAGE
99
Excess Capital is a Major Obstacleto a Market Turn;
Capital Management Decisions WillImpact Market Direction
100
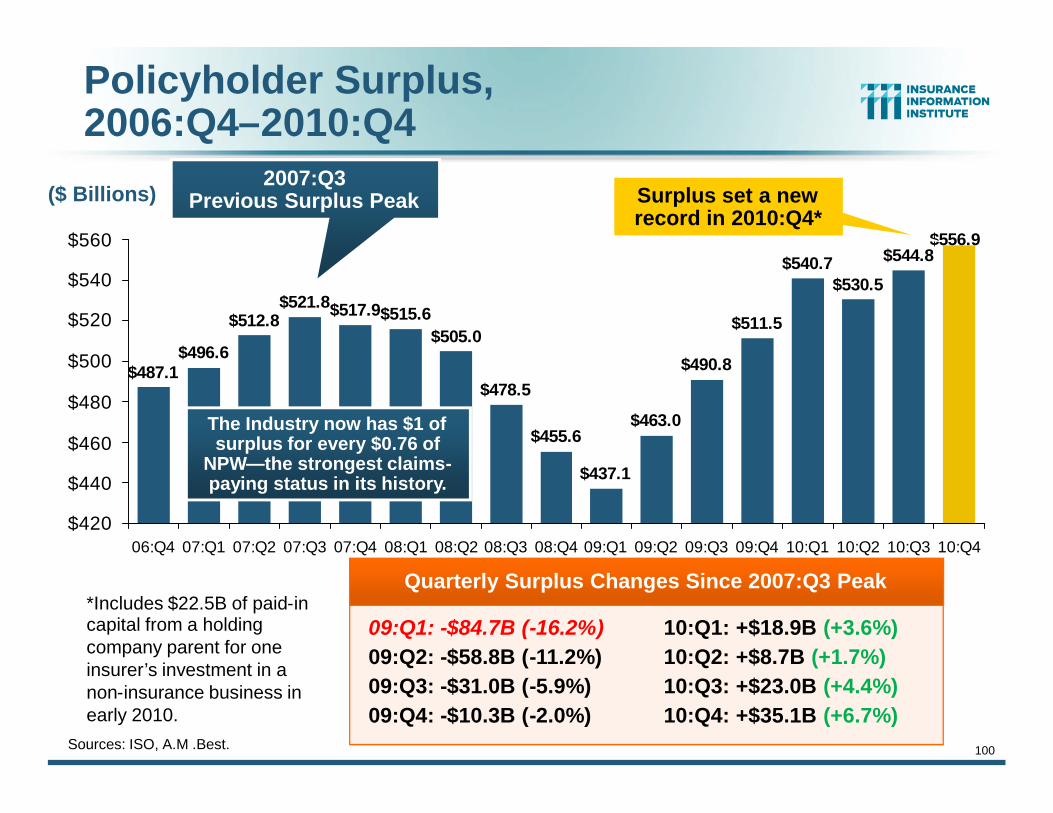
Policyholder Surplus,2006:Q4–2010:Q4
Sources: ISO, A.M .Best.
($ Billions)
$487.1$496.6
$512.8$521.8
$478.5
$455.6
$437.1
$463.0
$490.8
$511.5
$540.7$530.5
$544.8$556.9
$505.0$515.6$517.9
$420
$440
$460
$480
$500
$520
$540
$560
06:Q4 07:Q1 07:Q2 07:Q3 07:Q4 08:Q1 08:Q2 08:Q3 08:Q4 09:Q1 09:Q2 09:Q3 09:Q4 10:Q1 10:Q2 10:Q3 10:Q4
2007:Q3Previous Surplus Peak
Quarterly Surplus Changes Since 2007:Q3 Peak
09:Q1: -$84.7B (-16.2%)09:Q2: -$58.8B (-11.2%)09:Q3: -$31.0B (-5.9%)09:Q4: -$10.3B (-2.0%)
10:Q1: +$18.9B (+3.6%)10:Q2: +$8.7B (+1.7%)10:Q3: +$23.0B (+4.4%)10:Q4: +$35.1B (+6.7%)
Surplus set a newrecord in 2010:Q4*
*Includes $22.5B of paid-incapital from a holdingcompany parent for oneinsurer’s investment in anon-insurance business inearly 2010.
The Industry now has $1 ofsurplus for every $0.76 of
NPW—the strongest claims-paying status in its history.

www.iii.org
Thank you for your timeand your attention!
Twitter: twitter.com/bob_hartwigDownload at www.iii.org/presentations
Insurance Information Institute Online: