Embed Size (px)
Citation preview

GLOBAL ECONOMIC CONDITIONS SURVEY REPORT: Q2, 2021

© The Association of Chartered Certified Accountants, Institute of Management AccountantsJuly 2021
About ACCA ACCA is the Association of Chartered Certified Accountants. We’re a thriving global community of 227,000 members and 544,000 future members based in 176 countries that upholds the highest professional and ethical values.
We believe that accountancy is a cornerstone profession of society that supports both public and private sectors. That’s why we’re committed to the development of a strong global accountancy profession and the many benefits that this brings to society and individuals.
Since 1904 being a force for public good has been embedded in our purpose. And because we’re a not-for-profit organisation, we build a sustainable global profession by re-investing our surplus to deliver member value and develop the profession for the next generation.
Through our world leading ACCA Qualification, we offer everyone everywhere the opportunity to experience a rewarding career in accountancy, finance and management. And using our respected research, we lead the profession by answering today’s questions and preparing us for tomorrow.
Find out more at www.accaglobal.com
About IMA® (Institute of Management Accountants)IMA® is one of the largest and most respected associations focused exclusively on advancing the management accounting profession. Globally, IMA supports the profession through research, the CMA® (Certified Management Accountant) and CSCA® (Certified in Strategy and Competitive Analysis) programs, continuing education, networking, and advocacy of the highest ethical business practices. Twice named Professional Body of the Year by The Accountant/International Accounting Bulletin, IMA has a global network of about 140,000 members in 150 countries and 350 professional and student chapters. Headquartered in Montvale, N.J., USA, IMA provides localized services through its four global regions: The Americas, Asia/Pacific, Europe and Middle East/India.
For more information about IMA, please visit: www.imanet.org

Introduction
THE GLOBAL ECONOMIC CONDITIONS SURVEY (GECS), IS THE LARGEST REGULAR ECONOMIC SURVEY OF ACCOUNTANTS AROUND THE WORLD.
The Global Economic Conditions Survey (GECS), carried out jointly by ACCA (the Association of Chartered Certified Accountants) and IMA (the Institute of Management Accountants), is the largest regular economic survey of accountants around the world, in terms of both the number of respondents and the range of economic variables it monitors.
The GECS has been conducted for over 10 years. Its main indices are good lead indicators of economic activity and provide a valuable insight into the views of finance professionals on key variables, such as investment, employment and costs.
Fieldwork for the 2021 Q2 survey took place between 1 and 15 June 2021 and attracted 1,100 responses from ACCA and IMA members, including over 100 CFOs.
ACCA and IMA would like to thank all members who took the time to respond to the survey. It is their first-hand insights into the fortunes of companies around the world that make GECS a trusted barometer for the global economy.
3

-40
-35
-30
-25
-20
-15
-10
-5
0
-10
-8
-6
-4
-2
0
2
4
6
The Q2 Global Economic Conditions Survey (GECS) points to strong global economic growth in the second half of the year. Confidence remains very high, slipping only marginally from the record high in the previous survey. As the roll out of vaccines gathers pace in many developed countries, so economic conditions are moving towards normal. Monetary and fiscal policy remains supportive, especially in the US where the extremely large fiscal stimulus is boosting the world economy. The global orders index, which is less volatile than the confidence measure, also increased in the
Q2 survey and is consistent with further recovery in the global economy through the second half of 2021.
The two ‘fear’ indices – measured by concerns that customers and suppliers may go out of business – both declined in the Q2 survey. Fear that customers would go out of business is now close to its long-run average while fear that suppliers would do so edged slightly lower. These measures confirm that the extreme uncertainty created by the COVID-19 crisis has now fallen back towards more normal levels (Chart 2).
Executive summary
CHART 1: Global activity rebounding
CHART 2: The ‘fear indices’ approaching more normal levels
Source: ACCA/IMA (2012–21)
0
10
20
30
40
50
FEAR THAT CUSTOMERS WOULD GO OUT OF
BUSINESS IS NOW CLOSE TO ITS LONG-RUN
AVERAGE WHILE FEAR THAT SUPPLIERS
WOULD DO SO EDGED SLIGHTLY LOWER.
THE Q2 GLOBAL ECONOMIC CONDITIONS SURVEY (GECS) POINTS TO STRONG GLOBAL ECONOMIC GROWTH IN THE SECOND HALF OF THE YEAR.
Q2 2012
Source: OECD (2021). ACCA/IMA (2012–21)
GECS: index of concern about customers going out of business GECS: index of concern about suppliers going out of business
Index
GECS index: global orders World GDP (G20) growth y/y % (RHS)
2013 2014 2015 2017 2018 2019 20202016 2021
Index %
Q4 2013 Q2 2015 Q4 2016 Q2 2018 Q4 2019 Q2 2021
4

CHART 3: A varied regional picture on confidence
There is a wide regional variation in changes in confidence in the latest survey. Large increases in Europe (both Central and Eastern and Western) contrast with significant falls in Asia Pacific and South Asia. To a large extent these changes reflect the effect of progress with vaccines (Europe) and increased COVID-19 infections (Asia Pacific and South Asia). A theme of this report is the divergence in economic prospects between advanced and emerging market economies. Confidence fell back in North America, but this came after a very large jump in the Q1 survey (Chart 3).
For orders – the proxy for real economic activity – the biggest gain in Q2 came in North America, as the region powers ahead, assisted by a massive US fiscal stimulus. A jump in Western Europe points to economic recovery gathering momentum in the second half of the year. Asia Pacific also reported increased orders, boosted by export demand. Elsewhere there was little change in orders, apart from in South Asia, where renewed lockdown measures have affected the economic outlook in the near term (Chart 4).
CHART 4: Orders increase in all regions except one
Section 2 of this report assesses the implications of buoyant housing markets for the global economy’s prospects. Last year house prices in many countries increased, despite the worst global recession in decades. This arose from the unique nature of the recession, caused by health and not economic factors. Cuts in interest rates and government transfers supporting household disposable incomes served to support confidence and lift housing markets. Now that recovery is under way house price increases and, importantly, high levels of property transactions are giving a major boost to
Change in GECS confidence index between Q1 2021 and Q2 2021
THERE IS A WIDE REGIONAL VARIATION
IN CHANGES IN CONFIDENCE IN THE
LATEST SURVEY. LARGE INCREASES IN EUROPE
(BOTH CENTRAL AND EASTERN AND WESTERN)
CONTRAST WITH SIGNIFICANT FALLS
IN ASIA PACIFIC AND SOUTH ASIA.
Index points
-30
-20
-10
0
10
20
30
Change in GECS orders index between Q1 2021 and Q2 2021Index points
-5
0
5
10
15
20
North America
W Europe Asia Pacific
Global Africa Middle East
Central and E Europe
South Asia
Central and E Europe
W Europe Middle East
Global Africa North America
South Asia
Asia Pacific
5
GLOBAL ECONOMIC CONDITIONS SURVEY REPORT: Q2, 2021
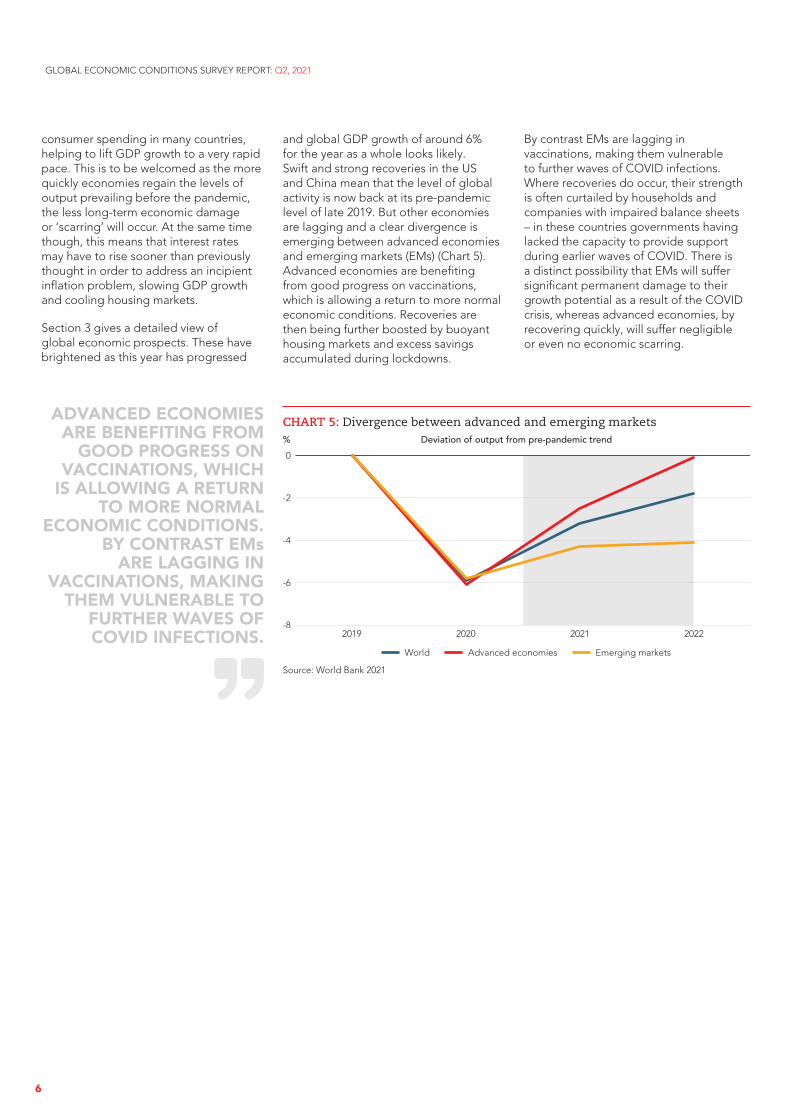
CHART 5: Divergence between advanced and emerging markets
consumer spending in many countries, helping to lift GDP growth to a very rapid pace. This is to be welcomed as the more quickly economies regain the levels of output prevailing before the pandemic, the less long-term economic damage or ‘scarring’ will occur. At the same time though, this means that interest rates may have to rise sooner than previously thought in order to address an incipient inflation problem, slowing GDP growth and cooling housing markets.
Section 3 gives a detailed view of global economic prospects. These have brightened as this year has progressed
and global GDP growth of around 6% for the year as a whole looks likely. Swift and strong recoveries in the US and China mean that the level of global activity is now back at its pre-pandemic level of late 2019. But other economies are lagging and a clear divergence is emerging between advanced economies and emerging markets (EMs) (Chart 5). Advanced economies are benefiting from good progress on vaccinations, which is allowing a return to more normal economic conditions. Recoveries are then being further boosted by buoyant housing markets and excess savings accumulated during lockdowns.
By contrast EMs are lagging in vaccinations, making them vulnerable to further waves of COVID infections. Where recoveries do occur, their strength is often curtailed by households and companies with impaired balance sheets – in these countries governments having lacked the capacity to provide support during earlier waves of COVID. There is a distinct possibility that EMs will suffer significant permanent damage to their growth potential as a result of the COVID crisis, whereas advanced economies, by recovering quickly, will suffer negligible or even no economic scarring.
Deviation of output from pre-pandemic trend
ADVANCED ECONOMIES ARE BENEFITING FROM
GOOD PROGRESS ON VACCINATIONS, WHICH
IS ALLOWING A RETURN TO MORE NORMAL
ECONOMIC CONDITIONS. BY CONTRAST EMs
ARE LAGGING IN VACCINATIONS, MAKING
THEM VULNERABLE TO FURTHER WAVES OF COVID INFECTIONS.
Source: World Bank 2021
-8
-6
-4
-2
0
2019
%
2020 2021 2022
World Advanced economies Emerging markets
6
GLOBAL ECONOMIC CONDITIONS SURVEY REPORT: Q2, 2021

1. Global and regional analysis
THIS GECS POINTS TO A GATHERING MOMENTUM IN THE GLOBAL ECONOMY THROUGH THE SECOND HALF OF THIS YEAR.
This GECS points to a gathering momentum in the global economy through the second half of this year. True, global confidence dipped slightly in Q2, but this came after the biggest jump in confidence in the 10-year history of the survey in Q1. Moreover, the key activity indicators all showed further improvement in the Q2 survey and are now in all cases above the level in 2019 Q4, the period immediately before the COVID-19 crisis began. The world economy overall has now recovered to its pre-pandemic size. This has been driven by rapid growth in the US and China, the two biggest economies; there are many economies that still have plenty of ground to make up (see Section 3).
In this survey, respondents were again asked when they expected substantial economic recovery in their region (Chart 7). Responses illustrate the divergence across the global economy with a majority of respondents in North America now saying that economic recovery is already underway. By contrast over half the respondents in Africa and South Asia do not expect recovery until 2022 at the earliest. Surprisingly, this was also the case in Asia Pacific. In Western Europe the proportion expecting a much-delayed economic recovery fell by 10 percentage points between the Q1 and Q2 survey, underlining the recent improvement in the economic outlook in the region.
CHART 6: Global indices continue to regain ground
-60
-50
-40
-30
-20
-10
0
10
20
30
Confidence index Orders index Capital expenditure index Employment index
Source: ACCA/IMA (2012–21)
GECS Global indicesIndex
THE WORLD ECONOMY OVERALL HAS NOW RECOVERED TO ITS
PRE-PANDEMIC SIZE. THIS HAS BEEN DRIVEN
BY RAPID GROWTH IN THE US AND CHINA,
THE TWO BIGGEST ECONOMIES; THERE ARE MANY ECONOMIES THAT
STILL HAVE PLENTY OF GROUND TO MAKE UP.
CHART 7: Expectations of economic recovery
0
10
20
30
40
50
60
n Middle East n Asia–Pacific n North American Africa n South Asia n Western Europe
Already established Q3 Q4 2022
When do you expect significant economic recovery in your economy? % responding for each time period
Q2 2012 Q4 2013 Q2 2015 Q4 2016 Q2 2018 Q4 2019 Q2 2021
%
7

CHART 8: Concern about operating costs
Source: ACCA/IMA (2012-21)
20
25
30
35
40
45
50
55
60
GECS: percentage concerned about rising costs
THE GECS INDEX OF CONCERN ABOUT
OPERATING COSTS INCREASED IN THE
LATEST SURVEY AND IS NOW AT ITS HIGHEST
LEVEL SINCE 2019 Q3.
%
The GECS index of concern about operating costs increased in the latest survey and is now at its highest level since 2019 Q3. (Chart 8). The surge in commodity prices and transport costs is feeding into higher input costs, especially for manufacturers. It remains unlikely that rising costs will feed into a sustained increase in consumer price inflation, but long-term inflation expectations have risen recently, notably in the US.
In the Q2 survey respondents were again asked about inflation expectations over the next five years (Chart 9). In all regions at least two-thirds of respondents expect inflation to be slightly or much higher than now. Since the Q1 survey there has been a marked increase in inflation expectations in North America, while in Western Europe expectations have firmed around a modest increase in inflation over the next five years.
This is the consensus across all regions, where respondents expect inflation will rise by up to three percentage points over the coming years.
CHART 9: Inflation expectations
0
10
20
30
40
50
60
70
n Middle East n Asia–Pacific n North American Africa n South Asia n Western Europe
Slightly / much lower About the same Slightly higher (+1 to 3 percentage points)
Much higher (+>3 percentage points)
What is your expectation for inflation compared with now over the next five years? % responding for each category%
Q2 2012 Q4 2013 Q2 2015 Q4 2016 Q2 2018 Q4 2019 Q2 2021
8
GLOBAL ECONOMIC CONDITIONS SURVEY REPORT: Q2, 2021

Regional pictureNORTH AMERICAIn the latest survey confidence fell back slightly after an extremely strong bounce in the Q1 survey. Nonetheless confidence remains very high. The orders and employment indices both increased further and reached their highest level on record. Continued progress with vaccinations, allowing economic conditions to return to normal, and the huge US fiscal stimulus are driving recovery in the region. The North America GECS indices are consistent with a very strong recovery through the second half of 2021.
ASIA-PACIFIC The regional survey in Q2 shows the unusual juxtaposition of a significant drop in confidence with a healthy increase in orders. Indeed, the orders index is now at its highest level in over three years. Exports are rising at a healthy clip, in line with a strong global recovery and the total orders index almost certainly reflects this. The fall in confidence may be attributable to rising COVID infections in some countries, raising fears of restrictions that would hurt domestic activity and tourism. But the activity indicators in the GECS suggest that overall economic growth will continue at a healthy pace in the second half of 2021.
WESTERN EUROPEWestern Europe recorded very strong responses in the Q2 survey, having lagged somewhat compared with other regions in Q1. Confidence jumped by the most in the history of the survey and orders, employment and capital spending balances all increased significantly. To a large extent, the improved outlook is due to a catch up in the EU vaccination rollout, which began slowly at the start of the year. The recent lifting of social distancing restrictions, notably in Germany and France, as well as rising export demand is set to fuel robust economic growth in the second half of the year.
CHART 10: North America
-60
-40
-20
0
20
40
60
Confidence index Orders index Capital expenditure index Employment index
Source: ACCA/IMA (2012-20)
CHART 11: Asia-Pacific
-70
-60
-50
-40
-30
-20
-10
0
10
20
30
Confidence index Orders index Capital expenditure index Employment index
Source: ACCA/IMA (2012-20)
CHART 12: Western Europe
-60
-40
-20
0
20
40
60
Confidence index Orders index Capital expenditure index Employment index
Source: ACCA/IMA (2012-20)
Index
Index
Index
Q2 2012 Q4 2013 Q2 2015 Q4 2016 Q2 2018 Q4 2019 Q2 2021
Q2 2012 Q4 2013 Q2 2015 Q4 2016 Q2 2018 Q4 2019 Q2 2021
Q2 2012 Q4 2013 Q2 2015 Q4 2016 Q2 2018 Q4 2019 Q2 2021
9
GLOBAL ECONOMIC CONDITIONS SURVEY REPORT: Q2, 2021

MIDDLE EAST Confidence in the Middle East region increased modestly in Q2 as oil prices continued to recover, exceeding $70 per barrel for the first time since the start of the pandemic. Activity indicators, such as orders, also improved modestly. Some countries in the region, Israel, UAE and Bahrain especially, are well advanced in vaccination plans. Improved oil revenues and a relaxation of social restrictions suggest that economic recovery will continue in coming months.
SOUTH ASIAConfidence fell back in South Asia in Q2, partially reversing the big jump in the previous survey. Moreover, the region is the only one in this survey to record a fall in orders, albeit a modest one. An exceptionally large surge in COVID infections in India, the largest economy in the region, is probably behind this weakness. In addition, there is a slow rate of vaccination throughout South Asia. It is likely that across the region the legacy of the COVID crisis will be a descent into extreme poverty for tens of millions of people.
AFRICAConfidence edged slightly lower in the Q2 survey, but remains at a high level. Orders recovered but only slightly and Africa has not witnessed the rebound in activity indicators seen elsewhere. A third wave of COVID infections is now underway while there has been negligible progress on vaccinations. Health and fiscal resources are in many cases more stretched than in previous COVID waves. There will be no strong recovery in many African countries. Only commodity exporters may see economic recovery, as prices and demand rebound.
CHART 13: Middle East
-80
-60
-40
-20
0
20
40
CHART 14: South Asia
-80
-60
-40
-20
0
20
40
CHART 15: Africa
-80
-60
-40
-20
0
20
40
Confidence index Orders index Capital expenditure index Employment index
Source: ACCA/IMA (2012-20)
Confidence index Orders index Capital expenditure index Employment index
Source: ACCA/IMA (2012-20)
Confidence index Orders index Capital expenditure index Employment index
Source: ACCA/IMA (2012-20)
Index
Index
Index
Q2 2012 Q4 2013 Q2 2015 Q4 2016 Q2 2018 Q4 2019 Q2 2021
Q2 2012 Q4 2013 Q2 2015 Q4 2016 Q2 2018 Q4 2019 Q2 2021
Q2 2012 Q4 2013 Q2 2015 Q4 2016 Q2 2018 Q4 2019 Q2 2021
10
GLOBAL ECONOMIC CONDITIONS SURVEY REPORT: Q2, 2021

Nominal house prices Percentage change on a year earlier
2. Thematic analysis
Buoyant housing markets fuel recovery – and inflation? Last year the global economy suffered its biggest recession in decades. At the same time house prices increased in many countries – and so far, this year have continued to do so. In the UK and US, house prices are rising at double-digit annual rates, the fastest in around 15 years. But they are also on a strong upward trend in many other countries, including New Zealand, Canada and South Korea.
Buoyant housing markets during economic downturns are very unusual. Traditional recessions invariably involve retrenchment by households as unemployment rises, interest rates are increased and consumer confidence falls: the result is falling or at best stagnant house prices and much reduced housing market activity. But the 2020 recession was not a traditional one as it was driven by a health emergency rather than by economic fundamentals.
There are two main reasons why house prices increased during the severe 2020 recession. First, mortgage interest rates were cut as part of the monetary policy response to the onset of the COVID-19 pandemic – at a time when the global banking system had strong capital overall and was able to support borrowing. Second, household disposable incomes
were supported by government transfers on a massive scale. In many countries, generous wage subsidies and direct payments to households supported incomes and prevented a significant rise in unemployment rates, despite collapsing output. Lower interest rates and supported incomes underpinned consumer confidence and stimulated housing markets.
Housing markets may now also be boosted by the excess savings that many households accumulated during lockdowns when spending was restricted but incomes held up. For example, savings rates in the US and UK reached around 30% of disposable incomes last year, compared with a pre-pandemic average of just under 8%. These savings are worth several percent of annual disposable incomes and it is likely that some fraction will be deployed in housing markets.
Buoyant housing markets look set to persist for the rest of this year and into 2022. Consensus forecasts for house price increases this year are around 11% in the US, 6% in the UK and 4% to 5% in the euro-zone. (In the UK, price gains may well moderate through the second half as the stamp duty holiday is removed.) But should we be concerned about rising house prices, are they in danger of becoming a bubble and do they add to the risks of higher inflation in the medium term?
BUOYANT HOUSING MARKETS LOOK SET TO PERSIST FOR THE
REST OF THIS YEAR AND INTO 2022. CONSENSUS FORECASTS FOR HOUSE
PRICE INCREASES THIS YEAR ARE AROUND 11%
IN THE US, 6% IN THE UK AND 4% TO 5% IN
THE EURO-ZONE.
LAST YEAR THE GLOBAL ECONOMY SUFFERED ITS BIGGEST RECESSION IN DECADES. AT THE SAME TIME HOUSE PRICES INCREASED IN MANY COUNTRIES – AND SO FAR, THIS YEAR HAVE CONTINUED TO DO SO.
CHART 16: Nominal house prices rise in the 2020 recession
Source: FRED
-20
-10
0
10
20
Q1 2006
%
Q1 2009 Q1 2012 Q1 2015
US Euro-zone Canada UK
Q1 2018 Q1 2021
11

It is now debatable whether inflation may trend higher in a post-pandemic world where governments have very high levels of debt, the real value of which would be eroded by a little more inflation. A more pressing issue is whether booming housing markets help fuel higher inflation, resulting in increased interest rates that result not only in slower economic growth, but also bring an abrupt end to rising house prices.
Housing markets, economic activity and inflation House prices and housing market activity are often major channels through which monetary policy affects the economy. Rising house prices add to the perceived wealth of homeowners and through this effect stimulate spending on goods and services generally. A far more important influence arises as a consequence of elevated levels of housing market activity. In particular, increased housing transactions result in more spending on consumer durables, such as white goods, furniture, etc. lifting consumer
spending. This housing market effect is a major influence in the strength of the rebound in economic activity now seen in many advanced economies. This is to be welcomed because the quicker pre-pandemic levels of output are regained, the less the long-term damage to the economy in the form of economic scarring is likely to be. But beyond this point continued rapid expansion in consumer spending would ultimately put upward pressure on inflation and trigger higher interest rates. A strong housing market both through and after a severe recession is one reason to expect higher interest rates sooner rather than later.
Finally, there is a technical point about house prices and measures of inflation that is particularly relevant today. They do not usually feed directly into most measures of consumer price inflation. But measures of inflation do include rent (and often an estimate of the value of housing services provided by home ownership). Both of these are (usually) highly positively correlated with house price inflation.
Unsustainable? Rapidly rising house prices raise the question of whether these prices are becoming in some measure unsustainable, resulting in a bubble that will inevitably burst with harmful economic consequences. Valuation metrics such as house price to income ratios point to stretched valuations in the UK, but less so in the US (Chart 17). There is a strong case that house prices can be sustained at a higher ratio to incomes. This is because interest rates have declined in recent years and are now at or close to record lows, The argument runs that the consequent boost to affordability justifies higher house prices in relation to income.
A major reason for the long-term decline in interest rates has been a permanent fall in inflation and inflation expectations across many economies. To a large extent this has been due to independent central banks pursuit of inflation targets. Anchoring inflation expectations to target rates has allowed interest rates to fall to an apparently permanently lower level.
VALUATION METRICS SUCH AS HOUSE PRICE
TO INCOME RATIOS POINT TO STRETCHED
VALUATIONS IN THE UK, BUT LESS SO IN THE US.
CHART 17: House price to income ratios are risingHouse price to income ratio
Source: Office for National Statistics (ONS), FRED
3
4
5
6
7
8
9
1997
UK US
1999 2001 2003 2005 2007 2009 2011 2013 2015 2017 2019 2021
12
GLOBAL ECONOMIC CONDITIONS SURVEY REPORT: Q2, 2021

to be renters than home owners, reducing demand and rents. As the US economy recovers and unemployment falls, a recovery in demand for rental properties and rental growth is likely. Higher US interest rates would clearly have much wider implications elsewhere in the global economy, especially indebted emerging markets.
ConclusionIt is very unusual to find rising global house prices during and immediately after a severe recession. But in the context of the 2020 COVID-19 recession,
this development is readily explained and it is to be welcomed. As advanced economies recover buoyant housing markets will help return activity to pre-pandemic levels by stimulating household consumption, especially on consumer durables. This will help limit or even eliminate long-term economic damage, so-called ‘scarring. But rapidly rising house prices cannot persist indefinitely. Strong economic growth boosted by housing markets will ultimately require higher interest rates to prevent overheating and significantly higher inflation. This will cool housing markets too.
But in the US there has recently been a divergence between house prices and rents with rental growth slowing at the same time as house prices accelerated (Chart 18). If rental growth were to pick up to reflect higher house prices this would push inflation up by around 0.5 percentage points at a time when inflation has already spiked because of higher food and fuel prices. (Rents have a weighting of over 30% in the US CPI basket.)
Rental growth is likely to have been negatively affected by the pandemic as those losing their jobs were more likely
IF RENTAL GROWTH WERE TO PICK UP TO REFLECT
HIGHER HOUSE PRICES, IT COULD ADD AROUND 0.5 PERCENTAGE POINTS TO ANNUAL US CONSUMER
PRICE INFLATION.
CHART 18: US house prices and residential rents divergeUS house prices and residential rents
12-month percentage change
-20
-15
-10
-5
0
5
10
15
20
-2
-1
0
1
2
3
4
5
6
Source: FRED
Case-Schiller US house price index Residential rents in US CPI (RHS)
May 1991
% %
May 1993
May 1995
May 1997
May 1999
May 2001
May 2003
May 2005
May 2007
May 2009
May 2011
May 2013
May 2015
May 2017
May 2019
May 2021
13
GLOBAL ECONOMIC CONDITIONS SURVEY REPORT: Q2, 2021

3. The global economic outlook
The global economy – a strong but uneven recovery The global economy continues to gather momentum and the second half of the year is likely to see strong GDP growth. For 2021 as a whole global GDP growth is likely to approach 6%, an exceptionally strong rebound after the 3.5% fall last year. But this growth will be concentrated in advanced economies where levels of vaccination are now such that, in many countries, social distancing restrictions can be relaxed and economic conditions return to normal. But in many emerging markets vaccinations have made little progress, leaving them vulnerable to renewed waves of COVID-19 and variants with consequent restrictions that curtail economic recovery. This pattern seems likely to persist well into 2022 (Chart 19). In addition to rapid deployment of effective vaccines, advanced economies have been able to deploy massive fiscal support measures that have maintained household disposable incomes, supported businesses, and prevented large rises in unemployment. As argued above, buoyant housing markets have supported consumer spending. This means that as economic conditions move towards normalisation, economies are likely to recover very rapidly.
But health and economic risks are considerable. For as long as COVID-19 remains widespread in parts of the world, there is a chance that a vaccine resistant variant will emerge and spread, forcing renewed lockdown measures with consequent economic harm. There are also policy challenges: it is important that fiscal support is not withdrawn prematurely, potentially causing a setback to recovery in private demand. In addition, there are concerns among some economists that the current spike in inflation will prove more long-lasting than is currently assumed by most central banks, including the US Federal Reserve. The global economic outlook would darken considerably if US interest rates had to be increased significantly in coming months to deal with an incipient inflation problem.
USThe US economy is likely to grow by around 7% this year as COVID cases decline and the vaccination roll-out continues apace. Already second quarter GDP growth is likely to be close to the 7% annual rate, helped by a strong rebound in consumer spending. This would imply that the level of activity had returned to its pre-pandemic level seen at the end of
THE GLOBAL ECONOMY CONTINUES TO GATHER MOMENTUM AND THE SECOND HALF OF THE YEAR IS LIKELY TO SEE STRONG GDP GROWTH.
IN MANY EMERGING MARKETS VACCINATIONS
HAVE MADE LITTLE PROGRESS, LEAVING
THEM VULNERABLE TO RENEWED WAVES OF
COVID-19 AND VARIANTS WITH CONSEQUENT RESTRICTIONS THAT CURTAIL ECONOMIC
RECOVERY.
CHART 19: Advanced economies recover faster than emerging marketsDeviation of output from pre-pandemic trend
Source: World Bank 2021
-8
-6
-4
-2
0
2019
%
2020 2021 2022
World Advanced economies Emerging markets
14

from exports. These projections imply that the level of output will return to its pre-pandemic level around the middle of next year.
UKThe OECD now forecasts UK GDP growth this year at 7.2%, faster even than the US. The UK suffered a near 10% fall in output last year so it has more ground than some other countries to make up. The economy is benefitting from an early and successful vaccination roll out that allowed the gradual lifting of containment measures over the course of the second quarter. Already in April monthly GDP increased by 2.6%, boosted by the re-opening of non-essential retail. The delay to July of the final lifting of social distancing restrictions is not likely to prevent a very strong second half of the year as economic conditions return to normal. A buoyant housing market and spending of accumulated savings will help to turbo charge the economy. Output is likely to have returned to its pre-pandemic level by the turn of the year.
ChinaThe Chinese economy is likely to grow by around 8% this year, following a 2.3% expansion in 2020. Booming exports and a major boost to infrastructure spending are the key drivers of growth. Official Chinese data show exports in dollar terms 26% up in the 12 months to May and
fixed investment is 15% higher. For now, consumer spending growth is relatively modest, reflecting low vaccination coverage. Retail sales are up 12.4% in the 12 months to May but this is flattered by very weak sales a year ago; over the three months to May this year sales are up just under 2%. After strong growth this year China is likely to slow to its pre-pandemic growth rate of 5% to 6% a year. Already monetary and fiscal policy are becoming less supportive and moving towards a neutral stance.
Emerging marketsAs Chart 19 illustrates there is a widening gap in economic performance between advanced economies and EMs. Having suffered last year with lockdowns and a lack of fiscal capacity to support incomes, EMs are now lagging in the deployment of vaccines. This leaves them vulnerable to rising COVID infections and renewed restrictions. Chart 20 illustrates the difference in numbers of COVID cases and vaccinations in advanced and emerging economies as of May this year. The supply of vaccines to EMs should increase significantly in the coming months following commitments made by some advanced economies, notably the US. Even if sufficient vaccines are available, however, many countries will face logistical difficulties and/or vaccine hesitancy as obstacles to reaching so-called herd immunity.
2019. Growth may even strengthen during the second half as employment continues to recover. A return to more normal economic conditions is being boosted by a massive fiscal stimulus which by itself may add over three percentage points to GDP this year. In addition, despite a recent spike in inflation, the Federal Reserve is set to keep monetary policy very accommodative with interest rates close to zero.
EurozoneThe eurozone economy contracted by 0.6% in the first quarter. Another wave of COVID infections early in the year triggered renewed restrictions and lockdown measures. In addition, confidence was undermined by a slow start to the vaccination roll out. But over the last few months restrictions in many countries have been eased and vaccinations have gathered pace. While domestic demand remains below its pre-pandemic level, manufacturing and exports have recovered strongly, benefitting from the rebound in international trade. Economic growth in the second half of the year is likely to gain momentum as consumer spending picks up. Fiscal policy will be supportive as distribution of the €750bn EU Next Generation Fund begins, with Italy and Spain being major beneficiaries. For the year as a whole GDP growth is set to be around 4.5% with a significant contribution
CHART 20: Distribution of COVID cases and vaccinate doses in advanced economies and EMs
Source: World Bank 2021
Distribution of COVID cases and vaccinate doses (May 2021)% of population
0
2.5
5
Estimated COVID-19 cases Vaccine doses (RHS)
% of population
n Emerging Markets n Advanced economies
THE SUPPLY OF VACCINES TO EMs
SHOULD INCREASE SIGNIFICANTLY
IN THE COMING MONTHS FOLLOWING COMMITMENTS MADE BY SOME ADVANCED
ECONOMIES, NOTABLY THE US.
0
10
20
15
GLOBAL ECONOMIC CONDITIONS SURVEY REPORT: Q2, 2021

investment. For those with high levels of debt denominated in foreign currency, a rise in US interest rates is a significant downside risk. Chart 21 shows World Bank estimates of the economic loss across EM regions up to 2022.
The risk for EMs is that the loss of output relative to their pre-pandemic trend becomes ‘locked-in’ because long-term growth potential is reduced, curtailing their ability to catch up with income levels in developed economies. Jobs markets are crucial because persistently high levels of unemployment caused by weak growth will reduce productivity as the unemployed lose workforce skills. The COVID crisis has exacerbated this problem as school closures will have damaged future workforce productivity by significantly reducing hours of schooling. Already the World Bank (2021) estimates that over 100 million people have been pushed back into extreme poverty as a result of the COVID-19 crisis.
Higher Inflation – spike or upward trend? The inflation question has become more acute in recent months, notably as a result of a rise in US inflation to a 13-year high of 5% in May. In the UK inflation has risen to 2.1% in May, up from just 0.7% earlier in the year. The issue is whether rising inflation is a temporary blip caused by supply shortages as a result of the COVID-19 crisis or a more permanent rise in inflationary pressures caused by the massive monetary and fiscal stimulus unleashed in response to the pandemic.
To a large extent, the rise in inflation will be temporary in our view, the result of collapsing demand last year, followed by a strong rebound that has resulted in rapid increases in commodity prices and supply shortages in some sectors. Volatility in oil prices has been especially high over the last year and this has had a material effect on consumer price inflation in many economies. But other commodity prices
Overall EM growth this year is likely to be around 7%, a rebound after a contraction last year (World Bank 2021) But this figure is boosted by the inclusion of China. With the exception of China, virtually all EMs are likely to remain below pre-pandemic growth projections for the foreseeable future. There are large regional differences in EM economic performance. For example, commodity exporters are benefitting from the surge in prices that has coincided with the global revival in demand. In addition, EMs with close trading links to the US or China will receive a boost from fast growth in those two economies this year. By contrast those EMs that are dependent on overseas visitors are set to face considerable headwinds for some time as travel restrictions are likely to be among the last COVID measures to be lifted. Meanwhile some EMs also have excessive levels of external debt that may limit the scope for future fiscal support and discourage foreign
CHART 21: COVID effect differs across EM regions
Source: World Bank 2021
Percentage loss of GDP compared with pre-pandemic projections by 2022%
-10
-8
-6
-4
-2
0
East Asia Pacific Europe and Central Asia
Latin America and Caribbean
Middle East and North Africa
Sub-Saharan Africa
South Asia
WITH THE EXCEPTION OF CHINA, VIRTUALLY
ALL EMs ARE LIKELY TO REMAIN BELOW PRE-PANDEMIC GROWTH
PROJECTIONS FOR THE FORESEEABLE FUTURE.
16
GLOBAL ECONOMIC CONDITIONS SURVEY REPORT: Q2, 2021

VOLATILITY IN OIL PRICES HAS BEEN ESPECIALLY HIGH OVER THE LAST YEAR AND THIS HAS
HAD A MATERIAL EFFECT ON CONSUMER PRICE
INFLATION IN MANY ECONOMIES.
TABLE 1: OECD GDP forecasts June 2021
a = actual, f = forecast
Source: OECD 2021
% CHANGE ON A YEAR EARLIER* 2019a 2020a 2021f 2022f
World 2.7 -3.5 5.8 4.4
United States 2.2 -3.5 6.9 3.6
Euro-zone 1.3 -6.8 4.3 4.4
Germany 0.6 -5.3 3.3 4.4
France 1.5 -8.2 5.8 4.0
Italy 0.3 -8.9 4.1 4.0
Spain 2.0 -10.8 5.9 6.3
United Kingdom 1.3 -9.8 7.2 5.5
Canada 1.7 -5.4 4.7 4.0
Japan 0.7 -4.8 2.6 2.0
China 6.1 2.3 8.5 5.8
India 4.8 -7.4 9.9 8.2
The rise in inflation can therefore be seen mainly as a welcome reflection of a strong recovery in demand that has resulted in supply shortages and a rebound in commodity prices, both of which are likely to prove temporary. For now at least, underlying inflationary pressures are generally subdued. Transition from this to a sustained rise in inflationary pressures would require continued strong demand and tight jobs markets, resulting in a classic wage-price spiral. Unemployment rates have risen by much less than expected, given the scale of the 2020 recession. Nevertheless, employment
levels remain below pre-pandemic levels everywhere suggesting that there is still considerable slack in jobs markets. For as long as this remains the case the risks of sustained higher inflation are low. But continued strong demand – boosted by buoyant housing markets (see Section 2) look likely to bring forward the time when monetary stimulus is withdrawn. The US Federal Reserve has recently revised its guidance on when interest rates will rise bringing it forward to 2023, from 2024 previously. There is a distinct possibility that this date will be revised again, to 2022.
such as those of food and industrial metals have also been pushed higher in recent months (Chart 22). Of course, unless commodity prices continue to rise the effect on inflation will be temporary.
There are other one-off effects feeding into consumer prices, including shipping costs and a global shortage of semiconductors. The latter has resulted in reduced car production, which in turn has contributed to a surge in second hand car prices. (Used car prices accounted for a third of the rise in US inflation in May.)
CHART 22: Global commodity prices rebound
70
80
90
100
110
120
130
140
150
160
170
0
10
20
30
40
50
60
70
80
90
100
Source: OECD 2021 Food Metals & minerals Brent oil (RHS)
Jan 2018 Jan 2019 Jan 2020 Jan 2021
Index 2019 =100 $ per barrel
17
GLOBAL ECONOMIC CONDITIONS SURVEY REPORT: Q2, 2021
References
ACCA/IMA (2012-21) The Global Economic Conditions Survey (GECS) reports downloadable from, <https://www.accaglobal.com/gb/en/professional-insights/global-economics.html>.
OECD (2021) Economic Outlook June 2021, No Ordinary Recovery: Navigating the Transition, <https://www.oecd-ilibrary.org/sites/edfbca02-en/index.html?itemId=/content/publication/edfbca02-en&_ga=2.10944246.337091154.1624862311-1201906039.1585045926>.
World Bank (2021) Global Economic Prospects: A Strong but Uneven Recovery, <https://www.worldbank.org/en/publication/global-economic-prospects>.
FRED Federal Reserve Bank of St Louis Economic Databank (website) <https://fred.stlouisfed.org/>.
ONS House price to residence-based earnings ratio, <https://www.ons.gov.uk/peoplepopulationandcommunity/housing/datasets/ratioofhousepricetoresidencebasedearningslowerquartileandmedian>.
18

NORTH AMERICA
MIDDLE EAST
ASIA PACIFIC
CENTRAL & EASTERN
EUROPE
SOUTH ASIA WESTERN EUROPE
AFRICA CARIBBEAN CENTRAL & SOUTH AMERICA
Canada Bahrain Australia Bulgaria Afghanistan Cyprus Cameroon Barbados Belize
Mexico EgyptMainland
ChinaCzech
RepublicBangladesh Finland Ethiopia Bermuda Brazil
USA IraqHong Kong
SARHungary India Germany Ghana Grenada Columbia
Israel Indonesia Moldova Kazakhstan Greece Ivory Coast Guyana Costa Rica
Jordan Japan Poland MaldivesIreland,
Republic ofKenya Jamaica
KuwaitKorea,
Republic ofRomania Nepal Italy Liberia Puerto Rico
Lebanon Malaysia Russia Pakistan Luxembourg Malawi St Vincent
OmanNew
ZealandSlovakia Malta Mauritius
Trinidad & Tobago
Palestine Philippines Ukraine Netherlands Namibia
Qatar Singapore Spain Nigeria
Saudi Arabia Vietnam Switzerland Sierra Leone
United Arab Emirates
Turkey South Africa
UK Sudan
Tanzania
Uganda
Zambia
Zimbabwe
Appendix I:Economies covered by Q2 survey responses
19

GECS-Q2-2021
ACCA The Adelphi 1/11 John Adam Street London WC2N 6AU United Kingdom / +44 (0)20 7059 5000 / www.accaglobal.com
IMA 10 Paragon Drive Suite 1 Montvale NJ 07645-1760 USA / +1 (201) 573-9000 / www.imanet.org
ACCA, IMA and the global economy
Global economic conditions continue to dominate business and political life. News and debates on economic issues are almost constantly the focus of media attention. While most national economies are now growing once again, it is far from clear how sustainable this growth is or how long it will be before a sense of normalcy returns to the global economy.
ACCA and IMA have been prominent voices on what the accounting profession can do to help turn the global economy around. Both bodies have published extensively on a range of topics, from the regulation of financial markets or the prevention of fraud and money laundering, to fair value or the role of international accounting standards, to talent management and the development of an ethical business culture.
ACCA and IMA aim to demonstrate how an effective global accountancy profession contributes to sustainable global economic development; to champion the role of accountants as agents of value in business; and to support their members in challenging times. Both professional bodies believe that accountants add considerable value to business, and never more so than in the current environment.
Accountants are particularly instrumental in supporting the small business sector. Small and medium-sized enterprises (SMEs) account for more than half of the world’s private sector output and about two-thirds of all employment.
Both ACCA and IMA focus much of their research and advocacy efforts on articulating the benefits to SMEs of solid financial management and reliable financial information.
WHERE NEXT?As countries around the world continue to consider strategies to promote stability and stimulate growth, the interconnectedness of national economies, and how they are managed and regulated, is now under close scrutiny. The development of the global accountancy profession has benefited from, and in turn contributed greatly to, the development of the interconnected global economy. The fortunes of the two are tied. ACCA and IMA will, therefore, continue to consider the challenges ahead for the global economy, and focus on equipping professional accountants for the uncertain future.
CONTACTSFor further information about the Global Economic Conditions Survey and the series of quarterly reports, please contact:
Michael Taylor Chief Economist, ACCA +44 (0) 7892 704901 [email protected]
Dr Raef LawsonVice President of Research and PolicyInstitute of Management Accountants+ 1 (0) 201 474 [email protected]
To find out more visit:www.accaglobal.com www.imanet.org