Embed Size (px)
Citation preview
www.nsr.com © 2013 – NSR
July 2013
Global Direct-to-Home Markets
6th
Edition
Report Brief
www.nsr.com © 2013– NSR 1
Report Description NSR’s Direct-to-Home (DTH) Markets, 6th Edition provides an industry-leading
assessment of key trends, drivers, and restraints facing the Direct-to-Home (DTH)
satellite TV market. The study focuses in on the DTH and Pay-TV satellite TV market,
emphasizing country-level research being incorporated into regional-level analyses. This
study addresses some of the most pressing questions in the DTH industry today,
including:
How many DTH & Satellite Pay TV subscribers will there be per
region from 2012-2022? How much in subscription revenues will they
bring to DTH and satellite Pay-TV providers?
In which regions do Digital Terrestrial Technology (DTT) and Over-
the-top (OTT) services present the greatest threat to DTH, and in
which regions are they a lesser factor?
Can DTH providers in emerging markets successfully transition from
a focus on subscriber acquisition to increasing existing subscriber
ARPUs? What factors continue to drive subscriber growth for the
leading platforms in key countries?
Which key countries have the greatest opportunities for DTH growth,
and which countries are signaling higher barriers to entry?
In the face of economic, political, and terrestrial threats to satellite TV
services, which DTH markets still present niche opportunities for
market growth?
How big of a role will future technologies like UltraHD play, and in
which regions will it be a factor? What is the outlook for SD, HD, or
3D channels?
Direct-to-Home (DTH) Markets, 6th Edition provides in-depth
assessment and forecasting using both primary and
secondary research, and includes figures for:
TV Households & DTH Subscriber figures from 2012 - 2022
SAC, ARPU, and Subscription Revenues for DTH and satellite
Pay-TV Platforms through 2022
SD, HD, 3D, and Ultra HD Channels & Transponder Demand
Trends & Forecasts to 2022
www.nsr.com © 2013– NSR 2
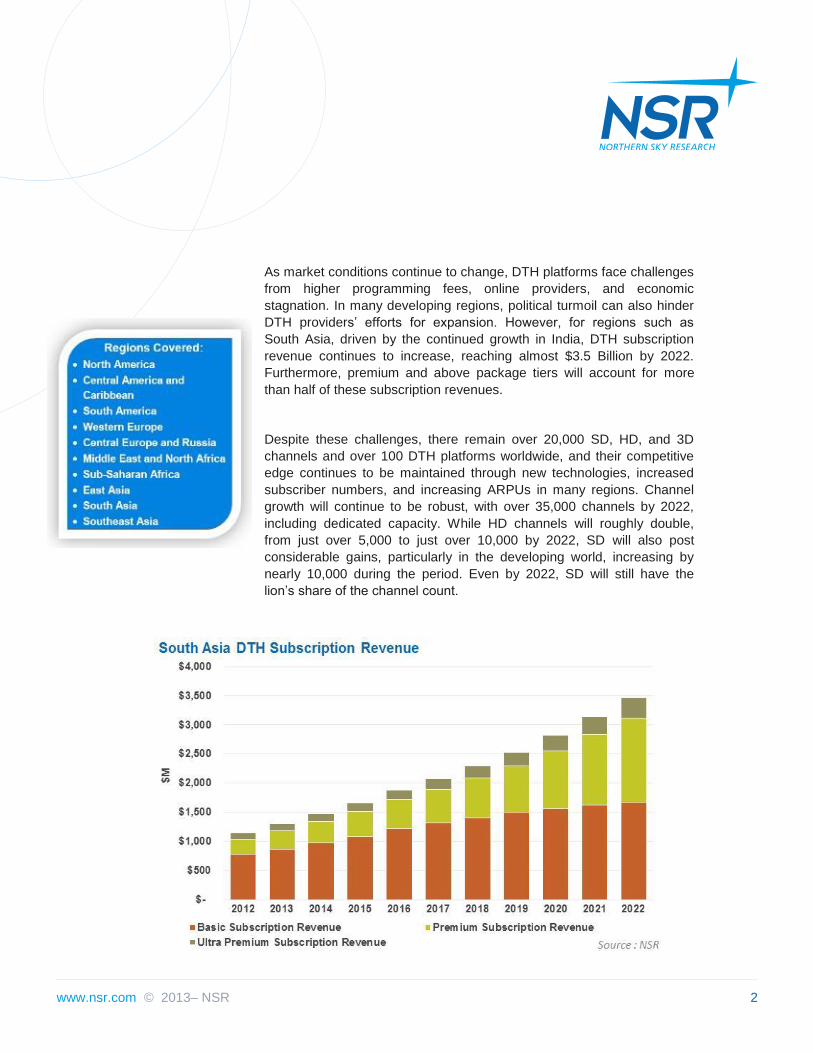
As market conditions continue to change, DTH platforms face challenges
from higher programming fees, online providers, and economic
stagnation. In many developing regions, political turmoil can also hinder
DTH providers’ efforts for expansion. However, for regions such as
South Asia, driven by the continued growth in India, DTH subscription
revenue continues to increase, reaching almost $3.5 Billion by 2022.
Furthermore, premium and above package tiers will account for more
than half of these subscription revenues.
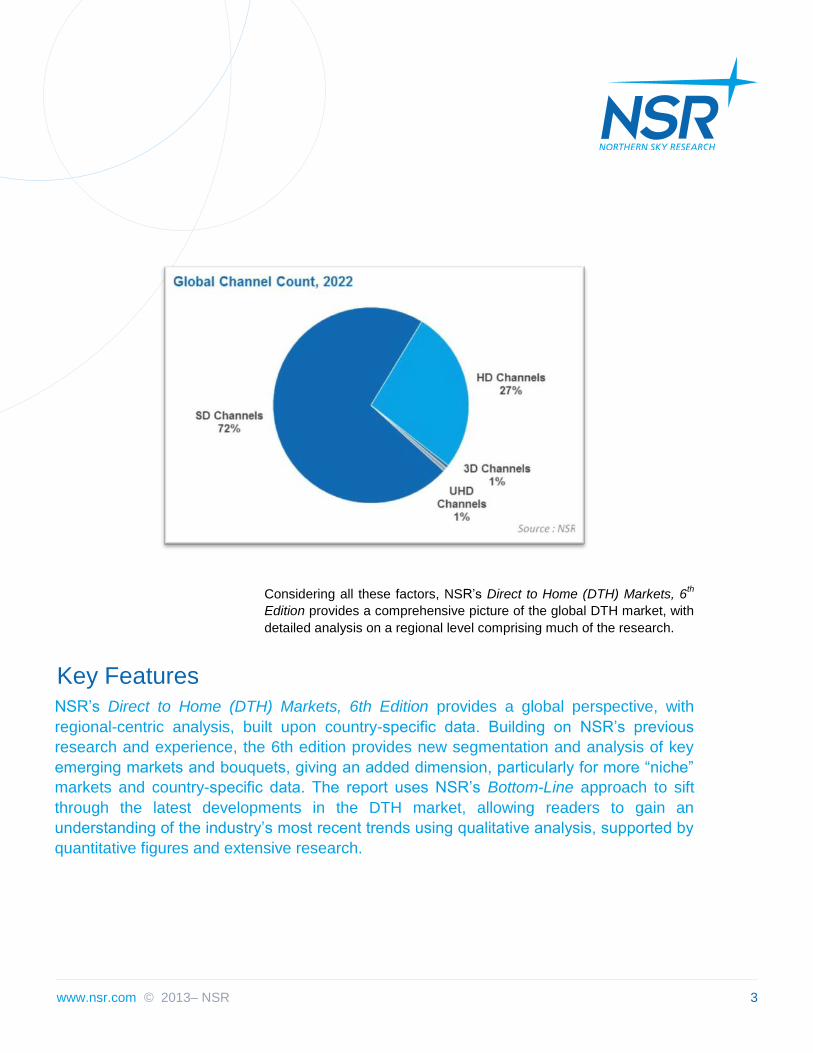
Despite these challenges, there remain over 20,000 SD, HD, and 3D
channels and over 100 DTH platforms worldwide, and their competitive
edge continues to be maintained through new technologies, increased
subscriber numbers, and increasing ARPUs in many regions. Channel
growth will continue to be robust, with over 35,000 channels by 2022,
including dedicated capacity. While HD channels will roughly double,
from just over 5,000 to just over 10,000 by 2022, SD will also post
considerable gains, particularly in the developing world, increasing by
nearly 10,000 during the period. Even by 2022, SD will still have the
lion’s share of the channel count.
www.nsr.com © 2013– NSR 3
Considering all these factors, NSR’s Direct to Home (DTH) Markets, 6th
Edition provides a comprehensive picture of the global DTH market, with
detailed analysis on a regional level comprising much of the research.
Key Features NSR’s Direct to Home (DTH) Markets, 6th Edition provides a global perspective, with
regional-centric analysis, built upon country-specific data. Building on NSR’s previous
research and experience, the 6th edition provides new segmentation and analysis of key
emerging markets and bouquets, giving an added dimension, particularly for more “niche”
markets and country-specific data. The report uses NSR’s Bottom-Line approach to sift
through the latest developments in the DTH market, allowing readers to gain an
understanding of the industry’s most recent trends using qualitative analysis, supported by
quantitative figures and extensive research.
www.nsr.com © 2013– NSR 4
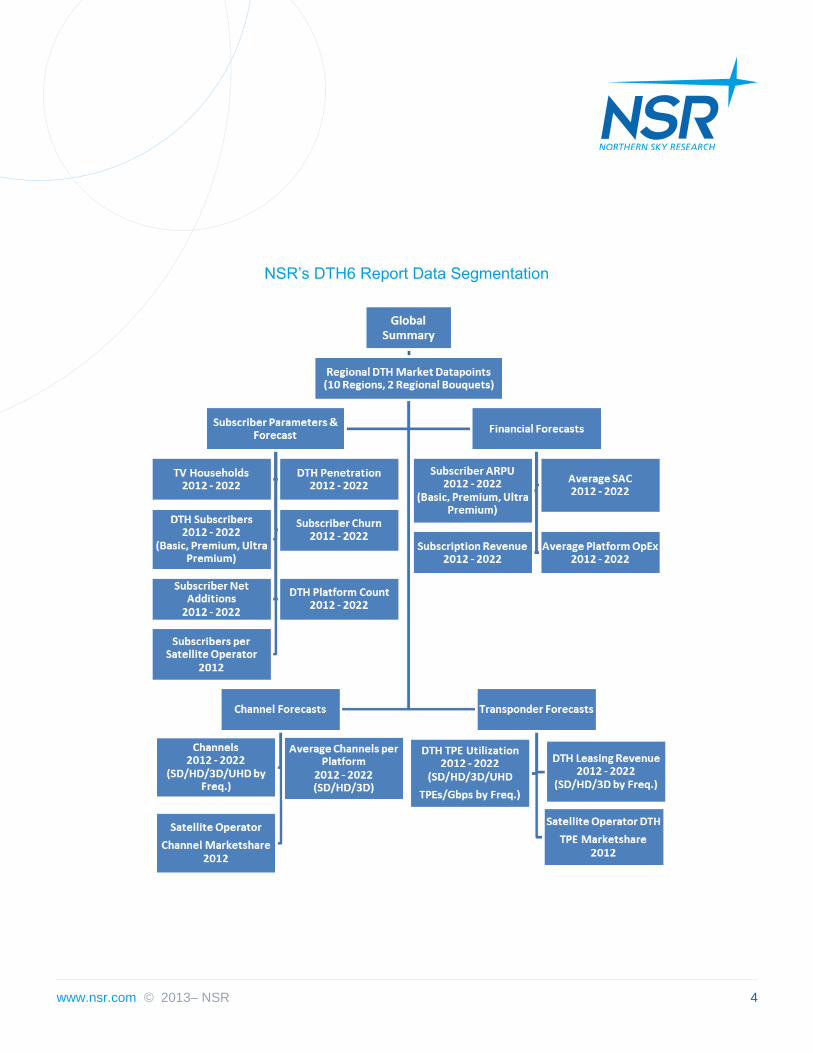
NSR’s DTH6 Report Data Segmentation

www.nsr.com © 2013– NSR 5
Who Should Purchase this Report?
National, Regional, and Global Satellite Operators
Direct-to-Home Service Providers
Direct-to-Home Equipment Manufacturers
Over-the-Top Service Providers
Telcos providing “Triple-Play” and “Quad-Play” services
Television Channels and Broadcasters
Regulators and Policy makers
Teleport Operators
Banks and Investors
Executive Summary
The global economic environment is undergoing a rapid shift. Trade, money, influence,
and power are migrating from the Northern Hemisphere to the South, from the established
West to the East. As countries such as China, India, Indonesia, and Brazil become the
world’s growth engines, the Direct-to-Home Television market is no different, with the
influence and importance of these developing regions increasing all the time. In Global
Direct-to-Home (DTH) Markets, 6th Edition, NSR delves into the DTH markets, examining
recent trends and forecasting future market tendencies in order to provide a
comprehensive understanding of the direction of the DTH industry today, and how to best
capitalize on this shift to the Southern Hemisphere.
The broadest trends observed through this report are an increase in
subscriber numbers but a decrease in subscriber ARPUs. An
increase in overall revenues and bottom line profits, but a decrease
in profit margins. A gradual expansion of platform offerings,
especially in developing regions, complimented by a huge increase
in Global DTH channels, especially HD ones, which will more than
double. And last but not least, a shift in emphasis from North
America and Western Europe to developing regions such as South
Asia and Sub-Saharan Africa. With over 200 graphs, charts, and
tables, NSR’s Global Direct-to Home (DTH) Markets, 6th Edition is a
comprehensive, objective, and strategically-oriented report on how to
succeed in the diverse and faced-paced DTH environment of today.
www.nsr.com © 2013– NSR 6
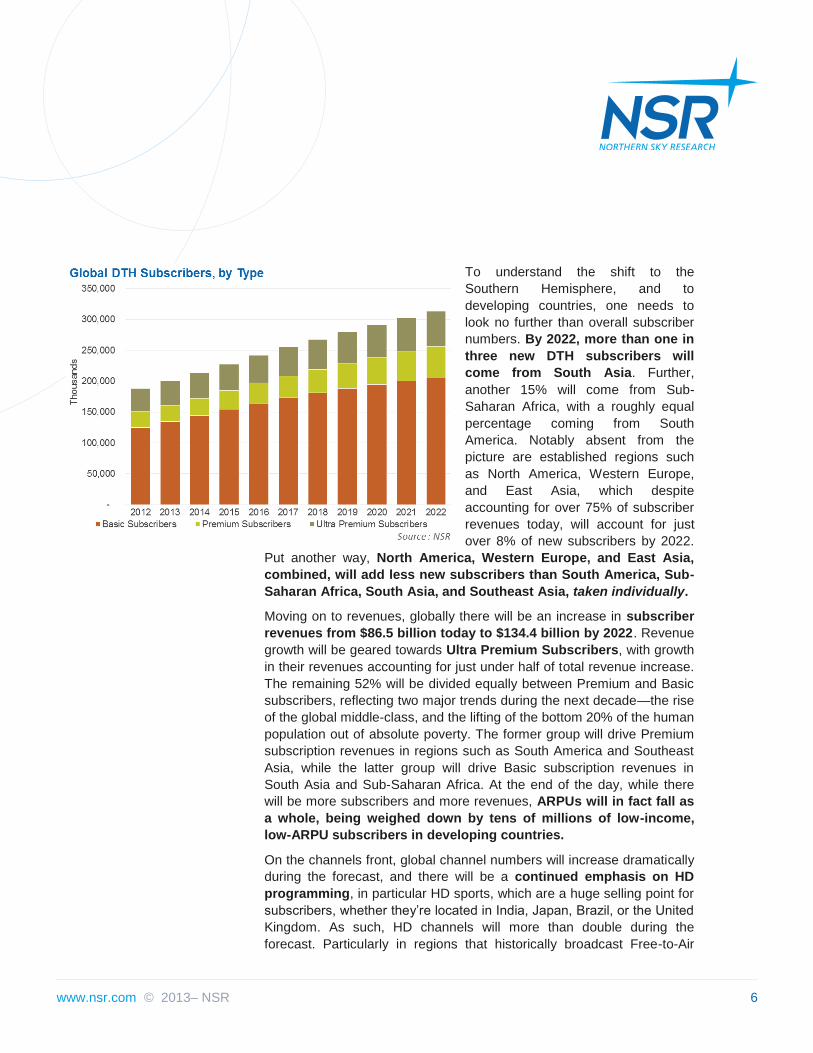
To understand the shift to the
Southern Hemisphere, and to
developing countries, one needs to
look no further than overall subscriber
numbers. By 2022, more than one in
three new DTH subscribers will
come from South Asia. Further,
another 15% will come from Sub-
Saharan Africa, with a roughly equal
percentage coming from South
America. Notably absent from the
picture are established regions such
as North America, Western Europe,
and East Asia, which despite
accounting for over 75% of subscriber
revenues today, will account for just
over 8% of new subscribers by 2022.
Put another way, North America, Western Europe, and East Asia,
combined, will add less new subscribers than South America, Sub-
Saharan Africa, South Asia, and Southeast Asia, taken individually.
Moving on to revenues, globally there will be an increase in subscriber
revenues from $86.5 billion today to $134.4 billion by 2022. Revenue
growth will be geared towards Ultra Premium Subscribers, with growth
in their revenues accounting for just under half of total revenue increase.
The remaining 52% will be divided equally between Premium and Basic
subscribers, reflecting two major trends during the next decade—the rise
of the global middle-class, and the lifting of the bottom 20% of the human
population out of absolute poverty. The former group will drive Premium
subscription revenues in regions such as South America and Southeast
Asia, while the latter group will drive Basic subscription revenues in
South Asia and Sub-Saharan Africa. At the end of the day, while there
will be more subscribers and more revenues, ARPUs will in fact fall as
a whole, being weighed down by tens of millions of low-income,
low-ARPU subscribers in developing countries.
On the channels front, global channel numbers will increase dramatically
during the forecast, and there will be a continued emphasis on HD
programming, in particular HD sports, which are a huge selling point for
subscribers, whether they’re located in India, Japan, Brazil, or the United
Kingdom. As such, HD channels will more than double during the
forecast. Particularly in regions that historically broadcast Free-to-Air

www.nsr.com © 2013– NSR 7
channels, such as the Middle East & North Africa, HD channels will be a
key differentiator in justifying Pay TV. Further, in regions with
considerable threats from IPTV, HD content will stand out from the
Internet-based offerings that are often lower viewing quality.
Finally, among emerging technologies,
NSR believes that Ultra HD will eventually
win out over 3D TV, a topic covered
regionally within Global Direct-to-Home
(DTH) Markets. While some regions will see
3D with increased influence, on a global
scale, UHD will have more channels being
aired by 2022, and will, simply put, overtake
3D TV as the preferred new viewing
technology moving forward.
As the Global DTH industry witnesses a
massive paradigm shift from North to
South, from the West to the East, this
turbulence is continuing to give way to
opportunity. In NSR’s Global Direct-to-
Home (DTH) Markets, 6th Edition, the
global DTH market is broken down by
subscribers, channels, revenues, satellite capacity, ARPUs, and a
number of other metrics. Complimented by thorough quantitative and
qualitative analysis, and broken down into digestible terms with Bottom
Line analysis, NSR’s Global Direct-to-Home (DTH) Markets will provide
the reader with the best way to capitalize on the $48 billion in new yearly
revenues coming from 125 million new subscribers in the global DTH
industry, be it as a satellite operator, DTH platform, equipment provider,
or an investor.
www.nsr.com © 2013– NSR 8
Table of Contents
1. Executive Summary
2. Global Market Overview
2.1. Global Trends, Drivers, and Restraints
2.1.1. State of the Global DTH Industry
2.1.2. Bottom Line
2.2. DTH Market Subscriber Parameters & Forecasts
2.2.1. Global TV Households and DTH Penetration
2.2.2. Global DTH Subscribers
2.2.3. Global Subscriber Churn
2.2.4. Global Gross & Net Subscriber Additions
2.2.5. Global Platform Count
2.2.6. Global Subscribers by Satellite Operator
2.3. DTH Financial Forecasts
2.3.1. Global DTH Subscriber ARPUs
2.3.2. Global DTH Subscriber Revenues
2.3.3. Global DTH Platform Profitability, OpEx, and SAC
2.4. DTH Channels Forecasts
2.4.1. Global DTH Channels—SD
2.4.2. Global DTH Channels—HD
2.4.3. Global DTH Channels—3D
2.4.4. Global DTH Channels—Ultra HD (UHD)
2.4.5. Global Average Number of Channels per Platform
2.5. DTH Transponder Forecasts
2.5.1. Global DTH Transponder (TPE) Utilization—Ku-band
www.nsr.com © 2013– NSR 9
2.5.2. Global DTH Gbps Utilization—HTS
2.5.3. Global DTH Transponder Leasing Revenues—Ku-band
2.5.4. Global DTH Gbps Leasing Revenues—HTS
2.5.5. Global DTH Leased Transponders by Satellite Operator
2.6. Comparison of DTH 4th, DTH 5th, and DTH 6th Editions
2.6.1. Global DTH Subscriber Comparison
2.6.2. Global DTH Channels by Platform Comparison
3. North America
3.1. Regional Trends, Drivers, and Restraints
3.1.1. State of the DTH Industry
3.1.2. Bottom Line
3.2. DTH Market Subscriber Parameters & Forecasts
3.2.1. TV Households and DTH Penetration Rate
3.2.2. DTH Subscribers
3.2.3. Subscriber Churn
3.2.4. Gross & Net Subscriber Additions
3.2.5. Subscribers per Satellite Operator, 2012
3.3. DTH Financial Forecasts
3.3.1. Subscriber ARPU
3.3.2. Subscription Revenue
3.3.3. Average Platform Profitability, OpEx, and SAC
3.4. DTH Channels Forecasts
3.4.1. DTH Channels—SD
3.4.2. DTH Channels—HD
3.4.3. DTH Channels—3D
3.4.4. DTH Channels—Ultra HD
3.4.5. Average Channels per Platform

www.nsr.com © 2013– NSR 10
3.4.6. Satellite Operator Channel Market Share, 2012
3.5. DTH Transponder Forecasts
3.5.1. Total DTH Transponder Utilization—Ku-band
3.5.2. Total DTH Gbps Utilization—HTS
3.5.3. Total DTH Transponder Utilization—Dedicated Ku-band
3.5.4. Total DTH Transponder Utilization—Dedicated Ka-band
3.5.5. Total DTH Transponder Leasing Revenues—Ku-band
3.6. Comparison of DTH 4th, DTH 5th, and DTH 6th Editions
3.6.1. DTH Subscriber Comparison
3.6.2. DTH Channels per Platform Comparison
4. Central America & Caribbean
4.1. Regional Trends, Drivers, and Restraints
4.1.1. State of the DTH Industry
4.1.2. Bottom Line
4.2. DTH Market Subscriber Parameters & Forecasts
4.2.1. TV Households and DTH Penetration Rate
4.2.2. DTH Subscribers
4.2.3. Subscriber Churn
4.2.4. Gross & Net Subscriber Additions
4.2.5. DTH Platform Count
4.2.6. Subscribers per Satellite Operator, 2012
4.3. DTH Financial Forecasts
4.3.1. Subscriber ARPU
4.3.2. Subscription Revenue
4.3.3. Average Platform Profitability, OpEx, and SAC
4.4. DTH Channels Forecasts
4.4.1. DTH Channels—SD
www.nsr.com © 2013– NSR 11
4.4.2. DTH Channels—HD
4.4.3. DTH Channels—3D
4.4.4. DTH Channels—Ultra HD
4.4.5. Average Channels per Platform
4.4.6. Satellite Operator Channel Market Share, 2012
4.5. DTH Transponder Forecasts
4.5.1. Total DTH Transponder Utilization—Ku-band
4.5.2. Total DTH Leasing Revenues—Ku-band
4.5.3. Satellite Operator Transponder Market Share
4.6. Comparison of DTH 4th, DTH 5th, and DTH 6th Editions, Key Country Analysis
4.6.1. DTH Subscriber Comparison
4.6.2. DTH Channels per Platform Comparison
4.6.3. Key Country Analysis—Mexico
5. South America
5.1. Regional Trends, Drivers, and Restraints
5.1.2. Bottom Line
5.2. DTH Market Subscriber Parameters & Forecasts
5.2.1. TV Households and DTH Penetration Rate
5.2.2. DTH Subscribers
5.2.3. Subscriber Churn
5.2.4. Gross & Net Subscriber Additions
5.2.5. DTH Platform Count
5.2.6. Subscribers per Satellite Operator, 2012
5.3. DTH Financial Forecasts
5.3.1. Subscriber ARPU
5.3.2. Subscription Revenue
5.3.3. Average Platform Profitability, OpEx, and SAC

www.nsr.com © 2013– NSR 12
5.4. DTH Channels Forecasts
5.4.1. DTH Channels—SD
5.4.2. DTH Channels—HD
5.4.3. DTH Channels—3D
5.4.4. DTH Channels—Ultra HD
5.4.5. Average Channels per Platform
5.4.6. Satellite Operator Channel Market Share, 2012
5.5. DTH Transponder Forecasts
5.5.1. Total DTH Transponder Utilization—Ku-band
5.5.2. Total DTH Leasing Revenues—Ku-band
5.5.3. Satellite Operator Transponder Market Share
5.6. Comparison of DTH 4th, DTH 5th, and DTH 6th Editions, Key Country Analysis
5.6.1. DTH Subscriber Comparison
5.6.2. DTH Channels per Platform Comparison
5.6.3. Key Country Analysis—Brazil
6. Western Europe
6.1. Regional Trends, Drivers, and Restraints
6.1.1. State of the DTH Industry
6.1.2. Bottom Line
6.2. DTH Market Subscriber Parameters & Forecasts
6.2.1. TV Households and DTH Penetration Rate
6.2.2. DTH Subscribers
6.2.3. Subscriber Churn
6.2.4. Gross & Net Subscriber Additions
6.2.5. Subscribers per Satellite Operator, 2012
6.3. DTH Financial Forecasts
6.3.1. Subscriber ARPU

www.nsr.com © 2013– NSR 13
6.3.2. Subscription Revenue
6.3.3. Average Platform Profitability, OpEx, and SAC
6.4. DTH Channels Forecasts
6.4.1. DTH Channels—SD
6.4.2. DTH Channels—HD
6.4.3. DTH Channels—3D
6.4.4. DTH Channels—Ultra HD
6.4.5. Average Channels per Platform
6.4.6. Satellite Operator Channel Market Share, 2012
6.5. DTH Transponder Forecasts
6.5.1. Total DTH Transponder Utilization—Ku-band
6.5.2. Total DTH Leasing Revenues—Ku-band
6.5.3. Satellite Operator Transponder Market Share
6.6. WEU Bouquet Subscriber Parameters & Forecasts
6.6.1. TV Households and DTH Penetration Rate
6.6.2. DTH Subscribers
6.6.3. Subscriber Churn
6.6.4. Gross & Net Subscriber Additions
6.6.5. Subscribers per Satellite Operator, 2012
6.6.6. DTH Bouquet Count
6.7. Bouquet Financial Forecasts
6.7.1. Subscriber ARPU
6.7.2. Subscription Revenue
Average Platform Profitability, OpEx, and SAC
6.8. Bouquet Channels & TPE Forecasts
6.8.1. DTH Channels—SD
6.8.2. DTH Channels—HD
6.8.3. Average Channels per Platform
www.nsr.com © 2013– NSR 14
6.8.4. DTH Transponder Utilization—Ku band
6.8.5. Total DTH Leasing Revenues—Ku-band
6.8.6. Satellite Operator Transponder Market Share
6.9. Comparison of DTH 4th, DTH 5th, and DTH 6th Editions, Key Country Analysis
6.9.1. DTH Subscriber Comparison
6.9.2. DTH Channels per Platform Comparison
6.9.3. Key Country Analysis—Germany
7. Central & Eastern Europe
7.1. Regional Trends, Drivers, and Restraints
7.1.1. State of the DTH Industry
7.1.2. Bottom Line
7.2. DTH Market Subscriber Parameters & Forecasts
7.2.1. TV Households and DTH Penetration Rate
7.2.2. DTH Subscribers
7.2.3. Subscriber Churn
7.2.4. Gross & Net Subscriber Additions
7.2.5. DTH Platform Count
7.2.6. Subscribers per Satellite Operator, 2012
7.3. DTH Financial Forecasts
7.3.1. Subscriber ARPU
7.3.2. Subscription Revenue
7.3.3. Average Platform Profitability, OpEx, and SAC
7.4. DTH Channels Forecasts
7.4.1. DTH Channels—SD
7.4.2. DTH Channels—HD
7.4.3. DTH Channels—3D
7.4.4. DTH Channels—Ultra HD

www.nsr.com © 2013– NSR 15
7.4.5. Average Channels per Platform
7.4.6. Satellite Operator Channel Market Share, 2012
7.5. DTH Transponder Forecasts
7.5.1. Total DTH Transponder Utilization—Ku-band
7.5.2. Total DTH Leasing Revenues—Ku-band
7.5.3. Satellite Operator Transponder Market Share
7.6. CEEU Bouquet Subscriber Parameters & Forecasts
7.6.1. TV Households and DTH Penetration Rate
7.6.2. DTH Subscribers
7.6.3. Subscriber Churn
7.6.4. Gross & Net Subscriber Additions
7.6.5. Bouquet Count
7.6.6. Subscribers per Satellite Operator, 2012
7.7. Bouquet Financial Forecasts
7.7.1. Subscriber ARPU
7.7.2. Subscription Revenue
7.7.3. Average Platform Profitability, OpEx, and SAC
7.8. Bouquet Channels Forecasts
7.8.1. DTH Channels—SD
7.8.2. DTH Channels—HD
7.8.3. Average Channels per Platform
7.8.4. DTH Transponder Utilization—Ku band
7.8.5. Total DTH Leasing Revenues—Ku-band
7.8.6. Satellite Operator Transponder Market Share
7.9. Comparison of DTH 4th, DTH 5th, and DTH 6th Editions, Key Country Analyses
7.9.1. DTH Subscriber Comparison
7.9.2. DTH Channels per Platform Comparison
7.9.3. Key Country Analysis—Russia

www.nsr.com © 2013– NSR 16
7.9.4. Key Country Analysis—Romania
8. Middle East & North Africa
8.1. Regional Trends, Drivers, and Restraints
8.1.1. State of the DTH Industry
8.1.2. Bottom Line
8.2. DTH Market Subscriber Parameters & Forecasts
8.2.1. TV Households and DTH Penetration Rate
8.2.2. DTH Subscribers
8.2.3. Subscriber Churn
8.2.4. Gross & Net Subscriber Additions
8.2.5. Subscribers per Satellite Operator, 2012
8.3. DTH Financial Forecasts
8.3.1. Subscriber ARPU
8.3.2. Subscription Revenue
8.3.3. Average Platform Profitability, OpEx, and SAC
8.4. DTH Channels Forecasts
8.4.1. DTH Channels—SD
8.4.2. DTH Channels—HD
8.4.3. DTH Channels—3D
8.4.4. DTH Channels—Ultra HD
8.4.5. Average Channels per Platform
8.4.6. Satellite Operator Channel Market Share, 2012
8.5. DTH Transponder Forecasts
8.5.1. Total DTH Transponder Utilization—Ku-band
8.5.2. Total DTH Leasing Revenues—Ku-band
8.5.3. Satellite Operator Transponder Market Share
8.6. Comparison of DTH 4th, DTH 5th, and DTH 6th Editions, Key Country Analysis
www.nsr.com © 2013– NSR 17
8.6.1. DTH Subscriber Comparison
8.6.2. DTH Channels per Platform Comparison
8.6.3. Key Country Analysis—Egypt
9. Sub-Saharan Africa
9.1. Regional Trends, Drivers, and Restraints
9.1.1. State of the DTH Industry
9.1.2. Bottom Line
9.2. DTH Market Subscriber Parameters & Forecasts
9.2.1. TV Households and DTH Penetration Rate
9.2.2. DTH Subscribers
9.2.3. Subscriber Churn
9.2.4. Gross & Net Subscriber Additions
9.2.5. DTH Platform Count
9.2.6. Subscribers per Satellite Operator, 2012
9.3. DTH Financial Forecasts
9.3.1. Subscriber ARPU
9.3.2. Subscription Revenue
9.3.3. Average Platform Profitability, OpEx, and SAC
9.4. DTH Channels Forecasts
9.4.1. DTH Channels—SD
9.4.2. DTH Channels—HD
9.4.3. Average Channels per Platform
9.4.4. Satellite Operator Channel Market Share, 2012
9.5. DTH Transponder Forecasts
9.5.1. Total DTH Transponder Utilization—Ku-band
9.5.2. Total DTH Leasing Revenues—Ku-band
9.5.3. Satellite Operator Transponder Market Share

www.nsr.com © 2013– NSR 18
9.6. Comparison of DTH 4th, DTH 5th, and DTH 6th Editions, Key Country Analyses
9.6.1. DTH Subscriber Comparison
9.6.2. DTH Channels per Platform Comparison
9.6.3. Key Country Analysis—Nigeria
9.6.4. Key Country Analysis—Kenya
10. East Asia
10.1. Regional Trends, Drivers, and Restraints
10.1.1. State of the DTH Industry
10.1.2. Bottom Line
10.2. DTH Market Subscriber Parameters & Forecasts
10.2.1. TV Households and DTH Penetration Rate
10.2.2. DTH Subscribers
10.2.3. Subscriber Churn
10.2.4. Gross & Net Subscriber Additions
10.2.5. Subscribers per Satellite Operator, 2012
10.3. DTH Financial Forecasts
10.3.1. Subscriber ARPU
10.3.2. Subscription Revenue
10.3.3. Average Platform Profitability, OpEx, and SAC
10.4. DTH Channel Forecasts
10.4.1. DTH Channels—SD
10.4.2. DTH Channels—HD
10.4.3. DTH Channels—3D
10.4.4. DTH Channels—Ultra HD
10.4.5. Average Channels per Platform
10.4.6. Satellite Operator Channel Market Share
10.5. DTH Transponder Forecasts
www.nsr.com © 2013– NSR 19
10.5.1. Total DTH Transponder Utilization—Ku-band
10.5.2. Total Leasing Revenues—Ku-band
10.5.3. Satellite Operator Transponder Market Share
10.6. Comparison of DTH4th, DTH 5th, and DTH 6th Editions
10.6.1. DTH Subscriber Comparison
10.6.2. DTH Channels per Platform Comparison
11. South Asia
11.1. Regional Trends, Drivers, and Restraints
11.1.1. State of the DTH Industry
11.1.2. Bottom Line
11.2. DTH Market Subscriber Parameters & Forecasts
11.2.1. TV Households and DTH Penetration Rate
11.2.2. DTH Subscribers
11.2.3. Subscriber Churn
11.2.4. Gross & Net Subscriber Additions
11.2.5. DTH Platform Count
11.2.6. Subscribers per Satellite Operator, 2012
11.3. DTH Financial Forecasts
11.3.1. Subscriber ARPU
11.3.2. Subscriber Revenue
11.3.3. Average Platform Profitability, OpEx, and SAC
11.4. DTH Channels Forecast
11.4.1. DTH Channels—SD
11.4.2. DTH Channels—HD
11.4.3. DTH Channels—3D
11.4.4. DTH Channels—Ultra HD
11.4.5. Average Channels per Platform

www.nsr.com © 2013– NSR 20
11.4.6. Satellite Operator Channel Market Share, 2012
11.5. DTH Transponder Forecasts
11.5.1. Total DTH Transponder Utilization—Ku-band
11.5.2. Total DTH Leasing Revenues—Ku band
11.5.3. Satellite Operator Transponder Market Share
11.6. Comparison of DTH 4th, DTH 5th, and DTH 6th Editions, Key Country Analysis
11.6.1. DTH Subscriber Comparison
11.6.2. DTH Channels per Platform Comparison
11.6.3. Key Country Analysis—India
12. Southeast Asia
12.1. Regional Trends, Drivers, and Restraints
12.1.1. State of the DTH Industry
12.1.2. Bottom Line
12.2. DTH Market Subscriber Parameters & Forecasts
12.2.1. TV Households and DTH Penetration Rate
12.2.2. DTH Subscribers
12.2.3. Subscriber Churn
12.2.4. Gross & Net Subscriber Additions
12.2.5. DTH Platform Count
12.2.6. Subscribers per Satellite Operator, 2012
12.3. DTH Financial Forecasts
12.3.1. Subscriber ARPU
12.3.2. Subscription Revenue
12.3.3. Average Platform Profitability, OpEx, and SAC
12.4. DTH Channel Forecasts
12.4.1. DTH Channels—SD
12.4.2. DTH Channels—HD

www.nsr.com © 2013– NSR 21
12.4.3. DTH Channels—3D
12.4.4. DTH Channels—Ultra HD
12.4.5. Average Channels per Platform
12.4.6. Satellite Operator Channel Market Share, 2012
12.5. DTH Transponder Forecasts
12.5.1. Total DTH Transponder Utilization—Ku-band
12.5.2. Total DTH Leasing Revenues—Ku-band
12.5.3. Satellite Operator Transponder Market Share
12.6. Comparison of DTH 4th, DTH 5th, and DTH 6th Editions, Key Country Analysis
12.6.1. DTH Subscriber Comparison
12.6.2. DTH Channels per Platform Comparison
12.6.3. Key Country Analysis—Indonesia
List of Exhibits
1. Executive Summary
1.1. Global DTH Subs Revenue by Region, 2012
1.2. Global DTH Subs Revenue by Region, 2022
1.3. Global DTH Leasing Revenue, Ku-band
2. Global Market Overview
2.1. Global TV Households & DTH Penetration
2.2. Global DTH Subscribers, by Type
2.3. Global Subscriber Churn
2.4. Global Subscriber Gross Additions
2.5. Global No. of Platforms
2.6. Global Subscribers by Satellite Operator, 2012

www.nsr.com © 2013– NSR 22
2.7. Global DTH ARPU
2.8. Global DTH Subscription Revenues
2.9. Global Average Platform Financial Metrics
2.10. Global SD Channels
2.11. Global HD Channels
2.12. Global 3D Channels
2.13. Global Ultra HD Channels, 2022
2.14. Global Average No. Channels per Platform
2.15. Global DTH Capacity, Ku-band
2.16. Global DTH Capacity, HTS
2.17. Global DTH Leasing Revenue, Ku-band
2.18. Global DTH Leasing Revenue, HTS
2.19. Global Leased TPEs by Satellite Operator, 2012
2.20. Global DTH6 vs DTH5 vs DTH4 Subscribers
2.21. Global DTH6 vs DTH5 vs DTH4 Average Channels per Platform
3. North America
3.1. United States Subscriber Market Share, 2012
3.2. Platforms Considered
3.3. NAM TV Households & DTH Penetration
3.4. NAM DTH Subscribers, by Type
3.5. NAM Subscriber Churn
3.6. NAM Subscriber Gross Additions
3.7. NAM Subscribers by Satellite Operator, 2012
3.8. NAM DTH ARPU
3.9. NAM DTH Subscription Revenues
3.10. NAM DTH Subscription Revenues, 2012-2022
3.11. NAM Average Platform Financial Metrics

www.nsr.com © 2013– NSR 23
3.12. NAM DTH Channels, SD
3.13. NAM DTH Channels, HD
3.14. NAM DTH Channels, 3D
3.15. NAM DTH Channels, UHD – 2022
3.16. NAM Average No. Channels per Platform
3.17. NAM Channels by Satellite Operator, 2012
3.18. NAM DTH Capacity, Ku-band
3.19. NAM DTH Capacity, HTS
3.20. NAM DTH Capacity, Ded. Ku-band
3.21. NAM DTH Capacity, Ded. Ka-band
3.22. NAM DTH Leasing Revenue, Ku-band
3.23. NAM DTH6 vs DTH5 vs DTH4: Subscribers
3.24. NAM DTH6 vs DTH5 vs DTH4: Average Channels per Platform
4. Central America & Caribbean
4.1. Mexico Subscriber Market Share, 2012
4.2. DTH Platforms Considered
4.3. CAMCB TV Households & DTH Penetration
4.4. CAMCB DTH Subscribers, by Type
4.5. CAMCB Subscriber Churn
4.6. CAMCB Subscriber Gross Additions
4.7. CAMCB No. of Platforms
4.8. CAMCB Subscribers by Satellite Operator, 2012
4.9. CAMCB DTH ARPU
4.10. CAMCB DTH Subscription Revenues
4.11. CAMCB DTH Subscription Revenues, 2012-2022
4.12. CAMCB Average Platform Financial Metrics
4.13. CAMCB DTH Channels, SD
www.nsr.com © 2013– NSR 24
4.14. CAMCB DTH Channels, HD
4.15. CAMCB DTH Channels, 3D
4.16. CAMCB DTH Channels, UHD
4.17. CAMCB Average No. Channels per Platform
4.18. CAMCB Channels by Satellite Operator, 2012
4.19. CAMCB DTH Capacity, Ku-band
4.20. CAMCB DTH Leasing Revenue, Ku-band
4.21. CAMCB Leased TPEs by Satellite Operator, 2012
4.22. CAMCB DTH6 vs DTH5 vs DTH4: Subscribers
4.23. CAMCB DTH6 vs DTH5 vs DTH4: Average Channels per Platform
4.24. GDP Per Capita (PPP), 2012, US$
5. South America
5.1. SAM Subscriber Market Share, 2012
5.2. DTH Platforms Considered
5.3. SAM TV Households & DTH Penetration
5.4. SAM DTH Subscribers, by Type
5.5. SAM Subscriber Churn
5.6. SAM Subscriber Gross Additions
5.7. SAM No. of Platforms
5.8. SAM Subscribers by Satellite Operator, 2012
5.9. SAM DTH ARPU
5.10. SAM DTH Subscription Revenues
5.11. SAM Average Platform Financial Metrics
5.12. SAM DTH Channels, SD
5.13. SAM DTH Channels, HD
5.14. SAM DTH Channels, 3D
5.15. SAM DTH Channels, UHD
www.nsr.com © 2013– NSR 25
5.16. SAM Average No. Channels per Platform
5.17. SAM Channels by Satellite Operator, 2012
5.18. SAM DTH Capacity, Ku-band
5.19. SAM DTH Leasing Revenue, Ku-band
5.20. SAM Leased TPEs by Satellite Operator, 2012
5.21. SAM DTH6 vs DTH5 vs DTH4: Subscribers
5.22. SAM DTH6 vs DTH5 vs DTH4: Average Channels per Platform
5.23. South American GDP (PPP) by Country, 2012
6. Western Europe
6.1. DTH Platforms Considered
6.2. WEU Subscriber Market Share, 2012
6.3. WEU TV Households & DTH Penetration
6.4. WEU DTH Subscribers, by Type
6.5. WEU Subscriber Churn
6.6. WEU Subscriber Gross Additions
6.7. WEU Subscribers by Satellite Operator, 2012
6.8. WEU DTH ARPU
6.9. WEU DTH Subscription Revenues
6.10. WEU Average Platform Financial Metrics
6.11. WEU DTH Channels, SD
6.12. WEU DTH Channels, HD
6.13. WEU DTH Channels, 3D
6.14. WEU DTH Channels, UHD
6.15. WEU Average No. Channels per Platform
6.16. WEU Channels by Satellite Operator, 2012
6.17. WEU DTH Capacity, Ku-band
6.18. WEU DTH Leasing Revenue, Ku-band
www.nsr.com © 2013– NSR 26
6.19. WEU Leased TPEs by Satellite Operator, 2012
6.20. WEU TV Households & Bouquet Penetration
6.21. WEU Bouquet Subscribers, by Type
6.22. WEU Subscriber Churn
6.23. WEU Subscriber Gross Additions
6.24. WEU Bouquet Subscribers by Satellite Operator, 2012
6.25. WEU No. of Bouquets
6.26. WEU Bouquets ARPU
6.27. WEU Bouquets Subscription Revenues
6.28. WEU Average Bouquet Financial Metrics
6.29. WEU Bouquets Channels, SD
6.30. WEU Bouquets Channels, HD
6.31. WEU Average No. Channels per Bouquet
6.32. WEU Bouquets Capacity, Ku-band
6.33. WEU Bouquets Leasing Revenue, Ku-band
6.34. WEU Bouquets Leased TPEs by Satellite Operator, 2012
6.35. WEU DTH6 vs DTH5 vs DTH4: Subscribers
6.36. WEU DTH6 vs DTH5 vs DTH4: Average Channels per Platform
6.37. 2012 Subscriber Breakdown
6.38. 2009 Subscriber Breakdown
6.39. Immigration into Germany by Country of Origin, 2012
7. Central and Eastern Europe
7.1. CEEU Subscriber Market Share, 2012
7.2. DTH Platforms Considered
7.3. CEEU TV Households & DTH Penetration
7.4. CEEU DTH Subscribers, by Type
7.5. CEEU Subscriber Churn

www.nsr.com © 2013– NSR 27
7.6. CEEU Subscriber Gross Additions
7.7. CEEU No. of Platforms
7.8. CEEU Subscribers by Satellite Operator, 2012
7.9. CEEU DTH ARPU
7.10. CEEU DTH Subscription Revenues
7.11. CEEU Average Platform Financial Metrics
7.12. CEEU DTH Channels, SD
7.13. CEEU DTH Channels, HD
7.14. CEEU DTH Channels, 3D
7.15. CEEU DTH Channels, UHD
7.16. CEEU Average No. Channels per Platform
7.17. CEEU Channels by Satellite Operator, 2012
7.18. CEEU DTH Capacity, Ku-band
7.19. CEEU DTH Leasing Revenue, Ku-band
7.20. CEEU Leased TPEs by Satellite Operator, 2012
7.21. CEEU TV Households & Bouquet Penetration
7.22. CEEU Bouquet Subscribers, by Type
7.23. CEEU Subscriber Churn
7.24. CEEU Subscriber Gross Additions
7.25. CEEU No. of Bouquets
7.26. CEEU Bouquet Subscribers by Satellite Operator, 2012
7.27. CEEU Bouquets ARPU
7.28. CEEU Bouquets Subscription Revenues
7.29. CEEU Average Bouquet Financial Metrics
7.30. CEEU Bouquets Channels, SD
7.31. CEEU Bouquets Channels, HD
7.32. CEEU Average No. Channels per Bouquet
7.33. CEEU Bouquets Capacity, Ku-band

www.nsr.com © 2013– NSR 28
7.34. CEEU Bouquets Leasing Revenue, Ku-band
7.35. CEEU Bouquets Leased TPEs by Satellite Operator, 2012
7.36. CEEU DTH6 vs DTH5 vs DTH4: Subscribers
7.37. CEEU DTH6 vs DTH5 vs DTH4: Average Channels per Platform
7.38. Population Density vs DTH Penetration, 2012
7.39. DTH Penetration by Country, 2012
8. Middle East & North Africa
8.1. MENA Subscriber Market Share, 2012
8.2. DTH Platforms Considered
8.3. MENA TV Households & DTH Penetration
8.4. MENA DTH Subscribers, by Type
8.5. MENA Subscriber Churn
8.6. MENA Subscriber Gross Additions
8.7. MENA Subscribers by Satellite Operator, 2012
8.8. MENA DTH ARPU
8.9. MENA DTH Subscription Revenues
8.10. MENA Average Platform Financial Metrics
8.11. MENA DTH Channels, SD
8.12. MENA DTH Channels, HD
8.13. MENA DTH Channels, 3D
8.14. MENA DTH Channels, UHD
8.15. MENA Average No. Channels per Platform
8.16. MENA Channels by Satellite Operator, 2012
8.17. MENA DTH Capacity, Ku-band
8.18. MENA DTH Leasing Revenue, Ku-band
8.19. MENA Leased TPEs by Satellite Operator, 2012
8.20. MENA DTH6 vs DTH5 vs DTH4: Subscribers

www.nsr.com © 2013– NSR 29
8.21. MENA DTH6 vs DTH5 vs DTH4: Average Channels per Platform
8.22. Population by Age Group (2013)
9. Sub-Saharan Africa
9.1. SSA Subscriber Market Share, 2012
9.2. DTH Platforms Considered
9.3. SSA TV Households & DTH Penetration
9.4. SSA DTH Subscribers, by Type
9.5. SSA Subscriber Churn
9.6. SSA Subscriber Gross Additions
9.7. SSA No. of Platforms
9.8. SSA Subscribers by Satellite Operator, 2012
9.9. SSA DTH ARPU
9.10. SSA DTH Subscription Revenues
9.11. SSA Average Platform Financial Metrics
9.12. SSA DTH Channels, SD
9.13. SSA DTH Channels, HD
9.14. SSA Average No. Channels per Platform
9.15. SSA Channels by Satellite Operator, 2012
9.16. SSA DTH Capacity, Ku-band
9.17. SSA DTH Leasing Revenue, Ku-band
9.18. SSA Leased TPEs by Satellite Operator, 2012
9.19. SSA DTH6 vs DTH5 vs DTH4: Subscribers
9.20. SSA DTH6 vs DTH5 vs DTH4: Average Channels per Platform
9.21. Population of Emerging Economies to 2035 (Millions)
9.22. M-Pesa Users by Year (000’s)

www.nsr.com © 2013– NSR 30
10. East Asia
10.1. EA Subscriber Market Share, 2012
10.2. DTH Platforms Considered
10.3. EA TV Households & DTH Penetration
10.4. EA DTH Subscribers, by Type
10.5. EA Subscriber Churn
10.6. EA Subscriber Gross Additions
10.7. EA Subscribers by Satellite Operator, 2012
10.8. EA DTH ARPU
10.9. EA DTH Subscription Revenues
10.10. EA Average Platform Financial Metrics
10.11. EA DTH Channels, SD
10.12. EA DTH Channels, HD
10.13. EA DTH Channels, 3D
10.14. EA DTH Channels, UHD
10.15. EA Average No. Channels per Platform
10.16. EA Channels by Satellite Operator, 2012
10.17. EA DTH Capacity, Ku-band
10.18. EA DTH Leasing Revenue, Ku-band
10.19. EA Leased TPEs by Satellite Operator, 2012
10.20. EA DTH6 vs DTH5 vs DTH4: Subscribers
10.21. EA DTH6 vs DTH5 vs DTH4: Average Channels per Platform
11. South Asia
11.1. SA Subscriber Market Share, 2012
11.2. DTH Platforms Considered
11.3. SA TV Households & DTH Penetration
11.4. SA DTH Subscribers, by Type

www.nsr.com © 2013– NSR 31
11.5. SA Subscriber Churn
11.6. SA Subscriber Gross Additions
11.7. SA No. of Platforms
11.8. SA Subscribers by Satellite Operator, 2012
11.9. SA DTH ARPU
11.10. SA DTH Subscription Revenues
11.11. SA DTH Subscription Revenues, 2012-2022
11.12. SA Average Platform Financial Metrics
11.13. SA DTH Channels, SD
11.14. SA DTH Channels, HD
11.15. SA DTH Channels, 3D
11.16. SA DTH Channels, UHD
11.17. SA Average No. Channels per Platform
11.18. SA Channels by Satellite Operator, 2012
11.19. SA DTH Capacity, Ku-band
11.20. SA DTH Leasing Revenue, Ku-band
11.21. SA Leased TPEs by Satellite Operator, 2012
11.22. SA DTH6 vs DTH5 vs DTH4: Subscribers
11.23. SA DTH6 vs DTH5 vs DTH4: Average Channels per Platform
11.24. Mobile Phones per 100 People
12. Southeast Asia
12.1. SEA Subscriber Market Share, 2012
12.2. DTH Platforms Considered
12.3. SEA TV Households & DTH Penetration
12.4. SEA DTH Subscribers, by Type
12.5. SEA Subscriber Churn
12.6. SEA Subscriber Gross Additions

www.nsr.com © 2013– NSR 32
12.7. SEA No. of Platforms
12.8. SEA Subscribers by Satellite Operator, 2012
12.9. SEA DTH ARPU
12.10. SEA DTH Subscription Revenues
12.11. SEA Average Platform Financial Metrics
12.12. SEA DTH Channels, SD
12.13. SEA DTH Channels, HD
12.14. SEA DTH Channels, 3D
12.15. SEA DTH Channels, UHD
12.16. SEA Average No. Channels per Platform
12.17. SEA Channels by Satellite Operator, 2012
12.18. SEA DTH Capacity, Ku-band
12.19. SEA DTH Leasing Revenue, Ku-band
12.20. SEA Leased TPEs by Satellite Operator, 2012
12.21. SEA DTH6 vs DTH5 vs DTH4: Subscribers
12.22. SEA DTH6 vs DTH5 vs DTH4: Average Channels per Platform
12.23. Per Capita GDP (PPP) by Year