Embed Size (px)
Citation preview
8/6/2019 Global Dimming - The Evidence for It!
http://slidepdf.com/reader/full/global-dimming-the-evidence-for-it 1/4
W e a t h er – J an u ar y 2 0 0 5 ,V ol . 6 0 ,N o .1
11
G. StanhillInstitute of Soil, Water and
Environmental Sciences, Bet Dagan,
Israel
The purpose of this article is to draw atten-
tion to a recently observed, little known, and
even less understood, element of climatechange, and to point out its practical impli-
cations and theoretical importance.
Global dimming and theevidence for it
By analogy to the well known concept of
global warming, global dimming refers to
the currently occurring, widespread and sig-
nificant reduction in global irradiance, E g!,
that is the flux of solar radiation reaching the
earth’s surface both in the direct solar beam
and in the diffuse radiation scattered by thesky and clouds.
The direct evidence for a reduction in E g!
stems from the International Geophysical
Year of 1957/58 when a global network of
radiometer stations was set up to provide
accurate and comparable measurements of
the earth’s radiation balance. At the start of
the measurements a variety of radiometers
of very different accuracies were used, but
since then most measurements of E g! have
been made with thermopile pyranometers
and it is these measurements that have
been used in this study. When operated in
accordance with the World Meteorological
Organization’s (WMO’s) instructions, these
radiometers have an accuracy of 5% and 2%
respectively for daily and annual totals
(WMO 1997).
Ten years ago an analysis of annual values
of E g!, measured in the global network dur-
ing the four years 1958, 1965, 1975 and
1985, showed that large and statistically sig-
nificant reductions had occurred at many
sites although with considerable spatial
variation; weighted for the land surface of
the earth the global decrease averaged
9 W m–2
or 5.3% over the 1958–85 period(Stanhill and Moreshet 1992 ). A more recent
analysis of the entire WMO-sponsored World
Radiation Data Center database presented
the changes on a 2.5° × 2.5° grid scale for the
1964–93 period – significant global dim-
ming had taken place over large regions of
Africa, Asia, Europe and North America with
the decrease averaging 2% per decade
(Gilgen et al.1998). Detailed studies describ-
ing the reductions in the former Soviet
Union, USA, Arctic Circle, Germany and
Ireland have been published respectively byAbakumova et al. (1996), Liepert and Tegen
(2002), Stanhill (1995), Power (2003) and
Stanhill (1998).
As is the case with global warming, areas
exist in which no significant change has
occurred, notably Australia (Stanhill and
Kalma 1994). A few areas with significant
increases in E g! have also been reported,
the largest of which appears to be Japan
where an overall increase during the last 30
years has taken place. Gilgen et al .’s (1998)
map of global changes shows increases in
only four small areas, one of which was sig-nificant.
A review of the published information on
secular changes in E g! up to 2000 conclud-
ed that globally the decrease averaged
0.51±0.05Wm–2
annually, equivalent to a
reduction of 2.7% per decade, and now
totals 20Wm–2
– seven times the error of
measurement. Decreases in E g! were found
in all but two of the published results from
the 39 individual series of long-term meas-
urements tabulated in the review; at 28 sites
the global dimming was statistically signifi-
cant with an average reduction of
0.55Wm–2 per year. Only one of the two
increases reported for individual series was
statistically significant (Stanhill and Cohen
2001).
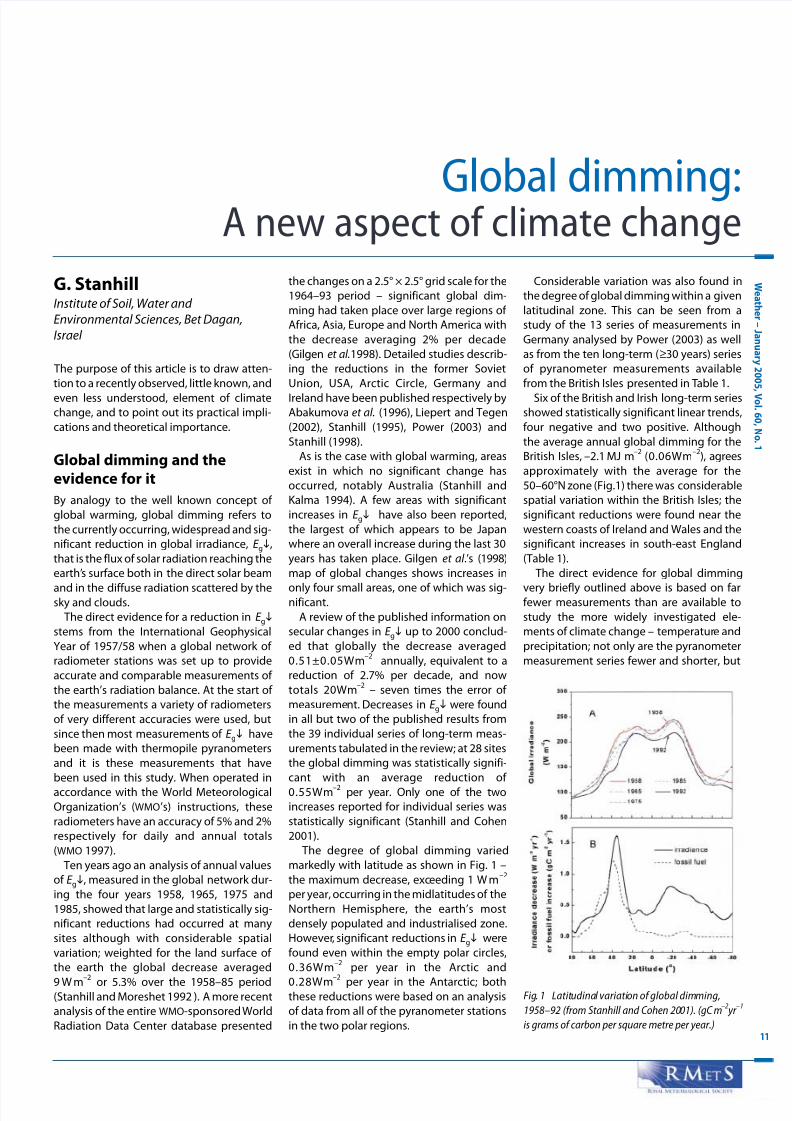
The degree of global dimming varied
markedly with latitude as shown in Fig. 1 –
the maximum decrease, exceeding 1 W m–2
per year, occurring in the midlatitudes of the
Northern Hemisphere, the earth’s most
densely populated and industrialised zone.
However, significant reductions in E g! were
found even within the empty polar circles,
0.36Wm–2
per year in the Arctic and
0.28Wm–2
per year in the Antarctic; boththese reductions were based on an analysis
of data from all of the pyranometer stations
in the two polar regions.
Considerable variation was also found in
the degree of global dimming within a given
latitudinal zone. This can be seen from a
study of the 13 series of measurements in
Germany analysed by Power (2003) as well
as from the ten long-term (≥30 years) series
of pyranometer measurements available
from the British Isles presented in Table 1.
Six of the British and Irish long-term seriesshowed statistically significant linear trends,
four negative and two positive. Although
the average annual global dimming for the
British Isles, –2.1 MJ m–2
(0.06Wm–2
), agrees
approximately with the average for the
50–60°N zone (Fig.1) there was considerable
spatial variation within the British Isles; the
significant reductions were found near the
western coasts of Ireland and Wales and the
significant increases in south-east England
(Table 1).
The direct evidence for global dimming
very briefly outlined above is based on farfewer measurements than are available to
study the more widely investigated ele-
ments of climate change – temperature and
precipitation; not only are the pyranometer
measurement series fewer and shorter, but
Global dimming:A new aspect of climate change
Fig. 1 Latitudinal variation of global dimming,
1958–92 (from Stanhill and Cohen 2001). (gC m–2
yr –1
is grams of carbon per square metre per year.)
8/6/2019 Global Dimming - The Evidence for It!
http://slidepdf.com/reader/full/global-dimming-the-evidence-for-it 2/4
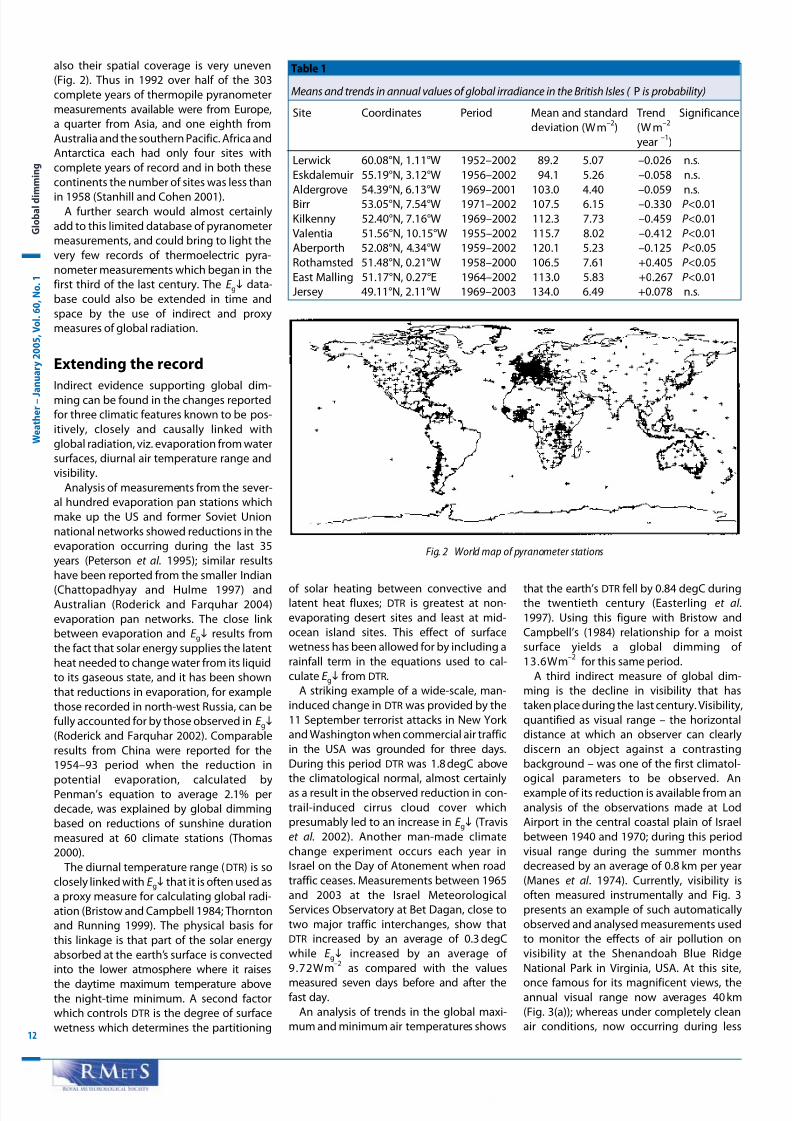
also their spatial coverage is very uneven
(Fig. 2). Thus in 1992 over half of the 303
complete years of thermopile pyranometer
measurements available were from Europe,
a quarter from Asia, and one eighth from
Australia and the southern Pacific. Africa and
Antarctica each had only four sites with
complete years of record and in both these
continents the number of sites was less than
in 1958 (Stanhill and Cohen 2001).A further search would almost certainly
add to this limited database of pyranometer
measurements, and could bring to light the
very few records of thermoelectric pyra-
nometer measurements which began in the
first third of the last century. The E g! data-
base could also be extended in time and
space by the use of indirect and proxy
measures of global radiation.
Extending the record
Indirect evidence supporting global dim-
ming can be found in the changes reported
for three climatic features known to be pos-
itively, closely and causally linked with
global radiation, viz. evaporation from water
surfaces, diurnal air temperature range and
visibility.
Analysis of measurements from the sever-
al hundred evaporation pan stations which
make up the US and former Soviet Union
national networks showed reductions in the
evaporation occurring during the last 35
years (Peterson et al. 1995); similar results
have been reported from the smaller Indian
(Chattopadhyay and Hulme 1997) andAustralian (Roderick and Farquhar 2004)
evaporation pan networks. The close link
between evaporation and E g! results from
the fact that solar energy supplies the latent
heat needed to change water from its liquid
to its gaseous state, and it has been shown
that reductions in evaporation, for example
those recorded in north-west Russia, can be
fully accounted for by those observed in E g!
(Roderick and Farquhar 2002). Comparable
results from China were reported for the
1954–93 period when the reduction in
potential evaporation, calculated byPenman’s equation to average 2.1% per
decade, was explained by global dimming
based on reductions of sunshine duration
measured at 60 climate stations (Thomas
2000).
The diurnal temperature range (DTR) is so
closely linked with E g! that it is often used as
a proxy measure for calculating global radi-
ation (Bristow and Campbell 1984; Thornton
and Running 1999). The physical basis for
this linkage is that part of the solar energy
absorbed at the earth’s surface is convected
into the lower atmosphere where it raises
the daytime maximum temperature abovethe night-time minimum. A second factor
which controls DTR is the degree of surface
wetness which determines the partitioning
of solar heating between convective andlatent heat fluxes; DTR is greatest at non-
evaporating desert sites and least at mid-
ocean island sites. This effect of surface
wetness has been allowed for by including a
rainfall term in the equations used to cal-
culate E g! from DTR.
A striking example of a wide-scale, man-
induced change in DTR was provided by the
11 September terrorist attacks in New York
and Washington when commercial air traffic
in the USA was grounded for three days.
During this period DTR was 1.8 degC above
the climatological normal, almost certainly
as a result in the observed reduction in con-
trail-induced cirrus cloud cover which
presumably led to an increase in E g! (Travis
et al. 2002). Another man-made climate
change experiment occurs each year in
Israel on the Day of Atonement when road
traffic ceases. Measurements between 1965
and 2003 at the Israel Meteorological
Services Observatory at Bet Dagan, close to
two major traffic interchanges, show that
DTR increased by an average of 0.3 degC
while E g! increased by an average of
9.72Wm–2
as compared with the values
measured seven days before and after thefast day.
An analysis of trends in the global maxi-
mum and minimum air temperatures shows
that the earth’s DTR fell by 0.84 degC duringthe twentieth century (Easterling et al.
1997). Using this figure with Bristow and
Campbell’s (1984) relationship for a moist
surface yields a global dimming of
13.6Wm–2
for this same period.
A third indirect measure of global dim-
ming is the decline in visibility that has
taken place during the last century. Visibility,
quantified as visual range – the horizontal
distance at which an observer can clearly
discern an object against a contrasting
background – was one of the first climatol-
ogical parameters to be observed. An
example of its reduction is available from an
analysis of the observations made at Lod
Airport in the central coastal plain of Israel
between 1940 and 1970; during this period
visual range during the summer months
decreased by an average of 0.8 km per year
(Manes et al . 1974). Currently, visibility is
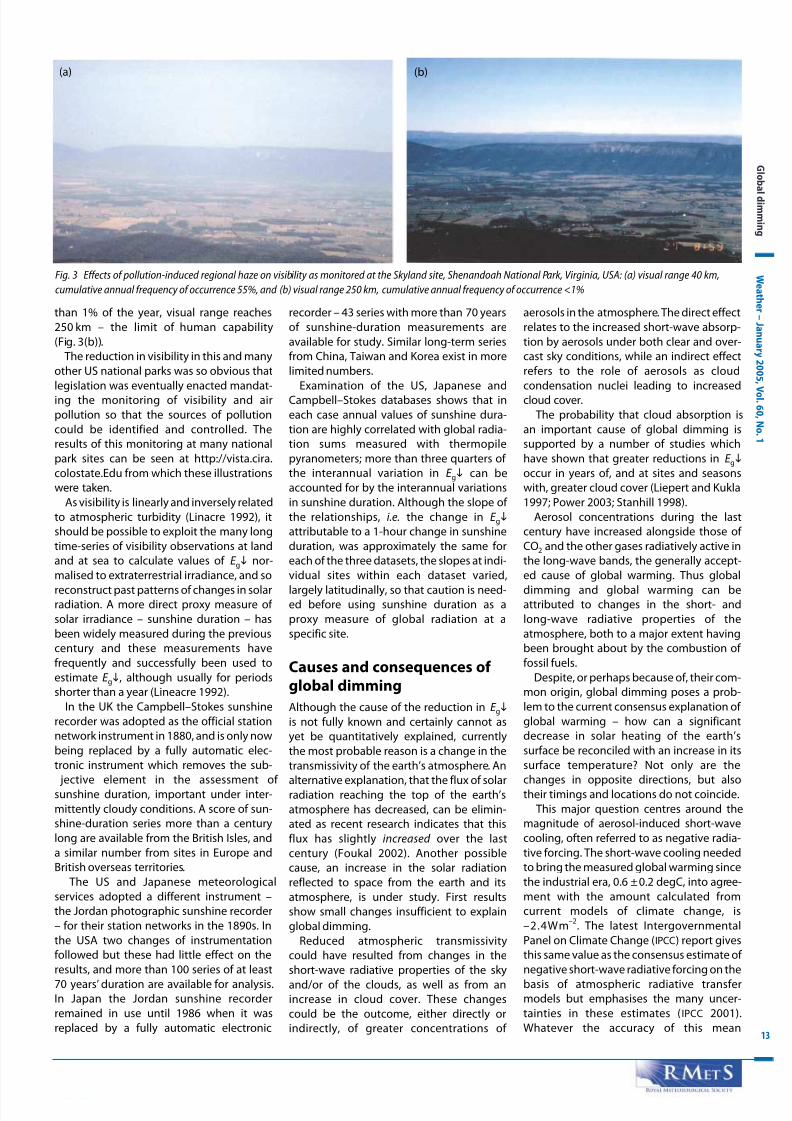
often measured instrumentally and Fig. 3
presents an example of such automatically
observed and analysed measurements used
to monitor the effects of air pollution on
visibility at the Shenandoah Blue Ridge
National Park in Virginia, USA. At this site,
once famous for its magnificent views, theannual visual range now averages 40 km
(Fig. 3(a)); whereas under completely clean
air conditions, now occurring during less
W e a t h e r – J a n u a r y 2 0 0 5 ,
V o l . 6 0 ,
N o .
1
12
G l o b a l d i m m i n g
Table 1
Means and trends in annual values of global irradiance in the British Isles ( P is probability)
Site Coordinates Period Mean and standard Trend Significance
deviation (Wm–2
) (W m–2
year–1
)
Lerwick 60.08°N, 1.11°W 1952–2002 89.2 5.07 –0.026 n.s.
Eskdalemuir 55.19°N, 3.12°W 1956–2002 94.1 5.26 –0.058 n.s.
Aldergrove 54.39°N, 6.13°W 1969–2001 103.0 4.40 –0.059 n.s.
Birr 53.05°N, 7.54°W 1971–2002 107.5 6.15 –0.330 P <0.01
Kilkenny 52.40°N, 7.16°W 1969–2002 112.3 7.73 –0.459 P <0.01
Valentia 51.56°N, 10.15°W 1955–2002 115.7 8.02 –0.412 P <0.01
Aberporth 52.08°N, 4.34°W 1959–2002 120.1 5.23 –0.125 P <0.05
Rothamsted 51.48°N, 0.21°W 1958–2000 106.5 7.61 +0.405 P <0.05
East Malling 51.17°N, 0.27°E 1964–2002 113.0 5.83 +0.267 P <0.01
Jersey 49.11°N, 2.11°W 1969–2003 134.0 6.49 +0.078 n.s.
Fig. 2 World map of pyranometer stations
8/6/2019 Global Dimming - The Evidence for It!
http://slidepdf.com/reader/full/global-dimming-the-evidence-for-it 3/4
W e a t h er – J an u ar y 2 0 0 5 ,
V ol . 6 0 ,N o .1
13
than 1% of the year, visual range reaches
250 km – the limit of human capability
(Fig. 3(b)).
The reduction in visibility in this and many
other US national parks was so obvious that
legislation was eventually enacted mandat-
ing the monitoring of visibility and air
pollution so that the sources of pollution
could be identified and controlled. The
results of this monitoring at many national
park sites can be seen at http://vista.cira.
colostate.Edu from which these illustrations
were taken.
As visibility is linearly and inversely related
to atmospheric turbidity (Linacre 1992), it
should be possible to exploit the many long
time-series of visibility observations at land
and at sea to calculate values of E g! nor-
malised to extraterrestrial irradiance, and so
reconstruct past patterns of changes in solarradiation. A more direct proxy measure of
solar irradiance – sunshine duration – has
been widely measured during the previous
century and these measurements have
frequently and successfully been used to
estimate E g!, although usually for periods
shorter than a year (Lineacre 1992).
In the UK the Campbell–Stokes sunshine
recorder was adopted as the official station
network instrument in 1880, and is only now
being replaced by a fully automatic elec-
tronic instrument which removes the sub-
jective element in the assessment of sunshine duration, important under inter-
mittently cloudy conditions. A score of sun-
shine-duration series more than a century
long are available from the British Isles, and
a similar number from sites in Europe and
British overseas territories.
The US and Japanese meteorological
services adopted a different instrument –
the Jordan photographic sunshine recorder
– for their station networks in the 1890s. In
the USA two changes of instrumentation
followed but these had little effect on the
results, and more than 100 series of at least
70 years’ duration are available for analysis.In Japan the Jordan sunshine recorder
remained in use until 1986 when it was
replaced by a fully automatic electronic
recorder – 43 series with more than 70 years
of sunshine-duration measurements are
available for study. Similar long-term series
from China, Taiwan and Korea exist in more
limited numbers.
Examination of the US, Japanese and
Campbell–Stokes databases shows that in
each case annual values of sunshine dura-
tion are highly correlated with global radia-
tion sums measured with thermopile
pyranometers; more than three quarters of
the interannual variation in E g! can be
accounted for by the interannual variations
in sunshine duration. Although the slope of
the relationships, i.e. the change in E g!
attributable to a 1-hour change in sunshine
duration, was approximately the same for
each of the three datasets, the slopes at indi-
vidual sites within each dataset varied,
largely latitudinally, so that caution is need-ed before using sunshine duration as a
proxy measure of global radiation at a
specific site.
Causes and consequences of global dimming
Although the cause of the reduction in E g!
is not fully known and certainly cannot as
yet be quantitatively explained, currently
the most probable reason is a change in the
transmissivity of the earth’s atmosphere. An
alternative explanation, that the flux of solarradiation reaching the top of the earth’s
atmosphere has decreased, can be elimin-
ated as recent research indicates that this
flux has slightly increased over the last
century (Foukal 2002). Another possible
cause, an increase in the solar radiation
reflected to space from the earth and its
atmosphere, is under study. First results
show small changes insufficient to explain
global dimming.
Reduced atmospheric transmissivity
could have resulted from changes in the
short-wave radiative properties of the sky
and/or of the clouds, as well as from anincrease in cloud cover. These changes
could be the outcome, either directly or
indirectly, of greater concentrations of
aerosols in the atmosphere. The direct effect
relates to the increased short-wave absorp-
tion by aerosols under both clear and over-
cast sky conditions, while an indirect effect
refers to the role of aerosols as cloud
condensation nuclei leading to increased
cloud cover.
The probability that cloud absorption is
an important cause of global dimming is
supported by a number of studies which
have shown that greater reductions in E g!
occur in years of, and at sites and seasons
with, greater cloud cover (Liepert and Kukla
1997; Power 2003; Stanhill 1998).
Aerosol concentrations during the last
century have increased alongside those of
CO2 and the other gases radiatively active in
the long-wave bands, the generally accept-
ed cause of global warming. Thus global
dimming and global warming can beattributed to changes in the short- and
long-wave radiative properties of the
atmosphere, both to a major extent having
been brought about by the combustion of
fossil fuels.
Despite, or perhaps because of, their com-
mon origin, global dimming poses a prob-
lem to the current consensus explanation of
global warming – how can a significant
decrease in solar heating of the earth’s
surface be reconciled with an increase in its
surface temperature? Not only are the
changes in opposite directions, but alsotheir timings and locations do not coincide.
This major question centres around the
magnitude of aerosol-induced short-wave
cooling, often referred to as negative radia-
tive forcing. The short-wave cooling needed
to bring the measured global warming since
the industrial era, 0.6 ±0.2 degC, into agree-
ment with the amount calculated from
current models of climate change, is
–2.4Wm–2
. The latest Intergovernmental
Panel on Climate Change (IPCC) report gives
this same value as the consensus estimate of
negative short-wave radiative forcing on the
basis of atmospheric radiative transfermodels but emphasises the many uncer-
tainties in these estimates (IPCC 2001).
Whatever the accuracy of this mean
G l o b al d i mmi n g
Fig. 3 Effects of pollution-induced regional haze on visibility as monitored at the Skyland site, Shenandoah National Park, Virginia, USA: (a) visual range 40 km,
cumulative annual frequency of occurrence 55%, and (b) visual range 250 km, cumulative annual frequency of occurrence <1%
(a) (b)
8/6/2019 Global Dimming - The Evidence for It!
http://slidepdf.com/reader/full/global-dimming-the-evidence-for-it 4/4
estimate of negative short-wave radiative
forcing it is only one tenth of the measured
global decrease in E g! between 1958 and
1992, ~20Wm–2
, reported in this study
(Stanhill and Cohen 2001).
The practical consequences of global dim-
ming of the magnitudes documented are
likely to be very widespread as it is solar
energy that drives the earth’s life-sustaining
air, water and carbon cycles. The clearestand easiest way to demonstrate the effect of
global dimming, that on the hydrological
cycle, has already been noted – the reduc-
tion of evaporation from water and land sur-
faces with a non-limiting water supply, i.e.
under potential evaporation conditions.
Further consequences for the hydrolog-
ical cycle could follow any changes in
atmospheric circulation resulting from dif-
ferent patterns of solar heating at the earth’s
surface; changes in circulation patterns
would affect precipitation as well as evapo-
ration. Changes in atmospheric circulationare of course a major cause as well as a con-
sequence of local climate change with all
the practical implications that this involves.
The effects of global dimming on the
carbon cycle could also be widespread.
Lower intensities of solar radiation in the
photosynthetically active wavebands can be
expected to have an adverse effect on
carbon assimilation by plant communities,
and hence agricultural and forestry produc-
tion. However, where and when water and
not light is the factor limiting plant growth
the opposite situation could arise, and plant
production could be unaffected or evenenhanced by global dimming in cases
where this leads to a reduction in plant
water stress. Other practical consequences
of global dimming include the reduction in
the economic potential of solar energy to
serve as an alternative, non-polluting and
renewable source of energy as well as the
adverse effects on visibility illustrated in
Fig. 3.
The future of global dimming
The theoretical and practical significance of the changes in solar irradiance at the earth’s
surface briefly outlined are such as to justify
further studies to answer the question,
“Where has all the sunshine gone?”.
Hopefully, such studies will eventually lead
to a quantitative understanding of global
dimming which would allow it to be incor-
porated into current models of climate
change and reconciled with global warm-
ing. Another important goal is to prepare an
extensive, long-term database of E g! to
verify model predictions and estimate the
consequences of the changes in solar
radiation.A verified and theoretically based explan-
ation of global dimming is needed to estab-
lish that the restrictions to fossil-fuel
combustion proposed in the Kyoto Protocol
on Climate Change are indeed essential.
Substantiation of the currently most
plausible explanation of global dimming –
enhanced cloud absorption of solar
radiation due to the indirect aerosol effect –
would provide a strong additional argument
for reducing the use of fossil fuels. As these
represent the non-renewable photosyn-
thetic harvest of solar energy from the
distant past, their conservation could,perhaps ironically, help to restore solar
radiation to its former levels.
Acknowledgements
I wish to thank the many colleagues, in
particular S. Moreshet and S. Cohen, who
have contributed to much of the work
described, as well as Kath Phelps of Hort
Research International, Tony Pallot of
JerseyMet and Dave Yeoman of IACR,
Rothamsted, who respectively supplied the
data for East Malling, Jersey, andRothamsted presented in Table 1.
ReferencesAbakumova, G. M., Feigelson, E. M.,Bussak, V. and Stadnik, V. V. (1996)Evaluation of long term changes in radia-tion, cloudiness and surface temperatureon the territory of the former SovietUnion. J. Clim., 9, pp. 1319–1327
Bristow, K. L. and Campbell, G. S. (1984)On the relationship between incomingsolar radiation and daily maximum andminimum temperature. Agric. For.Meteorol., 31, pp. 159–166
Chattopadhyay, N. and Hulme, M. (1997)Evaporation and potential evapotranspira-tion in India under conditions of recentand future climate change. Agric. For.Meteorol., 87, pp. 55–73
Easterling, D. R., Horton, B., Jones, P. D.,Peterson, T. C., Karl, T. R., Parker, D. R.,Salinger, M. J., Razuvayev, V., Plummer,N., Jameson, P. and Folland, C. K. (1997)Maximum and minimum temperaturetrends for the globe. Science, 277,pp. 364–367
Foukal, P. (2002) A comparison of variablesolar and ultraviolet irradiances in the
20th century. Geophys. Res. Lett., 29,doi: 10.1029/2002GLO15474
Gilgen, H., Wild, M. and Ohmura, A.(1998) Means and trends of short waveirradiance at the surface estimated fromglobal energy balance archive data. J.Clim., 11, pp. 2042–2061
IPCC (2001) Climate change 2001: Thescientific basis. Cambridge University Press,Cambridge
Liepert, B. G. and Kukla, G. J. (1997)Decline in global solar radiation withincreased horizontal visibility in Germanybetween 1964 and 1990. J. Clim., 10,pp. 2391–2401
Liepert, B. G. and Tegen, I. (2002)Multidecadal solar radiation trends in theUnited States and Germany and directtropospheric forcing. J. Geophys. Res., 107,D12,10.1029/2001JD00760
Linacre, E. (1992) Climate data and resources. Routledge, London
Manes, A., Rindsberger, M., Guetta, D.and Teitelman, A. (1974) Long termtrends in visibility at the Ben Gurion (Lod)airport area. Isr. J. Earth Sci., 23, pp. 1–7
Peterson, T. C., Golubev, V. S. andGroisman, P. Y. (1995) Evaporation losingits strength. Nature, 377, pp. 687–688
Power, H. C. (2003) Trends in solar radia-
tion over Germany and an assessment of the role of aerosols and sunshine dura-tion. Theor. Appl. Climatol., 76, pp. 47–63
Roderick, M. L. and Farquhar, G. D.(2002) The cause of decreased panevaporation over the past 50 years.Science, 298, pp. 1410–1411
—— (2004) Changes in Australian panevaporation from 1970 to 2002. Int. J.Climatol., 24, pp. 1077–1090
Stanhill, G. (1995) Global irradiance, airpollution and temperature changes in theArctic. Phil. Trans. R. Soc., A, 352,pp. 247–258
—— (1998) Long term trends in, and
spatial variation of, solar irradiances inIreland. Int. J. Climatol., 18, pp. 1015–1030
Stanhill, G. and Cohen, S. (2001) Globaldimming: a review of the evidence for awidespread and significant reduction inglobal radiation with discussion on itsprobable causes and possible agriculturalconsequences. Agric. For. Meteorol., 107,pp. 255–278
Stanhill, G. and Kalma, J. D. (1994)Secular variation of global irradiance inAustralia. Aust. Meteorol. Mag., 43,pp. 81–86
Stanhill, G. and Moreshet, S. (1992)Global radiation climate change: theworld network. Clim. Change, 21,
pp. 57–75
Thomas, A. (2000) Spatial and temporalcharacteristics of potential evapotrans-piration trends over China. Int. J. Climatol.,20, pp. 381–396
Thornton, P. E. and Running, S. W. (1999)An improved algorithm for estimatingincident solar radiation from measure-ments of temperature, humidity andprecipitation. Agric. For. Meteorol ., 93,pp. 211–228
Travis, D. J., Carleton, A. M. andLauristen, R. (2002) Jet contrails andclimate: anomalous increases in U.S.diurnal temperature range for September
11–14, 2001. Nature, 418, p. 601WMO (1997) Measurement of radiation. In:Guide to meteorological instruments and methods of observation, 6th edition. WorldMeteorological Organization, Geneva,p. 7-9
Correspondence to: G. Stanhill, Institute of
Soil, Water and Environmental Sciences,
Volcani Center, POB 6, Bet Dagan, Israel
50250.
e-mail: [email protected]
© Royal Meteorological Society, 2005.
doi: 10.1256/wea.210.03
W e a t h e r – J a n u a r y 2 0 0 5 ,
V o l . 6 0 ,
N o .
1
14
G l o b a l d i m m i n g


![Global dimming and brightening: A review€¦ · Received 14 November 2008; revised 6 March 2009; accepted 10 March 2009; published 27 June 2009. [1] There is increasing evidence](https://img.pdfslide.us/doc/110x75/5fc16bf4e98a170d943afb00/global-dimming-and-brightening-a-review-received-14-november-2008-revised-6-march.jpg)