Embed Size (px)
Citation preview
Marine Pollution Bulletin 75 (2013) 182–186
Contents lists available at ScienceDirect
Marine Pollution Bulletin
journal homepage: www.elsevier .com/locate /marpolbul
Global deposition of airborne dioxin
0025-326X/$ - see front matter � 2013 Elsevier Ltd. All rights reserved.http://dx.doi.org/10.1016/j.marpolbul.2013.07.041
⇑ Corresponding author. Tel.: +1 604 707 0957; fax: +1 604 822 8934.E-mail addresses: [email protected] (S. Booth), [email protected]
(J. Hui), [email protected] (Z. Alojado), [email protected] (V. Lam),[email protected] (W. Cheung), [email protected] (D. Zeller),[email protected] (D. Steyn), [email protected] (D. Pauly).
Shawn Booth a,⇑, Joe Hui a, Zoraida Alojado a, Vicky Lam a, William Cheung a,Dirk Zeller a, Douw Steyn b, Daniel Pauly a
a Sea Around Us Project, Fisheries Centre, University of British Columbia, 2202 Main Mall, Vancouver BC V6T-1Z4, Canadab UBC Department of Earth and Ocean Sciences, 6339 Stores Road, Vancouver BC V6Y-1Z4, Canada
a r t i c l e i n f o
Keywords:Dioxins (PCDD/Fs)Global impactMass balance modelToxic equivalents (TEQs)Kuznets curve
a b s t r a c t
We present a global dioxin model that simulates one year of atmospheric emissions, transport processes,and depositions to the earth’s terrestrial and marine habitats. We map starting emission levels for eachland area, and we also map the resulting deposits to terrestrial and marine environments. This modelconfirms that ‘hot spots’ of deposition are likely to be in northern Europe, eastern North America, andin parts of Asia with the highest marine dioxin depositions being the northeast and northwest Atlantic,western Pacific, northern Indian Ocean and the Mediterranean. It also reveals that approximately 40% ofairborne dioxin emissions are deposited to marine environments and that many countries in Africareceive more dioxin than they produce, which results in these countries being disproportionatelyimpacted. Since human exposure to dioxin is largely through diet, this work highlights food producingareas that receive higher atmospheric deposits of dioxin than others.
� 2013 Elsevier Ltd. All rights reserved.
1. Introduction
Dioxins and furans consist of 210 structurally similar chemicalsthat are unintentional byproducts of combustion processes. Ofthese 210 chemicals, 17 have toxicological properties of concernto human and ecosystem health. The most potent form, 2,3,7,8-tet-rachlorodibenzo-p-dioxin, is a known human carcinogen (Interna-tional Agency for Research on Cancer, 1997) and the main exposureroute to humans and other organisms is through diet (WorldHealth Organization, 2007). Dioxins are one of the chemicals listedin the Stockholm Convention on Persistent Organic Pollutants.They are listed under Annex C, and, as such, parties must take mea-sures to reduce the unintentional releases with the goal of contin-uing minimization and, where feasible, ultimate elimination(Olsen, 2003).
When dioxins are emitted to the atmosphere or land, they cansubsequently undergo long range atmospheric transport until theyare deposited to regions distant from the source (AMAP, 2004).This is due to the ‘grasshopper effect’ (Gouin et al., 2004) wherebydioxin previously deposited to land surfaces can undergo furthertransport through successive evaporation cycles. Dioxin has endo-crine-disrupting effects and interacts with the components of eco-systems – it is lipophilic and concentrates in lipid tissues of living
organisms causing health concerns for ecosystem components andpeople.
For toxicological purposes, dioxins can be expressed as toxicequivalents (TEQs) as the 17 forms of dioxins and furans of concernhave different toxicological properties. TEQs express the toxicity ofdioxins relative to the most toxic form – 2,3,7,8-tetrachlo-rodibenzo-p-dioxin. For human health purposes, dioxins have atolerable daily intake (TDI) of 1–4 picograms-TEQ per kilogrambody weight and day, but the United Nations has recommendedthat the intake of dioxin should be reduced to the lowest possiblelevel because subtle effects can occur at levels of 2–6 picograms-TEQ per kilogram body weight and day (van Leeuwen et al., 2000).
Despite its known toxicity and adverse human health effects,there is little data concerning the global impacts of dioxin. Globalemission inventories of dioxin production are incomplete and mostinventories are available only for the year 1999 (United Nations,1999). The importance of this study is that it (1) identifies on a glo-bal basis where the most heavily impacted terrestrial and marineecosystems are likely to be, (2) helps to identify key regions wheredata are missing that could be of concern, and (3) highlights foodproduction areas that receive higher inputs of dioxin than others.The purpose is to lay the foundation for further research into theeffects of dioxin in marine waters and the food webs in marineecosystems.
2. Methods
The cycling of dioxin in our global model involves theproduction of dioxin over land, the dispersion of dioxin through
S. Booth et al. / Marine Pollution Bulletin 75 (2013) 182–186 183
the atmosphere, the deposition of dioxin onto land and water, andthe transportation of dioxin from land in water basins to coastalwaters. For methodological details, see the Supplementary mate-rial. We use weekly averaged data for dioxin production and atmo-spheric dispersion. We simulate one year of production, dispersion,deposition and transport of dioxin (Fig. 1) and display the resultsfor land and marine areas separately on a global map with a reso-lution of 259,200 ½� by ½� cells (79,296 terrestrial, and 179,904marine). Since some countries are more heavily impacted by dioxinthan others, we compare between countries by using a depositionto emission ratio. For each country, the amount of dioxin depositedto land and ocean cells over the one year simulation was comparedto the annual amount of emissions.
A previous global model of dioxin noted that depositions weregreater than emissions likely due to the photochemical transfor-mation of pentachlorophenol, a common wood preservative, to di-oxin (Baker and Hites, 2000). Thus, global emissions wereapproximately 12.5 times lower than the estimated total depositsof 13,100 kg, and only 5% of emissions were assumed to be depos-ited to oceans (Brzuzy and Hites, 1996). However, in a preliminaryrun of our model (that used monthly averaged wind fields), oceandepositions were shown to be significantly larger than previouslythought with estimated dioxin deposits to oceans being approxi-mately 38% of the total annual emissions. Therefore, we increasedthe global total of dioxin production to 17,226 kg. We refined theinitial monthly model by using weekly averaged wind fields, andwe assumed 1/52 of the annual global dioxin production was emit-ted each week from land to the atmosphere and used a factor of 60to convert the production of dioxin to toxic equivalents (TEQs) ofthe most toxic congener 2,3,7,8-tetrachlorodibenzo-p-dioxin (Tho-mas and Spiro, 1995).
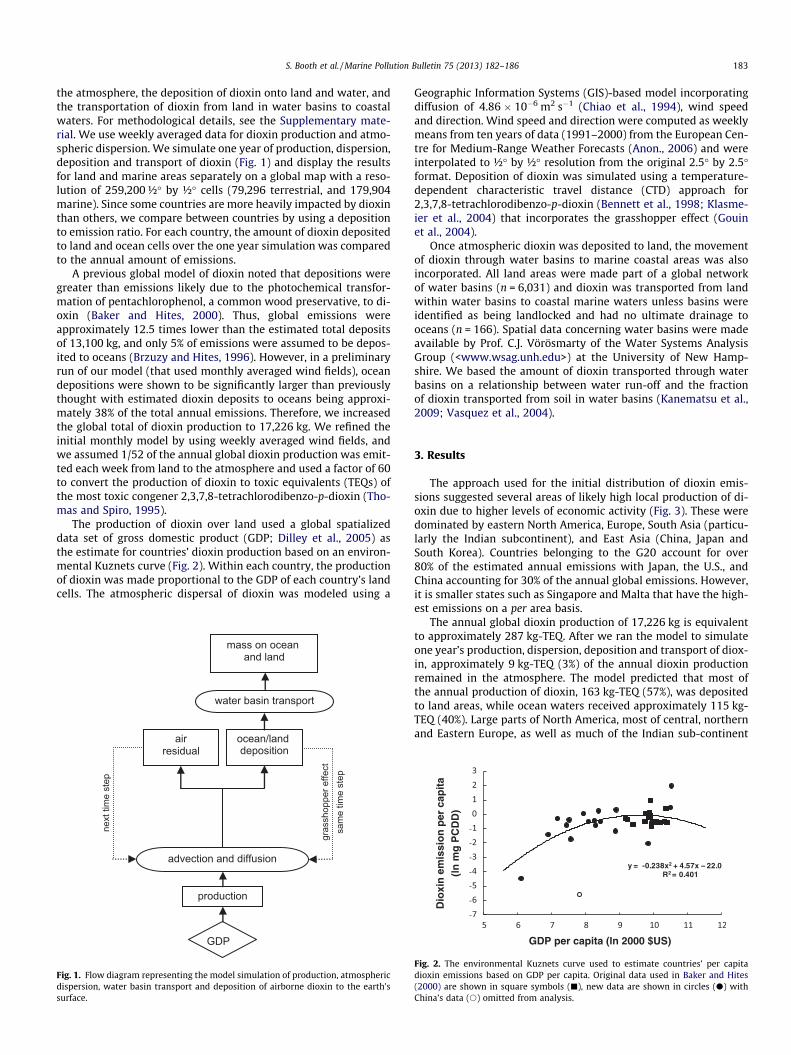
The production of dioxin over land used a global spatializeddata set of gross domestic product (GDP; Dilley et al., 2005) asthe estimate for countries’ dioxin production based on an environ-mental Kuznets curve (Fig. 2). Within each country, the productionof dioxin was made proportional to the GDP of each country’s landcells. The atmospheric dispersal of dioxin was modeled using a
gras
shop
per e
ffect
mass on ocean and land
water basin transport
airresidual
ocean/land deposition
sam
e tim
e st
ep
advection and diffusion
production
GDP
next
tim
e st
ep
Fig. 1. Flow diagram representing the model simulation of production, atmosphericdispersion, water basin transport and deposition of airborne dioxin to the earth’ssurface.
Geographic Information Systems (GIS)-based model incorporatingdiffusion of 4.86 � 10�6 m2 s�1 (Chiao et al., 1994), wind speedand direction. Wind speed and direction were computed as weeklymeans from ten years of data (1991–2000) from the European Cen-tre for Medium-Range Weather Forecasts (Anon., 2006) and wereinterpolated to ½� by ½� resolution from the original 2.5� by 2.5�format. Deposition of dioxin was simulated using a temperature-dependent characteristic travel distance (CTD) approach for2,3,7,8-tetrachlorodibenzo-p-dioxin (Bennett et al., 1998; Klasme-ier et al., 2004) that incorporates the grasshopper effect (Gouinet al., 2004).
Once atmospheric dioxin was deposited to land, the movementof dioxin through water basins to marine coastal areas was alsoincorporated. All land areas were made part of a global networkof water basins (n = 6,031) and dioxin was transported from landwithin water basins to coastal marine waters unless basins wereidentified as being landlocked and had no ultimate drainage tooceans (n = 166). Spatial data concerning water basins were madeavailable by Prof. C.J. Vörösmarty of the Water Systems AnalysisGroup (<www.wsag.unh.edu>) at the University of New Hamp-shire. We based the amount of dioxin transported through waterbasins on a relationship between water run-off and the fractionof dioxin transported from soil in water basins (Kanematsu et al.,2009; Vasquez et al., 2004).
3. Results
The approach used for the initial distribution of dioxin emis-sions suggested several areas of likely high local production of di-oxin due to higher levels of economic activity (Fig. 3). These weredominated by eastern North America, Europe, South Asia (particu-larly the Indian subcontinent), and East Asia (China, Japan andSouth Korea). Countries belonging to the G20 account for over80% of the estimated annual emissions with Japan, the U.S., andChina accounting for 30% of the annual global emissions. However,it is smaller states such as Singapore and Malta that have the high-est emissions on a per area basis.
The annual global dioxin production of 17,226 kg is equivalentto approximately 287 kg-TEQ. After we ran the model to simulateone year’s production, dispersion, deposition and transport of diox-in, approximately 9 kg-TEQ (3%) of the annual dioxin productionremained in the atmosphere. The model predicted that most ofthe annual production of dioxin, 163 kg-TEQ (57%), was depositedto land areas, while ocean waters received approximately 115 kg-TEQ (40%). Large parts of North America, most of central, northernand Eastern Europe, as well as much of the Indian sub-continent
Fig. 2. The environmental Kuznets curve used to estimate countries’ per capitadioxin emissions based on GDP per capita. Original data used in Baker and Hites(2000) are shown in square symbols (j), new data are shown in circles (d) withChina’s data (s) omitted from analysis.
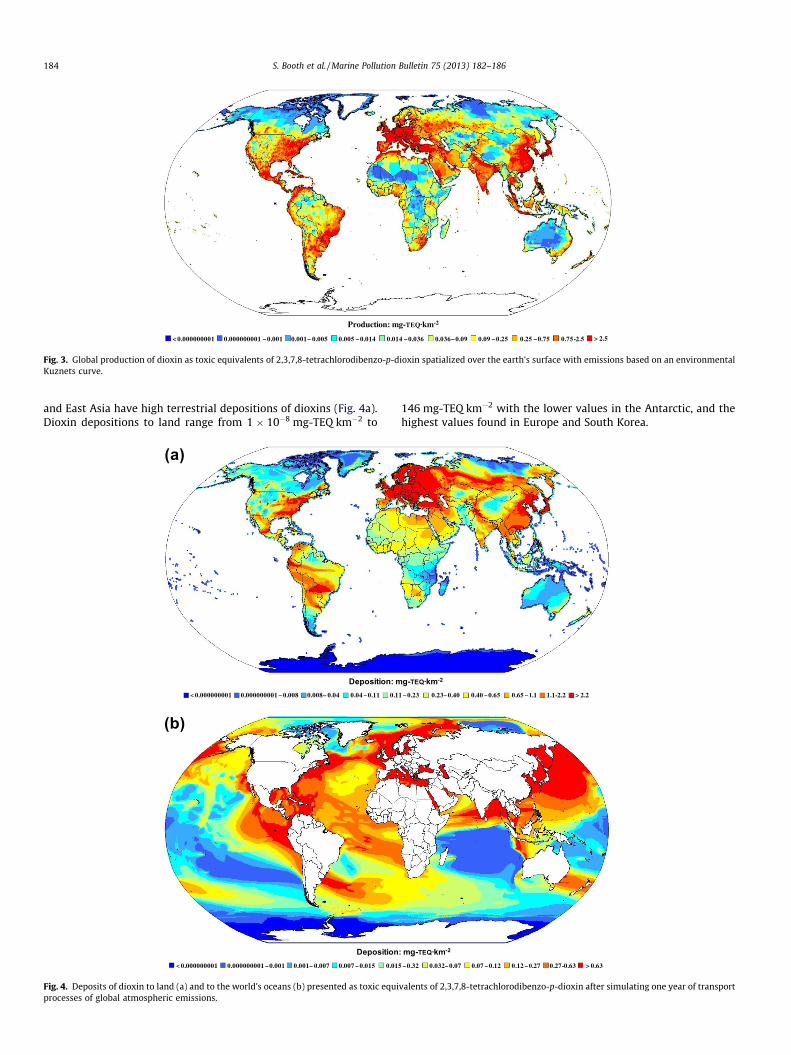
< 0.000000001 0.000000001 – 0.001 0.001– 0.005 0.014 – 0.0360.005 – 0.014 0.036– 0.09 0.25 – 0.75 > 2.50.09 – 0.25 0.75-2.5
Production: mg-TEQ·km-2
Fig. 3. Global production of dioxin as toxic equivalents of 2,3,7,8-tetrachlorodibenzo-p-dioxin spatialized over the earth’s surface with emissions based on an environmentalKuznets curve.
184 S. Booth et al. / Marine Pollution Bulletin 75 (2013) 182–186
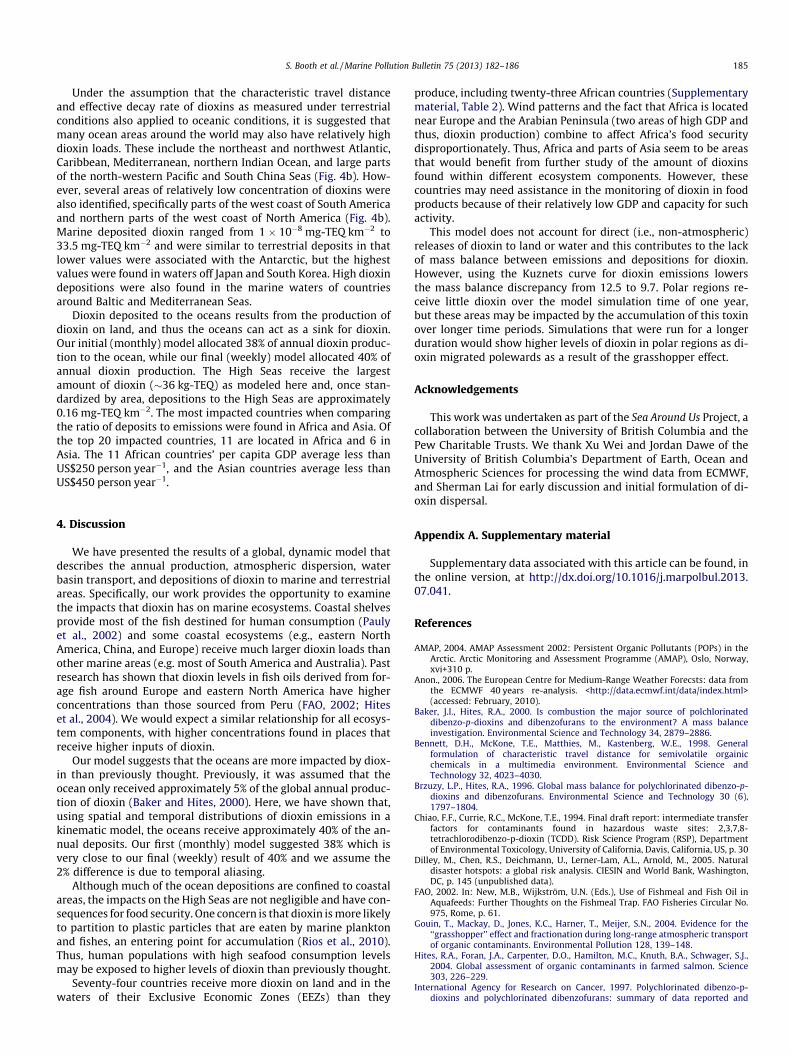
and East Asia have high terrestrial depositions of dioxins (Fig. 4a).Dioxin depositions to land range from 1 � 10�8 mg-TEQ km�2 to
Deposition: m< 0.000000001 0.000000001 – 0.008 0.008– 0.04 0.10.04 – 0.11
Deposition< 0.000000001 0.000000001 – 0.001 0.001– 0.007 0.010.007 – 0.015
(a)
(b)
Fig. 4. Deposits of dioxin to land (a) and to the world’s oceans (b) presented as toxic equiprocesses of global atmospheric emissions.
146 mg-TEQ km�2 with the lower values in the Antarctic, and thehighest values found in Europe and South Korea.
g-TEQ·km-2
1 – 0.23 0.23– 0.40 0.65 – 1.1 > 2.20.40 – 0.65 1.1-2.2
: mg-TEQ·km-2
5 – 0.32 0.032– 0.07 0.12 – 0.27 > 0.630.07 – 0.12 0.27-0.63
valents of 2,3,7,8-tetrachlorodibenzo-p-dioxin after simulating one year of transport
S. Booth et al. / Marine Pollution Bulletin 75 (2013) 182–186 185
Under the assumption that the characteristic travel distanceand effective decay rate of dioxins as measured under terrestrialconditions also applied to oceanic conditions, it is suggested thatmany ocean areas around the world may also have relatively highdioxin loads. These include the northeast and northwest Atlantic,Caribbean, Mediterranean, northern Indian Ocean, and large partsof the north-western Pacific and South China Seas (Fig. 4b). How-ever, several areas of relatively low concentration of dioxins werealso identified, specifically parts of the west coast of South Americaand northern parts of the west coast of North America (Fig. 4b).Marine deposited dioxin ranged from 1 � 10�8 mg-TEQ km�2 to33.5 mg-TEQ km�2 and were similar to terrestrial deposits in thatlower values were associated with the Antarctic, but the highestvalues were found in waters off Japan and South Korea. High dioxindepositions were also found in the marine waters of countriesaround Baltic and Mediterranean Seas.
Dioxin deposited to the oceans results from the production ofdioxin on land, and thus the oceans can act as a sink for dioxin.Our initial (monthly) model allocated 38% of annual dioxin produc-tion to the ocean, while our final (weekly) model allocated 40% ofannual dioxin production. The High Seas receive the largestamount of dioxin (�36 kg-TEQ) as modeled here and, once stan-dardized by area, depositions to the High Seas are approximately0.16 mg-TEQ km�2. The most impacted countries when comparingthe ratio of deposits to emissions were found in Africa and Asia. Ofthe top 20 impacted countries, 11 are located in Africa and 6 inAsia. The 11 African countries’ per capita GDP average less thanUS$250 person year�1, and the Asian countries average less thanUS$450 person year�1.
4. Discussion
We have presented the results of a global, dynamic model thatdescribes the annual production, atmospheric dispersion, waterbasin transport, and depositions of dioxin to marine and terrestrialareas. Specifically, our work provides the opportunity to examinethe impacts that dioxin has on marine ecosystems. Coastal shelvesprovide most of the fish destined for human consumption (Paulyet al., 2002) and some coastal ecosystems (e.g., eastern NorthAmerica, China, and Europe) receive much larger dioxin loads thanother marine areas (e.g. most of South America and Australia). Pastresearch has shown that dioxin levels in fish oils derived from for-age fish around Europe and eastern North America have higherconcentrations than those sourced from Peru (FAO, 2002; Hiteset al., 2004). We would expect a similar relationship for all ecosys-tem components, with higher concentrations found in places thatreceive higher inputs of dioxin.
Our model suggests that the oceans are more impacted by diox-in than previously thought. Previously, it was assumed that theocean only received approximately 5% of the global annual produc-tion of dioxin (Baker and Hites, 2000). Here, we have shown that,using spatial and temporal distributions of dioxin emissions in akinematic model, the oceans receive approximately 40% of the an-nual deposits. Our first (monthly) model suggested 38% which isvery close to our final (weekly) result of 40% and we assume the2% difference is due to temporal aliasing.
Although much of the ocean depositions are confined to coastalareas, the impacts on the High Seas are not negligible and have con-sequences for food security. One concern is that dioxin is more likelyto partition to plastic particles that are eaten by marine planktonand fishes, an entering point for accumulation (Rios et al., 2010).Thus, human populations with high seafood consumption levelsmay be exposed to higher levels of dioxin than previously thought.
Seventy-four countries receive more dioxin on land and in thewaters of their Exclusive Economic Zones (EEZs) than they
produce, including twenty-three African countries (Supplementarymaterial, Table 2). Wind patterns and the fact that Africa is locatednear Europe and the Arabian Peninsula (two areas of high GDP andthus, dioxin production) combine to affect Africa’s food securitydisproportionately. Thus, Africa and parts of Asia seem to be areasthat would benefit from further study of the amount of dioxinsfound within different ecosystem components. However, thesecountries may need assistance in the monitoring of dioxin in foodproducts because of their relatively low GDP and capacity for suchactivity.
This model does not account for direct (i.e., non-atmospheric)releases of dioxin to land or water and this contributes to the lackof mass balance between emissions and depositions for dioxin.However, using the Kuznets curve for dioxin emissions lowersthe mass balance discrepancy from 12.5 to 9.7. Polar regions re-ceive little dioxin over the model simulation time of one year,but these areas may be impacted by the accumulation of this toxinover longer time periods. Simulations that were run for a longerduration would show higher levels of dioxin in polar regions as di-oxin migrated polewards as a result of the grasshopper effect.
Acknowledgements
This work was undertaken as part of the Sea Around Us Project, acollaboration between the University of British Columbia and thePew Charitable Trusts. We thank Xu Wei and Jordan Dawe of theUniversity of British Columbia’s Department of Earth, Ocean andAtmospheric Sciences for processing the wind data from ECMWF,and Sherman Lai for early discussion and initial formulation of di-oxin dispersal.
Appendix A. Supplementary material
Supplementary data associated with this article can be found, inthe online version, at http://dx.doi.org/10.1016/j.marpolbul.2013.07.041.
References
AMAP, 2004. AMAP Assessment 2002: Persistent Organic Pollutants (POPs) in theArctic. Arctic Monitoring and Assessment Programme (AMAP), Oslo, Norway,xvi+310 p.
Anon., 2006. The European Centre for Medium-Range Weather Forecsts: data fromthe ECMWF 40 years re-analysis. <http://data.ecmwf.int/data/index.html>(accessed: February, 2010).
Baker, J.I., Hites, R.A., 2000. Is combustion the major source of polchlorinateddibenzo-p-dioxins and dibenzofurans to the environment? A mass balanceinvestigation. Environmental Science and Technology 34, 2879–2886.
Bennett, D.H., McKone, T.E., Matthies, M., Kastenberg, W.E., 1998. Generalformulation of characteristic travel distance for semivolatile orgainicchemicals in a multimedia environment. Environmental Science andTechnology 32, 4023–4030.
Brzuzy, L.P., Hites, R.A., 1996. Global mass balance for polychlorinated dibenzo-p-dioxins and dibenzofurans. Environmental Science and Technology 30 (6),1797–1804.
Chiao, F.F., Currie, R.C., McKone, T.E., 1994. Final draft report: intermediate transferfactors for contaminants found in hazardous waste sites: 2,3,7,8-tetrachlorodibenzo-p-dioxin (TCDD). Risk Science Program (RSP), Departmentof Environmental Toxicology, University of California, Davis, California, US, p. 30
Dilley, M., Chen, R.S., Deichmann, U., Lerner-Lam, A.L., Arnold, M., 2005. Naturaldisaster hotspots: a global risk analysis. CIESIN and World Bank, Washington,DC, p. 145 (unpublished data).
FAO, 2002. In: New, M.B., Wijkström, U.N. (Eds.), Use of Fishmeal and Fish Oil inAquafeeds: Further Thoughts on the Fishmeal Trap. FAO Fisheries Circular No.975, Rome, p. 61.
Gouin, T., Mackay, D., Jones, K.C., Harner, T., Meijer, S.N., 2004. Evidence for the‘‘grasshopper’’ effect and fractionation during long-range atmospheric transportof organic contaminants. Environmental Pollution 128, 139–148.
Hites, R.A., Foran, J.A., Carpenter, D.O., Hamilton, M.C., Knuth, B.A., Schwager, S.J.,2004. Global assessment of organic contaminants in farmed salmon. Science303, 226–229.
International Agency for Research on Cancer, 1997. Polychlorinated dibenzo-p-dioxins and polychlorinated dibenzofurans: summary of data reported and
186 S. Booth et al. / Marine Pollution Bulletin 75 (2013) 182–186
evaluation. IARC Monographs on the Evaluation of Carcinogenic Risks toHumans 69, 33.
Kanematsu, M., Shimizu, Y., Sato, K., Kim, S., Suzuki, T., Park, B., Saino, R., Nakamura,M., 2009. Origins and transport of aquatic dioxins in the Japanese watershed:soil contamination, land use, and soil runoff events. Environmental Science andTechnology 43, 4260–4266.
Klasmeier, J., Beyer, A., Matthies, M., 2004. Screening for cold condensationpotential of organic chemicals. Organohalogen Compounds 66, 2406–2411.
Olsen, M.A., 2003. Analysis of The Stockholm Convention on Persistent OrganicPollutants. Oceana Publications, Inc., Dobbs Ferry, NY, xii +, p. 177.
Pauly, D., Christensen, V., Guénette, S., Pitcher, T.J., Sumaila, U.R., Walters, C.J.,Watson, R., Zeller, D., 2002. Towards sustainability in world fisheries. Nature418, 689–695.
Rios, L.M., Jones, P.R., Moore, C., Narayan, U.V., 2010. Quantitation of persistentorganic pollutants adsorbed on plastic debris from the North Pacific gyre’s‘‘eastern garbage patch’’. Journal of Environmental Monitoring 12, 2189–2312.
Thomas, V.M., Spiro, T.G., 1995. An estimation of dioxin emissions in the UnitedStates. Toxicological and Environmental Chemistry 50, 1–37.
United Nations, 1999. Dioxin and furan inventories: national and regional emissionsof PCDD/PCDF. United Nations Environment Programme Chemicals, Geneva,Switzerland, viii+, p. 102.
van Leeuwen, F.X., Feeley, M., Schrenk, D., Larsen, J.C., Farland, W., Younes, M., 2000.Dioxins: WHO’s tolerable daily intake (TDI) revisited. Chemosphere 40, 1095–1101.
Vasquez, A.P., Regens, J.L., Gunter, J.T., 2004. Environmental persistence of 2,3,7,8-tetrachlorodibenzo-p-dioxin in soil around Hardstand 7 at Egline air force base,Florida. Jounal of Soils and Sediments 4 (3), 151–156.
World Health Organization, 2007. Dioxins and Their Effects on Human Health.<http://www.who.int/mediacentre/factsheets/fs225/en/index.html> (accessed:Mach 2010).