Embed Size (px)
Citation preview
Global Cyberinfrastructur
e Inventory System
(GLOCIS)
GLOCIS•A web-accessible database of
cyberinfrastructure resources
•network circuits
•measurement infrastructure
•major scientific facilities/instrumentation
•computing facilities, etc.
•A GIS mapping system to assist in visualization of state of global resources
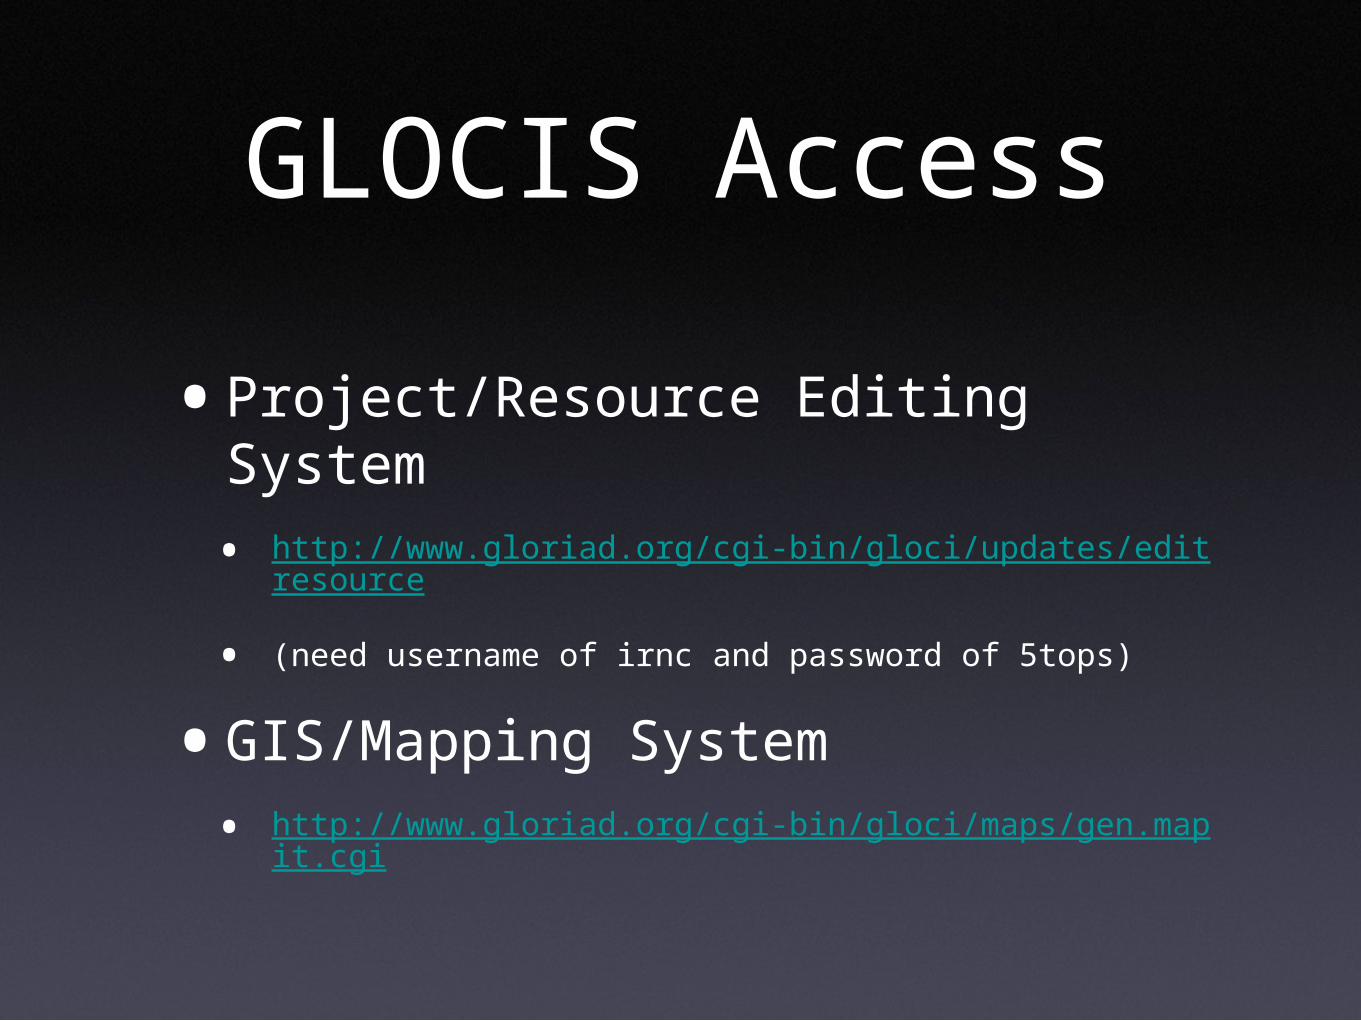
GLOCIS Access
•Project/Resource Editing System• http://www.gloriad.org/cgi-bin/gloci/updates/editresource
• (need username of irnc and password of 5tops)
•GIS/Mapping System• http://www.gloriad.org/cgi-bin/gloci/maps/gen.mapit.cgi
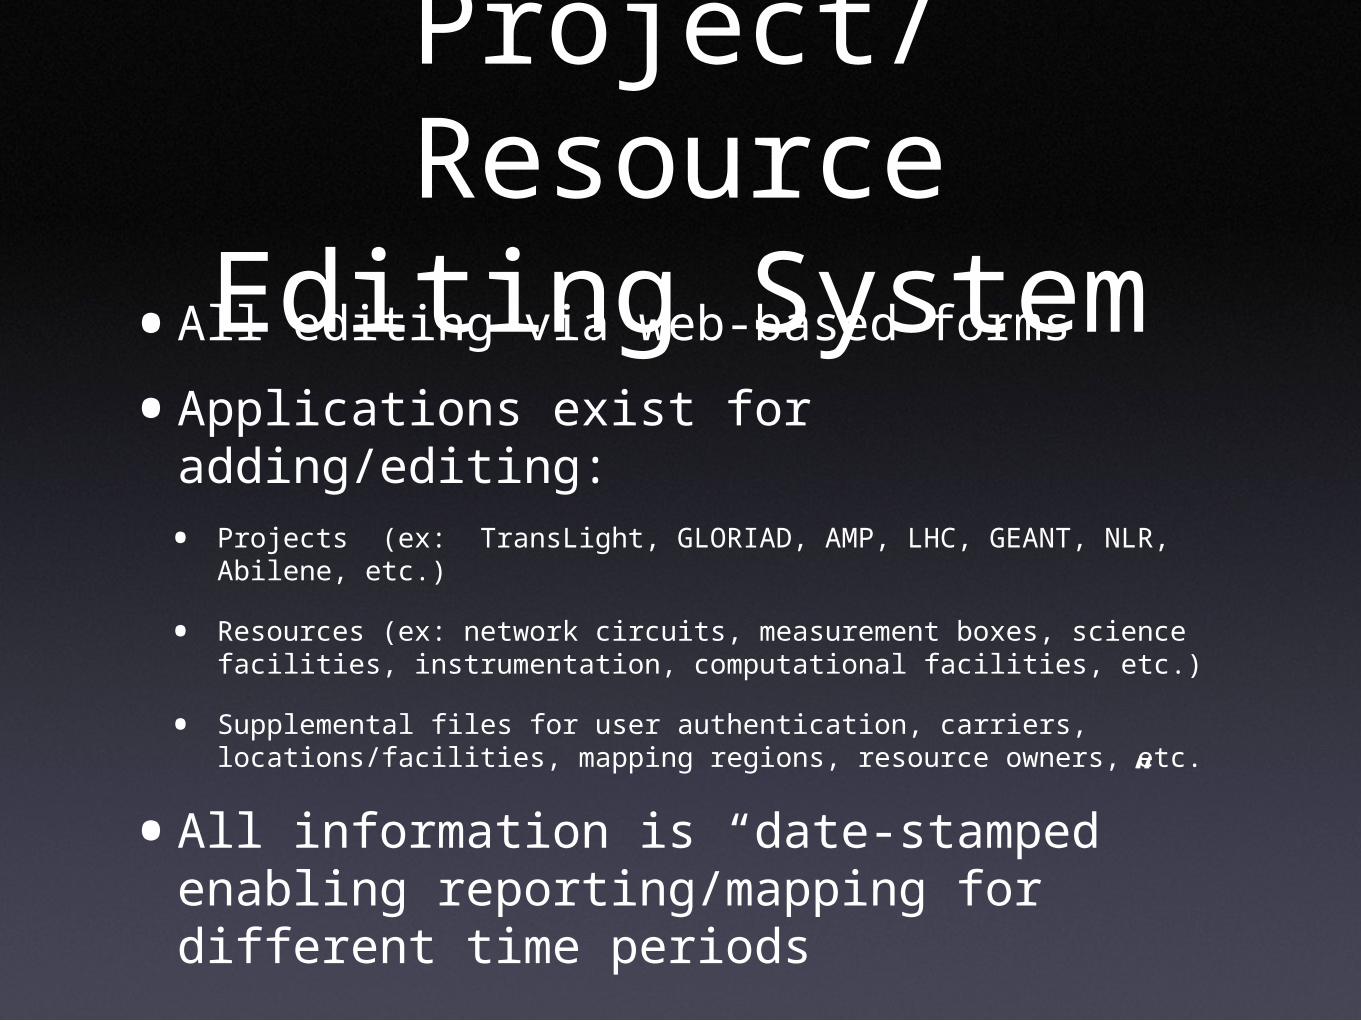
Project/Resource Editing System
•All editing via web-based forms
•Applications exist for adding/editing:• Projects (ex: TransLight, GLORIAD, AMP, LHC, GEANT, NLR,
Abilene, etc.)
• Resources (ex: network circuits, measurement boxes, science facilities, instrumentation, computational facilities, etc.)
• Supplemental files for user authentication, carriers, locations/facilities, mapping regions, resource owners, etc.
•All information is “date-stamped” enabling reporting/mapping for different time periods
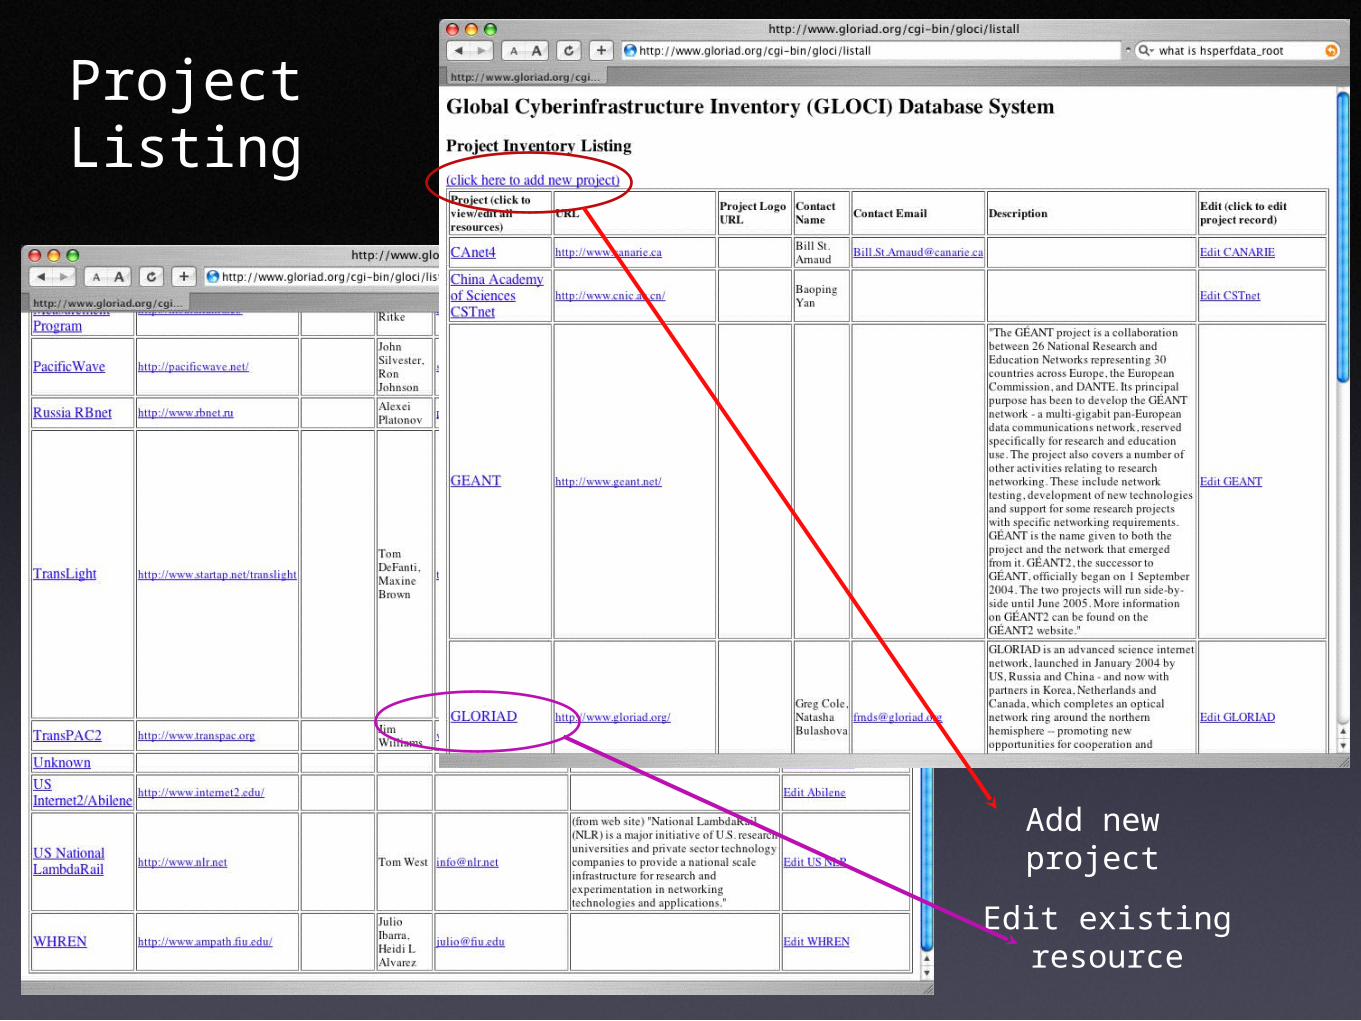
Project Listing
Add new project
Edit existing resource
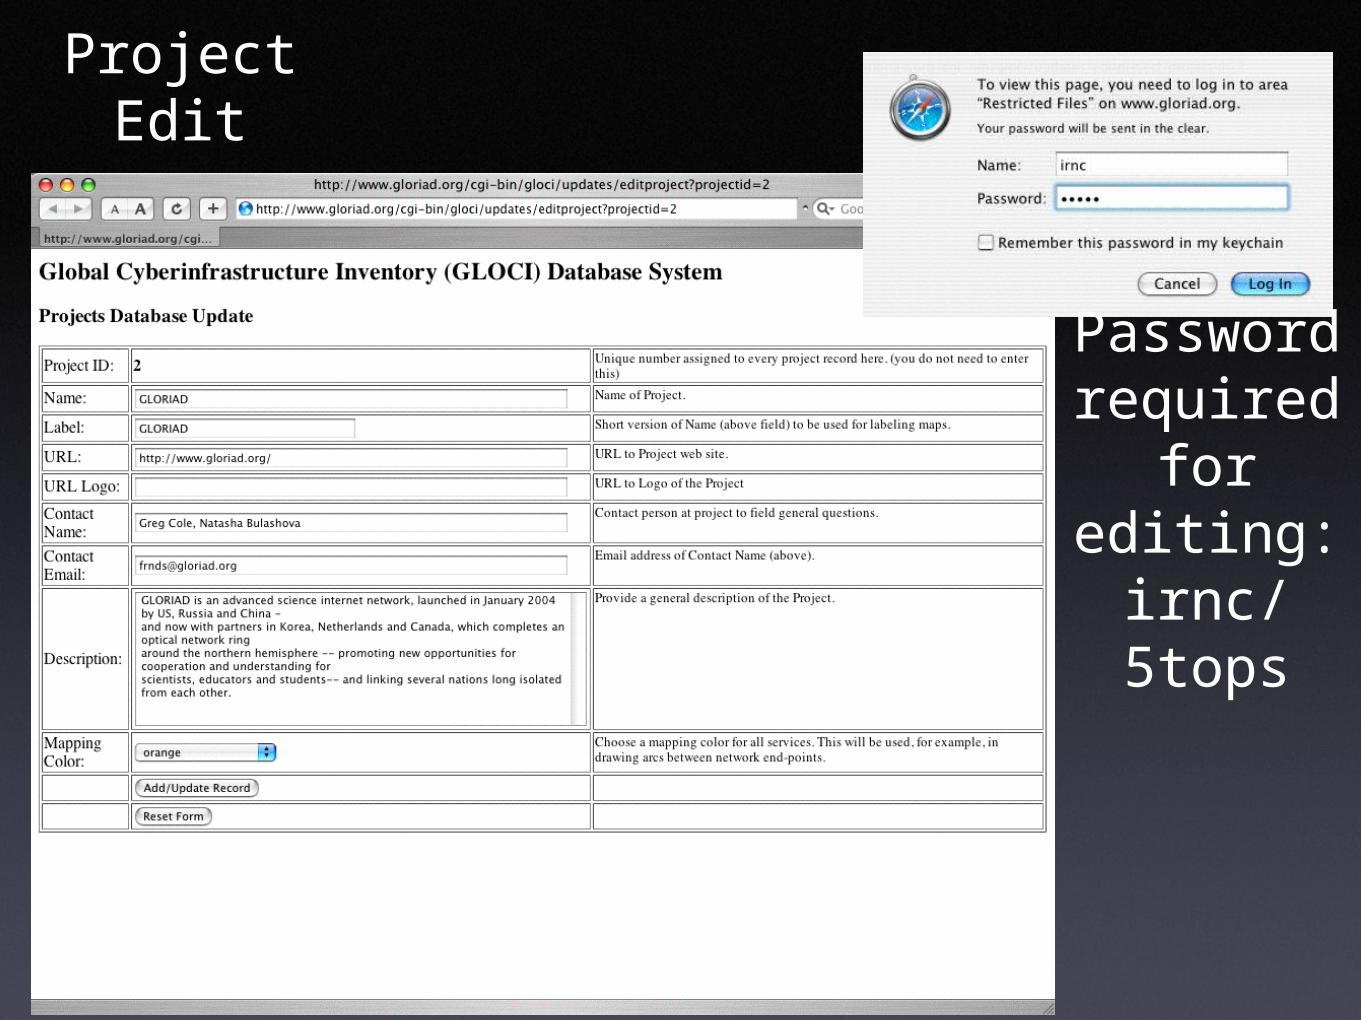
Project Edit
Password required
for editing:
irnc/5tops
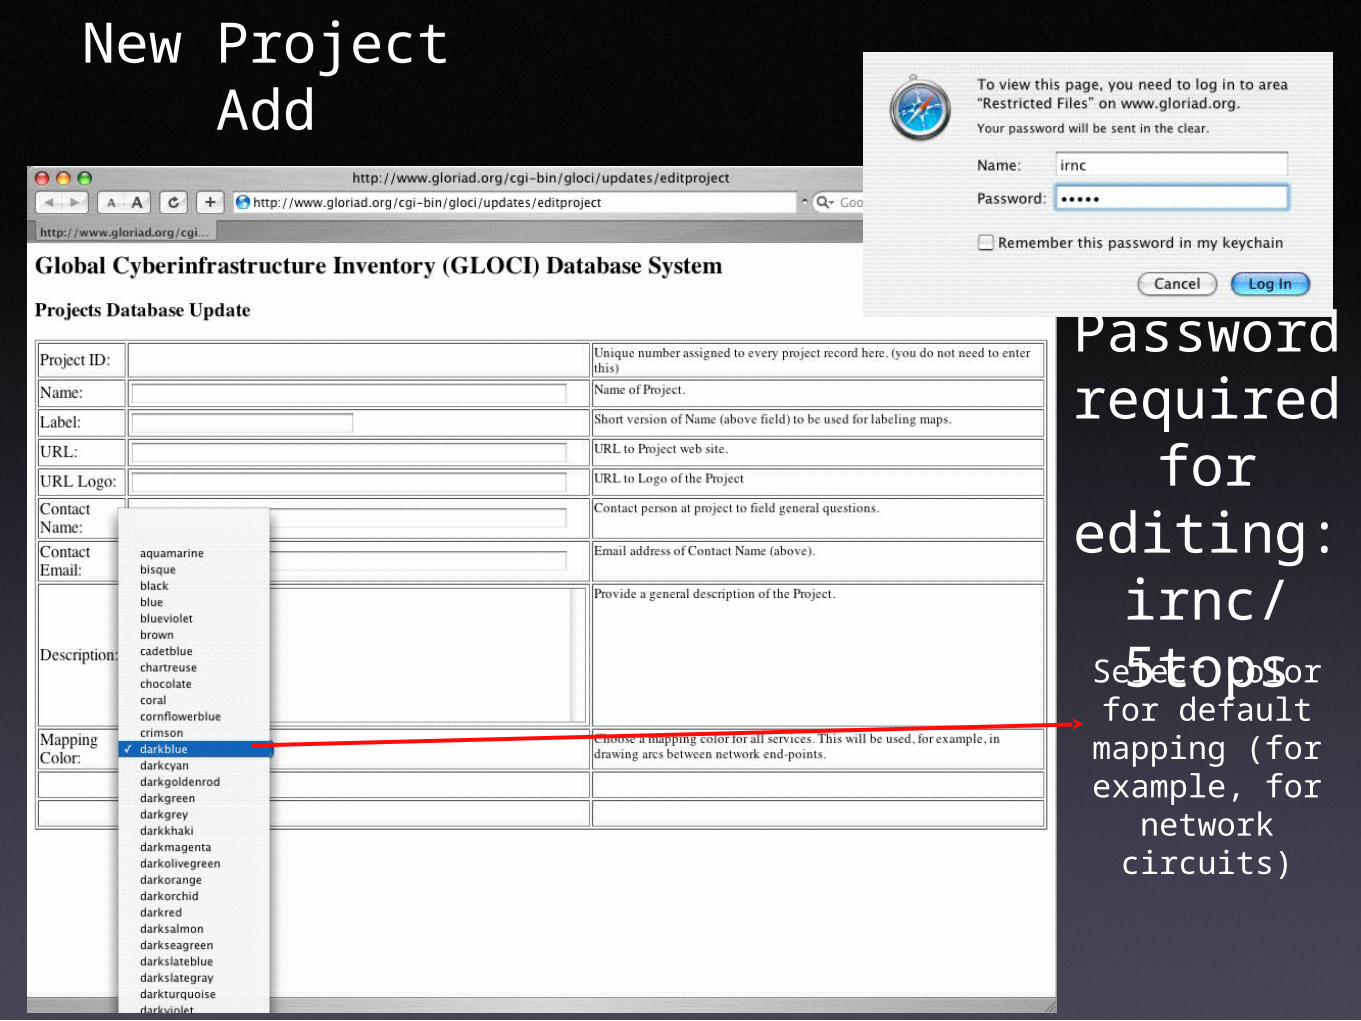
New Project Add
Password required
for editing:
irnc/5topsSelect Color for default mapping (for example, for network circuits)
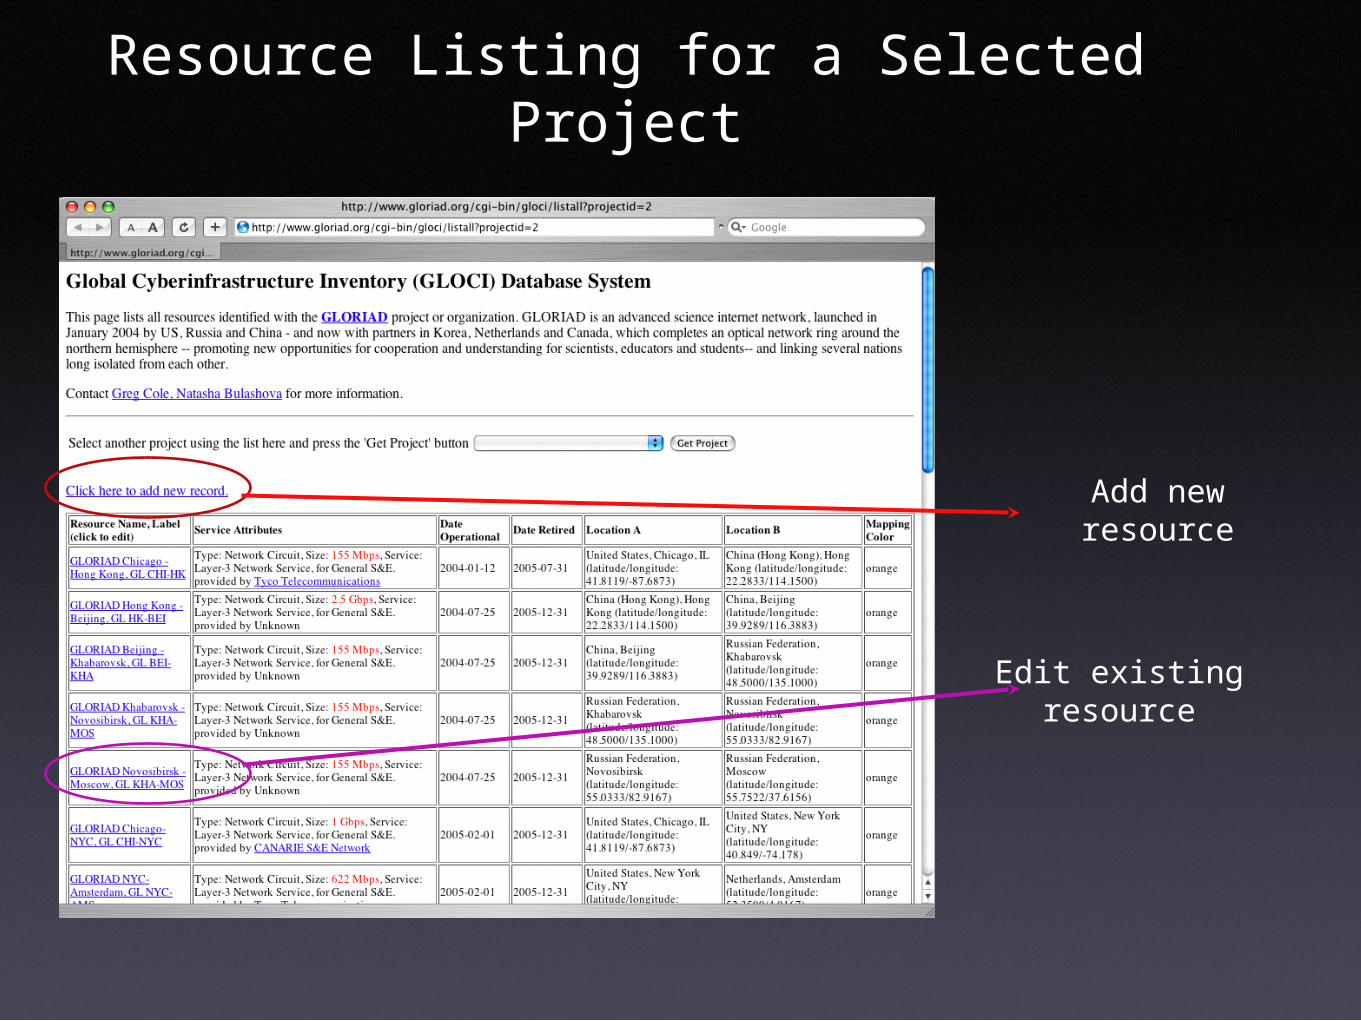
Resource Listing for a Selected Project
Add new resource
Edit existing resource
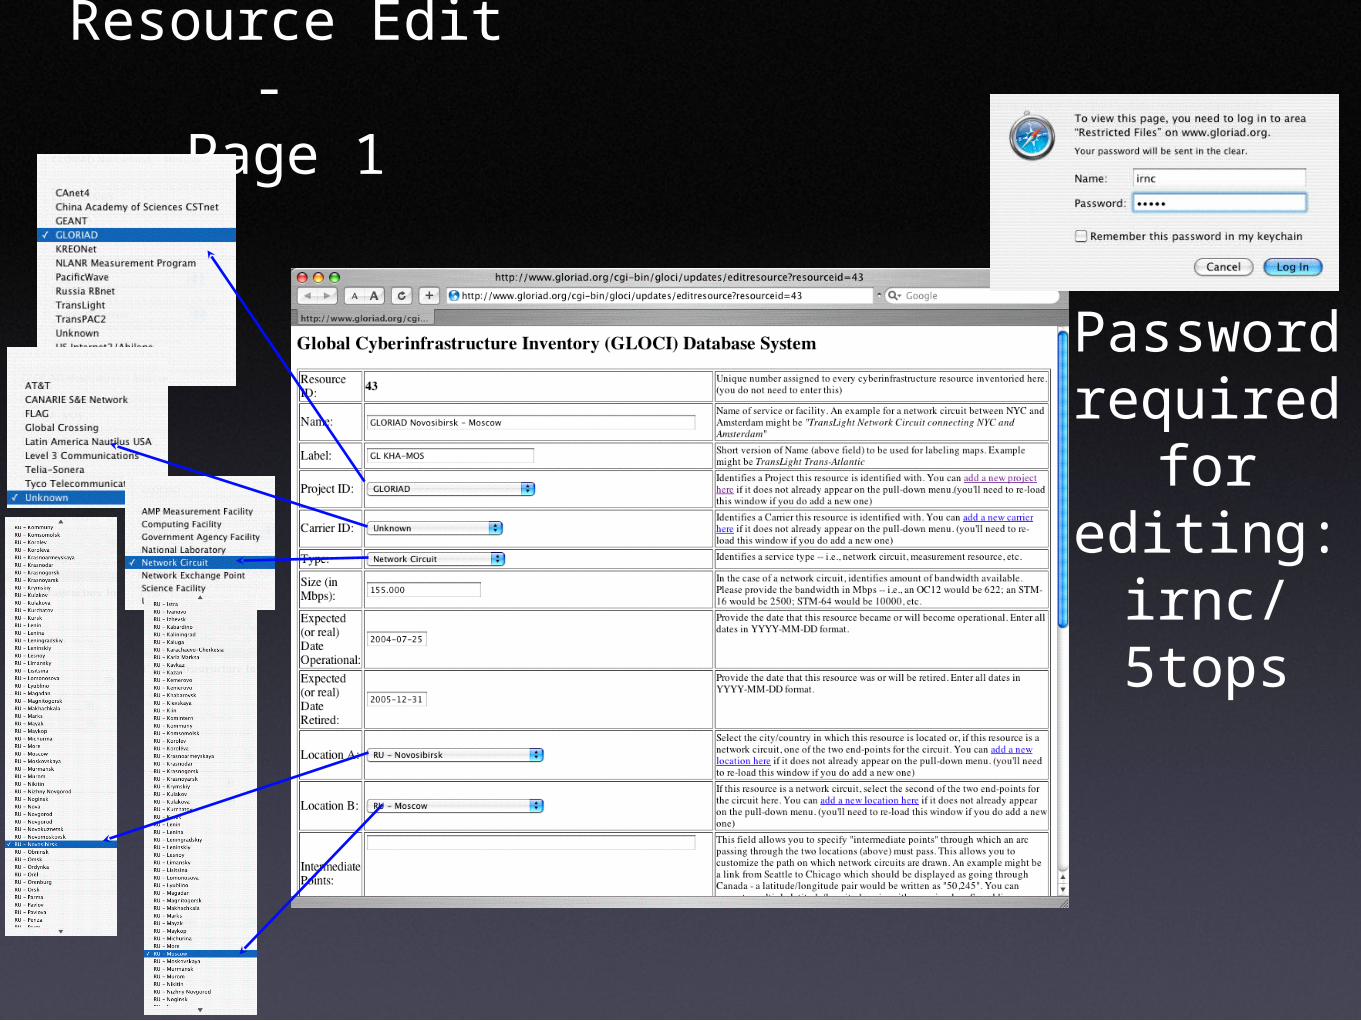
Resource Edit - Page 1
Password required
for editing:
irnc/5tops
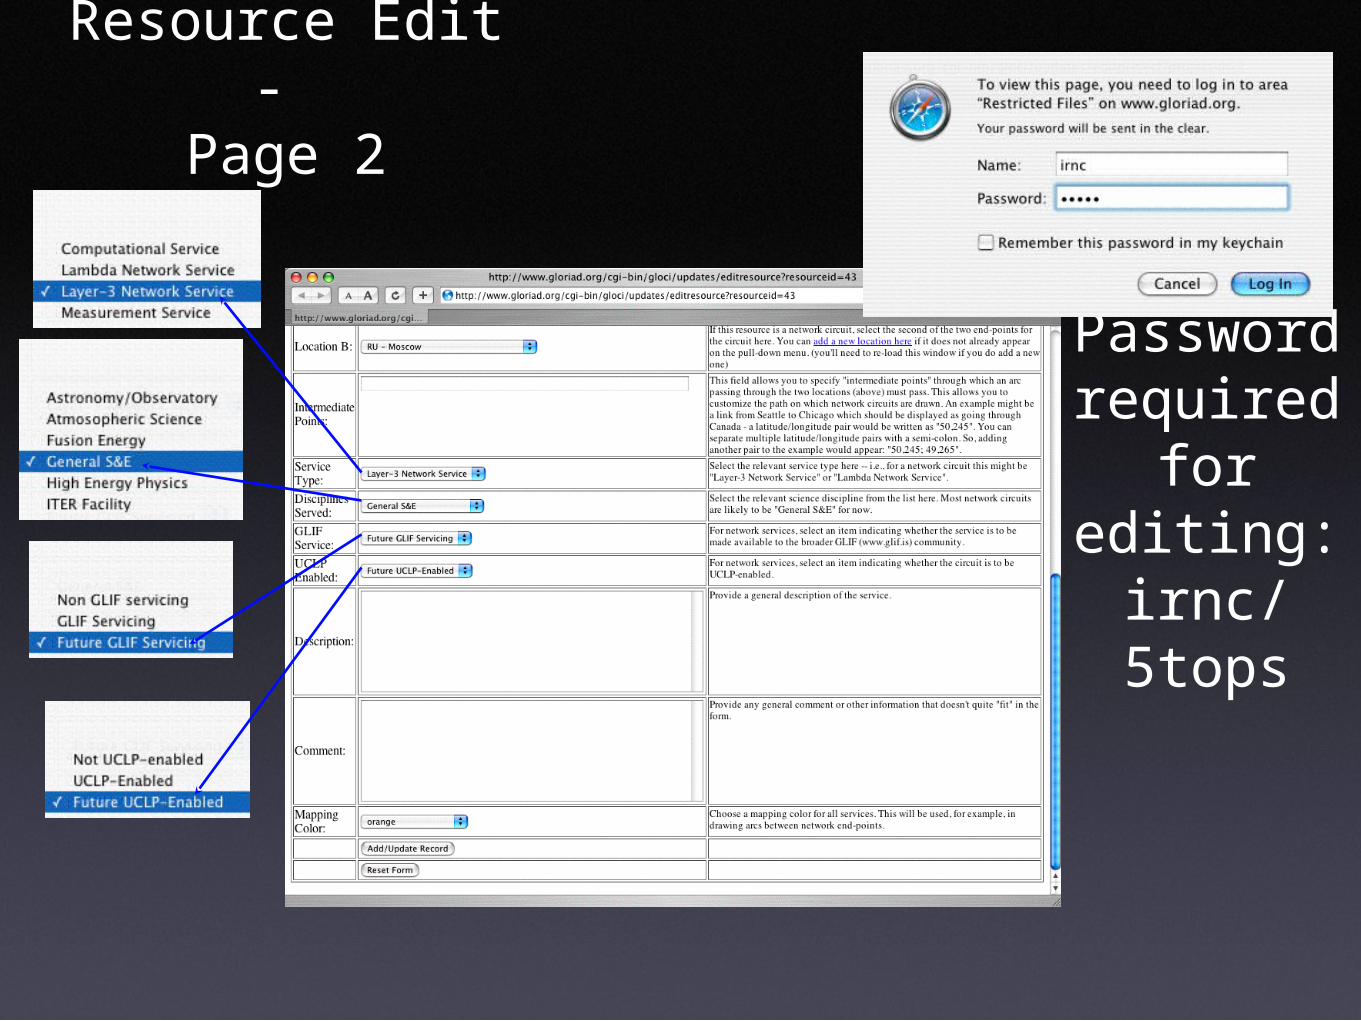
Resource Edit - Page 2
Password required
for editing:
irnc/5tops
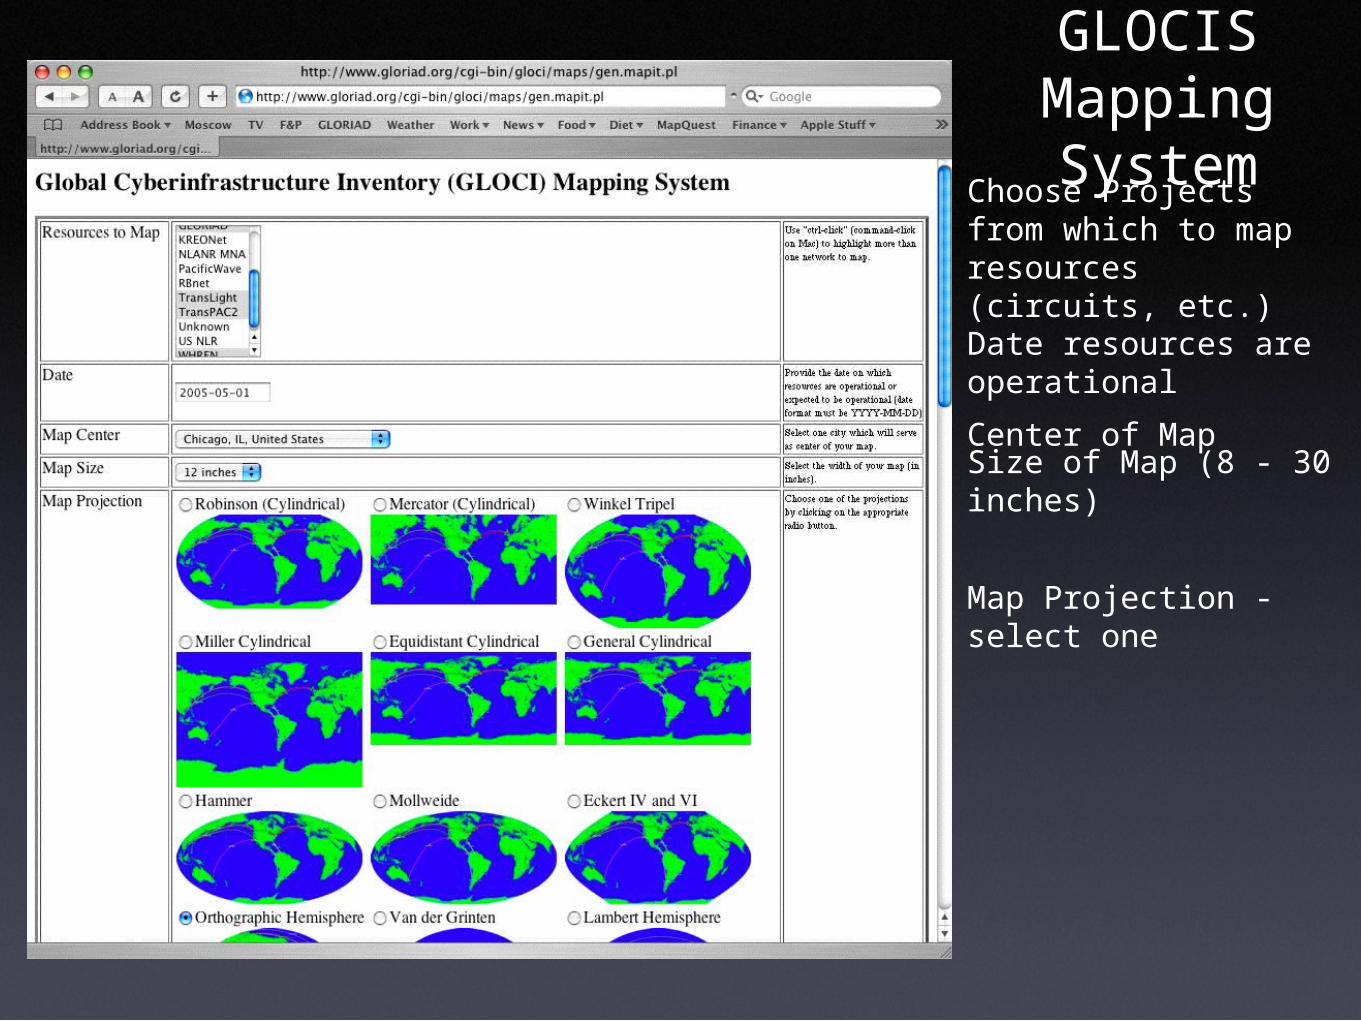
GLOCIS Mapping SystemChoose Projects from
which to map resources (circuits, etc.)Date resources are operational
Center of MapSize of Map (8 - 30 inches)
Map Projection - select one
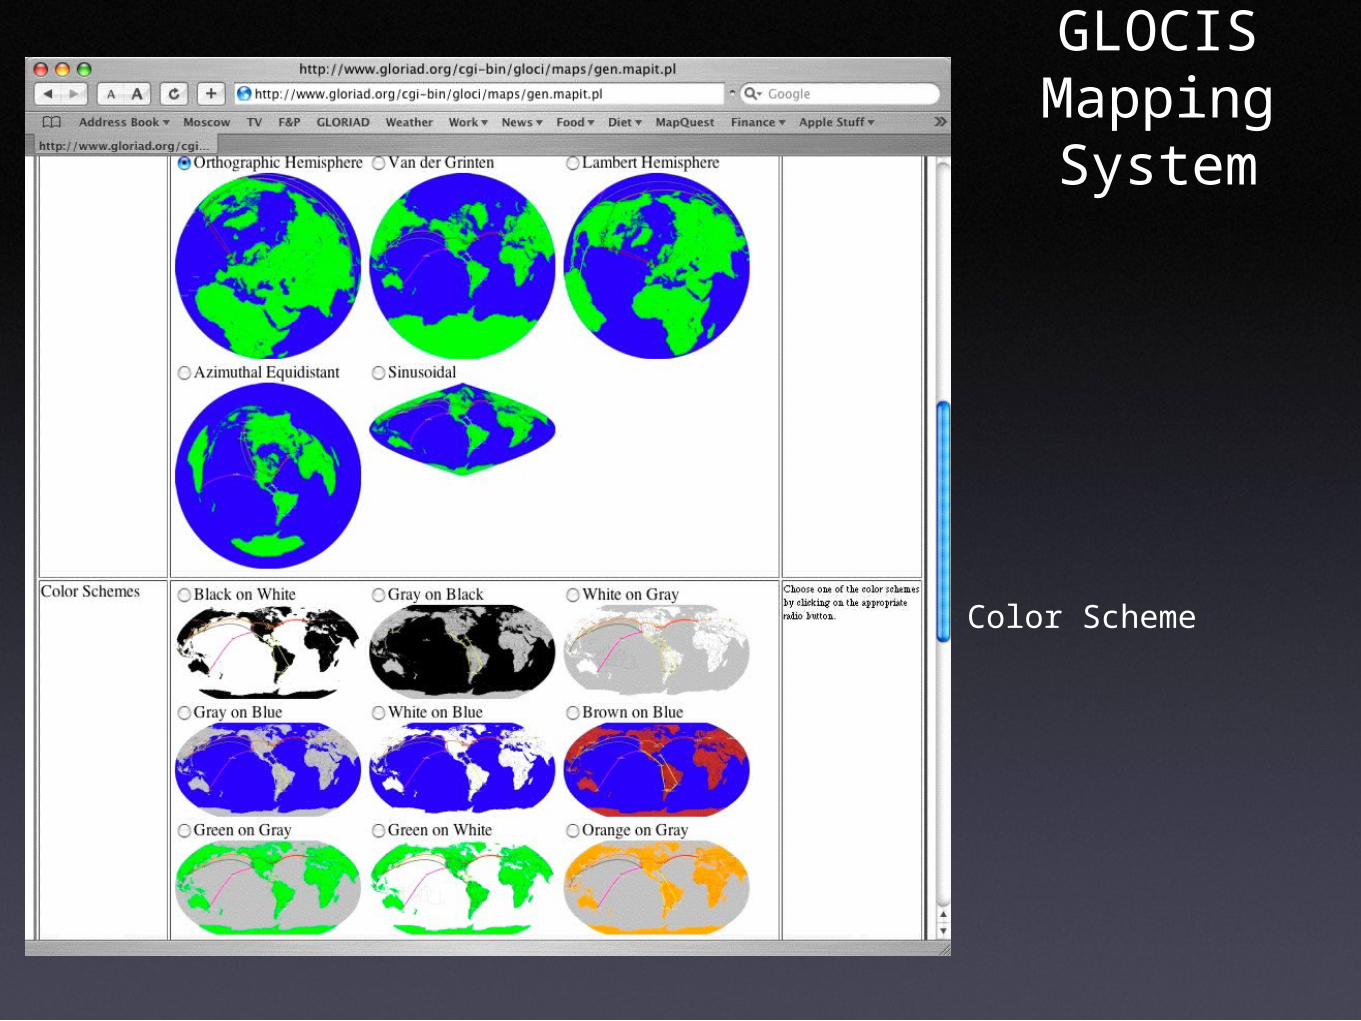
GLOCIS Mapping System
Color Scheme
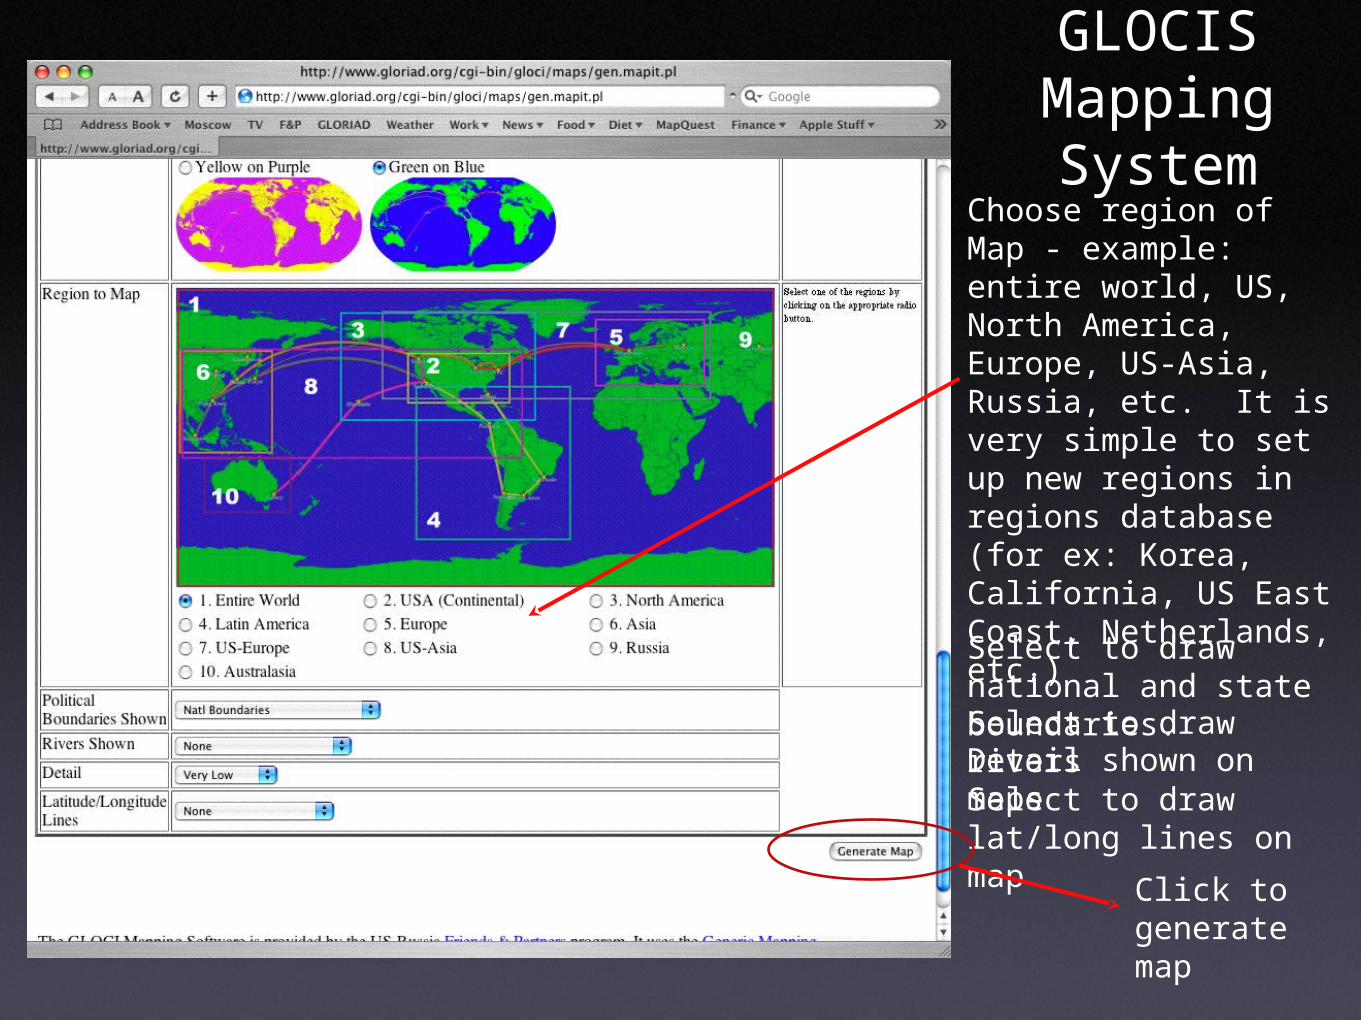
GLOCIS Mapping System
Choose region of Map - example: entire world, US, North America, Europe, US-Asia, Russia, etc. It is very simple to set up new regions in regions database (for ex: Korea, California, US East Coast, Netherlands, etc.)Select to draw national and state boundaries. Select to draw riversDetail shown on mapsSelect to draw lat/long lines on map
Click to generatemap
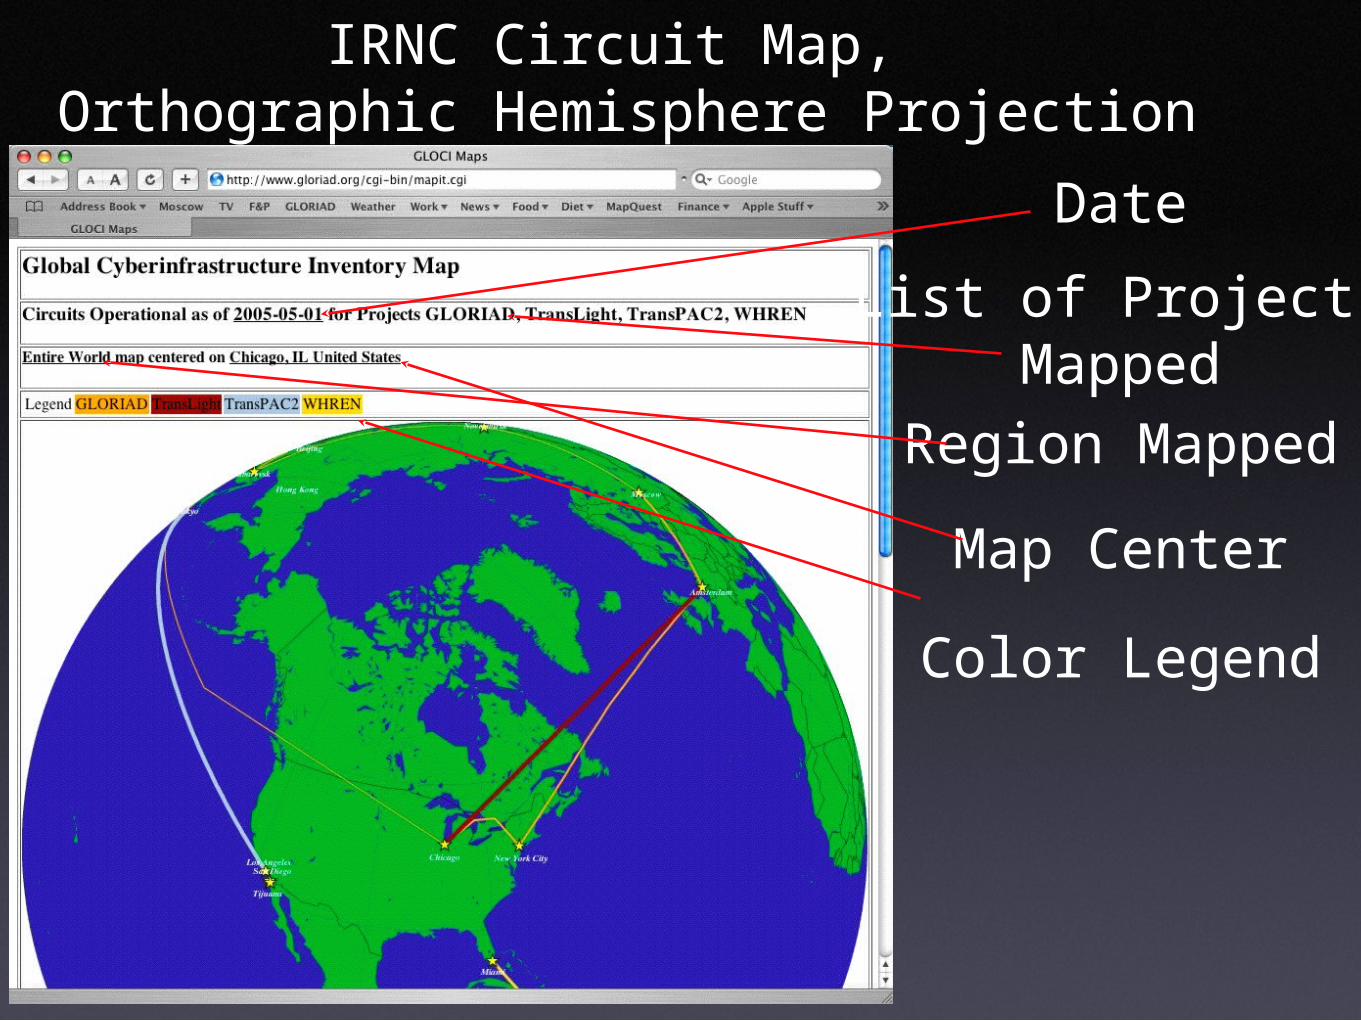
IRNC Circuit Map, Orthographic Hemisphere Projection
Date
List of ProjectsMapped
Color Legend
Region Mapped
Map Center
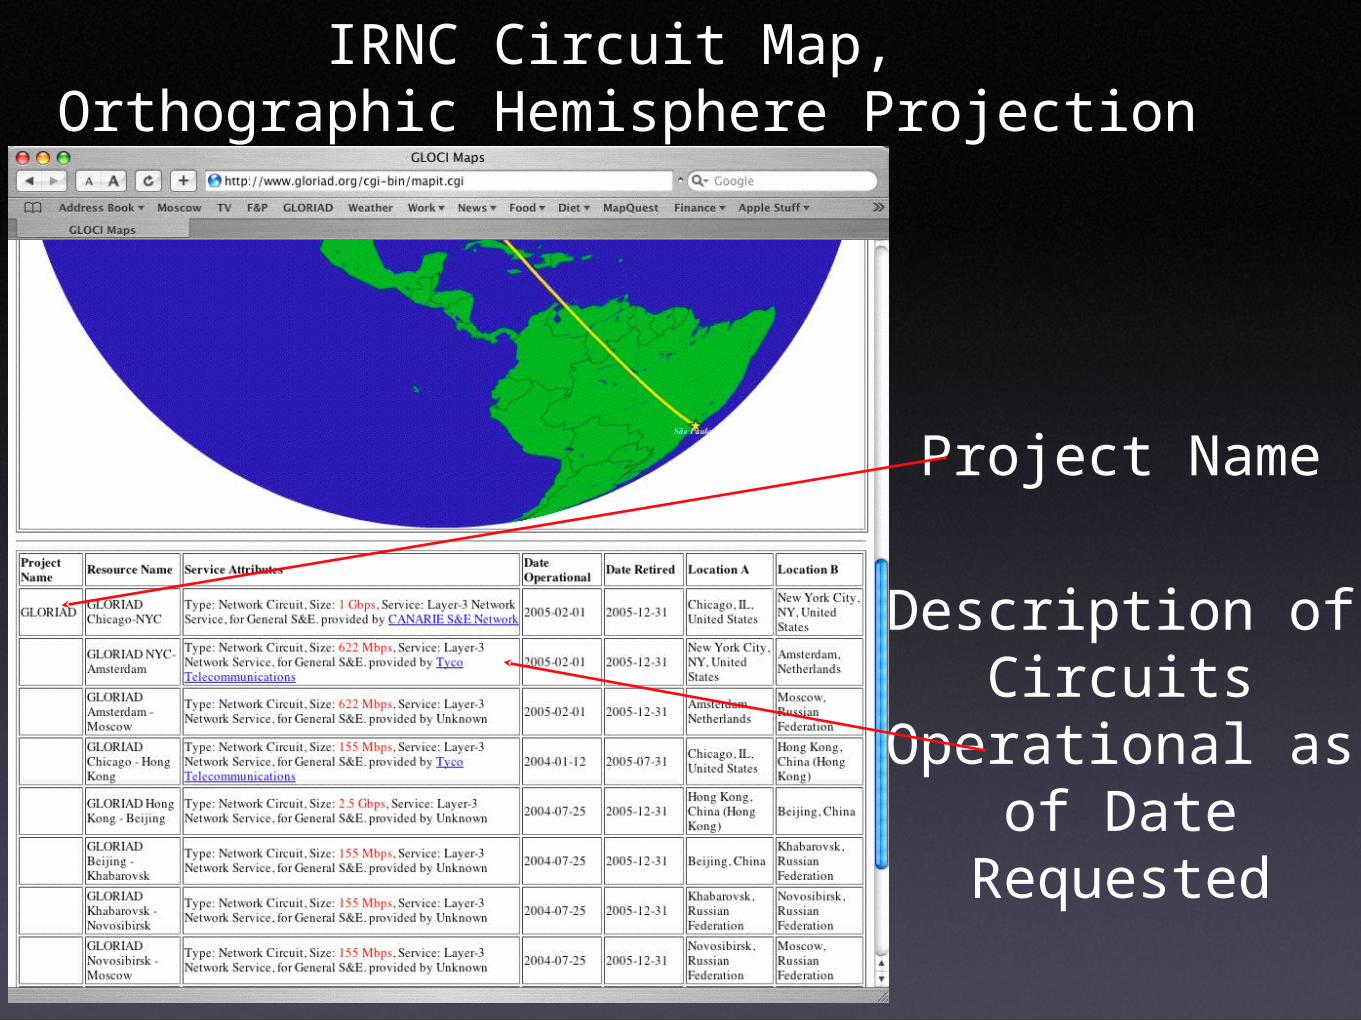
IRNC Circuit Map, Orthographic Hemisphere Projection
Project Name
Description of Circuits
Operational as of Date Requested
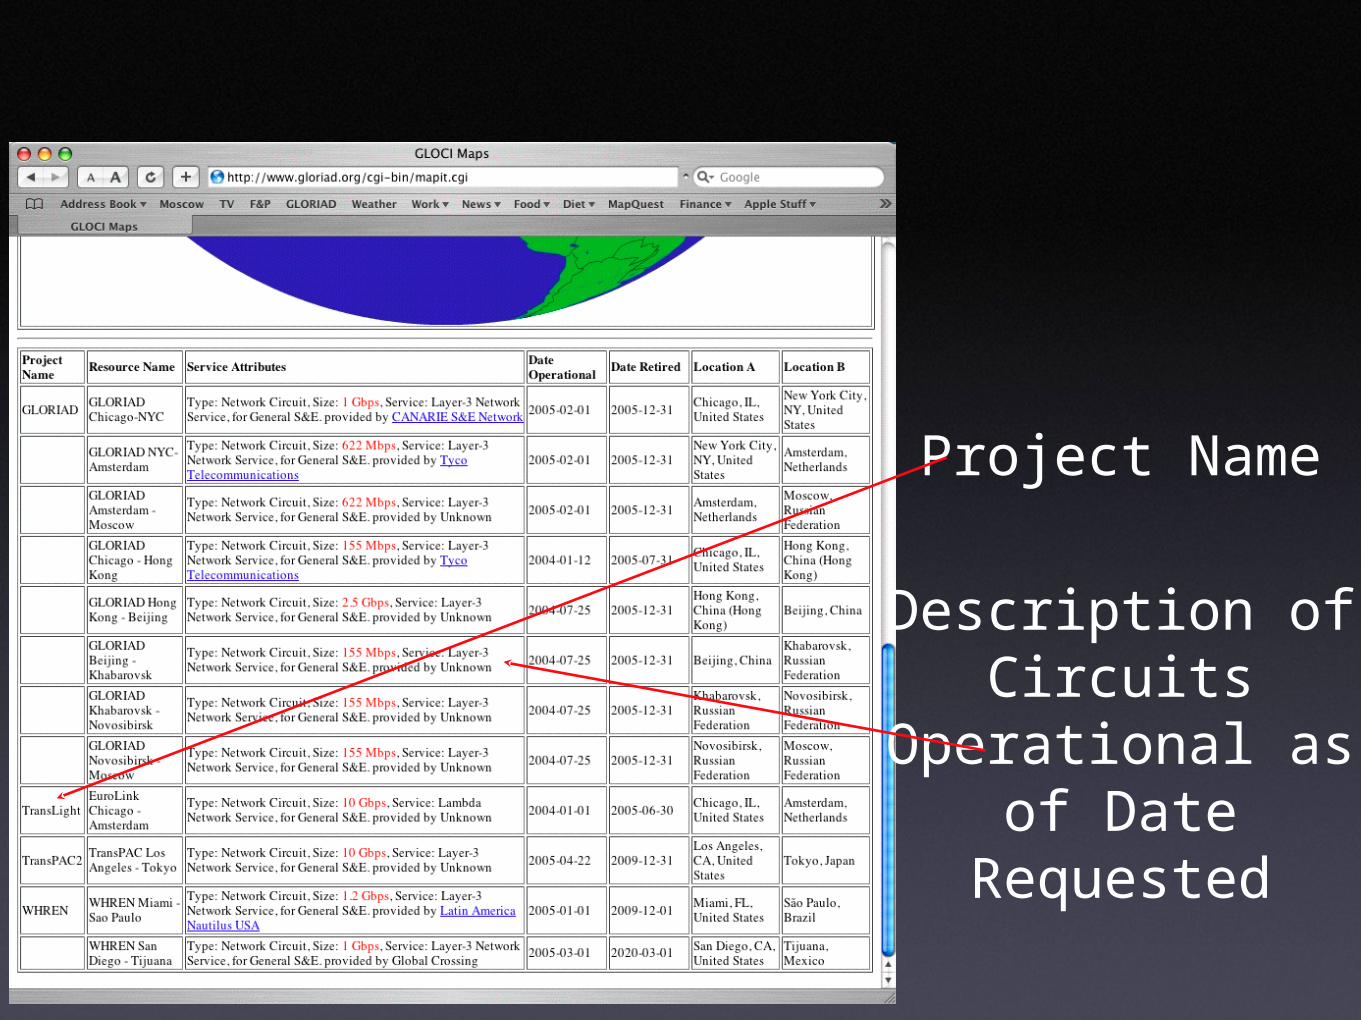
Project Name
Description of Circuits
Operational as of Date Requested
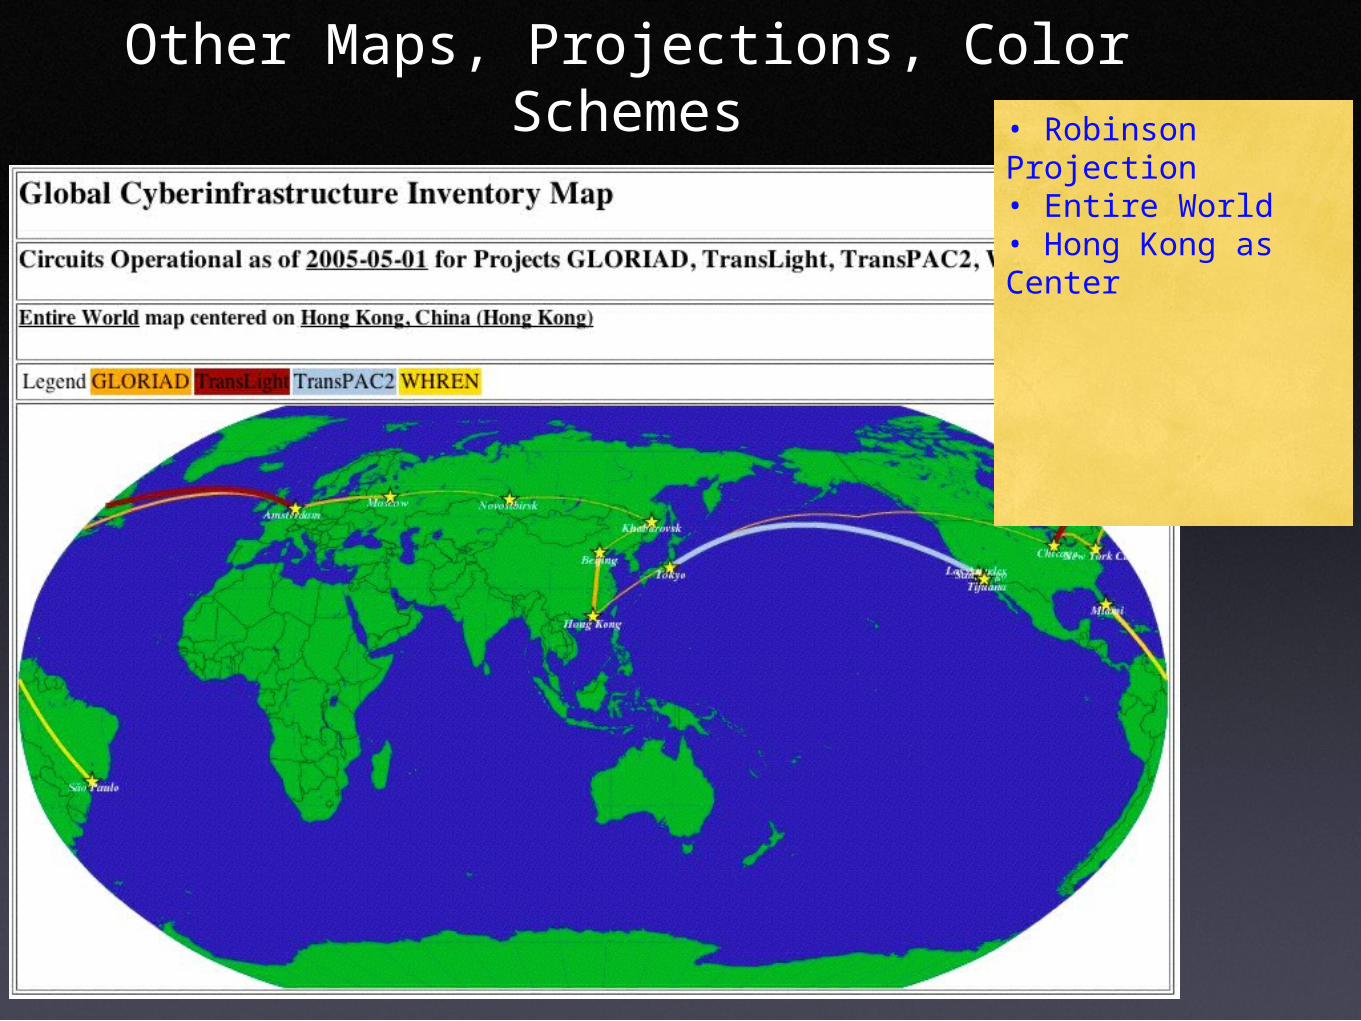
Other Maps, Projections, Color Schemes• Robinson Projection• Entire World• Hong Kong as Center
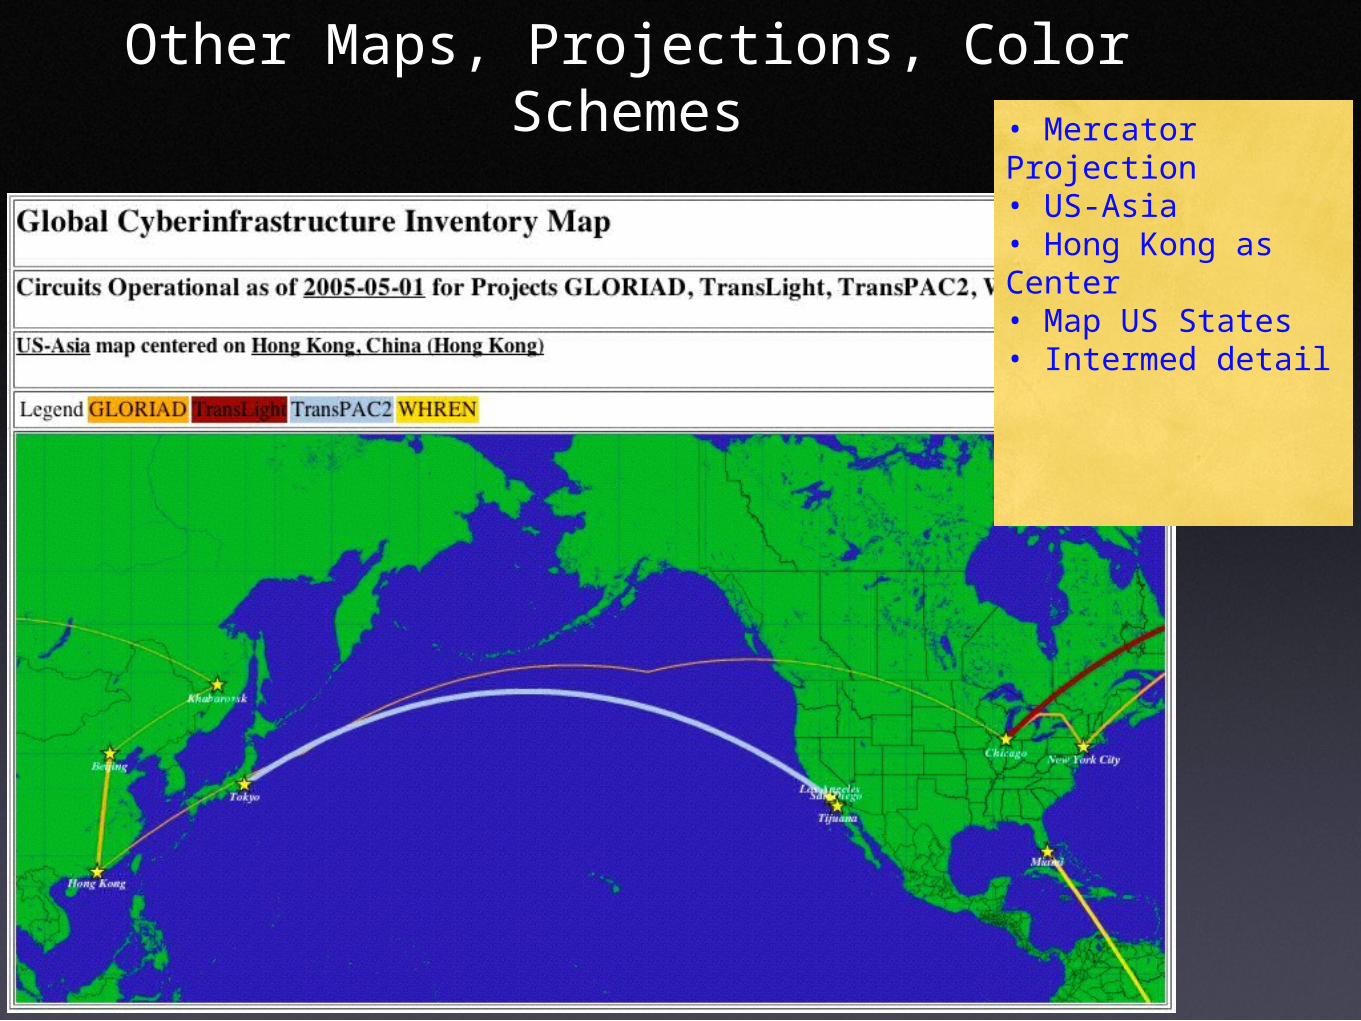
Other Maps, Projections, Color Schemes• Mercator Projection• US-Asia• Hong Kong as Center• Map US States• Intermed detail
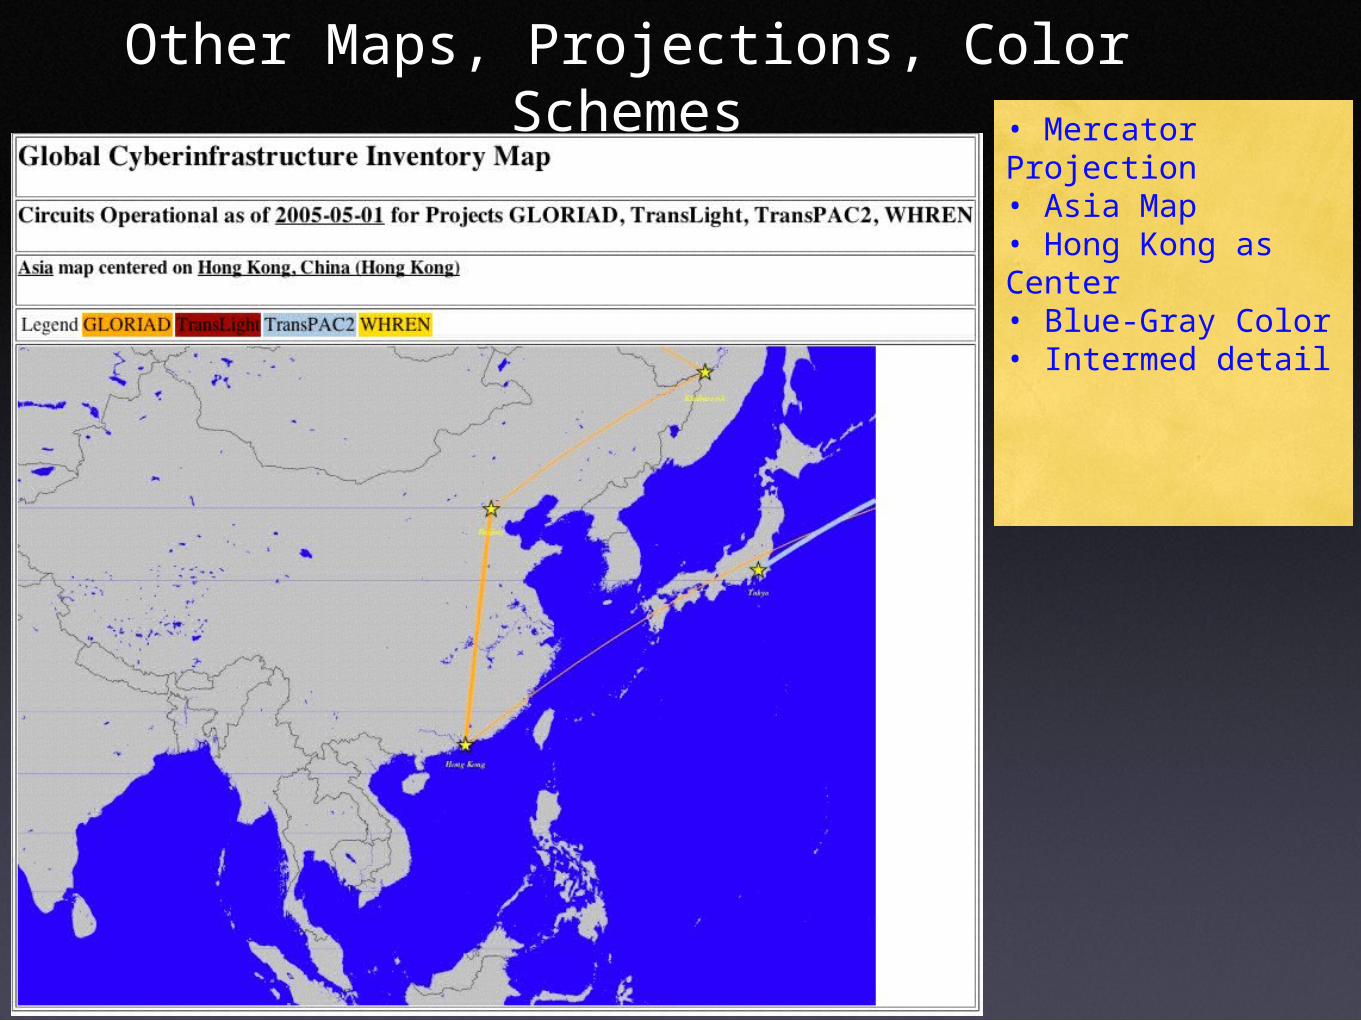
Other Maps, Projections, Color Schemes• Mercator Projection• Asia Map• Hong Kong as Center• Blue-Gray Color• Intermed detail
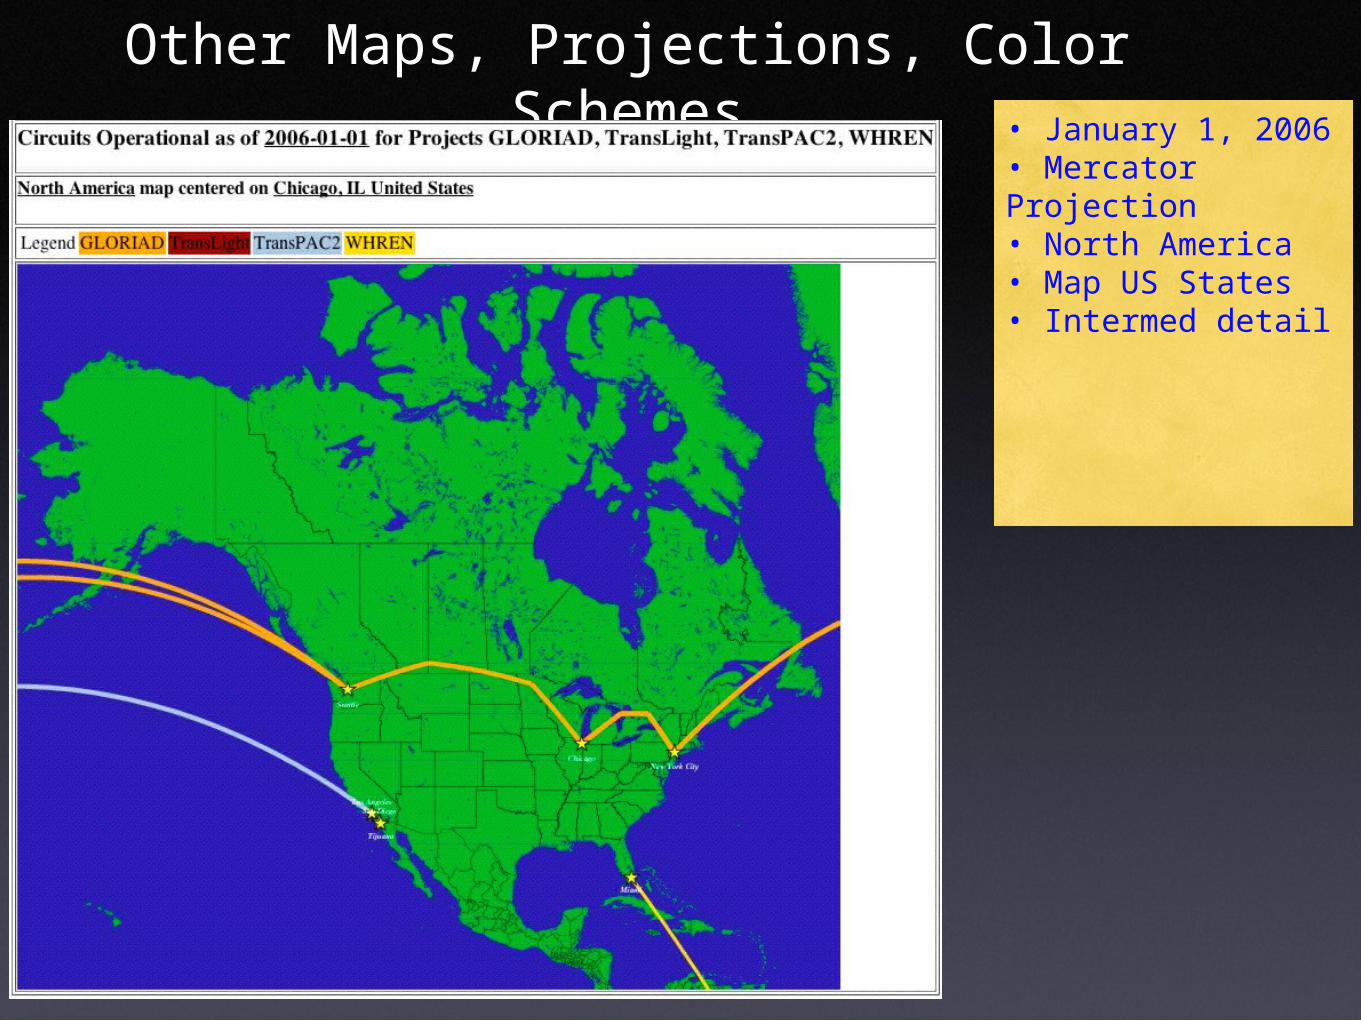
Other Maps, Projections, Color Schemes• January 1, 2006 • Mercator Projection• North America• Map US States• Intermed detail
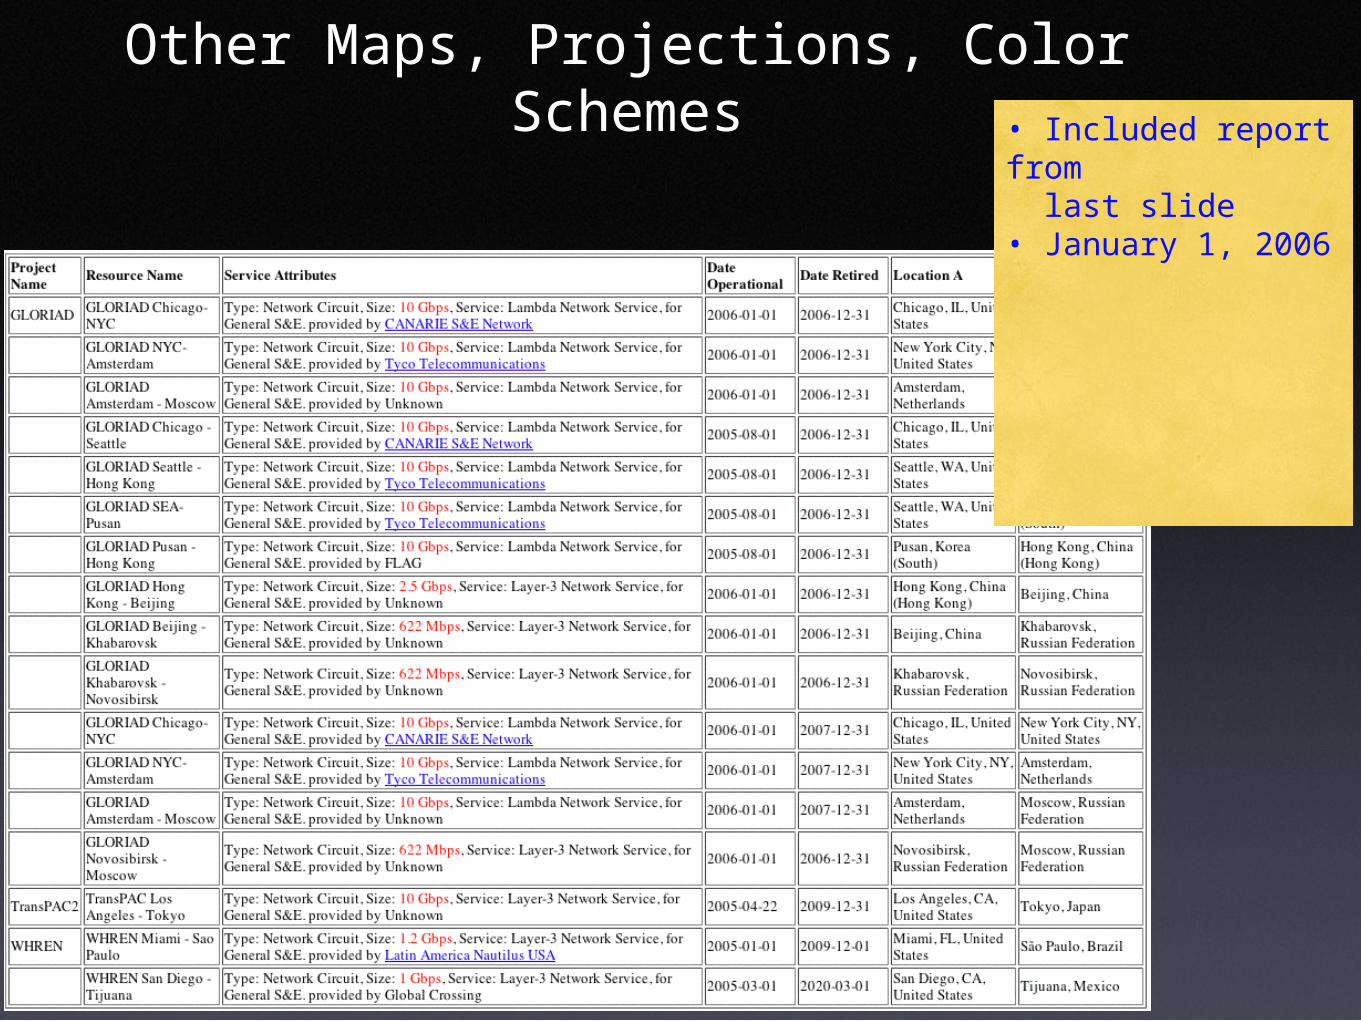
Other Maps, Projections, Color Schemes• Included report from last slide• January 1, 2006
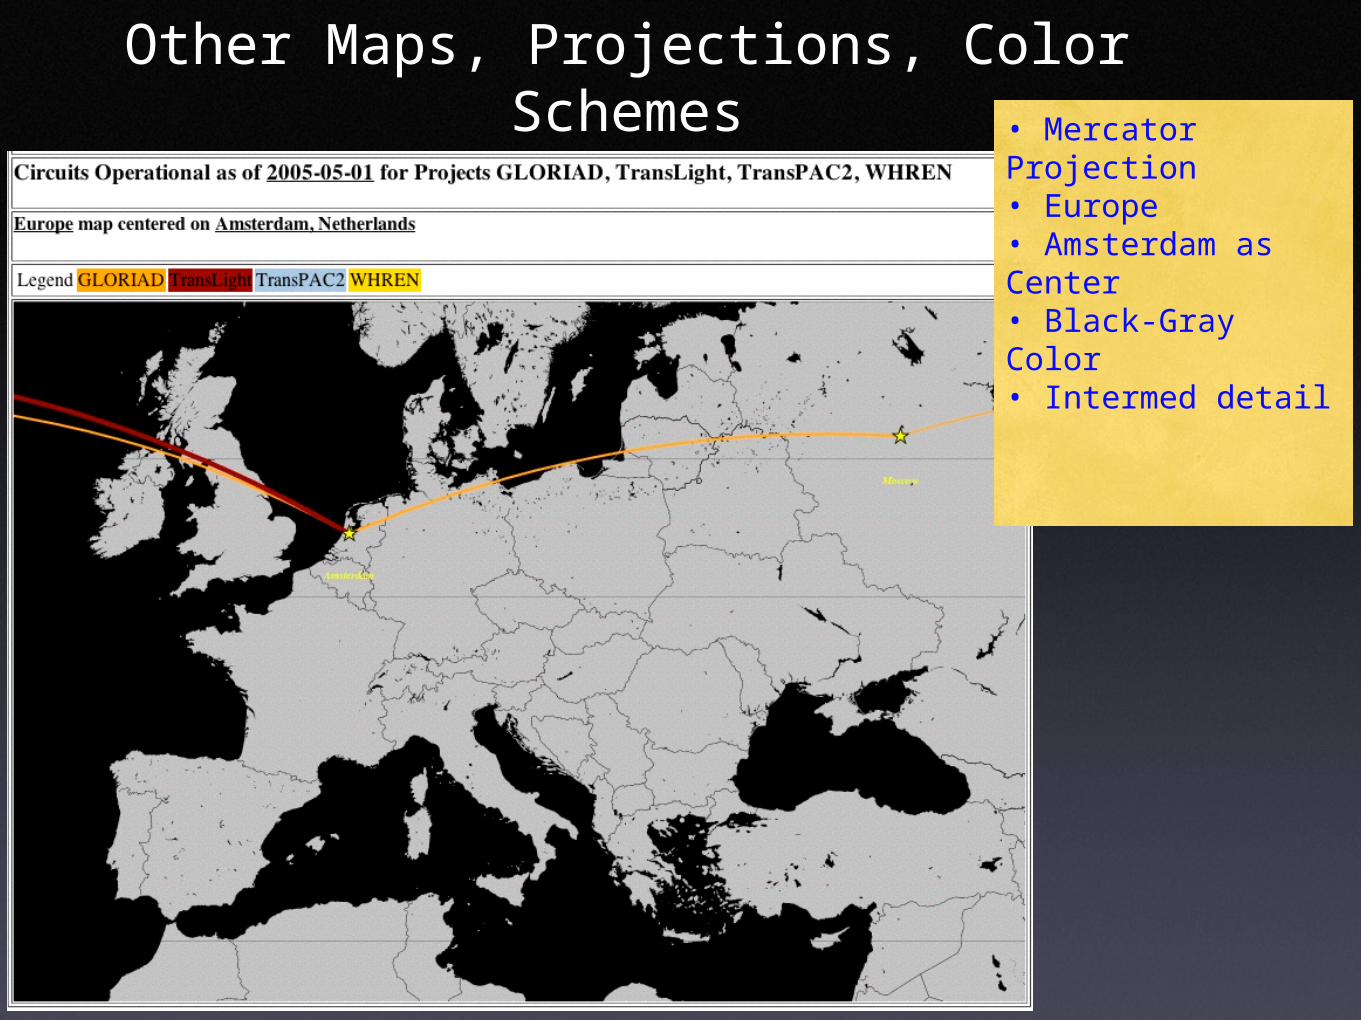
Other Maps, Projections, Color Schemes• Mercator Projection• Europe• Amsterdam as Center• Black-Gray Color• Intermed detail
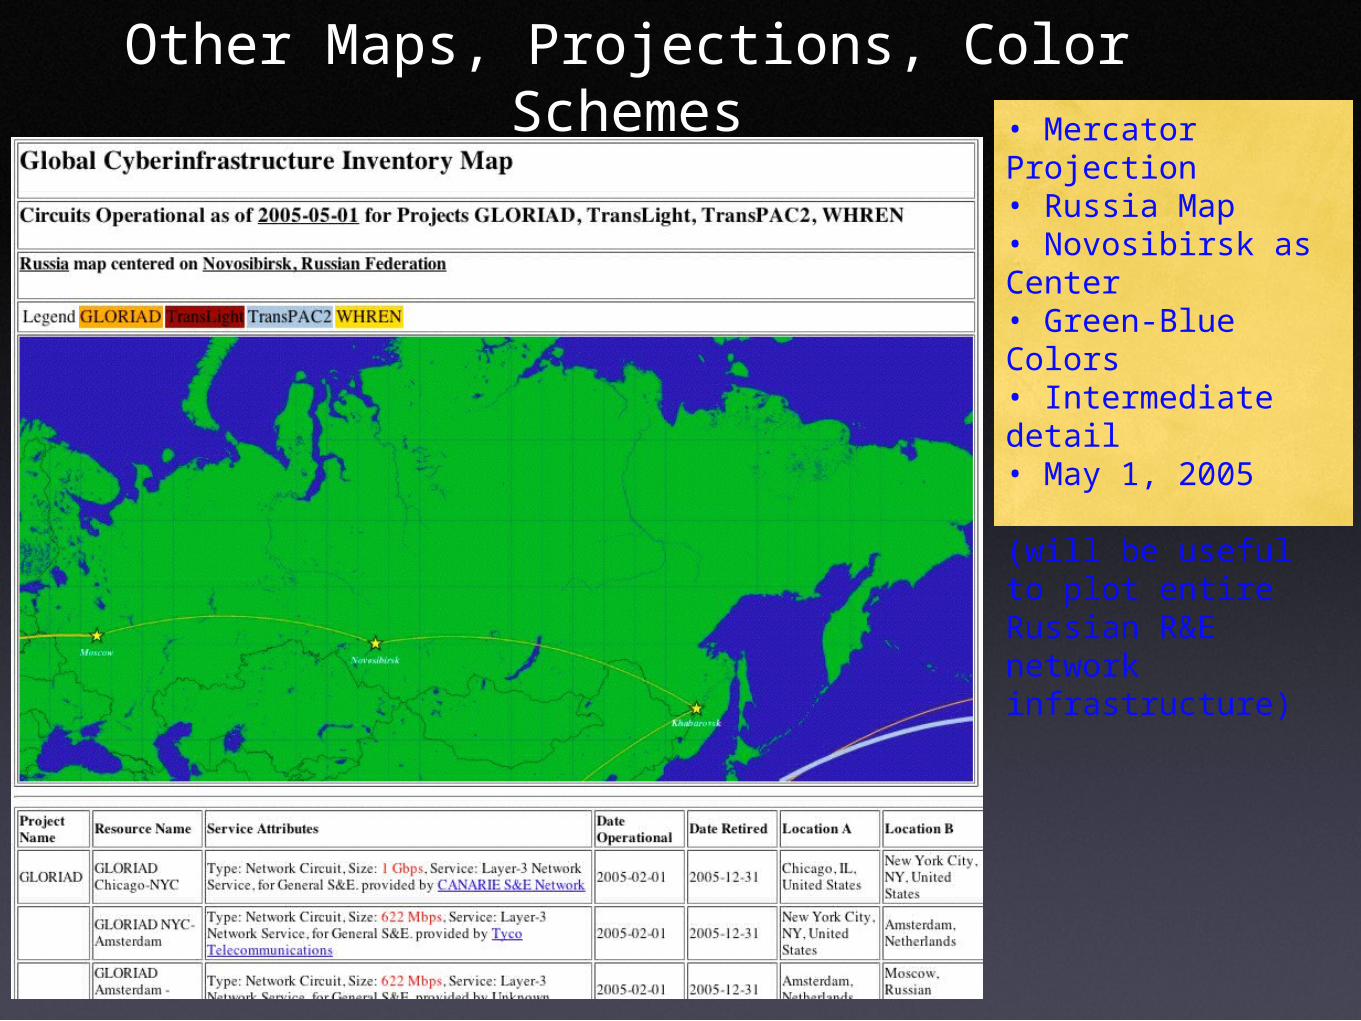
Other Maps, Projections, Color Schemes• Mercator Projection• Russia Map• Novosibirsk as Center• Green-Blue Colors• Intermediate detail• May 1, 2005
(will be useful to plot entire Russian R&E network infrastructure)
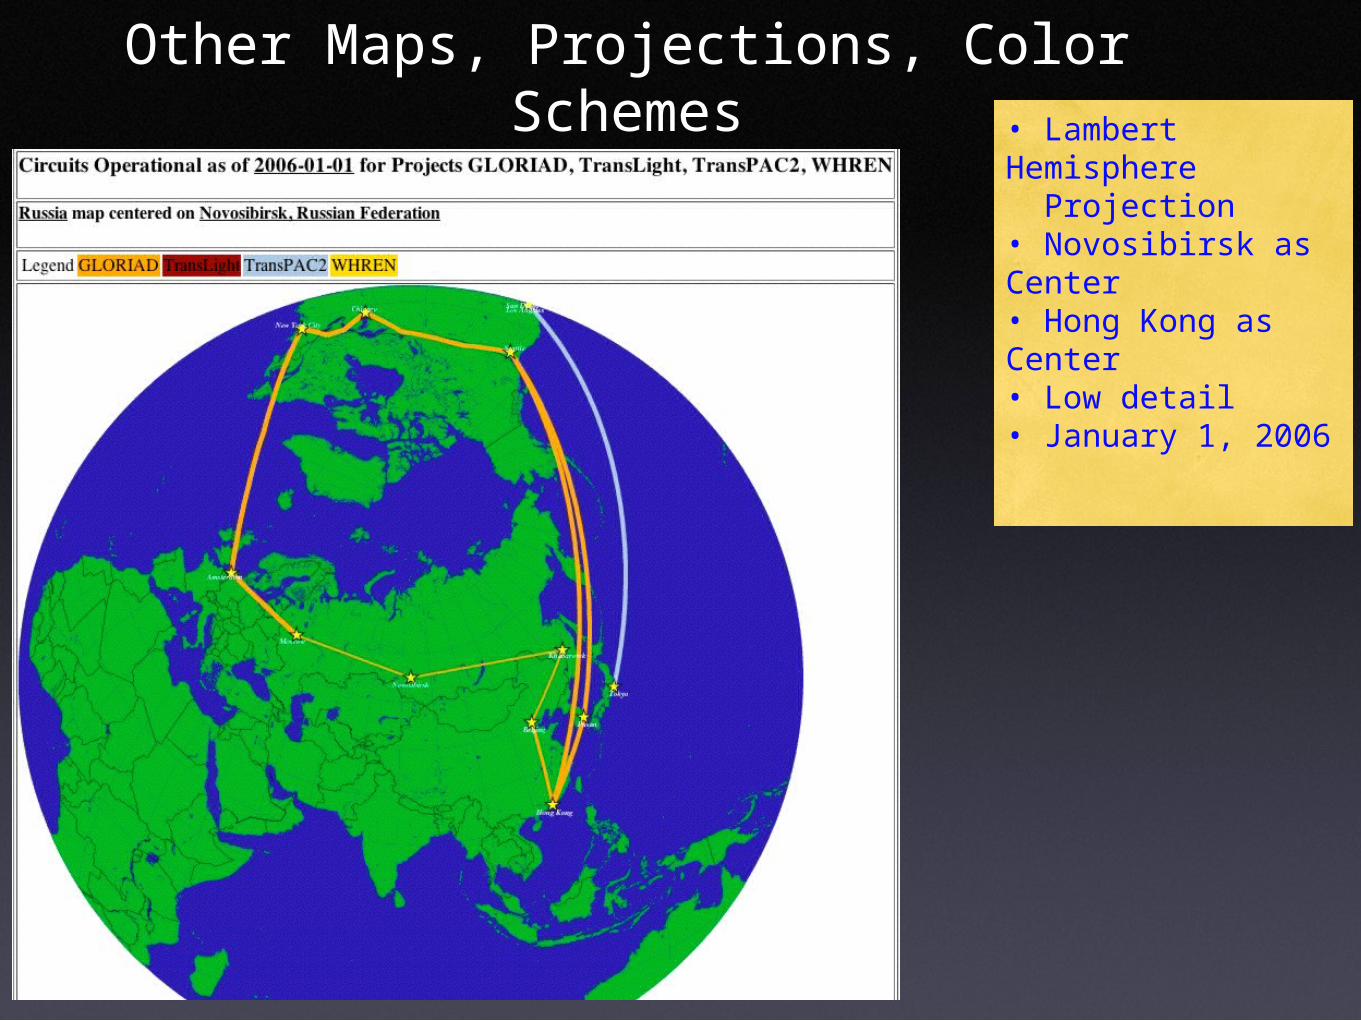
Other Maps, Projections, Color Schemes• Lambert Hemisphere Projection• Novosibirsk as Center• Hong Kong as Center• Low detail• January 1, 2006
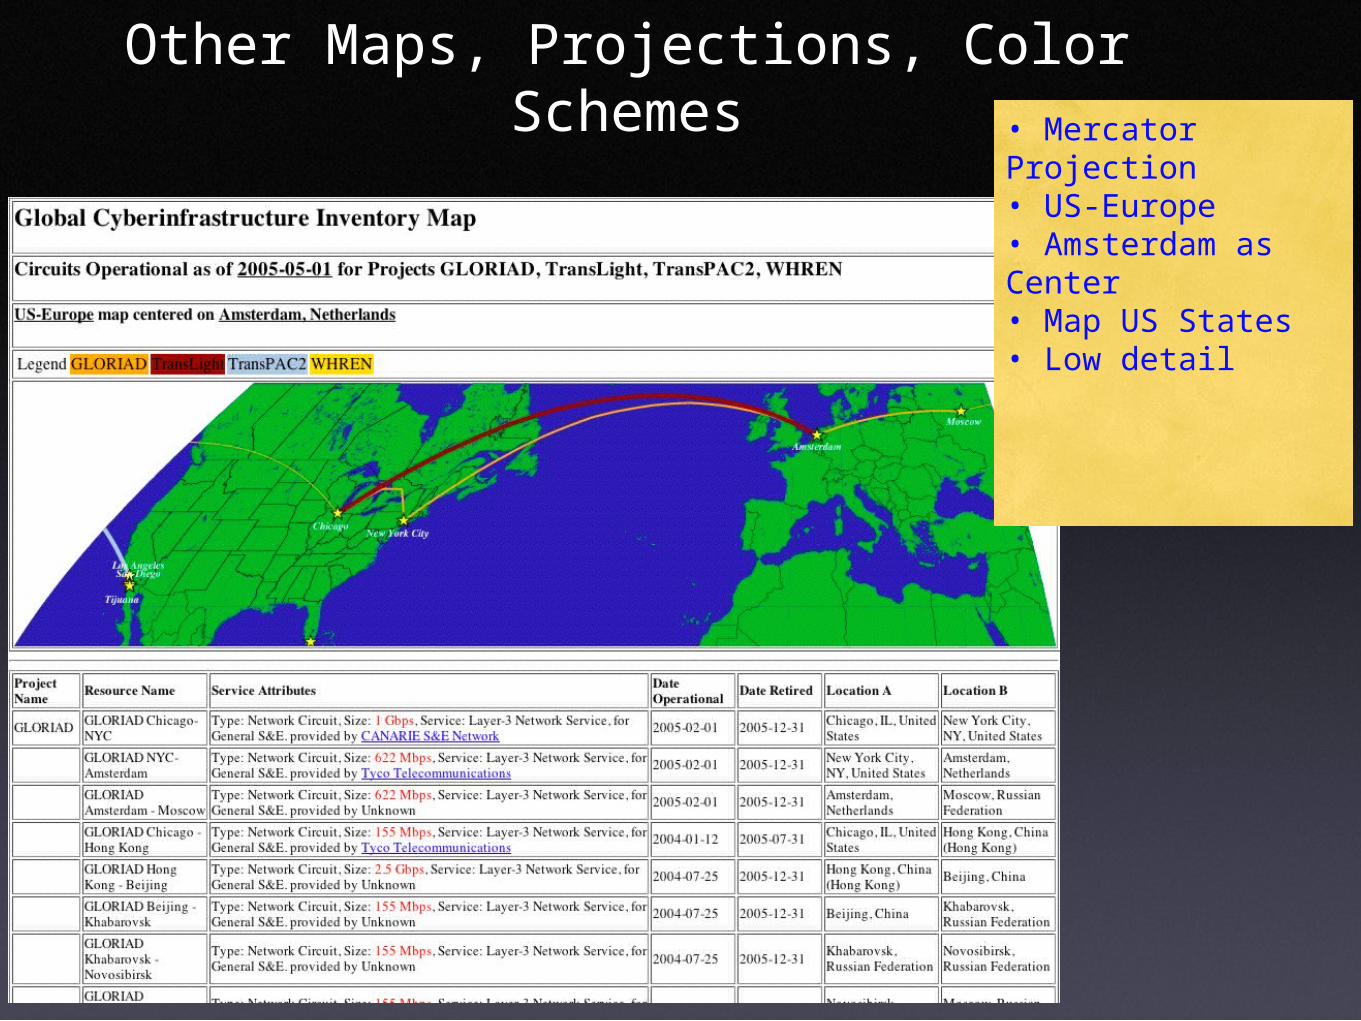
Other Maps, Projections, Color Schemes• Mercator Projection• US-Europe• Amsterdam as Center• Map US States• Low detail
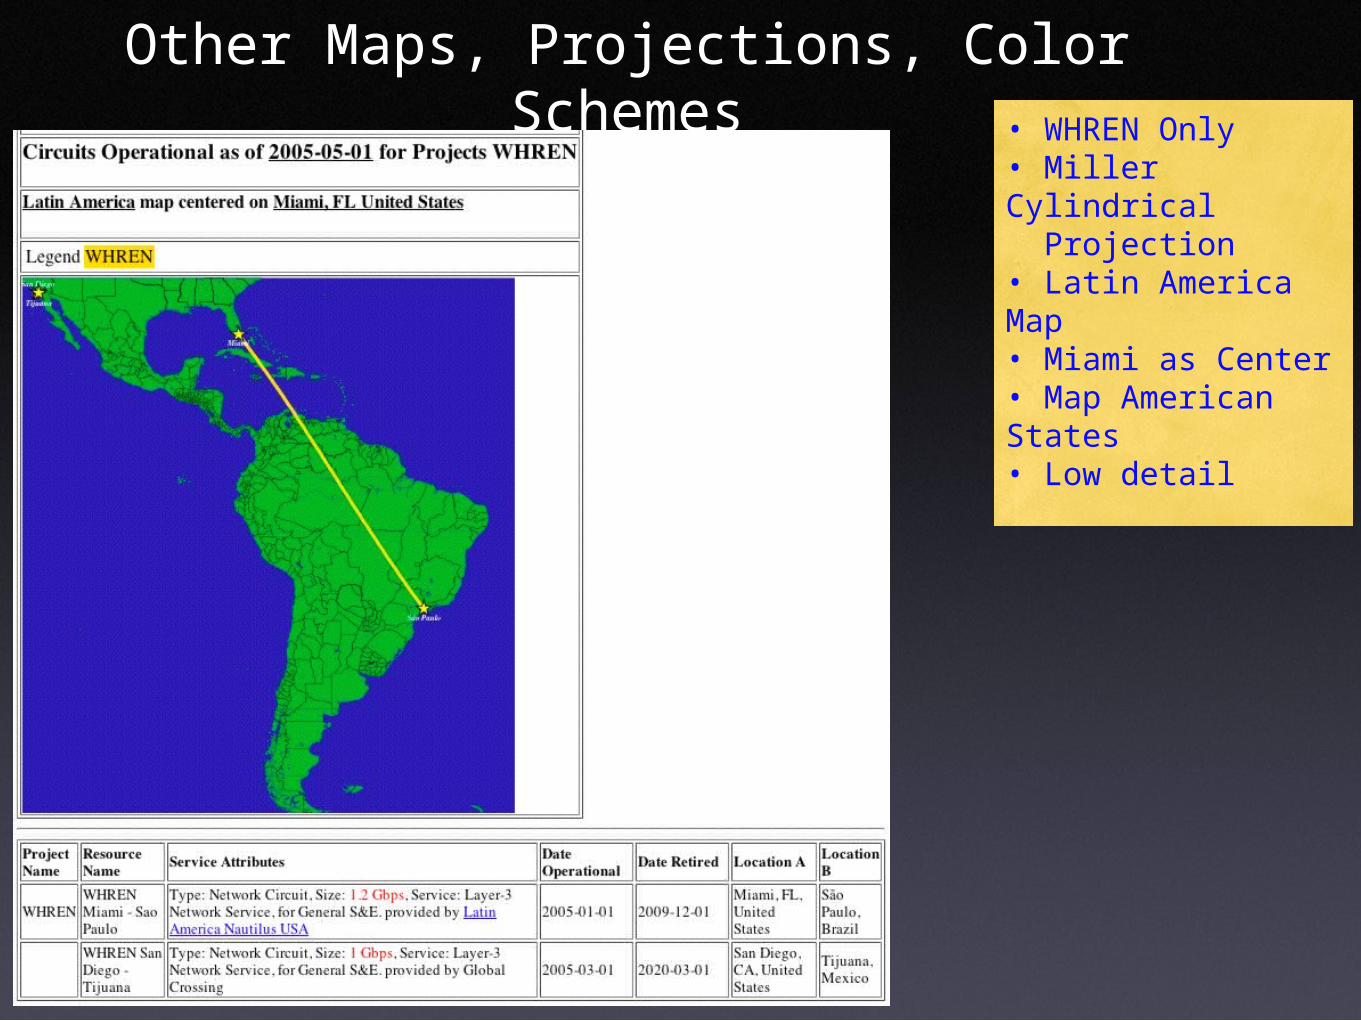
Other Maps, Projections, Color Schemes• WHREN Only• Miller Cylindrical Projection• Latin America Map• Miami as Center• Map American States• Low detail
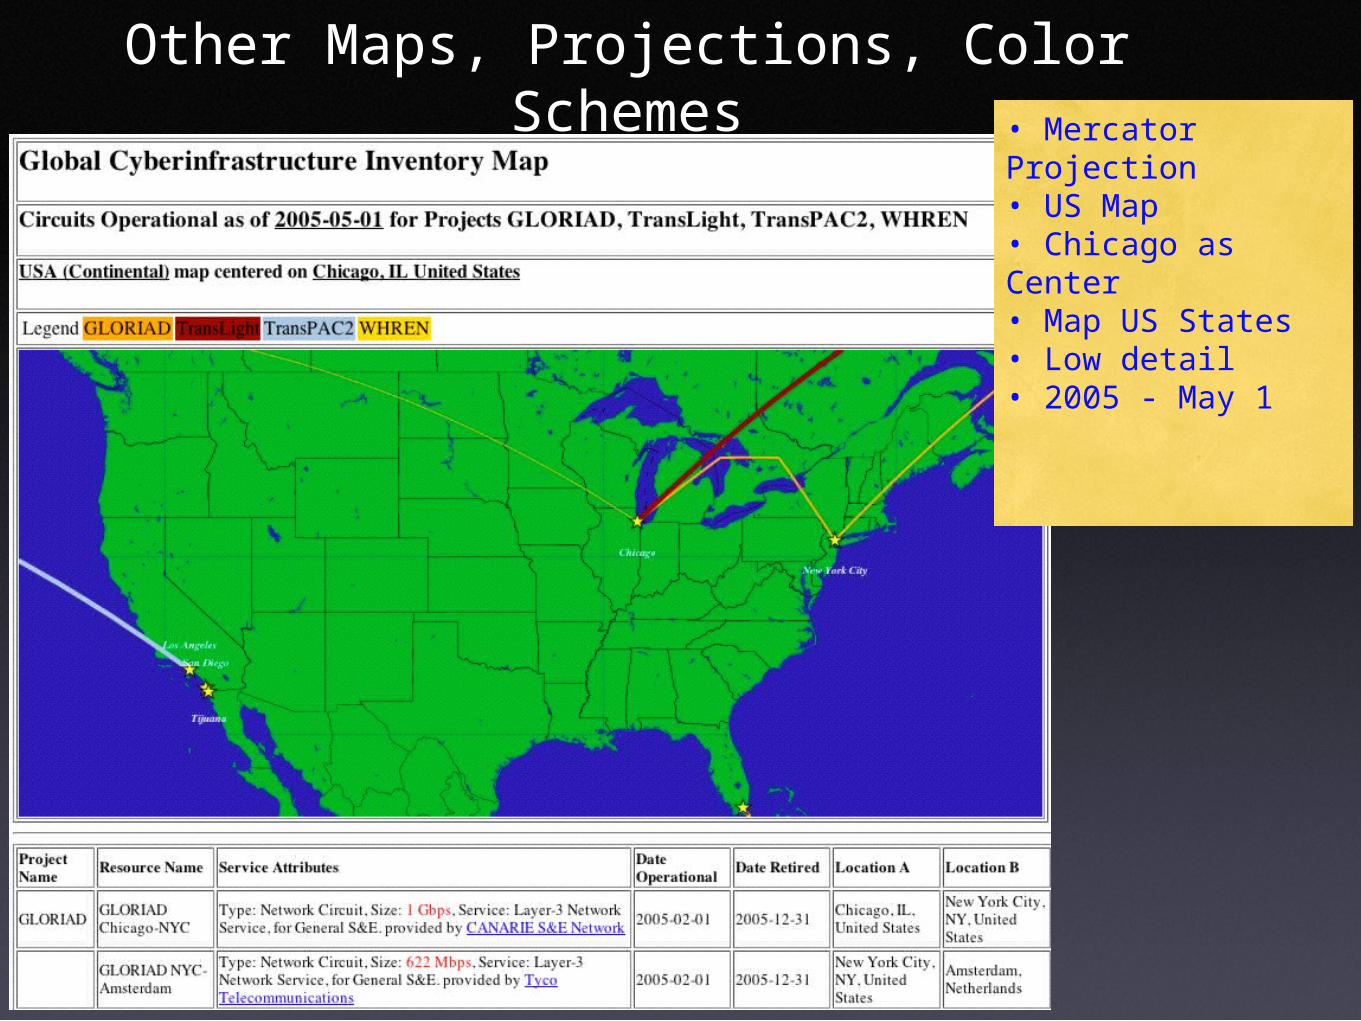
Other Maps, Projections, Color Schemes• Mercator Projection• US Map• Chicago as Center• Map US States• Low detail• 2005 - May 1

Other Maps, Projections, Color Schemes• Mercator Projection• US Map• Chicago as Center• Map US States• Low detail• 2006 - May 1
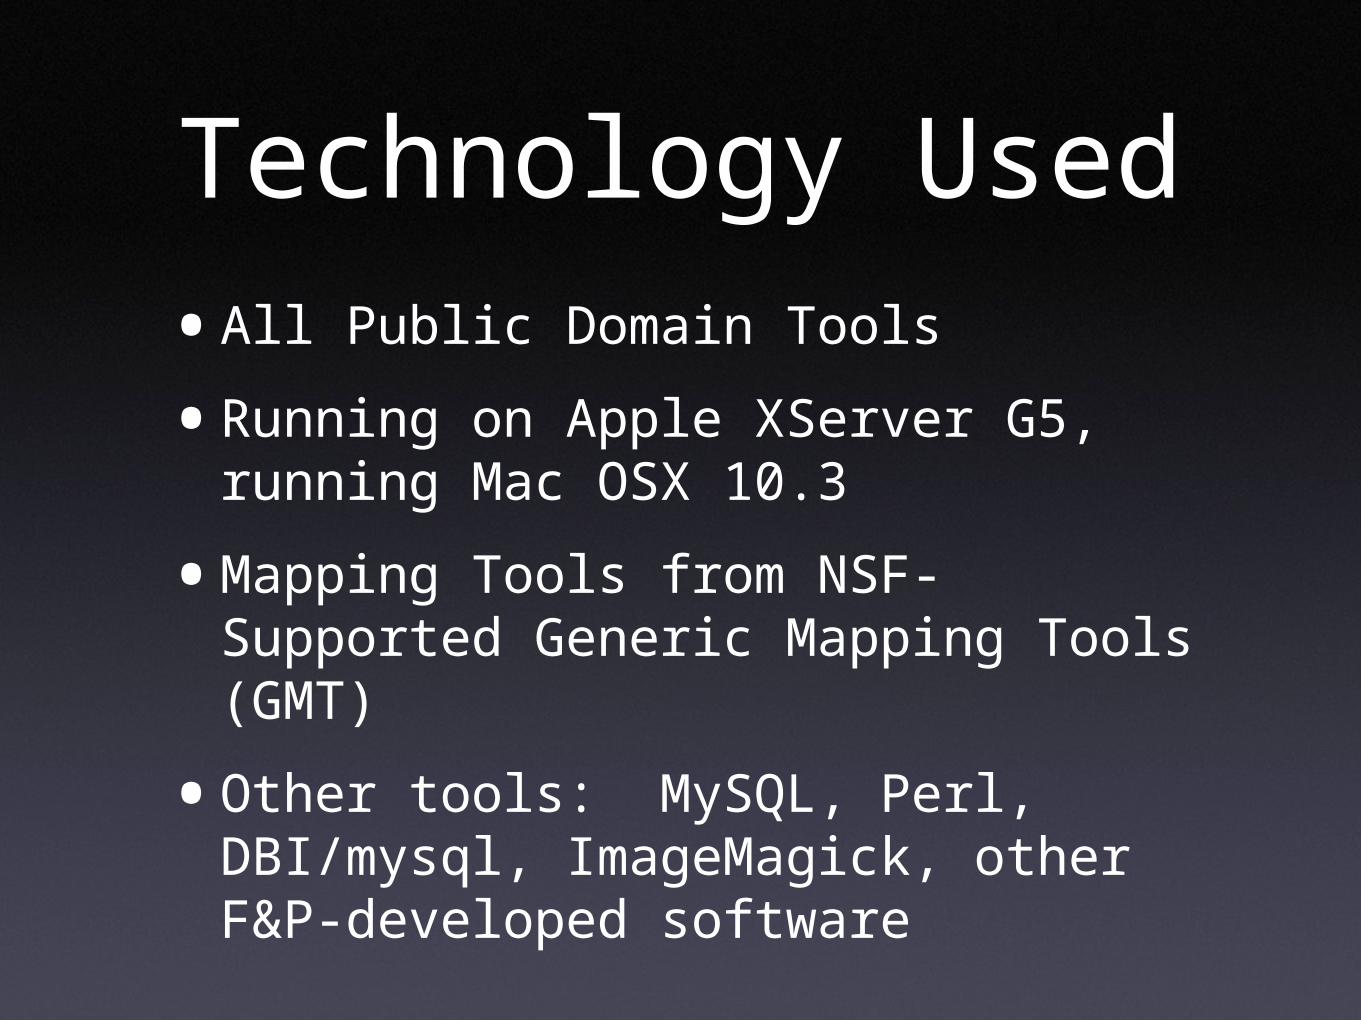
Technology Used
•All Public Domain Tools
•Running on Apple XServer G5, running Mac OSX 10.3
•Mapping Tools from NSF-Supported Generic Mapping Tools (GMT)
•Other tools: MySQL, Perl, DBI/mysql, ImageMagick, other F&P-developed software
Summary•Prototype system available for testing,
further development
•It is a rough prototype - potentially useful for motivating discussion on a shared, globally accessible, useful inventory and GIS tool for tracking and planning cyberinfrastructure deployment
•Effort planned during summer 2005 to migrate to Java/Flash-based application
Summary•Need to add map legend and
circuit/arc labels
•Working on incorporating “living earth” data so that images are better “colored” (with real satellite imagery data)
•Need better method of adjusting arc “angles” (currently, can add intermediate plot points to change arc paths)
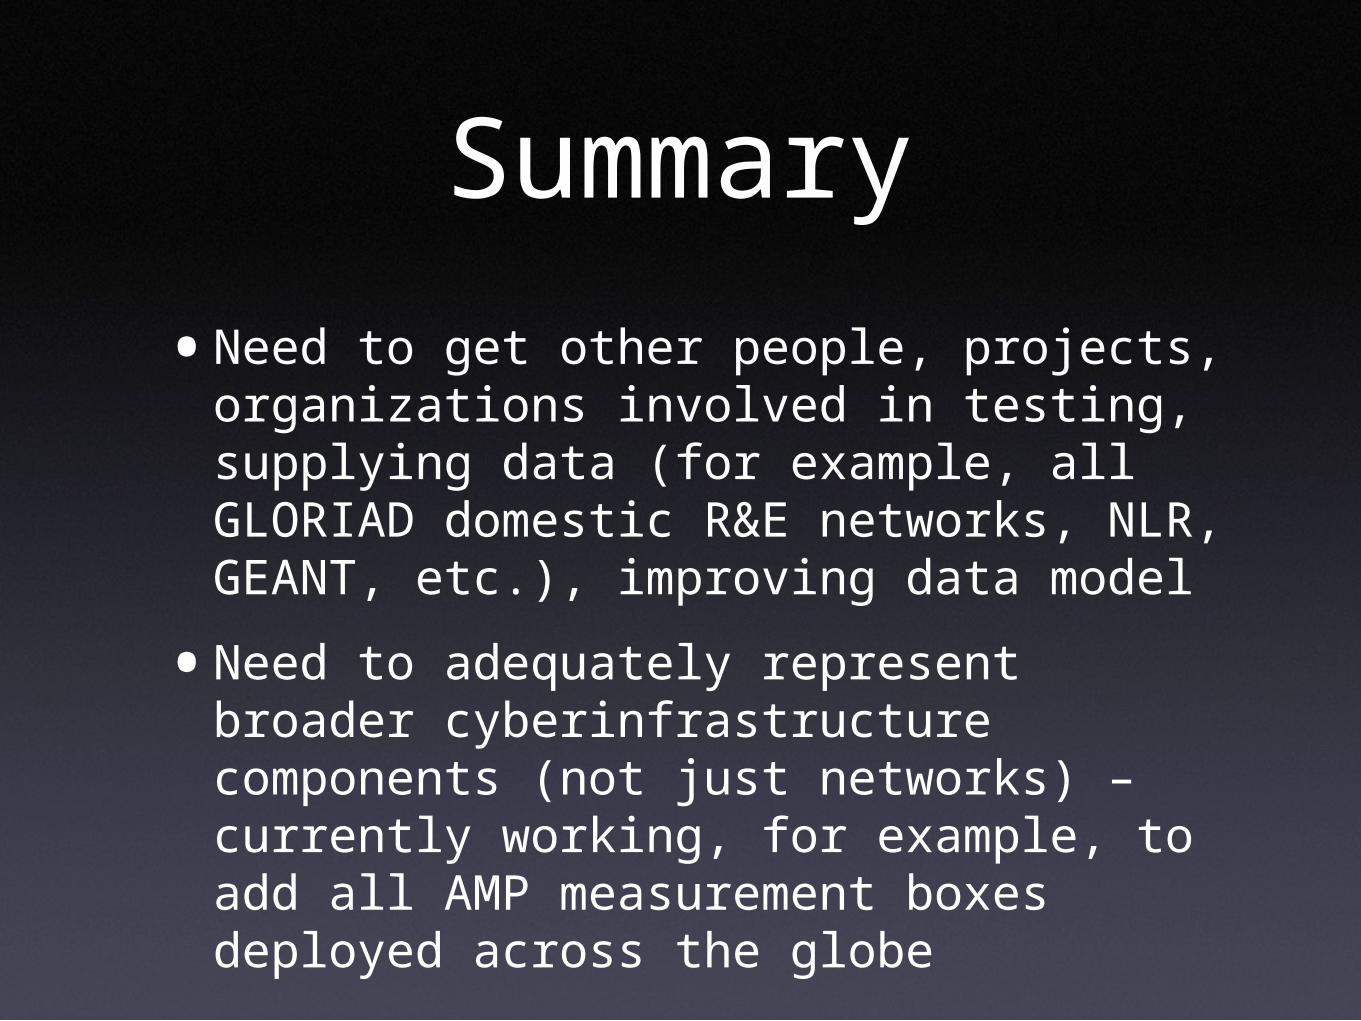
Summary•Need to get other people, projects,
organizations involved in testing, supplying data (for example, all GLORIAD domestic R&E networks, NLR, GEANT, etc.), improving data model
•Need to adequately represent broader cyberinfrastructure components (not just networks) – currently working, for example, to add all AMP measurement boxes deployed across the globe
For More Information
contact Greg Cole, Natasha Bulashovaof US-Russia Friends & Partners Program
[email protected]@friends-partners.org


![Randolph Glacier Inventory: A Dataset of Global Glacier ... · Zheltyhina. 2012, Randolph Glacier Inventory [v2.0]: A Dataset of Global Glacier Outlines. Global Land Ice Measurements](https://img.pdfslide.us/doc/110x75/5f1037d37e708231d448062a/randolph-glacier-inventory-a-dataset-of-global-glacier-zheltyhina-2012-randolph.jpg)