Embed Size (px)
Citation preview
SITRA_User_Guide_Rev2.docx - 1 – © Crown copyright 2008
Global Climate Screening Tool – User Guide
Revision 2 Sitra 31st May 2016 Samantha Mullan, Steven Wade, Rosa Barciela & Michael Sanderson

If printing double sided you will need this blank page. If printing single sided, please
delete this page.

1
© British Crown copyright 2016, Met Office
Contents
Glossary ......................................................................................................................... 3
Introduction ................................................................................................................... 4
Aim .............................................................................................................................. 4
User Guide ..................................................................................................................... 5
0. Instructions ........................................................................................................... 6
1. Control .................................................................................................................. 6
2. Score Card ......................................................................................................... 12
3. Data .................................................................................................................... 13
4. Impacts ............................................................................................................... 15
Overall Risk Rating ..................................................................................................... 16
References ................................................................................................................... 17
Annex I ......................................................................................................................... 18
2
© British Crown copyright 2016, Met Office
The Licensee’s use of the Data under this Licence is entirely at the Reader’s own risk.
The UK Met Office makes no warranty, representation or guarantee that the Data is or
will be error free.
The UK Met Office does not warrant that the Data will be fit for the Reader’s intended
use and the Reader is responsible for undertaking its own evaluation exercise before
choosing to rely upon the content of the Data.
The UK Met Office excludes all warranties or representations (express or implied)
including any in respect of the accuracy, compatibility, performance or fitness for
purpose of the Data to the fullest extent permitted by applicable law.
For more information see Annex I.

3
© British Crown copyright 2016, Met Office
Glossary
Adaptation Actions taken to adapt to a future, changing climate to cope with, for
example, rising sea-levels, changes in rainfall amounts or intensity and
increases in heatwave duration and severity.
AR5 IPCC Fifth Assessment Report
CMIP5 Coupled Model Intercomparison Project Phase 5
COP21 Conference of the Parties
HDCC Human Dynamics of Climate Change
INDC Intended Nationally Determined Contributions
IPCC Intergovernmental Panel on Climate Change
KNMI The Royal Netherlands Meteorological Institute/Koninklijk Nederlands
Meteologisch Instituut
Mitigation Actions taken to prevent given levels of climate change occurring. This is
usually achieved by decreasing the amount of greenhouse gases present
in the atmosphere through reducing emission rates or enhancing
processes which remove these gases.
Projections Climate model experiments run using plausible estimates for future
greenhouse gas emissions and other processes that affect the climate to
provide best possible information for future conditions. Different scenarios
can be created by using different emission models.
RCP8.5 This RCP scenario has continued increases in atmospheric greenhouse
gas concentrations throughout the 21st century.
RCPs Representative Concentration Pathways
UK United Kingdom
UN FAO United Nations Food and Agriculture Organization
UNFCCC United Nations Framework Convention on Climate Change

4
© British Crown copyright 2016, Met Office
Introduction
The United Kingdom (UK) Met Office has been commissioned by Sitra, the Finnish
Innovation Fund, to develop a climate screening tool. This report acts as a user guide.
The Met Office has produced an additional technical report to accompany this report and
the climate screening tool.
Organisations in Finland and the Nordics are keen to protect themselves from future
global hazards affecting their business. Assessments of risks related to resource
availability and other megatrends influencing the business environment are thought to be
ahead of those from climate change. For this reason Sitra, the Finnish Innovation Fund,
commissioned the development of the climate screening tool to enable Finnish
organisations to understand and manage potential risks associated with climate change.
The tool has been tested and developed in collaboration with Fortum and the Climate
Leadership Council in Finland, and it is made available for all Finnish companies and the
wider public by Sitra with the aim of encouraging companies to assess and evaluate
their climate risks.
Aim
The climate change screening tool (and this report) aims to provide a high level tool to
inform business users of the risks of climate change which may influence their
operations. It is designed as an initial “entry point” to enable users to start considering
future risks and in cases where the tool indicates medium or high risks, users are
directed to further information. All the information used is ‘broad scale’, from global
assessments and is suitable for initial screening work only. Any detailed site
assessments require more detailed information.
In addition, the climate screening tool can be used to determine whether a risk exists,
the high level consquences of the risk and whether further consideration of the risk is
required. By highlighting the potential high level risks of climate change on business
operations these can be considered in more detail to be included in companies risk
registers. Note: The tool does not provide bespoke consultancy nor does it provide
adaptation or mitigation advice for the highlighted risks of climate change.
An overview of climate change is provided in the Technical Report.

5
© British Crown copyright 2016, Met Office
User Guide
This section provides information on how to use the tool and also how to interpret the
results of the climate screening tool. The tool takes into account the magnitude of the
physical changes resulting directly (biophysical) and indirectly (socio-economic changes)
from climate change and the ability of the countries in the chosen region to mitigate and
adapt to climate change. The tool ultimately provides an overall risk score/rating.
Further details are provided in Overall Risk Rating section and for further information see
the Technical report – Overall Risk Rating section.
All worksheets in the climate change screening tool have been formatted to be easily
printed or saved as pdf documents. There are also “user notes” boxes which can be
populated with any notes which are specific to your business or operation.
Hint: if using the climate screening tool for multiple regions, sectors or operations then
save the spreadsheet with a different name in order to provide an audit process. Always
use the template file to undertake each new analysis/assessment.
Hint: when using the tool, please make sure you selected meaningful combinations in
the “1. Control” worksheet when changing the input parameters. Also, please ensure
you have selected an option for each input parameter drop-down menus in order.
The climate screening tool consists of six worksheets:
0. Instructions
1. Control
2. Score card
3. Data
4. Impacts all sectors
5. Bibliography
A summary of each worksheet is provided below.
The tool is compatible with Excel 2007, 2010 and 2013.
6 © British Crown copyright 2016, Met Office
0. Instructions
This worksheet provides a summarised version of the instructions in this user guide.
Alternatively, click on the “instructions” cell shaded dark grey in the top left corner on
each of the worksheets within the climate screening tool which will generate summarised
instructions.
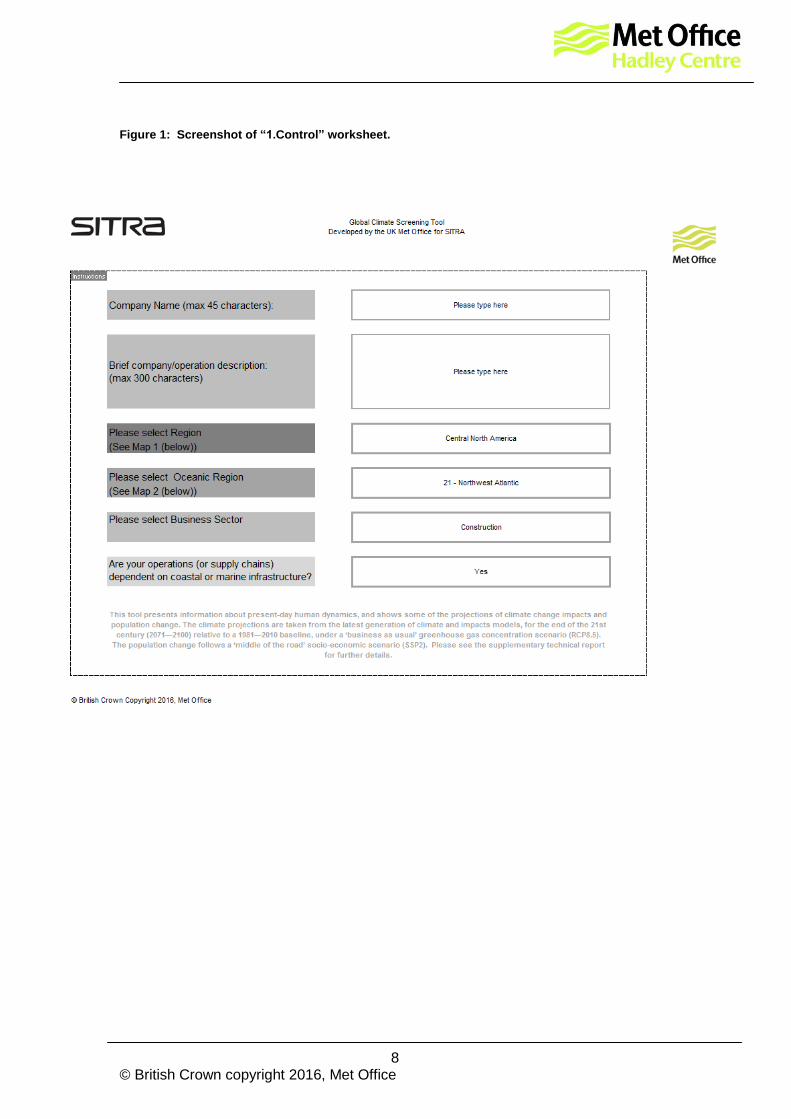
1. Control
This worksheet requires the user to make four selections, see Figure 1.
In order to make a selection click on the gray outlined boxes, an arrow will appear to
the right of the box, click on the arrow and a drop-down menu will be generated enabling
the selection of options.
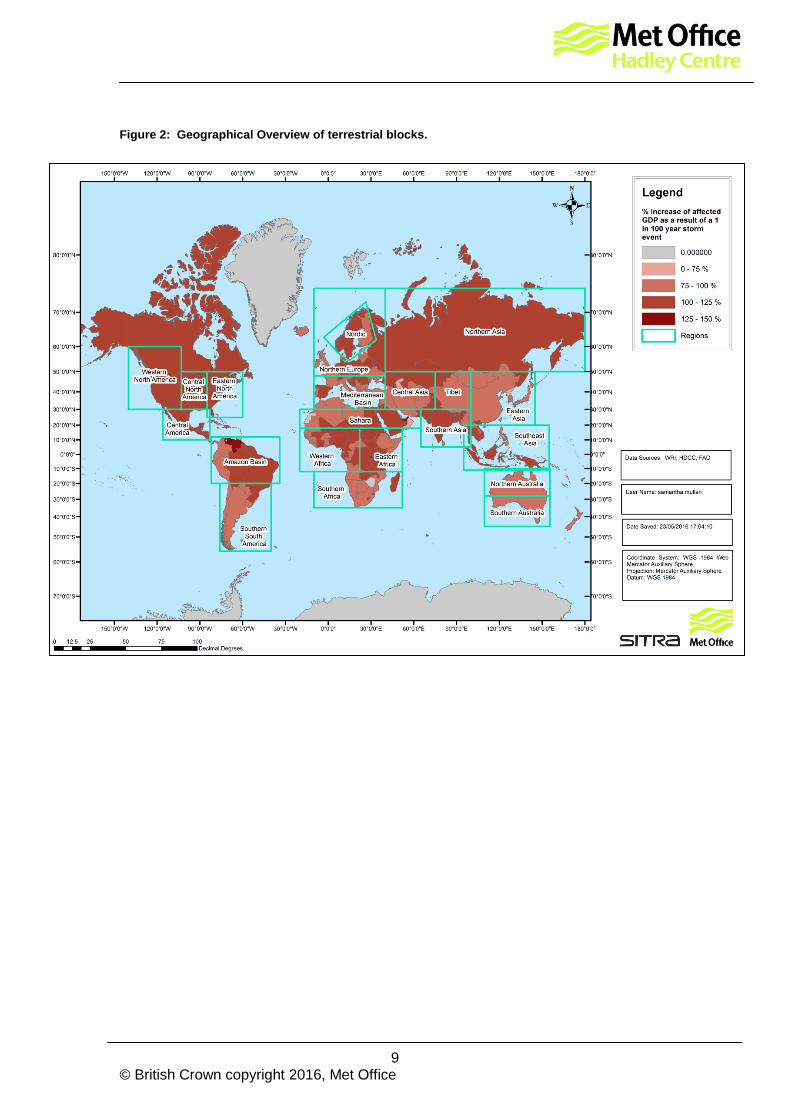
1. Section of land region. This refers to the terrestrial block where the operation
will occur. A geographical figure is provided on this worksheet to help the user
identify which block they should select. The options are presented in Table 1,
Figure 1 and Figure 2.
2. Selection of oceanic region. This option will provide a selection of oceanic
regions to select based on the terrestrial block chosen in question one. A
geographical figure is provided on this worksheet to help the user identify which
block they should select. These regions are equivalent to the fishing regions
defined by the UN Food and Agriculture Organization (FAO). The available
options of oceanic regions are presented in Table 1 and Figure 3.
Note: even if you do not have any marine options, please select the most
appropriate oceanic region in order to correctly populate the databases; the next
option will enable the user to discount this region from affecting the Overall Risk
Rating.
3. Selection of business sector. Please select the most appropriate option for
your business or operation being assessed. This will affect the vulnerability and
risk scores generated. The business sector options are:
Transportation
Wholesale and retail trade
Agriculture, forestry and fishing
7
© British Crown copyright 2016, Met Office
Manufacturing
Construction
Energy
And Other industries (including water)
Hint: if your operations cover multiple business sectors then save the
spreadsheet with a different name in order to allow a cross comparison of key
parameters and climate trends across the business. The score cards can be
printed or exported as pdfs to allow easy contrast. Always use the template file
to undertake each new analysis/assessment.
4. Selection of whether the assessed operations (or supply chains) are dependent
on coastal or marine infrastructure. The two choices are “Yes” or “No”.
This selection will affect which climatic changes are accounted for in the
generation of the risk score. Examples of dependencies could include but not
limited to:
Freight shipping
Dependency on ports and harbours
Coastal infrastructure/buildings
Marine infrastructure
And Aquaculture or wild fishing
Additional (optional) inputs include company name (45 character limit) and a brief
description of the company/operation (300 character limit).
8
© British Crown copyright 2016, Met Office
Figure 1: Screenshot of “1.Control” worksheet.
9
© British Crown copyright 2016, Met Office
Figure 2: Geographical Overview of terrestrial blocks.

10 © British Crown copyright 2016, Met Office
Figure 3: Geographical Overview of oceanic blocks.

11 © British Crown copyright 2016, Met Office
Table 1: Terrestrial and Oceanic Region combinations for selection in the “1. Control” worksheet.
Terrestrial regions
Oceanic/FAO Regions To select from:
Nordic 27 - Northeast Atlantic
Amazon Basin 41 - Southwest Atlantic
87 - Southeast Pacific
31 - Western Central Atlantic
77 - Eastern Central Pacific
Central America
31 - Western Central Atlantic
77 - Eastern Central Pacific
Central Asia 51 - Western Indian Ocean
37 - Mediterranean and Black Sea
Central North America
31 - Western Central Atlantic
77 - Eastern Central Pacific
21 - Northwest Atlantic
67 - Northeast Pacific
Eastern Africa 51 - Western Indian Ocean
Eastern Asia 61 - Northwest Pacific
Eastern North America
21 - Northwest Atlantic
31 - Western Central Atlantic
Mediterranean Basin
37 - Mediterranean and Black Sea
Northern Asia 18 - Arctic Sea 61 - Northwest Pacific
67 - Northeast Pacific
Northern Australia
57 - Eastern Indian Ocean
71 - Western Central Pacific
Northern Europe
27 - Northeast Atlantic
Southern Africa
47 - Southeast Atlantic
51 - Western Indian Ocean
Sahara 37 - Mediterranean and Black Sea
34 - Eastern Central Atlantic
51 - Western Indian Ocean
Southern Asia 51 - Western Indian Ocean
57 - Eastern Indian Ocean
Southern Australia
57 - Eastern Indian Ocean
71 - Western Central Pacific
Southeast Asia 57 - Eastern Indian Ocean
71 - Western Central Pacific
Southern South America
41 - Southwest Atlantic
87 - Southeast Pacific
88 - Antarctic Pacific
48 - Antarctic Atlantic
Tibet 51 - Western Indian Ocean
57 - Eastern Indian Ocean
61 - Northwest Pacific
71 - Western Central Pacific
Western Africa 34 - Eastern Central Atlantic
47 - Southeast Atlantic
Western North America
67 - Northeast Pacific
71 - Western Central Pacific

12 © British Crown copyright 2016, Met Office
2. Score Card The score card is designed to provide high level information and key messages for each
assessment/selection. All projections are based on the RCP8.5 scenario and for the end
of century unless otherwise specified in the table headers.
The following information is presented:
The Overall Risk Rating (see Overall Risk Rating section)
A headline statement for the region
The key parameters in terms of the selected operation
Sector specific example impacts and mitigation and risk management actions
High level data table with confidence levels
A figure to provide global context
The Overall Risk Rating is presented as Very High, High, Medium or Low. Each
outcome then has a statement summarising the severity of this result and potential next
steps, see Table 2 and Overall Risk Rating section.
Table 2: Overall Risk Ratings with associated context and potential actions
Overall Risk Rating Context and Potential Actions
Very High A very high score indicates that there is a significant risk to businesses operating in the selected selector and region. In order to determine effective and strategic mitigation measures and to quantify the risk a detailed local or regional study may be required.
High A high score indicates that there is a relatively significant risk to businesses operating in the selected selector and region. In order to determine effective and strategic mitigation measures and to quantify the risk a detailed local or regional study may be required.
Medium A medium score indicates that there is a moderate risk to businesses operating in the selected selector and region. In order to determine whether strategic mitigation measures are required and to quantify the risk a detailed local or regional study may be required.
Low A low score indicates that there is a relatively insignificant risk to businesses operating in the selected selector and region. If an aspect of operations may be significantly affected by weather and climate then a local study may be required to quantify the risk.
The plot on the last page of the score card presents each of the regions in terms of their
vulnerability (ND-GAIN score) against their Overall Risk Rating (magnitude of climate
change and ability to adapt to the projected changes, see Overall Risk Rating). Each of
the regions is shaded depending on which continent they belong to. This allows the
user’s selection to be placed in both a global and continental context. The user’s
selection is presented as a red circle. The thresholds for the different overall risk scores
have been included on the plot (Medium, High and Very High). Points further to the right
of the x-axis indicate a higher vulnerability to climate change, in terms of socio
economics, and are less able to adapt. Points higher on the y-axis indicate higher
Overall Risk Ratings.

13 © British Crown copyright 2016, Met Office
Confidence Levels
We have presented a measure of confidence for each of the parameters presented,
ranging from “Low” to “Very High”. These confidence scores have been chosen by
available classifications in the IPCC AR5 reports (IPCC, 2013) and expert judgement.
Confidence scores are derived from the level of agreement and the amount of evidence
available, see Figure 4.
Figure 4: Illustrative example of confidence levels applied to each parameter.
Level of a
gre
em
ent
Very High
High High
Medium Medium
Low Low
Low Medium High
Amount of evidence
Other uncertainties such as natural variability, modelling uncertainty and rates of
important processes like melting of ice caps mean that results are presented as a range
of values for each specific emissions scenario and time period. The results presented in
the tool only cover a limited range of possible outcomes but provide a starting point for
high level risk assessment and awareness.
3. Data
This worksheet provides a greater range of data than the “2.Score card” worksheet; this
allows the user to understand the degree of uncertainty and the potential extremes. This
worksheet presents a large matrix of all of the projected climate change data for a wider
range of statistics including different percentile values, maximum and minimum values.
The database is generated based on the selection in the “1. Control” worksheet.
The matrix provides both biophysical and socioeconomic data for the region selected in
the “1. Control” worksheet. The data include:
Change in warm day temperatures (°C)
Changes in projected flood hazard (%)
Changes in drought (%)
Changes in water run-off (%)

14 © British Crown copyright 2016, Met Office
The global percentage of crops the region currently produces
Changes in crop yields (wheat, maize, rice and soya beans)
Changes in water demand for irrigation
Changes in precipitation
Changes in near surface temperature
The calculated ND-GAIN scores, measure of vulnerability and readiness to adapt
to climate change (see Technical report – ND-GAIN section.
Number of Top Ten Fund for Peace’s Fragile State Index Countries since 2005
Changes in population
Estimated risks to GDP from flooding under different storm events
In addition, this worksheet also provides a range of data for the oceanic region selected
including:
Quantity of oil transport choke points and quantity of oil transported through it
Changes in sea surface temperature
Quantity of fish catch in 2011
All projected data are based on the RCP8.5 scenario. Data presented as a relative
change have been extracted from a baseline 1981-2010 (1985 to 2005*) and a future
projection of 2071-2100 (or 2081-2100*). The different time periods are due to the
availability and analysis of data from different sources. For more information about the
datasets used in the tool see the Technical Report – Data Sources section.
* Data extracted from the Coupled Model Intercomparison Project Phase 5 (CMIP5)
(IPCC Fifth Assessment Report (AR5) Atlas subset) models were extracted for RCP 8.5
as a relative change from 1985-2005 (baseline) to 2081-2100 (projection) under the
RCP8.5 scenario.

15 © British Crown copyright 2016, Met Office
4. Impacts
The worksheet “4. Impacts all sectors” provides a database of potential impacts which
may affect businesses across all sectors. The database provides example impacts and
mitigation/risk management actions which could affect all business sectors. The
database can be filtered on direct or indirect impacts, the impact itself, the confidence
level or by the example adaptation/risk management options.
This table is designed to supplement the risks presents in the “2. Score card” worksheet.

16 © British Crown copyright 2016, Met Office
Overall Risk Rating The climate screening tool presents an Overall Risk Rating to help contextualise the
results and data for the user. This score has been developed by the UK Met Office for
the climate screening tool. The tool will calculate one of four qualitative scores – Very
High, High, Medium or Low, see Table 2. These scores have been numerically
calculated as a function of the socio-economic vulnerability (see Technical Report –
ND-GAIN section) and the relative severity of projected climatic change for the selected
block.

17 © British Crown copyright 2016, Met Office
References Giorgi, F. R. Francisco, Evaluating uncertainties in the prediction of regional climate
change, GRL (2000)
IPCC, 2013: Summary for Policymakers. In: Climate Change 2013: The Physical Science
Basis. Contribution of Working Group I to the Fifth Assessment Report of the
Intergovernmental Panel on Climate Change [Stocker, T.F., D. Qin, G.-K. Plattner, M.
Tignor, S.K. Allen, J. Boschung, A. Nauels, Y. Xia, V. Bex and P.M. Midgley (eds.)].
Cambridge University Press, Cambridge, United Kingdom and New York, NY, USA.
IPCC, 2016,Intergovernmental Panel on Climate Change, accessible from:
http://www.ipcc.ch/
KNMI, no date, KNMI Climate Change Atlas, accessible from: https://climexp.knmi.nl/
plot_atlas_form.py
The UK Met Office, 2013, Human dynamics of climate change, accessible from:
http://www.metoffice.gov.uk/climate-guide/climate-change/impacts/human-dynamics/.
The UK Met Office, 2015, What is climate change?, accessible from:
http://www.metoffice.gov.uk/climate-guide/climate-change
University of Notre Dame, 2013, University of Notre Dame Global Adaptation Index -
Detailed Methodology Report, accessible from:
http://www3.nd.edu/~nchawla/methodology.pdf
World Resources Institute, 2015, Aqueduct Global Flood Analyzer, accessible from:
http://www.wri.org/resources/maps/aqueduct-global-flood-analyzer
18 © British Crown copyright 2016, Met Office
Annex I The UK Met Office aims to ensure that the content of this document is accurate and consistent
with its best current scientific understanding. However, the science which underlies
meteorological forecasts and climate projections is constantly evolving. Therefore, any element
of the content of this document which involves a forecast or a prediction should be regarded as
our best possible guidance, but should not be relied upon as if it were a statement of fact. To the
fullest extent permitted by applicable law, the UK Met Office excludes all warranties or
representations (express or implied) in respect of the content of this document.
Use of the content of this document is entirely at the reader’s own risk. The UK Met Office makes
no warranty, representation or guarantee that the content of this document is error free or fit for
your intended use.
Before taking action based on the content of this document, the reader should evaluate it
thoroughly in the context of his/her specific requirements and intended applications. To the fullest
extent permitted by applicable law, the Met Office, its employees, contractors or subcontractors,
hereby disclaim any and all liability for loss, injury or damage (direct, indirect, consequential,
incidental or special) arising out of or in connection with the use of the content of this document
including without limitation any and all liability:
relating to the accuracy, completeness, reliability, availability, suitability, quality,
ownership, non-infringement, operation, merchantability and fitness for purpose of the
content of this document;
relating to its work procuring, compiling, interpreting, editing, reporting and publishing the
content of this document; and
resulting from reliance upon, operation of, use of or actions or decisions made on the
basis of, any facts, opinions, ideas, instructions, methods, or procedures set out in this
document.
This does not affect the UK Met Office’s liability for death or personal injury arising from the UK
Met Office’s negligence, nor the UK Met Office’s liability for fraud or fraudulent misrepresentation,
nor any other liability which cannot be excluded or limited under applicable law.
If any of these provisions or part provisions are, for any reason, held to be unenforceable, illegal
or invalid, that unenforceability, illegality or invalidity will not affect any other provisions or part
provisions which will continue in full force and effect.

19 © British Crown copyright 2016, Met Office
Accreditations Notre Dame –Global Adaptation Index (ND-GAIN) - University of Notre dame, © 2014 Copyright Notre Dame Global Adaptation Index, http://creativecommons.org/licenses/by/3.0/legalcode, http://index.gain.org/ Flood analyzer data -World Resources Institue, http://creativecommons.org/licenses/by/3.0/legalcode, http://floods.wri.org/#/ Intergovernmental Panel on Climate Change (IPCC) -IPCC, 2013: IPCC, 2013: Summary for Policymakers. In: Climate Change 2013: The Physical Science Basis. Contribution of Working Group I to the Fifth Assessment Report of the Intergovernmental Panel on Climate Change [Stocker, T.F., D. Qin, G.-K. Plattner, M. Tignor, S.K. Allen, J. Boschung, A. Nauels, Y. Xia, V. Bex and P.M. Midgley (eds.)]. Cambridge University Press, Cambridge, United Kingdom and New York, NY, USA. The Royal Netherlands Meteorological Institute (KNMI) - https://climexp.knmi.nl/plot_atlas_form.py?id=someone@somewhere Creative Commons Licence: http://creativecommons.org/licenses/by/3.0/legalcode Creative Commons disclaimer: This deed highlights only some of the key features and terms of the actual license. It is not a licence and has no legal value. You should carefully review all of the terms and conditions of the actual licence before using the licensed material. Creative Commons is not a law firm and does not provide legal services. Distributing, displaying or linking this deed or the licence that it summarizes does not create a lawyer-client or any other relationship.
20 © British Crown copyright 2016, Met Office

Met Office FitzRoy Road, Exeter Devon EX1 3PB United Kingdom
Tel (UK): 0370 900 0100 (Int): +44 1392 885680 Fax (UK): 0370 900 5050 (Int): +44 1392 885681 [email protected] www.metoffice.gov.uk