Embed Size (px)
Citation preview
Global climate impacts of the AMOC slowdown caused by Arctic sea ice decline
Holden Leslie-Bole Alexey Fedorov and Mary-Louise Timmermans
May 2, 2018 Senior Thesis presented to the faculty of the Department of Geology and Geophysics, Yale University, in partial fulfillment of the Bachelor’s Degree. In presenting this thesis in partial fulfillment of the Bachelor’s Degree from the Department of Geology and Geophysics, Yale University, I agree that the department may make copies or post it on the departmental website so that others may better understand the undergraduate research of the department. I further agree that extensive copying of this thesis is allowable only for scholarly purposes. It is understood, however, that any copying or publication of this thesis for commercial purposes or financial gain is not allowed without my written consent. Holden Leslie-Bole, May 2, 2018
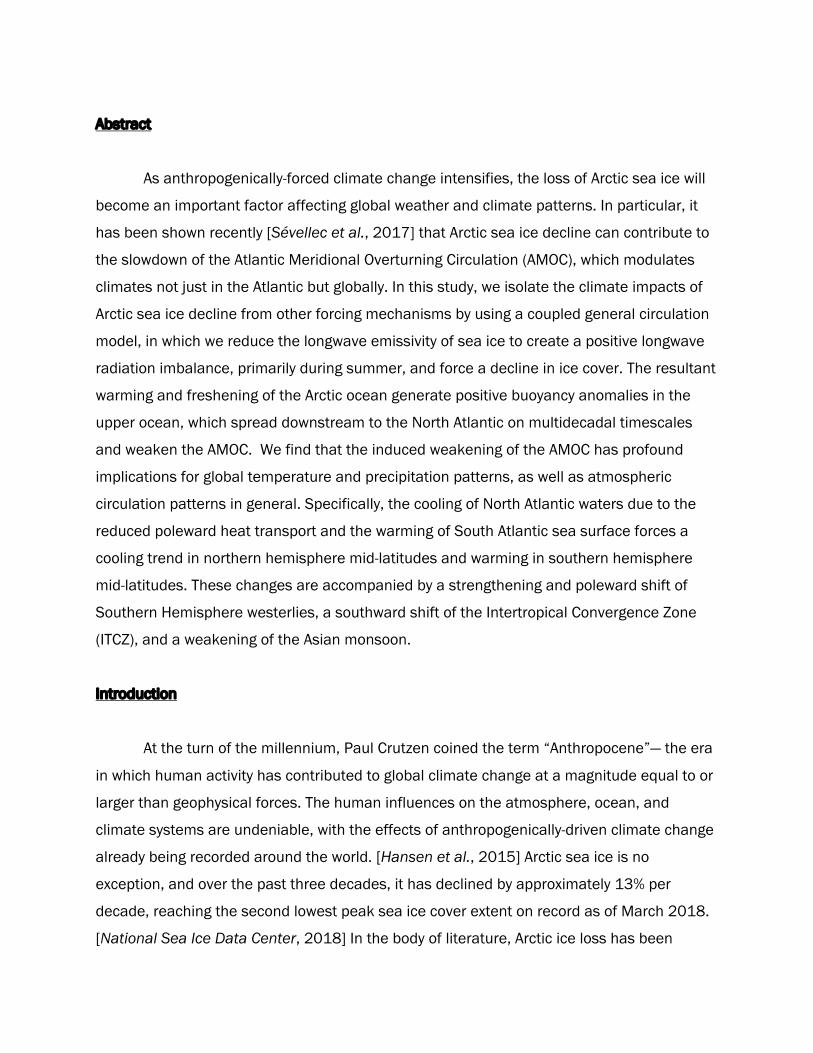
Abstract
As anthropogenically-forced climate change intensifies, the loss of Arctic sea ice will
become an important factor affecting global weather and climate patterns. In particular, it
has been shown recently [Sévellec et al., 2017] that Arctic sea ice decline can contribute to
the slowdown of the Atlantic Meridional Overturning Circulation (AMOC), which modulates
climates not just in the Atlantic but globally. In this study, we isolate the climate impacts of
Arctic sea ice decline from other forcing mechanisms by using a coupled general circulation
model, in which we reduce the longwave emissivity of sea ice to create a positive longwave
radiation imbalance, primarily during summer, and force a decline in ice cover. The resultant
warming and freshening of the Arctic ocean generate positive buoyancy anomalies in the
upper ocean, which spread downstream to the North Atlantic on multidecadal timescales
and weaken the AMOC. We find that the induced weakening of the AMOC has profound
implications for global temperature and precipitation patterns, as well as atmospheric
circulation patterns in general. Specifically, the cooling of North Atlantic waters due to the
reduced poleward heat transport and the warming of South Atlantic sea surface forces a
cooling trend in northern hemisphere mid-latitudes and warming in southern hemisphere
mid-latitudes. These changes are accompanied by a strengthening and poleward shift of
Southern Hemisphere westerlies, a southward shift of the Intertropical Convergence Zone
(ITCZ), and a weakening of the Asian monsoon.
Introduction
At the turn of the millennium, Paul Crutzen coined the term “Anthropocene”— the era
in which human activity has contributed to global climate change at a magnitude equal to or
larger than geophysical forces. The human influences on the atmosphere, ocean, and
climate systems are undeniable, with the effects of anthropogenically-driven climate change
already being recorded around the world. [Hansen et al., 2015] Arctic sea ice is no
exception, and over the past three decades, it has declined by approximately 13% per
decade, reaching the second lowest peak sea ice cover extent on record as of March 2018.
[National Sea Ice Data Center, 2018] In the body of literature, Arctic ice loss has been
generally treated as a consequence of broader climatic changes, and the extent to which ice
cover loss forces shifts in other earth system processes needs to be examined. Sea ice
decline increases ocean surface heat and freshwater fluxes, leading to lower density surface
waters that can affect ocean circulation. It is important to isolate the climatic responses that
are solely associated with changes in sea-ice cover from other forcing mechanisms.
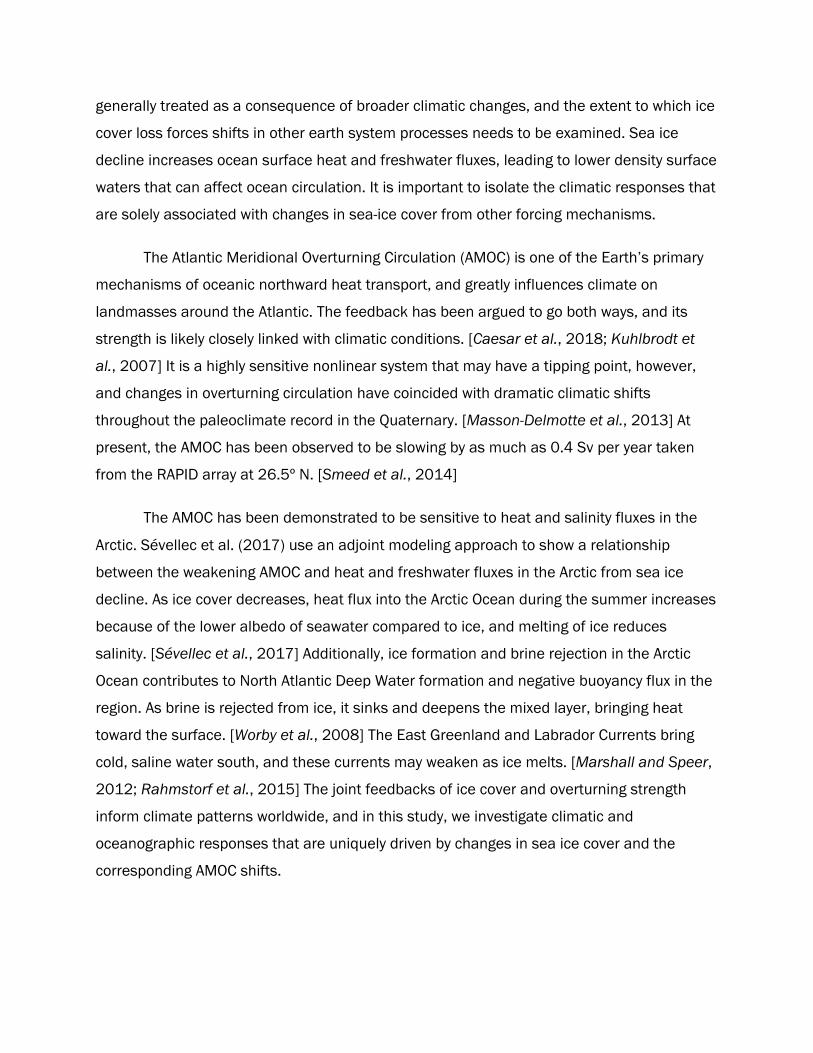
The Atlantic Meridional Overturning Circulation (AMOC) is one of the Earth’s primary
mechanisms of oceanic northward heat transport, and greatly influences climate on
landmasses around the Atlantic. The feedback has been argued to go both ways, and its
strength is likely closely linked with climatic conditions. [Caesar et al., 2018; Kuhlbrodt et
al., 2007] It is a highly sensitive nonlinear system that may have a tipping point, however,
and changes in overturning circulation have coincided with dramatic climatic shifts
throughout the paleoclimate record in the Quaternary. [Masson-Delmotte et al., 2013] At
present, the AMOC has been observed to be slowing by as much as 0.4 Sv per year taken
from the RAPID array at 26.5º N. [Smeed et al., 2014]
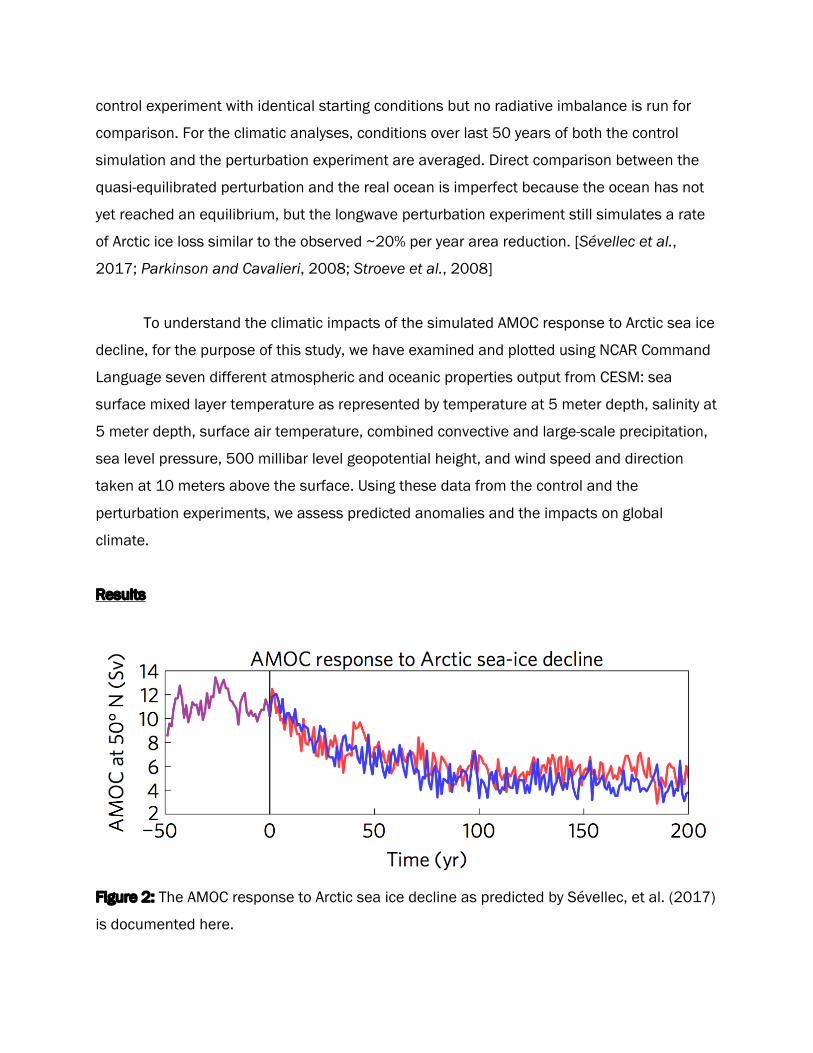
The AMOC has been demonstrated to be sensitive to heat and salinity fluxes in the
Arctic. Sévellec et al. (2017) use an adjoint modeling approach to show a relationship
between the weakening AMOC and heat and freshwater fluxes in the Arctic from sea ice
decline. As ice cover decreases, heat flux into the Arctic Ocean during the summer increases
because of the lower albedo of seawater compared to ice, and melting of ice reduces
salinity. [Sévellec et al., 2017] Additionally, ice formation and brine rejection in the Arctic
Ocean contributes to North Atlantic Deep Water formation and negative buoyancy flux in the
region. As brine is rejected from ice, it sinks and deepens the mixed layer, bringing heat
toward the surface. [Worby et al., 2008] The East Greenland and Labrador Currents bring
cold, saline water south, and these currents may weaken as ice melts. [Marshall and Speer,
2012; Rahmstorf et al., 2015] The joint feedbacks of ice cover and overturning strength
inform climate patterns worldwide, and in this study, we investigate climatic and
oceanographic responses that are uniquely driven by changes in sea ice cover and the
corresponding AMOC shifts.
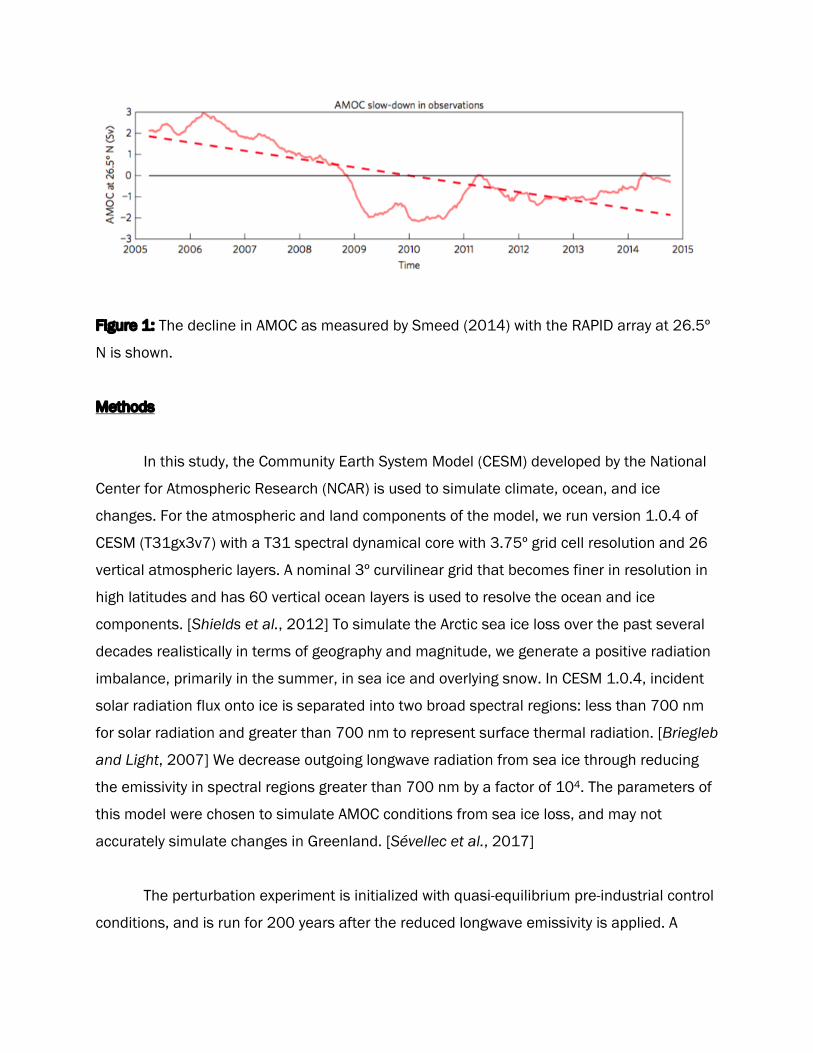
Figure 1: The decline in AMOC as measured by Smeed (2014) with the RAPID array at 26.5º
N is shown.
Methods
In this study, the Community Earth System Model (CESM) developed by the National
Center for Atmospheric Research (NCAR) is used to simulate climate, ocean, and ice
changes. For the atmospheric and land components of the model, we run version 1.0.4 of
CESM (T31gx3v7) with a T31 spectral dynamical core with 3.75º grid cell resolution and 26
vertical atmospheric layers. A nominal 3º curvilinear grid that becomes finer in resolution in
high latitudes and has 60 vertical ocean layers is used to resolve the ocean and ice
components. [Shields et al., 2012] To simulate the Arctic sea ice loss over the past several
decades realistically in terms of geography and magnitude, we generate a positive radiation
imbalance, primarily in the summer, in sea ice and overlying snow. In CESM 1.0.4, incident
solar radiation flux onto ice is separated into two broad spectral regions: less than 700 nm
for solar radiation and greater than 700 nm to represent surface thermal radiation. [Briegleb
and Light, 2007] We decrease outgoing longwave radiation from sea ice through reducing
the emissivity in spectral regions greater than 700 nm by a factor of 104. The parameters of
this model were chosen to simulate AMOC conditions from sea ice loss, and may not
accurately simulate changes in Greenland. [Sévellec et al., 2017]
The perturbation experiment is initialized with quasi-equilibrium pre-industrial control
conditions, and is run for 200 years after the reduced longwave emissivity is applied. A
control experiment with identical starting conditions but no radiative imbalance is run for
comparison. For the climatic analyses, conditions over last 50 years of both the control
simulation and the perturbation experiment are averaged. Direct comparison between the
quasi-equilibrated perturbation and the real ocean is imperfect because the ocean has not
yet reached an equilibrium, but the longwave perturbation experiment still simulates a rate
of Arctic ice loss similar to the observed ~20% per year area reduction. [Sévellec et al.,
2017; Parkinson and Cavalieri, 2008; Stroeve et al., 2008]
To understand the climatic impacts of the simulated AMOC response to Arctic sea ice
decline, for the purpose of this study, we have examined and plotted using NCAR Command
Language seven different atmospheric and oceanic properties output from CESM: sea
surface mixed layer temperature as represented by temperature at 5 meter depth, salinity at
5 meter depth, surface air temperature, combined convective and large-scale precipitation,
sea level pressure, 500 millibar level geopotential height, and wind speed and direction
taken at 10 meters above the surface. Using these data from the control and the
perturbation experiments, we assess predicted anomalies and the impacts on global
climate.
Results
Figure 2: The AMOC response to Arctic sea ice decline as predicted by Sévellec, et al. (2017)
is documented here.
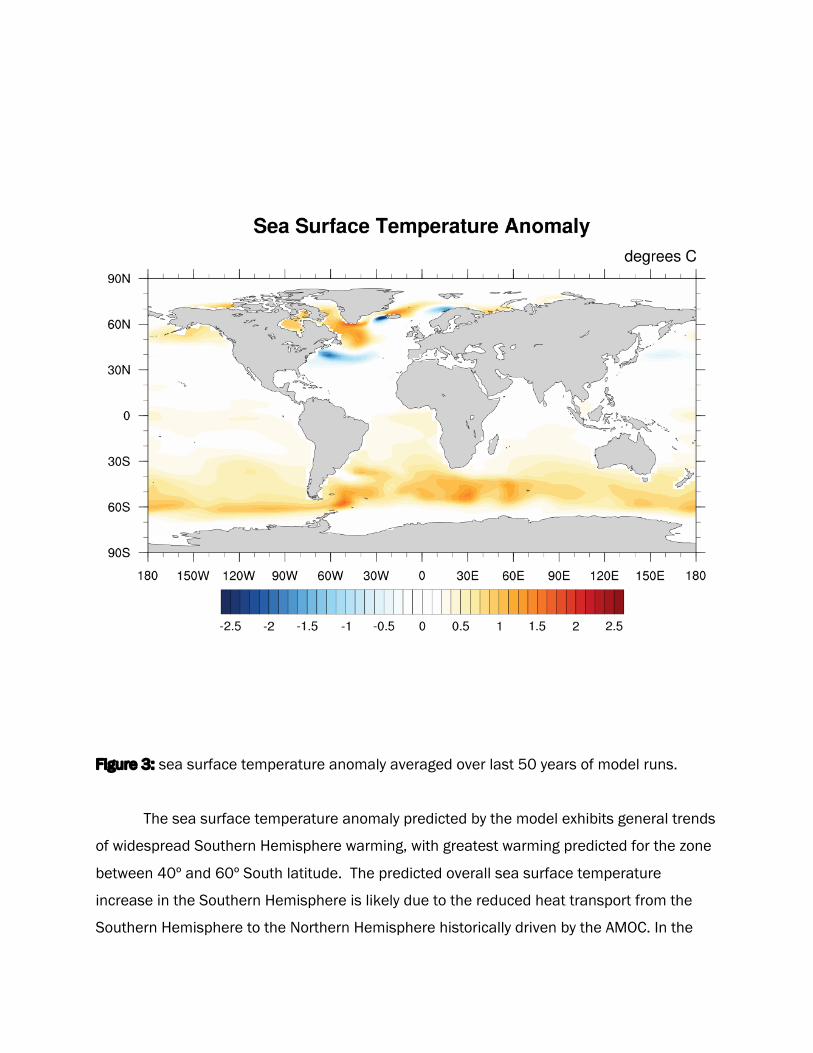
Figure 3: sea surface temperature anomaly averaged over last 50 years of model runs.
The sea surface temperature anomaly predicted by the model exhibits general trends
of widespread Southern Hemisphere warming, with greatest warming predicted for the zone
between 40º and 60º South latitude. The predicted overall sea surface temperature
increase in the Southern Hemisphere is likely due to the reduced heat transport from the
Southern Hemisphere to the Northern Hemisphere historically driven by the AMOC. In the
Southern Ocean, the areas east of the Drake Passage and south of Africa, zones with the
strongest deep water upwelling from the AMOC, show surfacing warming signals up to 1.5ºC
as upwelling rates decrease. Sea surface warming of up to 1.7ºC around Greenland is also
predicted, likely from decreased strength of the East Greenland and Labrador Currents.
In the northern hemisphere, relatively high-magnitude surface temperature increases
are predicted surrounding eastern North America north of 50º, with the highest increases
predicted to occur between the Canadian Maritime Provinces and Greenland.
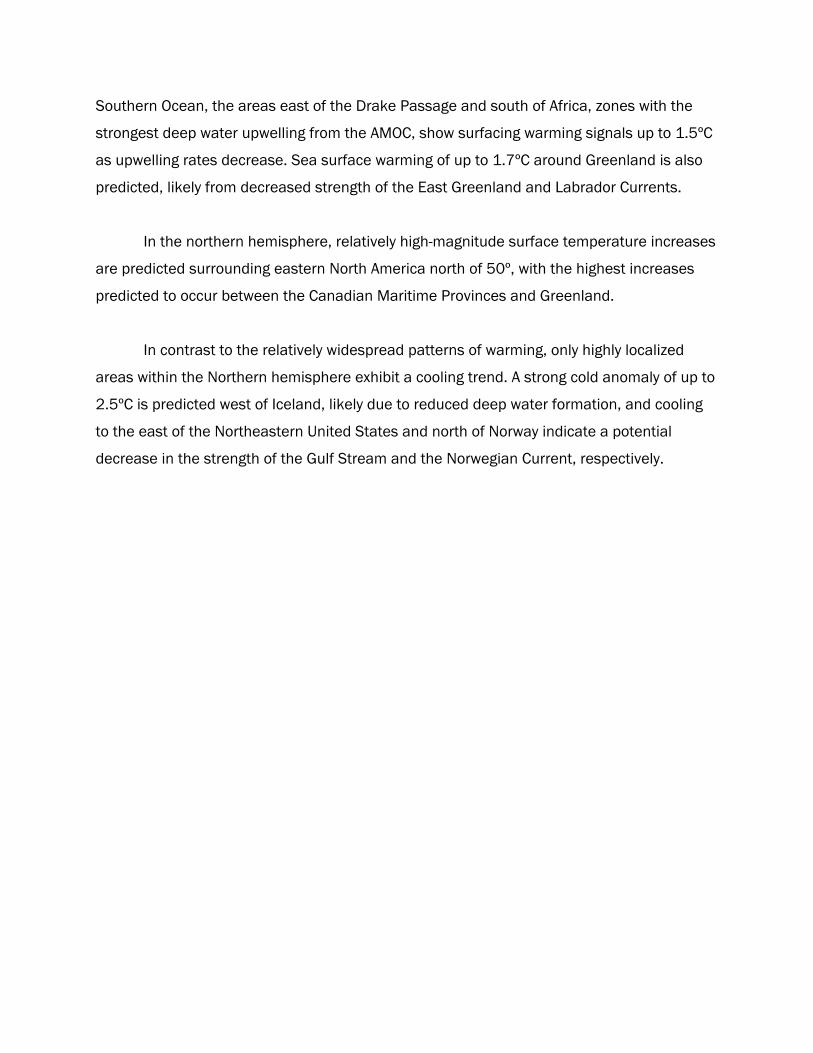
In contrast to the relatively widespread patterns of warming, only highly localized
areas within the Northern hemisphere exhibit a cooling trend. A strong cold anomaly of up to
2.5ºC is predicted west of Iceland, likely due to reduced deep water formation, and cooling
to the east of the Northeastern United States and north of Norway indicate a potential
decrease in the strength of the Gulf Stream and the Norwegian Current, respectively.
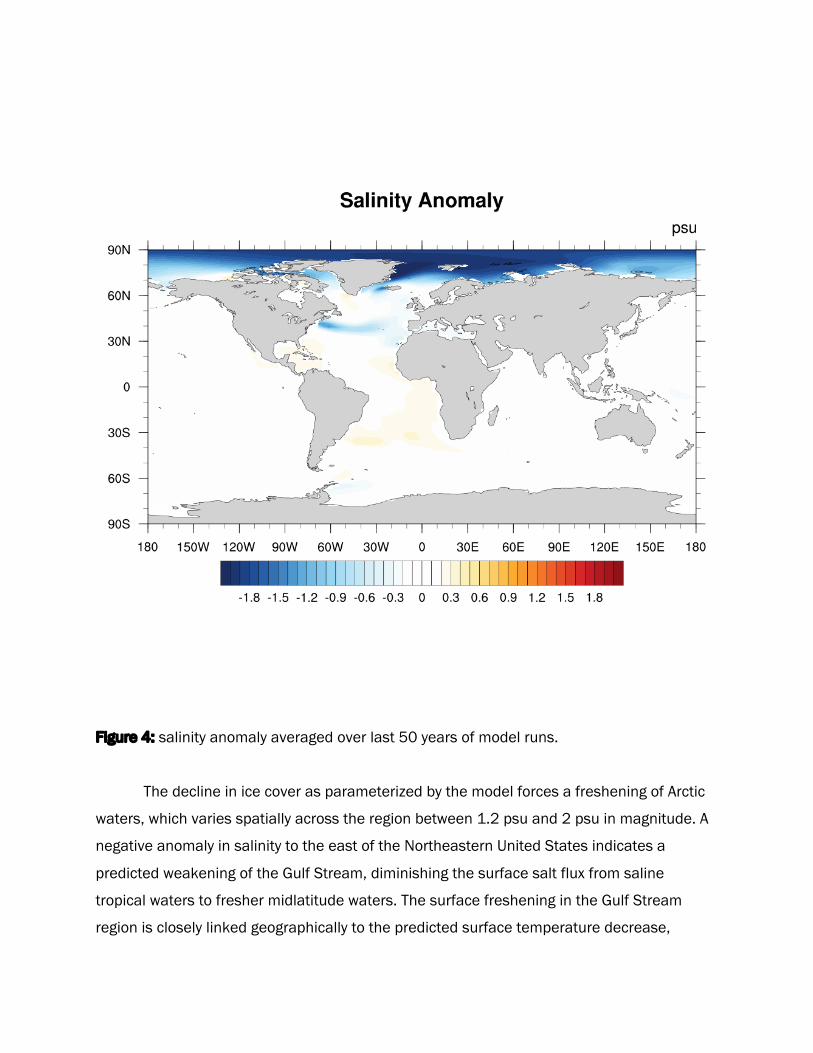
Figure 4: salinity anomaly averaged over last 50 years of model runs.
The decline in ice cover as parameterized by the model forces a freshening of Arctic
waters, which varies spatially across the region between 1.2 psu and 2 psu in magnitude. A
negative anomaly in salinity to the east of the Northeastern United States indicates a
predicted weakening of the Gulf Stream, diminishing the surface salt flux from saline
tropical waters to fresher midlatitude waters. The surface freshening in the Gulf Stream
region is closely linked geographically to the predicted surface temperature decrease,
corroborating the potential decline in Gulf Stream strength. Positive salinity anomalies of up
to 0.4 psu are observed in the Southern Atlantic and Caribbean, particularly along the
western coast of Africa.
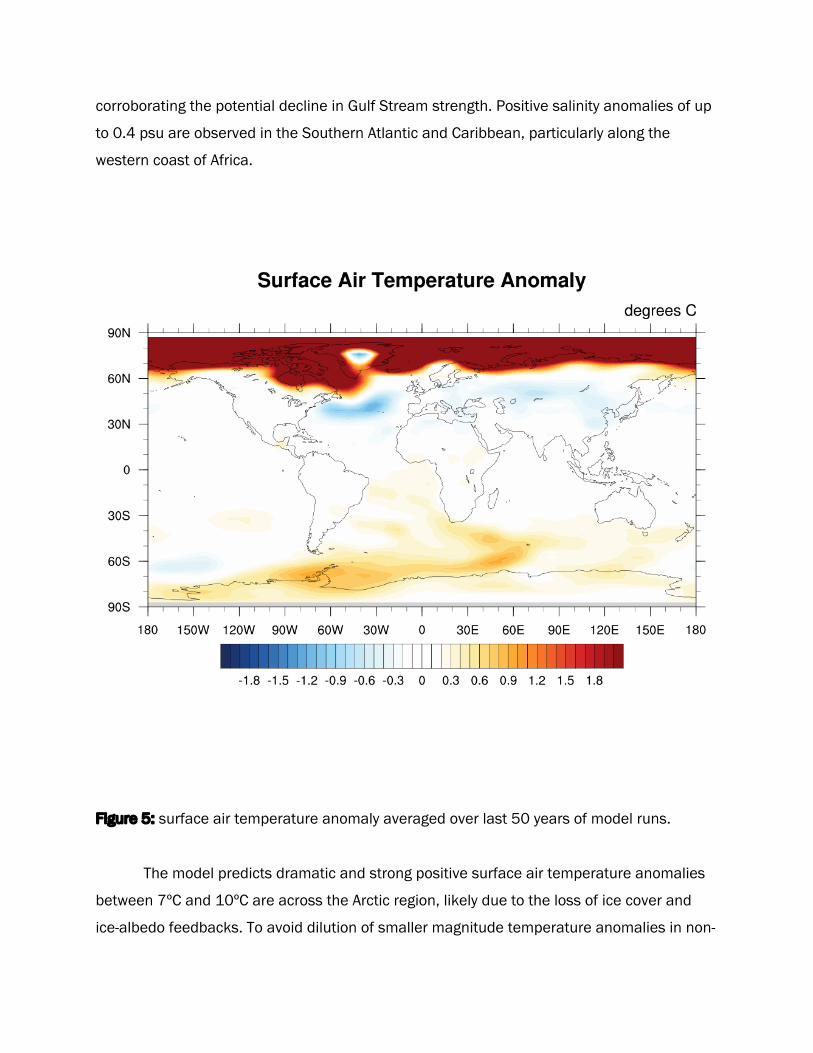
Figure 5: surface air temperature anomaly averaged over last 50 years of model runs.
The model predicts dramatic and strong positive surface air temperature anomalies
between 7ºC and 10ºC are across the Arctic region, likely due to the loss of ice cover and
ice-albedo feedbacks. To avoid dilution of smaller magnitude temperature anomalies in non-
polar regions, the temperature scale is capped at 2ºC. Due to reduced northward heat
transport driven by the AMOC, there is a cooling trend observed across the Northern
Hemisphere midlatitudes and a warming trend at southern high latitudes. North Atlantic
surface air temperatures are expected to decrease between 0.7ºC and 1.2ºC, geographically
linked with the negative salinity and sea surface temperatures described in the previous
figures. Cooling across Eurasia varies regionally between 0.3ºC and 0.8ºC with a maximum
north of Lake Balkhash in Kazakhstan. Warming between 0.5ºC and 1.0ºC is predicted
across the Southern Ocean, highest in areas of strong sea surface temperature increase
due to reduced deep water upwelling.
A notable deviation from the otherwise uniform positive Arctic temperature anomaly
is a neutral to negative anomaly centered over Greenland. At this location, the model
predicts cooling up to 1.2ºC. As discussed below, other modeled parameters demonstrate
somewhat regionally atypical patterns centered over Greenland.
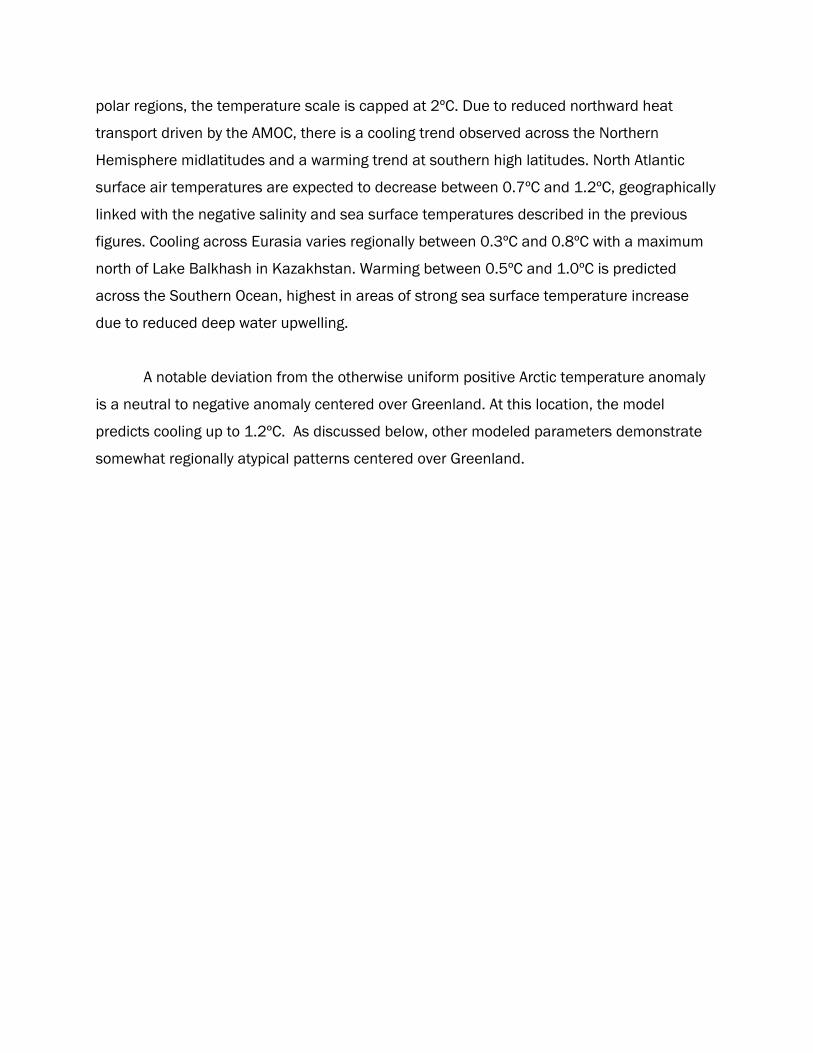
Figure 6: convective and large-scale precipitation anomaly averaged over last 50 years of
model runs.
Significant shifts in regional and global convective and large-scale precipitation
patterns are predicted under a weakening AMOC. Due to warming surface temperatures,
precipitation in the Arctic region may increase by up to 10 centimeters per year (cm/year). In
the tropics, precipitation patterns driven by the ITCZ both decrease in intensity and move
south, particularly over the Atlantic and Indian Oceans. In the Atlantic, precipitation from the
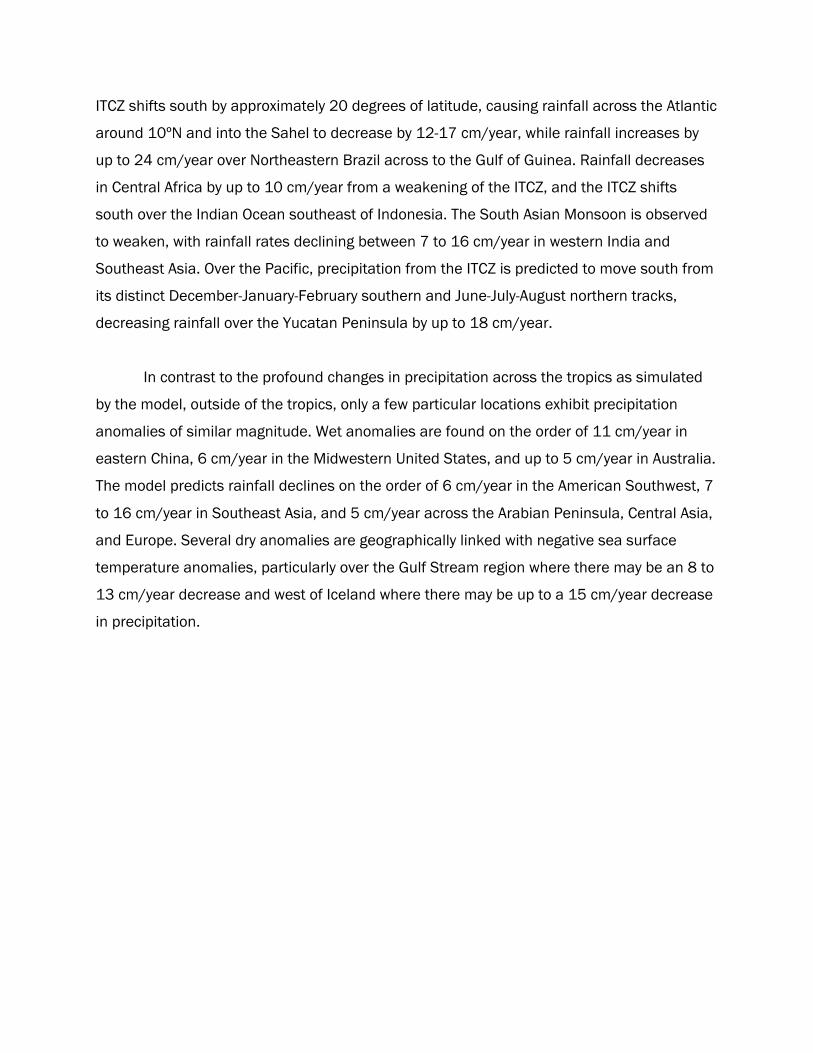
ITCZ shifts south by approximately 20 degrees of latitude, causing rainfall across the Atlantic
around 10ºN and into the Sahel to decrease by 12-17 cm/year, while rainfall increases by
up to 24 cm/year over Northeastern Brazil across to the Gulf of Guinea. Rainfall decreases
in Central Africa by up to 10 cm/year from a weakening of the ITCZ, and the ITCZ shifts
south over the Indian Ocean southeast of Indonesia. The South Asian Monsoon is observed
to weaken, with rainfall rates declining between 7 to 16 cm/year in western India and
Southeast Asia. Over the Pacific, precipitation from the ITCZ is predicted to move south from
its distinct December-January-February southern and June-July-August northern tracks,
decreasing rainfall over the Yucatan Peninsula by up to 18 cm/year.
In contrast to the profound changes in precipitation across the tropics as simulated
by the model, outside of the tropics, only a few particular locations exhibit precipitation
anomalies of similar magnitude. Wet anomalies are found on the order of 11 cm/year in
eastern China, 6 cm/year in the Midwestern United States, and up to 5 cm/year in Australia.
The model predicts rainfall declines on the order of 6 cm/year in the American Southwest, 7
to 16 cm/year in Southeast Asia, and 5 cm/year across the Arabian Peninsula, Central Asia,
and Europe. Several dry anomalies are geographically linked with negative sea surface
temperature anomalies, particularly over the Gulf Stream region where there may be an 8 to
13 cm/year decrease and west of Iceland where there may be up to a 15 cm/year decrease
in precipitation.
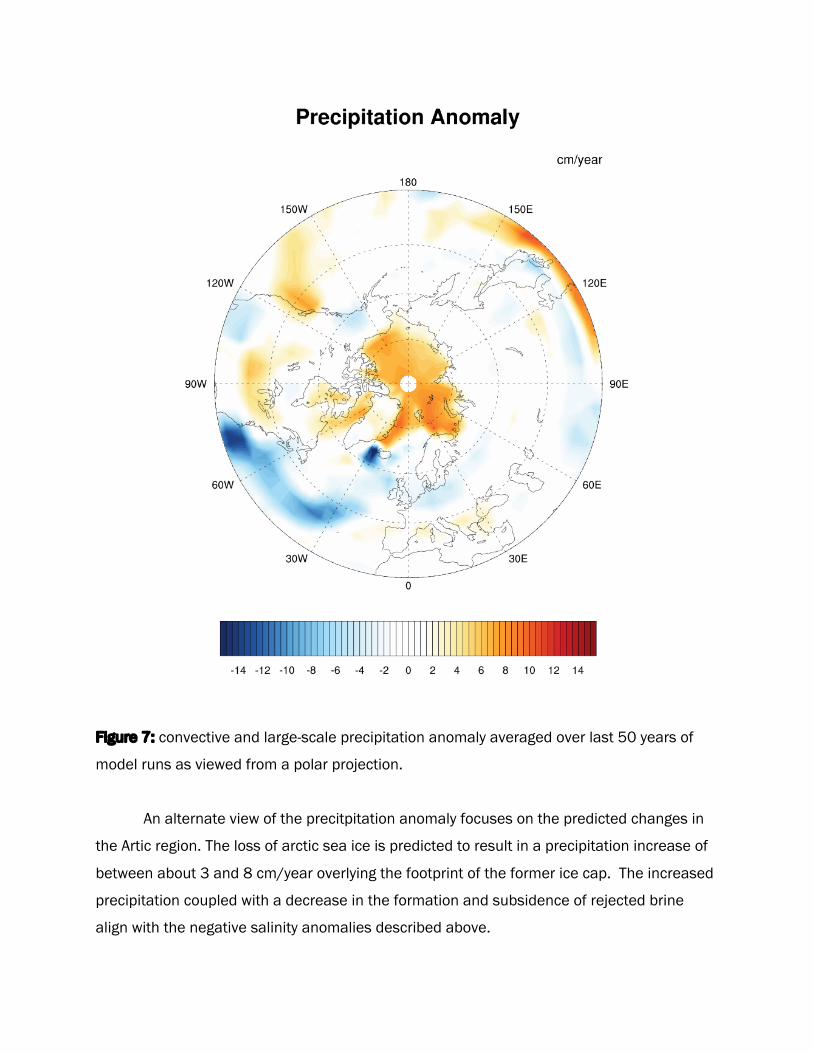
Figure 7: convective and large-scale precipitation anomaly averaged over last 50 years of
model runs as viewed from a polar projection.
An alternate view of the precitpitation anomaly focuses on the predicted changes in
the Artic region. The loss of arctic sea ice is predicted to result in a precipitation increase of
between about 3 and 8 cm/year overlying the footprint of the former ice cap. The increased
precipitation coupled with a decrease in the formation and subsidence of rejected brine
align with the negative salinity anomalies described above.
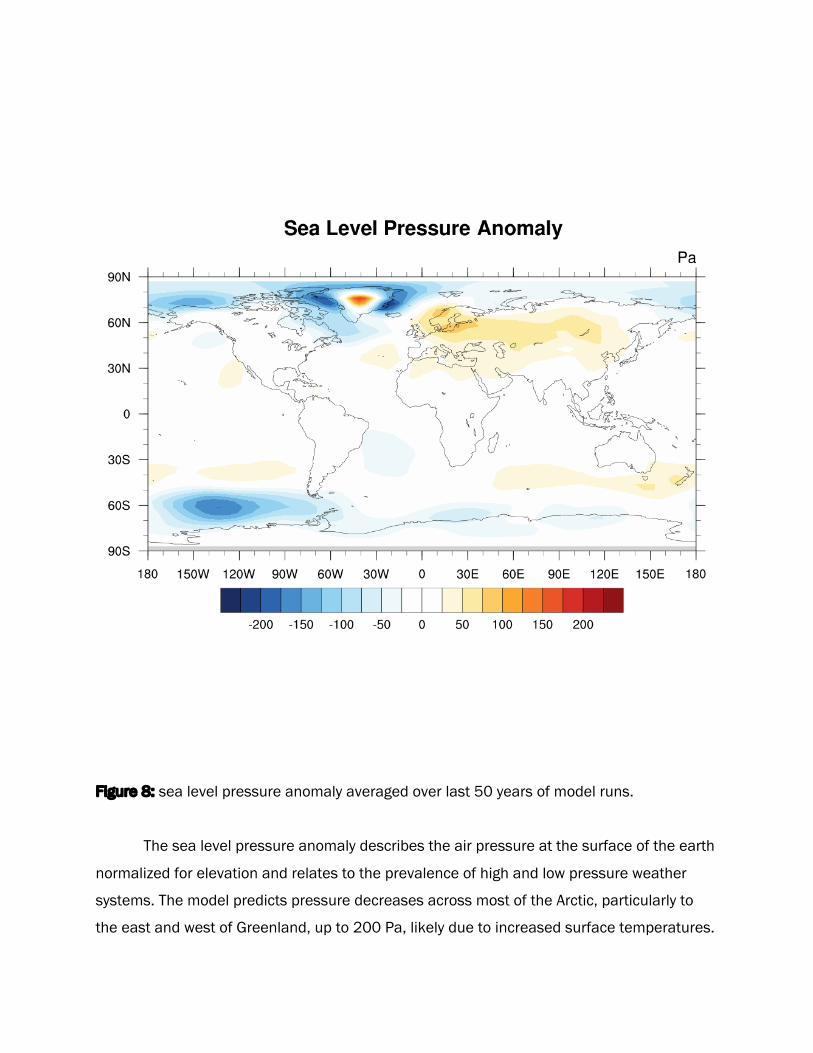
Figure 8: sea level pressure anomaly averaged over last 50 years of model runs.
The sea level pressure anomaly describes the air pressure at the surface of the earth
normalized for elevation and relates to the prevalence of high and low pressure weather
systems. The model predicts pressure decreases across most of the Arctic, particularly to
the east and west of Greenland, up to 200 Pa, likely due to increased surface temperatures.
Over central Greenland, a 150 Pa positive anomaly is observed. Pressure increases by 25 to
75 Pa over most of Eurasia and the North Central Atlantic, regions where a negative
temperature anomaly is also expected. Between 30 and 50 degrees south in the Eastern
Hemisphere, pressure increases by up to 50 Pa. There is a strong negative pressure
anomaly in the Southern Ocean north of the Bellingshausen and Amundsen Seas in
Antarctica, strengthening the existing Amundsen Sea Low.
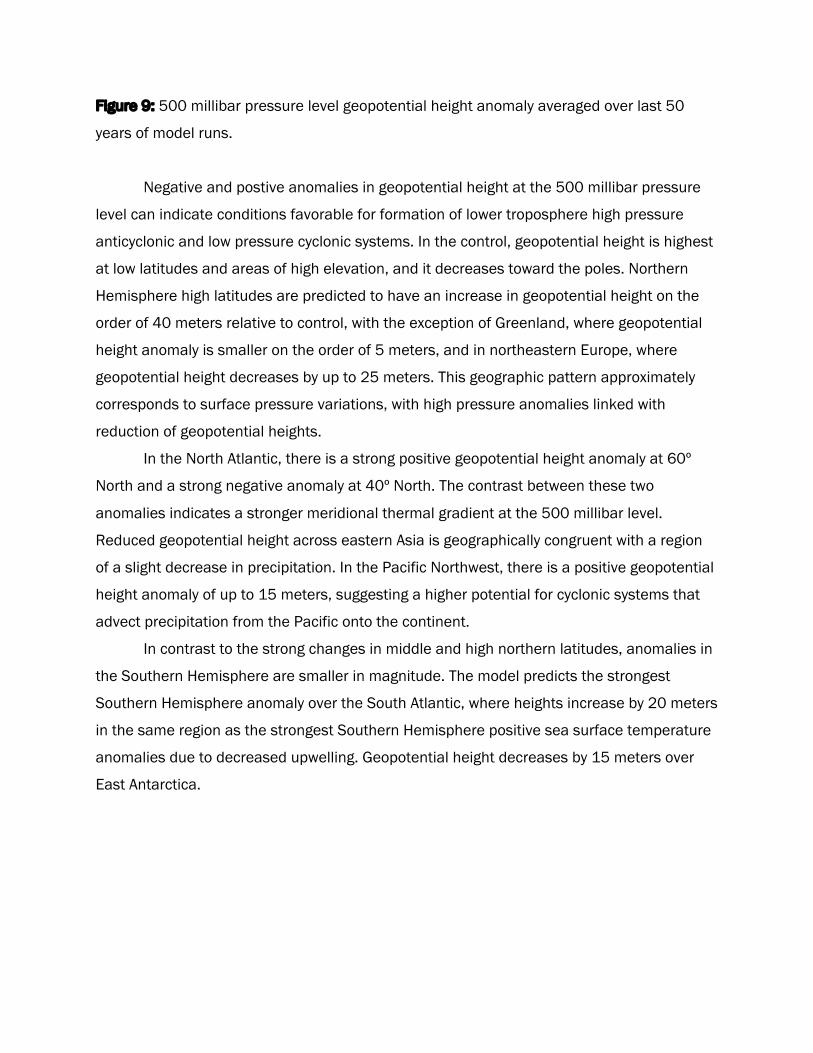
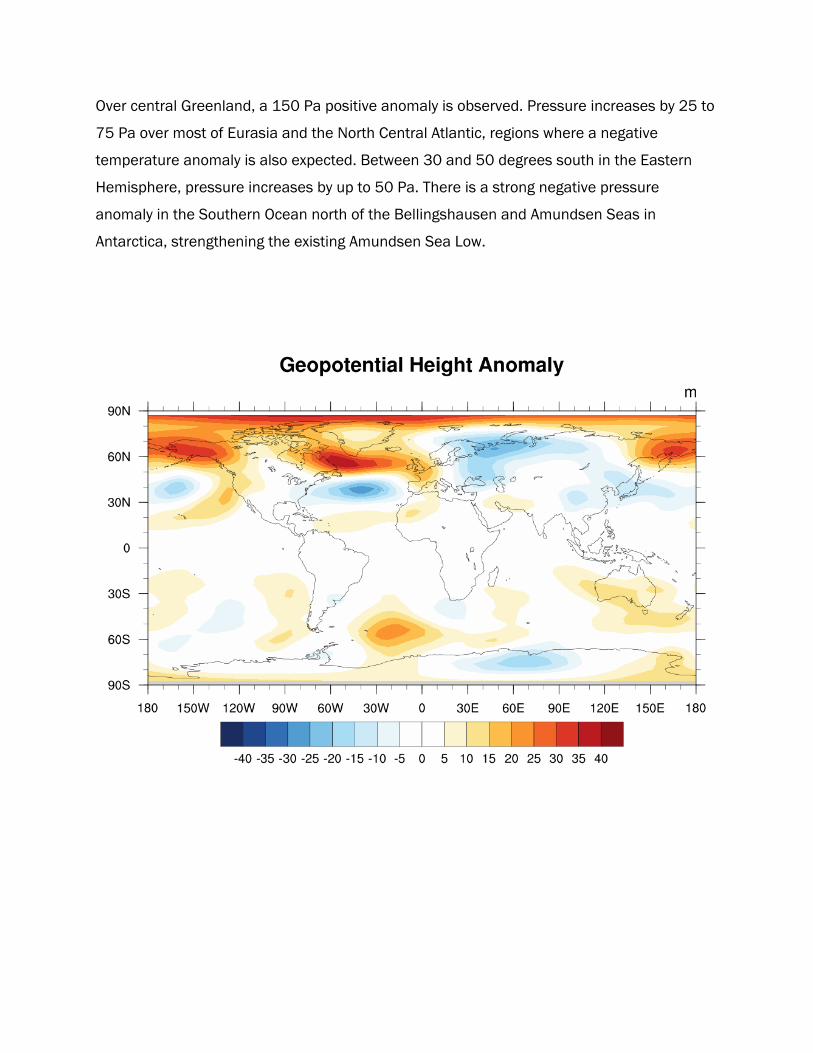
Figure 9: 500 millibar pressure level geopotential height anomaly averaged over last 50
years of model runs.
Negative and postive anomalies in geopotential height at the 500 millibar pressure
level can indicate conditions favorable for formation of lower troposphere high pressure
anticyclonic and low pressure cyclonic systems. In the control, geopotential height is highest
at low latitudes and areas of high elevation, and it decreases toward the poles. Northern
Hemisphere high latitudes are predicted to have an increase in geopotential height on the
order of 40 meters relative to control, with the exception of Greenland, where geopotential
height anomaly is smaller on the order of 5 meters, and in northeastern Europe, where
geopotential height decreases by up to 25 meters. This geographic pattern approximately
corresponds to surface pressure variations, with high pressure anomalies linked with
reduction of geopotential heights.
In the North Atlantic, there is a strong positive geopotential height anomaly at 60º
North and a strong negative anomaly at 40º North. The contrast between these two
anomalies indicates a stronger meridional thermal gradient at the 500 millibar level.
Reduced geopotential height across eastern Asia is geographically congruent with a region
of a slight decrease in precipitation. In the Pacific Northwest, there is a positive geopotential
height anomaly of up to 15 meters, suggesting a higher potential for cyclonic systems that
advect precipitation from the Pacific onto the continent.
In contrast to the strong changes in middle and high northern latitudes, anomalies in
the Southern Hemisphere are smaller in magnitude. The model predicts the strongest
Southern Hemisphere anomaly over the South Atlantic, where heights increase by 20 meters
in the same region as the strongest Southern Hemisphere positive sea surface temperature
anomalies due to decreased upwelling. Geopotential height decreases by 15 meters over
East Antarctica.
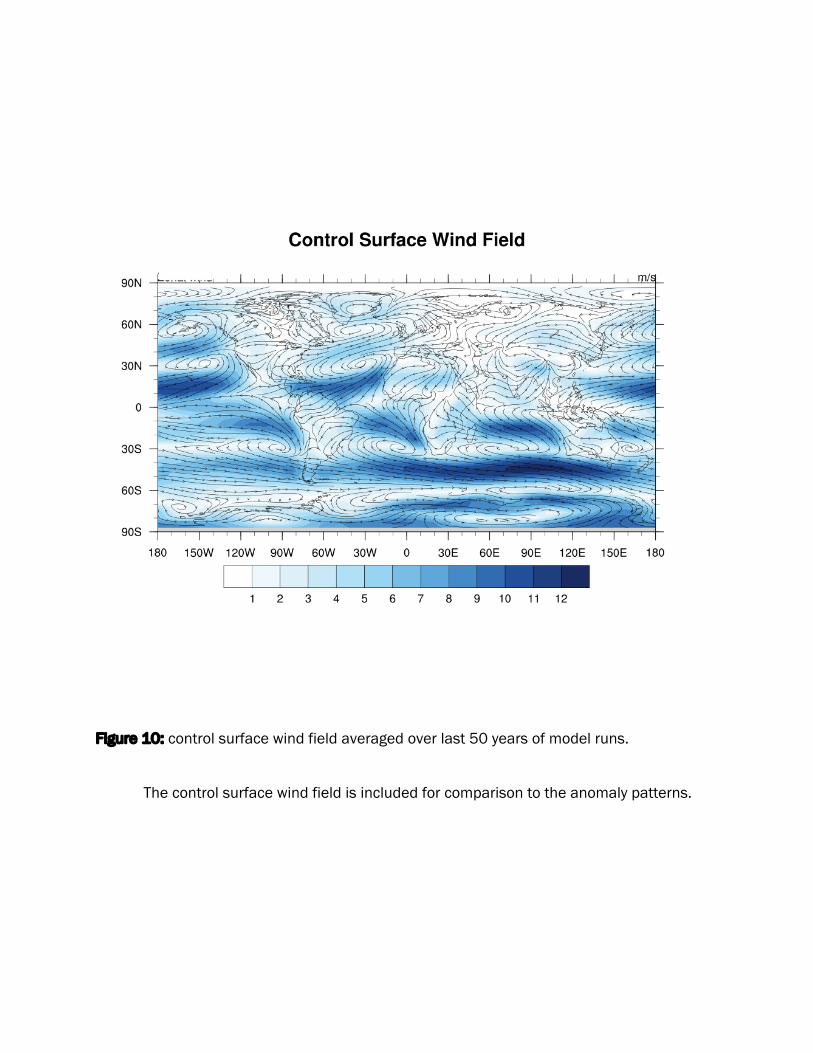
Figure 10: control surface wind field averaged over last 50 years of model runs.
The control surface wind field is included for comparison to the anomaly patterns.
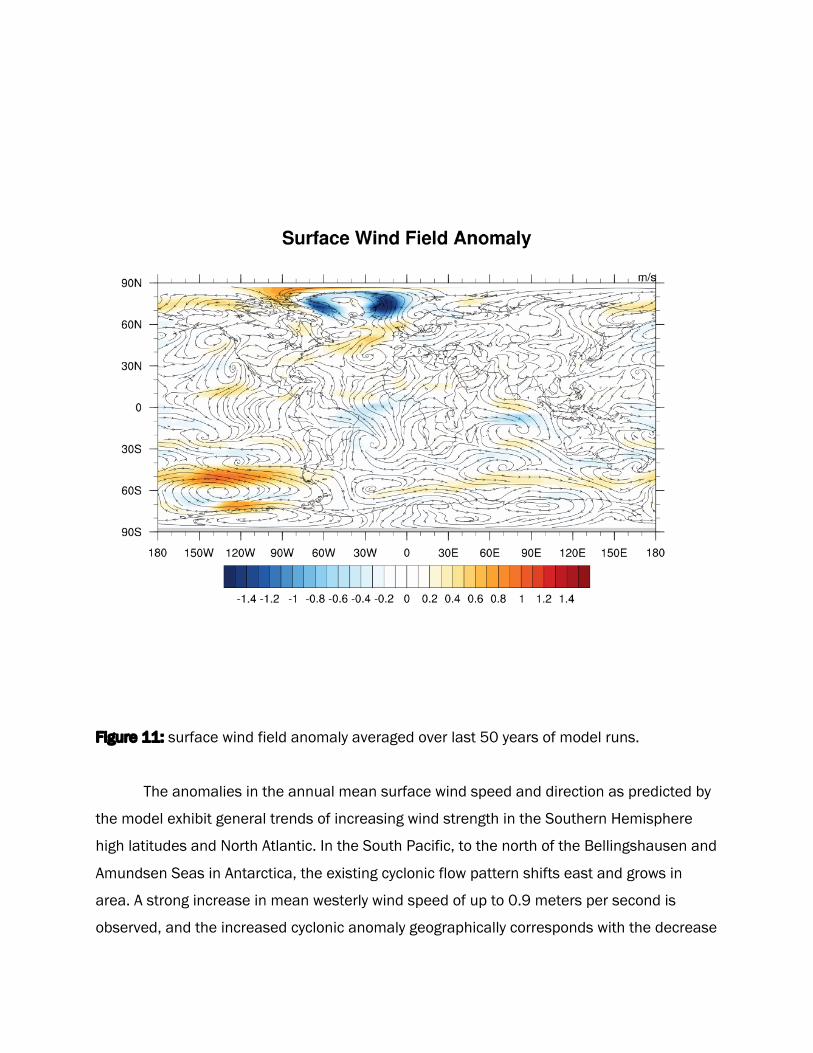
Figure 11: surface wind field anomaly averaged over last 50 years of model runs.
The anomalies in the annual mean surface wind speed and direction as predicted by
the model exhibit general trends of increasing wind strength in the Southern Hemisphere
high latitudes and North Atlantic. In the South Pacific, to the north of the Bellingshausen and
Amundsen Seas in Antarctica, the existing cyclonic flow pattern shifts east and grows in
area. A strong increase in mean westerly wind speed of up to 0.9 meters per second is
observed, and the increased cyclonic anomaly geographically corresponds with the decrease
in sea level pressure. Westerly winds intensify across the southern Indian Ocean and North
Atlantic on the order of 0.4 meters per second. In contrast, the existing anticyclonic flow
around Greenland from the persistent high pressure system weakens by up to 1.5 meters
per second, most notably off of the eastern and western coasts in regions that are linked to
the predicted negative sea level pressure anomalies.
Discussion
Global Climatology Impacts
A weakening AMOC as forced by declining Arctic sea ice has profound implications for
global climate patterns. The results of the CESM model runs as parameterized appear at
first examination to be consistent with previous literature and with current understanding of
geophysical systems, with the potential exception of Greenland.
Because Greenland’s continental ice sheet is not actively perturbed in the longwave
emissivity reduction experiment, while the rest of the Arctic warms, gets wetter, freshens
surface waters, and becomes ice free, Greenland’s response is simulated as remaining
comparatively cold, offering a potential explanation for the observed results. The model
suggests that temperature and pressure gradients between central Greenland and the coast
become stronger, and at this point in time we have not pursued a comprehensive
explanation of this condition. This anomaly may warrant longer time-scale simulations with
Greenlandic ice perturbed to determine its statistical significance and long-term stability.
Climatic changes in the tropics and mid-latitudes in response to a weakening AMOC
may have striking consequences on ecological and human systems. Changes to current
rainfall patterns will potentially aggravate an already stressed demand for fresh water
supplies, such as in the North American Southwest, Central Asia, and portions of sub-
Saharan Africa. The Sahel receives the majority of its annual precipitation from the West
African Monsoon and is already vulnerable to droughts and desertification. [Vellinga and
Wood, 2002] As the ITCZ shifts south by close to 20º of latitude across the Atlantic and
temperatures rise across the region, the Sahel is predicted to significantly desiccate.
Rainfall from the ITCZ shift appears to decrease over central Africa, threatening the long-
term stability of the Congo Rainforest, which is already experiencing a multi-decadal drying
trend and loss in biomass. [Zhou et al., 2014]
Asian monsoon winds are influenced by differential heating of the landmass and the
ocean, with high pressure over the Indian Ocean and low pressure over land. As the AMOC
collapses, there is a high pressure anomaly over Asia, which weakens the monsoon winds.
The South Asian Monsoon is expected to weaken particularly over western India and into
central Asia, and since the ITCZ shifts south, the monsoon likely arrives later in the season
and has a shorter duration. [Vellinga and Wood, 2002] Decreased precipitation in Eurasia
overlaps with colder temperatures, leading to potential lower primary productivity and
diminished agricultural yields. [Vellinga and Wood, 2002] The seasonality of ITCZ shifts
increases into the Pacific region, where the ITCZ takes distinct tracks in December-January-
February and June-July-August. Southeast Asia from Thailand to the Philippines is predicted
to dry from the Northern Hemisphere summer position of the ITCZ moving south, while
Papua New Guinea and Melanesia receive a rainfall decline of a similar magnitude from a
shift of the Northern Hemisphere winter position. Across the Pacific, Central American
rainforests are likely to be threatened by decreasing rainfall, and water scarcity in the
American Southwest may be exacerbated by a weakened North American Monsoon.
Conversely, in other regions, large scale precipitation increases result from the
southward shifts of the ITCZ, with profound ecological impacts. Central China is predicted to
experience much higher summer precipitation as the July position of the ITCZ shifts south
from Japan and northern China into central China, a region already prone to seasonal
flooding. As the January track of the ITCZ moves south, Sumatra and Borneo will also likely
receive an increase in rainfall, and the positive precipitation anomaly coincides
geographically with stronger winds. Power dissipation is proportional to the cube of the wind
speed, so this may impact the behavior and intensity of extreme weather. [Emanuel, 1987;
2005] The highest predicted precipitation increase is in Northeastern Brazil, which has a
tropical savanna climate with a distinct wet and dry season; because of the positioning of
the ITCZ, the wet season is likely to get significantly more rain while the dry season will have
little change. [Vellinga and Wood, 2002] Some significant rainfall rate increases occur
during the wet season in some semi-arid climates, such as Peru, Namibia, and Australia,
which has the potential to increase flood risk and change the local ecology.
Atlantic and Southern Ocean Dynamical Changes
Negative sea surface temperature and salinity anomalies in the North Central Atlantic
as well as colder air temperatures across Eurasia indicate diminishing strength of the Gulf
Stream and North Atlantic Drift under the perturbation scenario. The body of literature is not
in unanimous agreement about the implications for the Gulf Stream from AMOC decline:
simulations from Caesar (2018) show the Gulf Stream shifting to the north and maintaining
a similar magnitude to present, but Thomas (2012) makes a convincing case that a strong
reduction in North Atlantic southerly deep ocean transport must be “balanced solely by a
weakening of the northward surface western boundary current.” Thomas’s argument,
however, closely corroborates the results predicted by this model, so it is quite possible that
the Gulf Stream and North Atlantic Drift weaken in strength.
The Southern Ocean region exhibits particularly significant climatic changes that may
affect other existing climate feedbacks. As strong buoyancy-driven upwelling rates decrease,
surface air and sea temperatures increase, sea level pressure drops, and the meridional
thermal contrast between the Antarctic continent and the surrounding ocean strengthens,
creating favorable conditions for stronger storms. Southern Pacific cyclonic wind patterns
shift east and grow in area, which may contribute to higher snow accumulation rates
particularly in western Antarctica. Snow is a highly reflective and poorly insulating layer that
allows ice to cool further and thicken during winter months, and it also represents a positive
flux of freshwater into the polar ocean, both of which serve to thermally insulate the
continent and increase ice cover. [Maksym et al., 2012]
Current trends in Antarctic sea ice are a useful point of comparison for predicted
future changes under a weakening AMOC. While Antarctic sea ice extent has increased
slowly over the past several decades, it has not increased uniformly around the continent—
there exist significant temporal and regional variations in this trend that may mirror the
simulated results from our model runs. Ice area in the Ross Sea has increased at a rate of
5% per decade, whereas extent has decreased by 7% per decade in the Amundsen and
Bellingshausen Seas. The summer persistence of ice has also shown parallel differences,
with the length of the ice-free season decreasing by two months in the Ross Sea but
increasing by three months in the Bellingshausen Sea. [Turner et al., 2009] A likely factor in
this phenomenon lies in the geographic asymmetry of Antarctica and its effects on wind
patterns. High-latitude westerlies are perturbed as they flow into the Ross Sea, resulting in
the semipermanent Amundsen Sea Low (ASL), which generates warm, northerly winds over
the Bellingshausen Sea and cold, southerly winds over the Ross Sea region. [Baines and
Fraedrich, 1989] The anomalies observed between the model runs demonstrate this
phenomenon. As westerlies increase in velocity, the resulting atmospheric heat transport
creates conditions that are less and more favorable, respectively, for ice formation and
persistence in the Bellingshausen and Ross Seas. [Stammerjohn et al., 2008]
Sévellec et al. and others have both predicted and observed a weakening of the
AMOC, but upwelling in the Southern Ocean is not exclusively controlled by thermohaline
buoyancy gradients and is also influenced at a smaller magnitude by Ekman divergence
from strong westerlies. [Kuhlbrodt et al., 2007] Provided that the westerlies over the
Southern Ocean persist at a similar or greater magnitude compared with present conditions,
there will still be a northward Atlantic surface Ekman transport of 30 Sv, although flow
patterns will likely shift into a different, primarily wind-driven regime of Meridional
Overturning Circulation without deep water formation in the North Atlantic. [Kuhlbrodt et al.,
2007]
Comparison Between Present and Last Glacial Maximum
Paleoclimate data from the last glacial maximum (LGM) are a useful point of contrast
for the relationships between overturning circulation, ice cover, and wind patterns compared
to present. At the LGM, the Atlantic thermohaline circulation likely was governed by different
dynamics. Geochemical records indicate that the North Atlantic Deep Water (NADW) may
have been essentially absent due to ice cover in the Arctic, and the Antarctic Bottom Water
(AABW) may have expanded to fill up to the bottom 2km of the Atlantic basin—four times as
large of a volume as compared to present. [Marzocchi and Jansen, 2017] Additionally, not
only was the Antarctic Bottom Water expanded at the LGM, the deep ocean was more
stratified, with higher salinity in the Southern Ocean. [Adkins et al., 2002] Deep ocean
stratification is correlated with depth of the upper overturning cell, and the relationship
between high sea ice extent and a shallower upper overturning cell is consistent with the
geological record. [Marzocchi and Jansen, 2017]
Under the model simulation, formation of the NADW may also be reduced but due to
different mechanisms, namely higher surface buoyancy from diminished brine rejection and
freshening from ice melt. The observed slight salinity decrease and surface warming suggest
stratification in the Labrador Sea, as happened in the winter of 1968 to 1969, where warm
temperatures and a prevailing negative salinity anomaly shut down convection for a season.
[Gelderloos et al., 2012] Instead of an absent NADW because of ice cover preventing
extreme cooling to the atmosphere or surface waters like at the LGM, the diminished NADW
under Arctic ice loss scenarios because of surface freshening may also have a shallower
upper overturning cell.
Carbon Cycle
Changes in thermohaline circulation, wind, and ice patterns have important impacts
on the global carbon cycle, and as a result the accelerated atmosphere-ocean momentum
transfer from Southern Hemisphere westerlies has a profound impact on global climate
feedbacks. [Hansen et al., 2015] While NADW upwelling from diapycnal mixing decreases
with AMOC weakening, Ekman pumping at high southern latitudes leads to higher rates of
upwelling of deep waters. Waters of Antarctic origin are also richer in nutrients and carbon
than the Arctic waters that they replace, and at the LGM, the increased volume of Antarctic
origin waters contributed to an atmospheric carbon dioxide reduction. [Ferrari et al., 2014]
The deep ocean contains 90% of the combined oceanic, atmospheric, and terrestrial carbon
budget, and if upwelling and ventilation rates increase, there is the potential for the
atmospheric release of large amounts of ocean-sequestered carbon. [Ferrari et al., 2014]
Paleoclimate data show that deglaciation-related AMOC collapses during the late
Pleistocene have coincided with rapid atmospheric CO2 increases of 10 ppm from
respiration of deep ocean carbon. [Hansen et al., 2015; Marcott et al., 2014] Increased
biological productivity may result in the Southern Ocean as well from warmer temperatures
and higher wind-driven upwelling rates, acting as a carbon sink. The relative magnitudes of
these oceanic carbon fluxes require further modeling to estimate.
Next Steps
Several opportunities for further research exist based on the study conducted here.
Due to the short duration of the experimental runs, there is the possibility that phenomena
that exist on multidecadal timescales are overemphasized in significance relative to long
term trends. Running longer experiments as well as parameterizing Greenlandic ice to melt
at comparable rates to Arctic sea ice may generate results that better depict the long term
climatic impact of ice melt. It would be useful to evaluate the statistical significance of each
predicted anomaly to be able to compare the observed patterns with multiannual and
multidecadal variation. Additionally, while much has been written about the relationship
between Arctic sea ice, overturning circulation, and climate, comparatively little is known
about the impact of Antarctic sea ice changes on ocean circulation. Using the same
methodology as in Sévellec et al. (2017), it would be worthwhile to run perturbation
experiments on Antarctic ice to better understand the global relationship between ice cover
and climate.
Acknowledgements
This research was made possible through support from the Yale Department of Geology &
Geophysics. I would like to thank Alexey Fedorov for his incredible mentorship, advice,
tutoring, and patience throughout my yearlong research, Wei Liu for his instruction in
modeling strategies using CESM, Mary-Louise Timmermans for her time in being a second
reader, Matthew Thomas for his assistance with processing NetCDF files, Bowen Zhao for
her support with using CDO, Kaylea Nelson for her support with the Yale High Performance
Computing Cluster, the Atmospheric Chemistry and Observation Laboratory at the National
Center for Atmospheric Research for mentoring in writing NCL scripts, and all CESM
scientists and software engineers for their work in developing and maintaining CESM.
References
Adkins JF, McIntyre K, Schrag DP, The salinity, temperature, and delta18O of the glacial deep ocean. Science 298(5599):1769–1773, (2002).
Arzel, O., T. Fichefet, and H. Goosse, Sea ice evolution over the 20th and 21st centuries as simulated by current AOGCMs. Ocean Modelling 12:401–415, (2006).
Baines, P.G., and K. Fraedrich, Topographic effects on the mean tropospheric flow patterns around Antarctica. Journal of Atmospheric Science 46:3,401–3,415, (1989).
Briegleb, B. P., and B. Light. A Delta-Eddington Multiple Scattering Parameterization for Solar Radiation in the Sea Ice Component of the Community Climate System Model. NCAR Technical Note, NCAR/TN-472+STR, (2007). Burls, N. J. & Fedorov, A. V. What controls the mean east–west sea surface temperature gradient in the equatorial Pacific: the role of cloud albedo. J. Clim. 27, 2757–2778 (2014).
Caesar, L., Rahmstorf, S., Robinson, A., Feulner, G. and Saba, V. Observed fingerprint of a weakening Atlantic Ocean overturning circulation. Nature, 556(7700), 191, (2018). Eisenman, I. & Wettlaufer, J. S. Nonlinear threshold behavior during the loss of Arctic sea ice. Proc. Nat’l Acad. Sci. USA 106, 28–32 (2009).
Emanuel, K. A.: Increasing destructiveness of tropical cyclones over the past 30 years, Nature, 436, 686–688, (2005).
Emanuel, K. A.: The dependence of hurricane intensity on climate, Nature, 326, 483–485, (1987).
Ferrari, R., M. F. Jansen, J. F. Adkins, A. Burke, A. L. Stewart, and A. F. Thompson, Antarctic sea ice control on ocean circulation in present and glacial climates, Proc. Natl. Acad. Sci., 111(24), 8753–8758, (2014).
Gelderloos, R., Strange, F. and Katsman, C.A. Mechanisms behind the temporary shutdown of deep convection in the Labrador Sea: lessons from the great salinity anomaly years 1968–71. Journal of Climate, 25(19), 6743-6755, (2012). Kuhlbrodt, T., Griesel, A., Montoya, M., Levermann, A., Hofmann, M. and Rahmstorf, S. On the driving processes of the Atlantic meridional overturning circulation. Reviews of Geophysics, 45(2), (2007). Maksym, T., S.E. Stammerjohn, S. Ackley, and R. Massom, Antarctic sea ice—A polar opposite? Oceanography 25(3):140–151, (2012).
Marshall, G.J., Trends in the Southern Annular Mode from observations and reanalyses. Journal of Climate 16:4,134–4,143, (2003).
Marshall, J., and K. Speer, Closure of the meridional overturning circulation through Southern Ocean upwelling, Nat. Geosci., 5(3), 171–180, (2012).
Marcott, S. A., Bauska, T. K., Buizert, C., Steig, E. J., Rosen, J. L., Cuffey, K. M., Fudge, T. J., Severinghaus, J. P., Ahn, J., Kalk, M. L., McConnell, J. R., Sowers, T., Taylor, K. C., White, J. W. C., and Brook, E. J.: Centennial-scale changes in the global carbon cycle during the last deglaciation, Nature, 514, 616-619, (2014).
Marzocchi, A., and M. F. Jansen, Connecting Antarctic sea ice to deep-ocean circulationin modern and glacial climate simulations, Geophys. Res. Lett., 44, 6286–6295, (2017).
Masson-Delmotte, V. et al. in Climate Change 2013: The Physical Science Basis. Contribution of Working Group I to the Fifth Assessment Report of the Intergovernmental Panel on Climate Change Ch. 5 (eds Stocker, T. F. et al.) 383–464 (Cambridge Univ. Press, Cambridge, 2013).
McCarthy, G. et al. Observed interannual variability of the Atlantic Meridional Overturning Circulation at 26.5 N. Geophys. Res. Lett. 39, L19609 (2012). Meredith, and Z. Wang, Non-annular atmospheric circulation change induced by stratospheric ozone depletion and its role in the recent increase of Antarctic sea ice extent. Geophysical Research Letters 36, L08502, (2009).
National Snow and Ice Data Center, NSIDC Interactive Sea Ice Graph http://nsidc.org/arcticseaicenews/. Parkinson, C. L. & Cavalieri, D. J. Arctic sea ice variability and trends, 1979–2006. J. Geophys. Res. 113, C07003 (2008).
Pauling, Andrew G., et al., 2016. The Response of the Southern Ocean and Antarctic Sea Ice to Freshwater from Ice Shelves in an Earth System Model. Bull. Am. Meteorol. Soc. 29, 1655-1671 (2016).
Rahmstorf, S., Box, J.E., Feulner, G., Mann, M.E., Robinson, A., Rutherford, S. and Schaffernicht, E.J. Exceptional twentieth-century slowdown in Atlantic Ocean overturning circulation. Nature climate change, 5(5), 475, (2015). Rahmstorf, S. Shifting seas in the greenhouse? Nature 399, 523–524 (1999). Sévellec, F., Fedorov, A.V. and Liu, W. Arctic sea-ice decline weakens the Atlantic Meridional Overturning Circulation. Nature Climate Change, 7(8), 604, (2017). Shields, C.A., Bailey, D.A., Danabasoglu, G., Jochum, M., Kiehl, J.T., Levis, S. and Park, S. The low-resolution CCSM4. Journal of Climate, 25(12), 3993-4014, (2012). Stammerjohn, S.E., D.G. Martinson, R.C. Smith, X. Yuan and D. Rind, Trends in Antarctic annual sea ice retreat and advance and their relation to ENSO and Southern Annular Mode variability. Journal of Geophysical Research 113, C03S90, (2008).
Smeed, D. A. et al. Observed decline of the Atlantic Meridional Overturning Circulation 2004 to 2012. Ocean Sci. 10, 29–38 (2014).
Stroeve, J. et al. Arctic sea ice extent plummets in 2007. Eos 19, 1365–1387 (2008).
Thomas, M.D., Boer, A.M., Stevens, D.P. and Johnson, H.L. Upper ocean manifestations of a reducing meridional overturning circulation. Geophysical Research Letters, 39(16), (2012). Turner, J., J.C. Comiso, G.J. Marshall,T.A. Lachlan-Cope, T. Bracegirdle, T. Maksym, M.P. Vellinga, M. and Wood, R.A. Global climatic impacts of a collapse of the Atlantic thermohaline circulation. Climatic change, 54(3), 251-267, (2002). Wood, R. A., Keen, A. B., Mitchell, J. F. B. & Gregory, J. M. Changing spatial structure of the thermohaline circulation in response to atmospheric CO2 forcing in a climate model. Nature 399, 572–575 (1999).
Worby, A.P., C.A. Geiger, M.J. Paget, M.L. Van Woert, S.F. Ackley, and T.L. DeLiberty, Thickness distribution of Antarctic sea ice. Journal of Geophysical Research 113, C05S92, (2008).
Wunsch, C.: What is the thermohaline circulation?, Science, 298, 1179–1180, (2002).
Yuan, X, ENSO-related impacts on Antarctic sea ice: A synthesis of phenomenon and mechanisms. Antarctic Science 16:415–425, (2004).
Zhang, J, Increasing Antarctic sea ice under warming atmospheric and oceanic conditions. Journal of Climate 20:2,515–2,529, (2007).
Zhou, L., Tian, Y., Myneni, R.B., Ciais, P., Saatchi, S., Liu, Y.Y., Piao, S., Chen, H., Vermote, E.F., Song, C. and Hwang, T., 2014. Widespread decline of Congo rainforest greenness in the past decade. Nature, 509(7498), 86, (2014).