Embed Size (px)
Citation preview
Global Change and Local
Economic Restructuring: The
Case of Mexico City
Thesis submitted for the degree of
Doctor of Philosophy (PhD)
by
Miguel Ángel Jiménez Godínez
Department of Geography & Environment
London School of Economics and Political Science
2015

2
To Tomas & Chela

3
Acknowledgements
…it takes a lot of things to change the world: anger and tenacity, science and indignation,
the quick initiative, the long reflection, the cold patience and the infinite perseverance,
the understanding of the particular case and the understanding of the ensemble.
Only the lessons of reality can teach us to transform reality.
Bertolt Brecht, Einverstandnis First of all I would like to thank Susana Berruecos, my wife, who gave me support and friendship and who gracefully took care of me during the unforgettable time we spent at the LSE in London. She also read different versions of several of my arguments at different stages of this thesis, and her advice (especially in academic matters) has always been greatly appreciated. I owe a special debt of gratitude to my supervisors, Gareth Jones and Andrew Thornley, for their invaluable help. They provided clear intellectual guidance, academic stimulus, and endless personal support which encouraged me to carry this project to its conclusion. Many of the ideas were discussed and refined in my graduate seminar at the Geography Department. I also benefited from the opportunity to interact and discuss ideas and empirical findings with department staff, to whom I owe special thanks, particularly Sylvia Chant, Yvonne Rydin, Ian Gordon, Diane Perrons and Andy Pratt. Other advisors and critics on whose help I have relied include Saskia Sassen (on whose ideas I have often drawn), David Harvey, Christine Kessides and Francisco Gaetani, from whom I received helpful comments on the basic ideas for my work. I have benefited from helpful discussions with and comments from George Philip, Soledad Loaeza and Francisco Panizza. The feedback provided by the seminar on Mexico (chaired by George Philip) was invaluable, as were in-depth discussions at The Beavers Pub with Osvaldo Santín, Alberto Peredo, Iván Pliego, Juan Pardinas, Jesús López, Iris Hauswirth, John Smith, Asato Saito, Abel Pérez, Javier Sánchez, Jorge Vera, Sophya Skyers, Ertan Zibel, Murat Yalgintan, Keho Shih, Debora Cavalcanti and Eduardo Rodríguez. All involved deserve special thanks for their insightful suggestions. I also gratefully acknowledge the financial support provided by CONACYT, the Department of Geography at the LSE and the British Council. Last for not least, my gratitude to my son Jorge, endless source of inspiration and support, and to Sofi my daughter, the best part of me, simply the best daughter in the world.
4
Abstract
This thesis is about economic transformation in Mexico City between 1980
and 2000. It explores the extent to which Mexico City’s economic
restructuring process has been caused by trade liberalisation. The thesis
assesses the extent to which industries located in Mexico City reacted to a
reorientation in production focus, characterised by the shift from national
to international markets. It analyses in detail the pace and geography of
neo-liberal economic change, and its effects upon a specific location. It
also evaluates the role played by global economic agents in gauging the
forces influencing economic restructuring in Mexico, and particularly in
Mexico City. At the core of this restructuring process is the change in
regional industrial location patterns in Mexico, as well as the decline of
manufacturing – with regard to production and employment – in Mexico
City and its rise as a service centre.
The thesis therefore engages with current debates on new economic
geography on the one hand and globalisation on the other, focusing
attention on the possible emergence of a group of “global” urban centres
embedded in a broader network of cities in developed and developing
countries alike, which connect global production circuits and coordinate
global/regional markets. More concretely, the thesis focuses on the
automotive and consumer electronics industries with the aim of
understanding the causes and effects of economic events in terms of
location decisions, particularly those made by transnational corporations.
By placing the empirical processes of economic restructuring within the
theoretical context of trade liberalisation and globalisation, I seek to make
an original contribution to social science debates about the way industry
reacts to economic signals and how global processes, despite taking place
in specific locations, have wide-reaching effects upon social welfare,
mainly though the transformation of local labour markets.
5
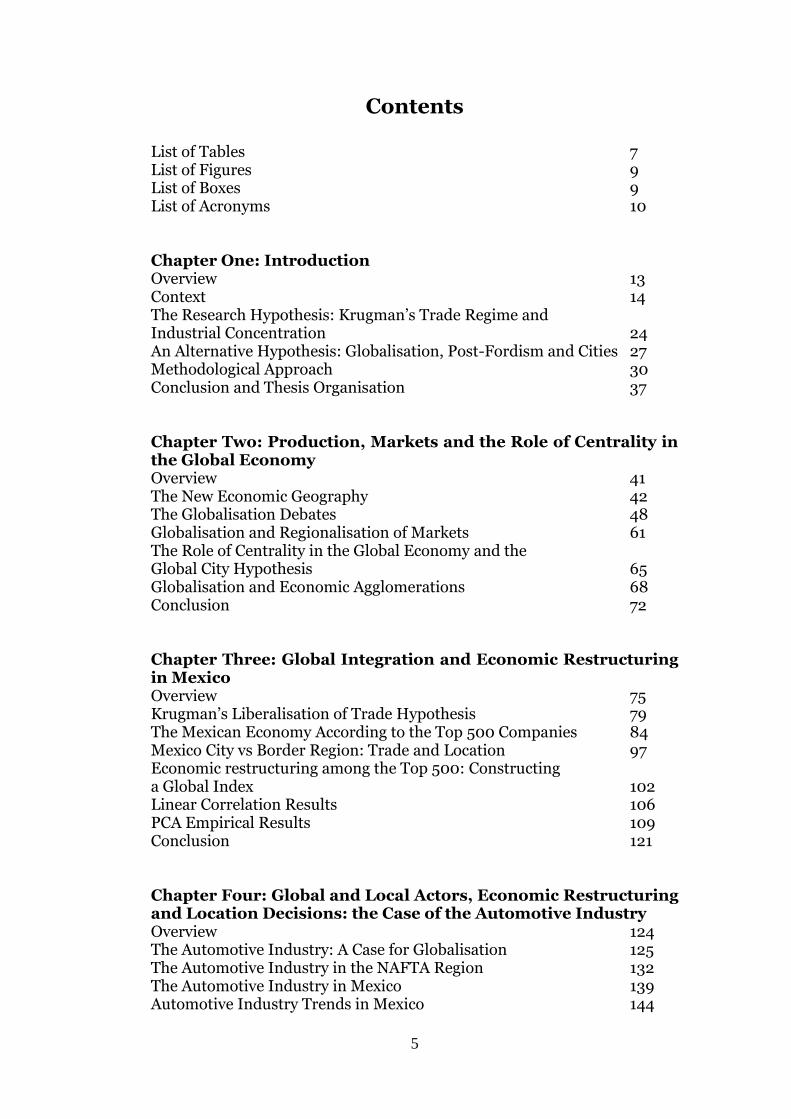
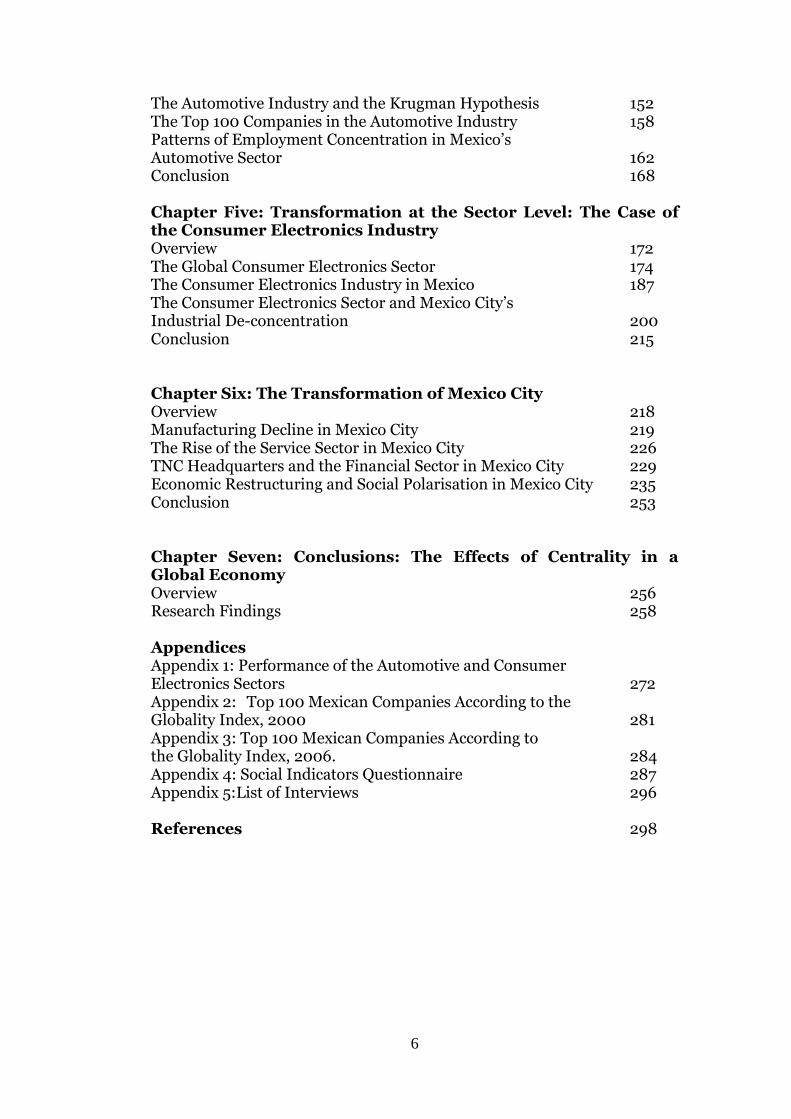
Contents
List of Tables 7 List of Figures 9 List of Boxes 9 List of Acronyms 10 Chapter One: Introduction Overview 13 Context 14 The Research Hypothesis: Krugman’s Trade Regime and Industrial Concentration 24 An Alternative Hypothesis: Globalisation, Post-Fordism and Cities 27 Methodological Approach 30 Conclusion and Thesis Organisation 37 Chapter Two: Production, Markets and the Role of Centrality in the Global Economy Overview 41 The New Economic Geography 42 The Globalisation Debates 48 Globalisation and Regionalisation of Markets 61 The Role of Centrality in the Global Economy and the Global City Hypothesis 65 Globalisation and Economic Agglomerations 68 Conclusion 72 Chapter Three: Global Integration and Economic Restructuring in Mexico Overview 75 Krugman’s Liberalisation of Trade Hypothesis 79 The Mexican Economy According to the Top 500 Companies 84 Mexico City vs Border Region: Trade and Location 97 Economic restructuring among the Top 500: Constructing a Global Index 102 Linear Correlation Results 106 PCA Empirical Results 109 Conclusion 121 Chapter Four: Global and Local Actors, Economic Restructuring and Location Decisions: the Case of the Automotive Industry Overview 124 The Automotive Industry: A Case for Globalisation 125 The Automotive Industry in the NAFTA Region 132 The Automotive Industry in Mexico 139 Automotive Industry Trends in Mexico 144
6
The Automotive Industry and the Krugman Hypothesis 152 The Top 100 Companies in the Automotive Industry 158 Patterns of Employment Concentration in Mexico’s Automotive Sector 162 Conclusion 168 Chapter Five: Transformation at the Sector Level: The Case of the Consumer Electronics Industry Overview 172 The Global Consumer Electronics Sector 174 The Consumer Electronics Industry in Mexico 187 The Consumer Electronics Sector and Mexico City’s Industrial De-concentration 200 Conclusion 215 Chapter Six: The Transformation of Mexico City Overview 218 Manufacturing Decline in Mexico City 219 The Rise of the Service Sector in Mexico City 226 TNC Headquarters and the Financial Sector in Mexico City 229 Economic Restructuring and Social Polarisation in Mexico City 235 Conclusion 253 Chapter Seven: Conclusions: The Effects of Centrality in a Global Economy Overview 256 Research Findings 258 Appendices Appendix 1: Performance of the Automotive and Consumer Electronics Sectors 272 Appendix 2: Top 100 Mexican Companies According to the Globality Index, 2000 281 Appendix 3: Top 100 Mexican Companies According to the Globality Index, 2006. 284 Appendix 4: Social Indicators Questionnaire 287 Appendix 5:List of Interviews 296 References 298
7
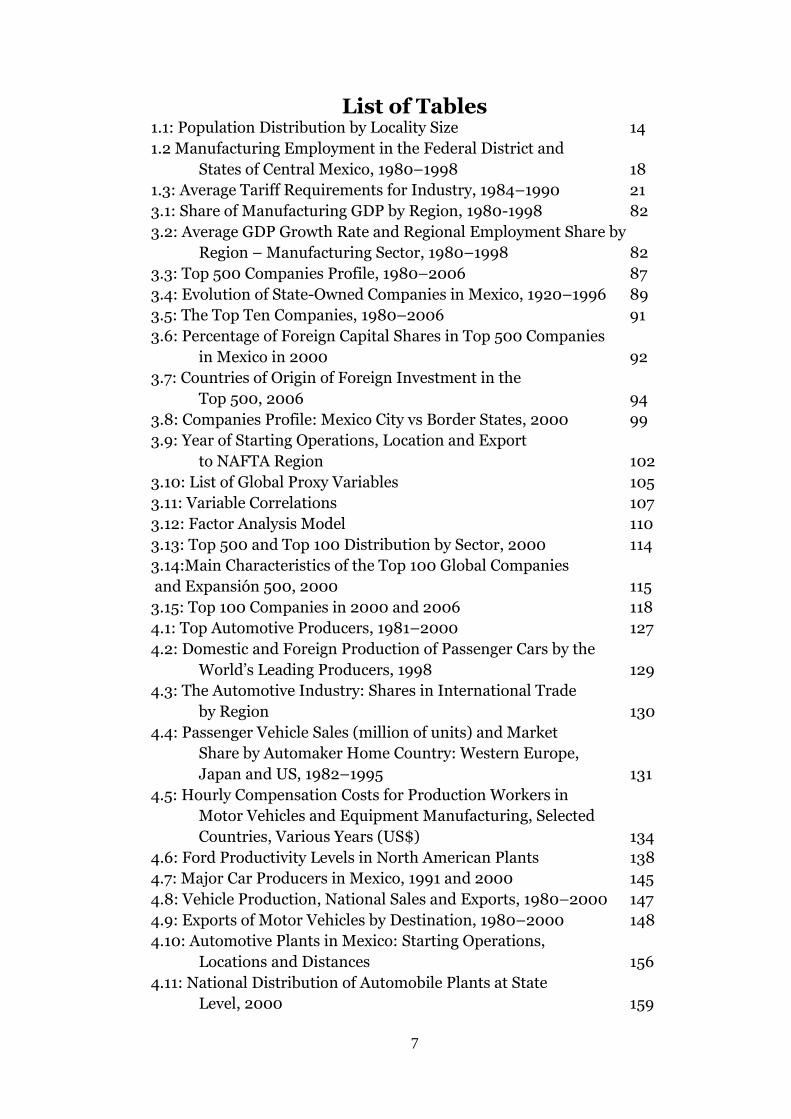
List of Tables 1.1: Population Distribution by Locality Size 14
1.2 Manufacturing Employment in the Federal District and
States of Central Mexico, 1980–1998 18
1.3: Average Tariff Requirements for Industry, 1984–1990 21
3.1: Share of Manufacturing GDP by Region, 1980-1998 82
3.2: Average GDP Growth Rate and Regional Employment Share by
Region – Manufacturing Sector, 1980–1998 82
3.3: Top 500 Companies Profile, 1980–2006 87
3.4: Evolution of State-Owned Companies in Mexico, 1920–1996 89
3.5: The Top Ten Companies, 1980–2006 91
3.6: Percentage of Foreign Capital Shares in Top 500 Companies
in Mexico in 2000 92
3.7: Countries of Origin of Foreign Investment in the
Top 500, 2006 94
3.8: Companies Profile: Mexico City vs Border States, 2000 99
3.9: Year of Starting Operations, Location and Export
to NAFTA Region 102
3.10: List of Global Proxy Variables 105
3.11: Variable Correlations 107
3.12: Factor Analysis Model 110
3.13: Top 500 and Top 100 Distribution by Sector, 2000 114
3.14:Main Characteristics of the Top 100 Global Companies
and Expansión 500, 2000 115
3.15: Top 100 Companies in 2000 and 2006 118
4.1: Top Automotive Producers, 1981–2000 127
4.2: Domestic and Foreign Production of Passenger Cars by the
World’s Leading Producers, 1998 129
4.3: The Automotive Industry: Shares in International Trade
by Region 130
4.4: Passenger Vehicle Sales (million of units) and Market
Share by Automaker Home Country: Western Europe,
Japan and US, 1982–1995 131
4.5: Hourly Compensation Costs for Production Workers in
Motor Vehicles and Equipment Manufacturing, Selected
Countries, Various Years (US$) 134
4.6: Ford Productivity Levels in North American Plants 138
4.7: Major Car Producers in Mexico, 1991 and 2000 145
4.8: Vehicle Production, National Sales and Exports, 1980–2000 147
4.9: Exports of Motor Vehicles by Destination, 1980–2000 148
4.10: Automotive Plants in Mexico: Starting Operations,
Locations and Distances 156
4.11: National Distribution of Automobile Plants at State
Level, 2000 159
8
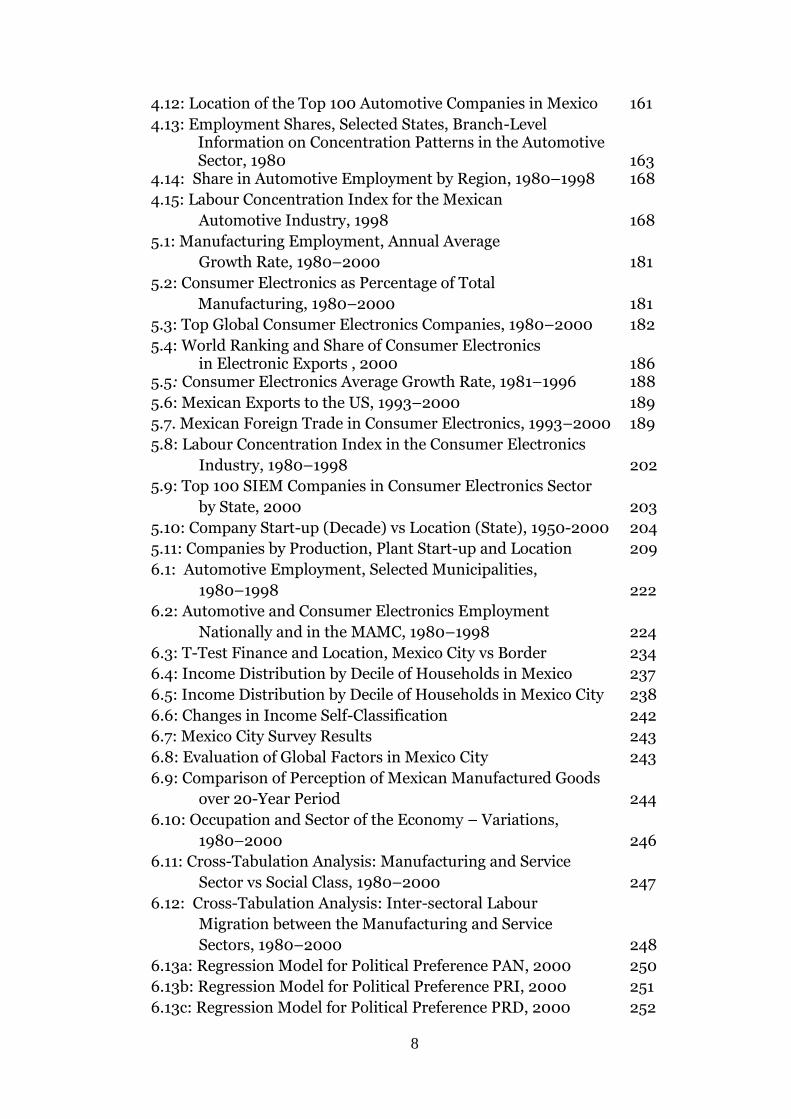
4.12: Location of the Top 100 Automotive Companies in Mexico 161
4.13: Employment Shares, Selected States, Branch-Level Information on Concentration Patterns in the Automotive Sector, 1980 163
4.14: Share in Automotive Employment by Region, 1980–1998 168
4.15: Labour Concentration Index for the Mexican
Automotive Industry, 1998 168
5.1: Manufacturing Employment, Annual Average
Growth Rate, 1980–2000 181
5.2: Consumer Electronics as Percentage of Total
Manufacturing, 1980–2000 181
5.3: Top Global Consumer Electronics Companies, 1980–2000 182
5.4: World Ranking and Share of Consumer Electronics in Electronic Exports , 2000 186
5.5: Consumer Electronics Average Growth Rate, 1981–1996 188
5.6: Mexican Exports to the US, 1993–2000 189
5.7. Mexican Foreign Trade in Consumer Electronics, 1993–2000 189
5.8: Labour Concentration Index in the Consumer Electronics
Industry, 1980–1998 202
5.9: Top 100 SIEM Companies in Consumer Electronics Sector
by State, 2000 203
5.10: Company Start-up (Decade) vs Location (State), 1950-2000 204
5.11: Companies by Production, Plant Start-up and Location 209
6.1: Automotive Employment, Selected Municipalities,
1980–1998 222
6.2: Automotive and Consumer Electronics Employment
Nationally and in the MAMC, 1980–1998 224
6.3: T-Test Finance and Location, Mexico City vs Border 234
6.4: Income Distribution by Decile of Households in Mexico 237
6.5: Income Distribution by Decile of Households in Mexico City 238
6.6: Changes in Income Self-Classification 242
6.7: Mexico City Survey Results 243
6.8: Evaluation of Global Factors in Mexico City 243
6.9: Comparison of Perception of Mexican Manufactured Goods
over 20-Year Period 244
6.10: Occupation and Sector of the Economy – Variations,
1980–2000 246
6.11: Cross-Tabulation Analysis: Manufacturing and Service
Sector vs Social Class, 1980–2000 247
6.12: Cross-Tabulation Analysis: Inter-sectoral Labour
Migration between the Manufacturing and Service
Sectors, 1980–2000 248
6.13a: Regression Model for Political Preference PAN, 2000 250
6.13b: Regression Model for Political Preference PRI, 2000 251
6.13c: Regression Model for Political Preference PRD, 2000 252
9
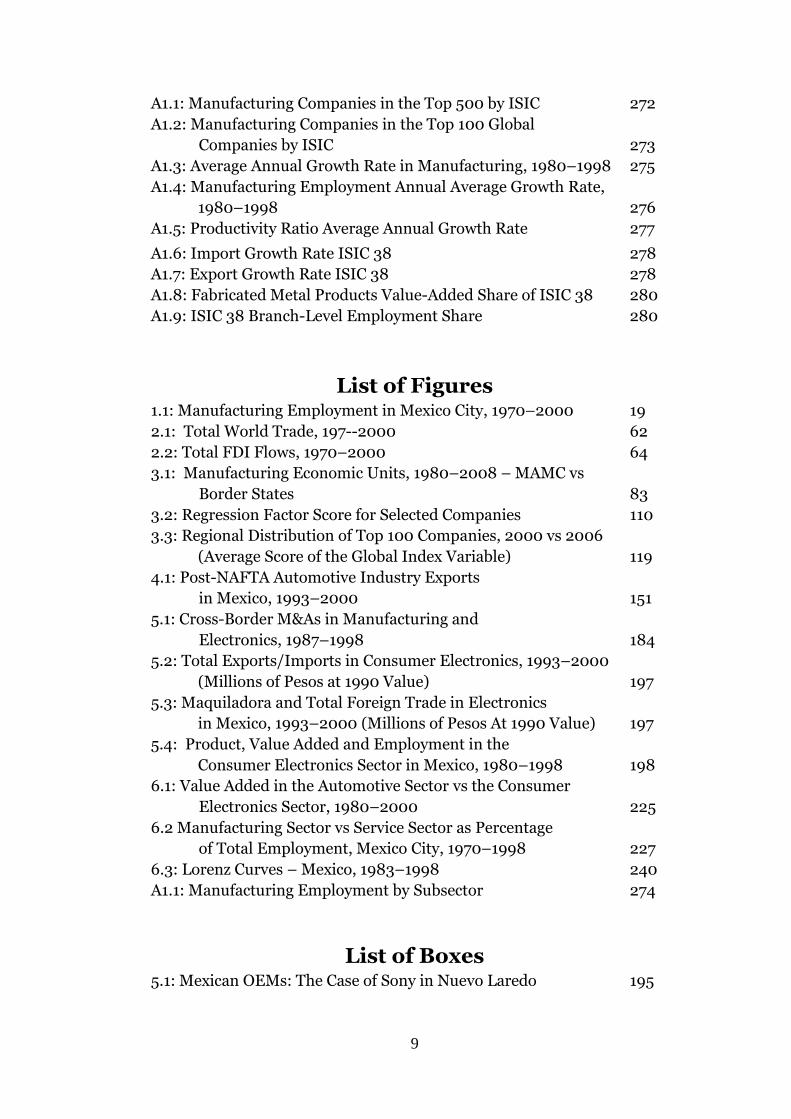
A1.1: Manufacturing Companies in the Top 500 by ISIC 272
A1.2: Manufacturing Companies in the Top 100 Global
Companies by ISIC 273
A1.3: Average Annual Growth Rate in Manufacturing, 1980–1998 275
A1.4: Manufacturing Employment Annual Average Growth Rate,
1980–1998 276
A1.5: Productivity Ratio Average Annual Growth Rate 277
A1.6: Import Growth Rate ISIC 38 278
A1.7: Export Growth Rate ISIC 38 278
A1.8: Fabricated Metal Products Value-Added Share of ISIC 38 280
A1.9: ISIC 38 Branch-Level Employment Share 280
List of Figures 1.1: Manufacturing Employment in Mexico City, 1970–2000 19
2.1: Total World Trade, 197--2000 62
2.2: Total FDI Flows, 1970–2000 64
3.1: Manufacturing Economic Units, 1980–2008 – MAMC vs
Border States 83
3.2: Regression Factor Score for Selected Companies 110
3.3: Regional Distribution of Top 100 Companies, 2000 vs 2006
(Average Score of the Global Index Variable) 119
4.1: Post-NAFTA Automotive Industry Exports
in Mexico, 1993–2000 151
5.1: Cross-Border M&As in Manufacturing and
Electronics, 1987–1998 184
5.2: Total Exports/Imports in Consumer Electronics, 1993–2000
(Millions of Pesos at 1990 Value) 197
5.3: Maquiladora and Total Foreign Trade in Electronics
in Mexico, 1993–2000 (Millions of Pesos At 1990 Value) 197
5.4: Product, Value Added and Employment in the
Consumer Electronics Sector in Mexico, 1980–1998 198
6.1: Value Added in the Automotive Sector vs the Consumer
Electronics Sector, 1980–2000 225
6.2 Manufacturing Sector vs Service Sector as Percentage
of Total Employment, Mexico City, 1970–1998 227
6.3: Lorenz Curves – Mexico, 1983–1998 240
A1.1: Manufacturing Employment by Subsector 274
List of Boxes 5.1: Mexican OEMs: The Case of Sony in Nuevo Laredo 195
10
List of Acronyms
ALTEX
AMIA
Empresas Altamente Exportadoras (High Exporting
Firms Programme)
Asociación Mexicana de la Industria Automotriz
(Mexican Automotive Industry Association)
ANIE Asociación Nacional de la Industria Electrónica
(National Electronics Industry Association)
BANCOMEXT Banco de Comercio Exterior (Bank of Foreign
Trade)
BANAMEX
BIE
Banco Nacional de México (National Bank of
Mexico)
Banco de Información Económica (Economic
Information Database)
BIP Border Industrialisation Programme
BMV Bolsa Mexicana de Valores (Mexican Stock Market)
CANACINTRA Cámara Nacional de la Industria de la
Transformación (National Chamber of
Manufacturing)
CANEME Cámara Nacional de Manufacturas Eléctricas
(National Chamber of Electrical Manufacturers)
CANIECE Cámara Nacional de la Industria Electrónica y de
Comunicaciones Eléctricas (National Chamber of
the Electronics and Electric Communications
Industries)
CANIETI Cámara Nacional de la Industria Electrónica y de
Telecomunicaciones y Tecnologías de la
Información (National Chamber of the Electronics
Industry, Telecommunications and Information
Technology)
CONAPO Consejo Nacional de Población (National Population
11
Council)
CV Capital Variable (Variable Capital)
DDF Departamento del Distrito Federal (Federal District
Department)
DF Distrito Federal (Federal District)
DOF Diario Oficial de la Federación
EU European Union
FDI foreign direct investment
FTA free trade agreement
GATT General Agreement on Tariffs and Trade
GDP gross domestic product
ILO
IMF
International Labour Origanisation
International Monetary Fund
INEGI Instituto Nacional de Estadística y Geografía
(National Institute of Statistics and Geography)
ISI import substitution industrialisation
ISIC
IT
International Standardised Industrial Classification
Information Technology
MAMC Metropolitan Area of Mexico City
M&As mergers and acquisitions
NID new industrial districts
NIDL New International Division of Labour
NAFTA North American Free Trade Agreement
OECD Organisation for Economic Cooperation and
Development
OEM original equipment manufacturer
PAN Partido Acción Nacional (National Action Party)
PCA principal component analysis
PEMEX Petróleos Mexicanos
PITEX Programa de Importación Temporal para Producir
Artículos de Exportación (Programme of Temporary
Imports to Produce Export Goods)
PRD Partido de la Revolución Democrática (Democratic
Revolution Party)
12
PRI Partido Revolucionario Institucional (Institutional
Revolutionary Party)
R&D research and development
RTA regional trade agreement
SA Sociedad Anónima (Limited Company)
SECOFI Secretaría de Comercio y Fomento Industrial
(Secretariat of Trade and Industrial Promotion)
SEDESOL Secretaría de Desarrollo Social (Ministry of Social
Development)
SEDUE Secretaría de Desarrollo Urbano y Ecología
(Secretariat of Environment and Urban
Development)
SE
SHCP
SIEM
Secretaría de Economía (Secretariat of Economy)
Secretaría de Hacienda y Crédito Público
(Secretariat of Finance and Public Credit)
Sistema de Información Empresarial Mexicana
(Mexican Enterprise Information System)
TNC transnational corporation
UK United Kingdom
UN United Nations
UNCHS
UNCTAD
United Nations Centre for Human Settlements
United Nations Conference on Trade and
Development
UNIDO United Nations Industrial Development
Organisation
US United States
WTO World Trade Organisation
13
Chapter One: Introduction
OVERVIEW
This thesis explores the relationship between Mexico City and the most
recent set of economic processes to influence Mexico, namely economic
liberalisation and globalisation. It assesses the extent to which industries
reacted to the shift from national to a more global economic orientation,
leading to a process of transformation of Mexico City’s economy. The
thesis seeks to answer the question: to what extent has the process of
industrial decentralisation characterised by the decline of manufacturing
in Mexico City been caused by trade liberalisation and globalisation? To
address this question, the thesis engages with debates about globalisation
and the pace and geography of neo-liberal economic change, particularly
on the associated effects of a trade regime to urbanisation and vice versa.1
A theme running through the thesis, therefore, is the importance of spatial
restructuring as a consequence of economic change. This restructuring is
indicated by the fact that Mexico City at the end of the 20th century is no
longer the nation’s manufacturing hub and its most dynamic economic
location, a role that it had performed for more than four decades. At the
heart of this restructuring process is Mexico City’s transformation into a
service-sector-dominated labour market while retaining a significant
manufacturing base.
1 Neo-liberal policies, also known as the “Washington Consensus”, include the promotion of central bank autonomy, stabilisation of exchange rates, privatisation programmes and deregulation of financial and trade activities (Maxwell 1999; Stiglitz 2002; Williamson 1997).
14
CONTEXT
Between 1940 and 1980, successive national governments introduced
protectionist measures in an approach broadly known as import
substitution industrialisation (ISI), an economic development strategy
based on state intervention in the economy through combinations of credit
controls, subsidies, direct public ownership of key economic sectors and
selective trade barriers to protect industry from international competition.
The implementation of these policies allowed Mexico to build a relatively
strong industrial sector between the 1950s and the 1970s, a period known
as desarrollo estabilizador (stabilising development) during which Mexico
enjoyed high GDP growth rates, low inflation and moderate external debt
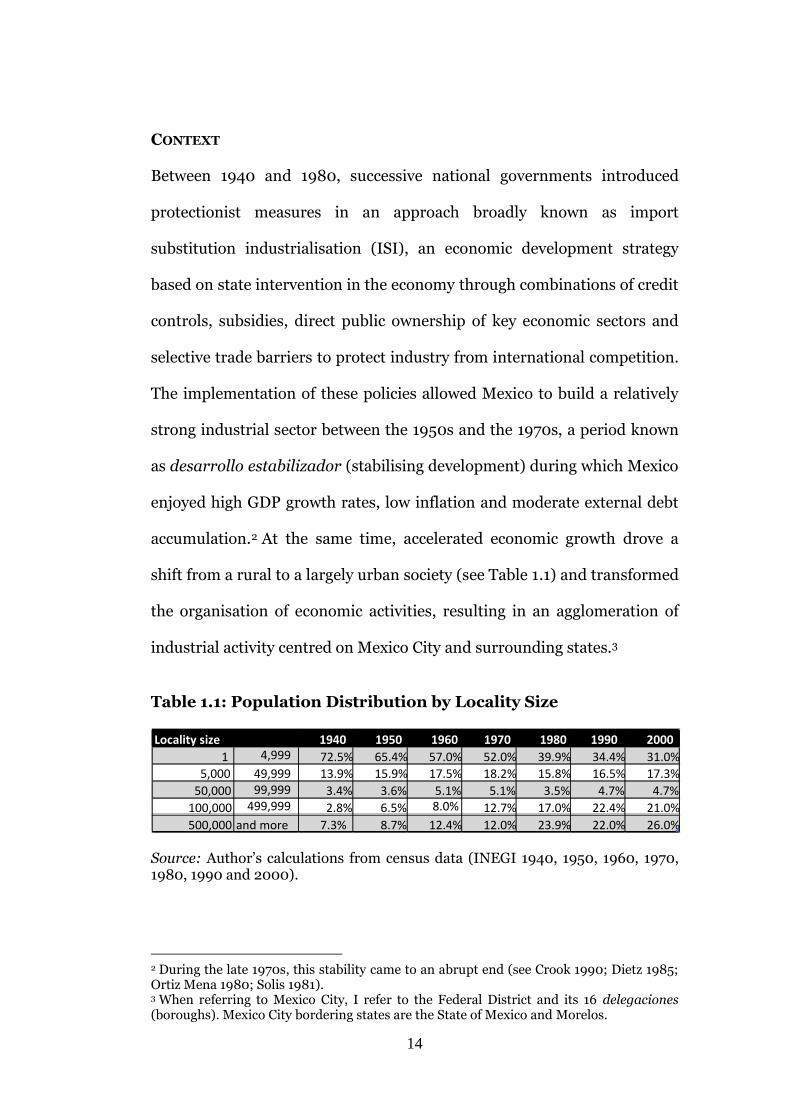
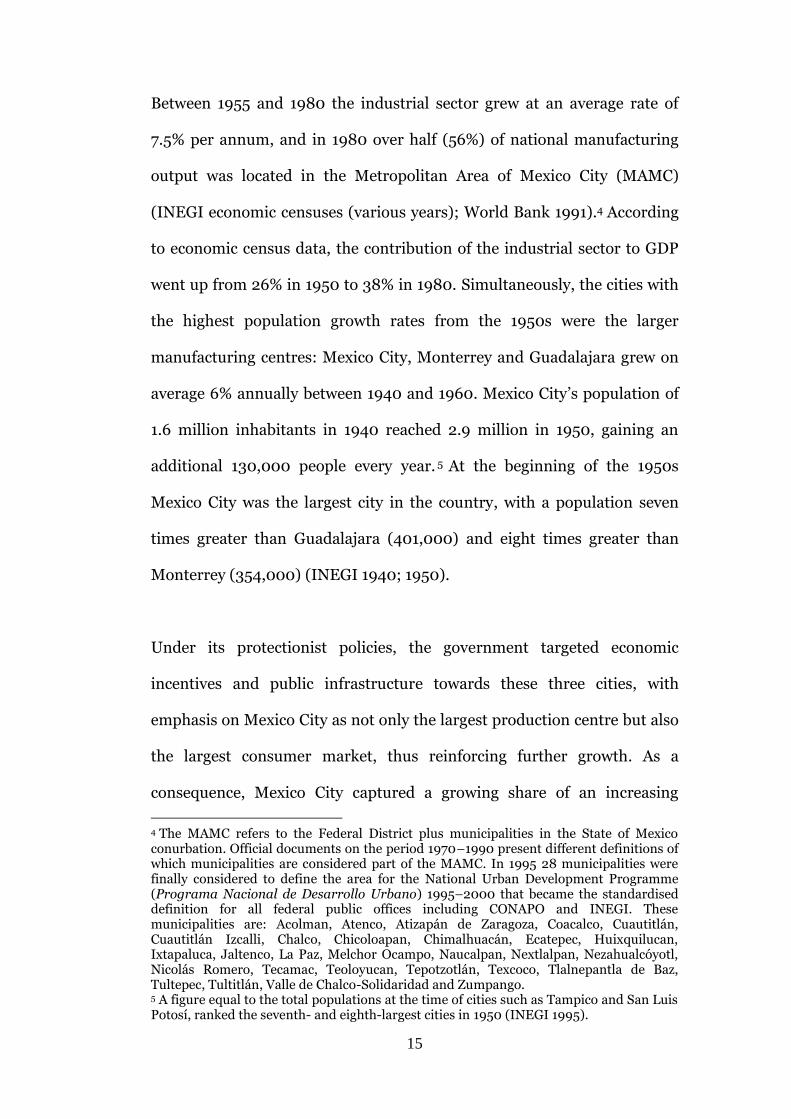
accumulation.2 At the same time, accelerated economic growth drove a
shift from a rural to a largely urban society (see Table 1.1) and transformed
the organisation of economic activities, resulting in an agglomeration of
industrial activity centred on Mexico City and surrounding states.3
Table 1.1: Population Distribution by Locality Size
Source: Author’s calculations from census data (INEGI 1940, 1950, 1960, 1970, 1980, 1990 and 2000).
2 During the late 1970s, this stability came to an abrupt end (see Crook 1990; Dietz 1985; Ortiz Mena 1980; Solis 1981). 3 When referring to Mexico City, I refer to the Federal District and its 16 delegaciones (boroughs). Mexico City bordering states are the State of Mexico and Morelos.
Locality size 1940 1950 1960 1970 1980 1990 2000 1 4,999 72.5% 65.4% 57.0% 52.0% 39.9% 34.4% 31.0%
5,000 49,999 13.9% 15.9% 17.5% 18.2% 15.8% 16.5% 17.3% 50,000 99,999 3.4% 3.6% 5.1% 5.1% 3.5% 4.7% 4.7%
100,000 499,999 2.8% 6.5% 8.0% 12.7% 17.0% 22.4% 21.0% 500,000 and more 7.3% 8.7% 12.4% 12.0% 23.9% 22.0% 26.0%
15
Between 1955 and 1980 the industrial sector grew at an average rate of
7.5% per annum, and in 1980 over half (56%) of national manufacturing
output was located in the Metropolitan Area of Mexico City (MAMC)
(INEGI economic censuses (various years); World Bank 1991).4 According
to economic census data, the contribution of the industrial sector to GDP
went up from 26% in 1950 to 38% in 1980. Simultaneously, the cities with
the highest population growth rates from the 1950s were the larger
manufacturing centres: Mexico City, Monterrey and Guadalajara grew on
average 6% annually between 1940 and 1960. Mexico City’s population of
1.6 million inhabitants in 1940 reached 2.9 million in 1950, gaining an
additional 130,000 people every year. 5 At the beginning of the 1950s
Mexico City was the largest city in the country, with a population seven
times greater than Guadalajara (401,000) and eight times greater than
Monterrey (354,000) (INEGI 1940; 1950).
Under its protectionist policies, the government targeted economic
incentives and public infrastructure towards these three cities, with
emphasis on Mexico City as not only the largest production centre but also
the largest consumer market, thus reinforcing further growth. As a
consequence, Mexico City captured a growing share of an increasing
4 The MAMC refers to the Federal District plus municipalities in the State of Mexico conurbation. Official documents on the period 1970–1990 present different definitions of which municipalities are considered part of the MAMC. In 1995 28 municipalities were finally considered to define the area for the National Urban Development Programme (Programa Nacional de Desarrollo Urbano) 1995–2000 that became the standardised definition for all federal public offices including CONAPO and INEGI. These municipalities are: Acolman, Atenco, Atizapán de Zaragoza, Coacalco, Cuautitlán, Cuautitlán Izcalli, Chalco, Chicoloapan, Chimalhuacán, Ecatepec, Huixquilucan, Ixtapaluca, Jaltenco, La Paz, Melchor Ocampo, Naucalpan, Nextlalpan, Nezahualcóyotl, Nicolás Romero, Tecamac, Teoloyucan, Tepotzotlán, Texcoco, Tlalnepantla de Baz, Tultepec, Tultitlán, Valle de Chalco-Solidaridad and Zumpango. 5 A figure equal to the total populations at the time of cities such as Tampico and San Luis Potosí, ranked the seventh- and eighth-largest cities in 1950 (INEGI 1995).
16
investment budget between 1960 and 1980, reaching a peak between 1965
and 1970, when infrastructure spending located in Mexico City
represented 65% of national infrastructure investment (INEGI 1995).
According to Aguilar (1993), Brambila and Salazar (1984), Ramos Boyoli
(1976), and Ramos Boyoli and Richter (1976), especially for the period
1959–1974, public investment was oriented not towards regional
development but rather towards satisfying short-term industrial
infrastructure needs in favour of the more advanced regions, particularly
Mexico City, thus increasing incentives for concentration.6 These studies
conclude that this pattern of public spending was not only to the detriment
of more balanced regional development but also affected economic
efficiency, contradicting the classic dilemma between aggregate economic
growth and a reduction in regional inequalities (Smith 1995).
The perception of large regional inequalities, including in terms of
industrial concentration, led to the first decentralisation efforts. According
to Bustamante (1983), Cabrero (1998), Rodríguez (1997) and Looney and
Frederiksen (1981) it became increasingly necessary for the government to
intervene in order to deal with “over-concentration” of investment,
productivity and income. As a response, the federal government put in
place policies aimed at economic decentralisation in three different ways:
(i) urban policies that aimed to slow urban and economic growth in the
MAMC; (ii) policies aimed at modifying the economic environment for
some industries in order to influence location decisions and encourage
6 See also Looney and Frederiksen (1981, 1982); Palacios (1986, 1988); Rodríguez y Rodríguez (1982).
17
movement out of the central part of Mexico through modification of select
trade policy barriers; and (iii) urban and regional policies and legislation
aimed at generating a more even national spatial organisation. A set of
policy tools including trusts, tax incentives, and urban and regional plans
and programmes was created, albeit not systematically, to promote
decentralisation, inhibit population growth and migration to Mexico City,
and generate economic incentives and infrastructure in order to influence
business location decisions (Graham 1990; Rodríguez 1997).
After three decades of strong economic growth and despite
decentralisation efforts to attain a more geographically even development
path, at the beginning of the 1980s decentralisation policies appeared to
have delivered limited success (Aguilar-Barajas 1993). Between 1980 and
2000, however, Mexico City began to lose its dominant position in the
country’s economic life and declined in terms of GDP national industrial
share, showing a steep decrease in manufacturing output and jobs (see
Table 1.2). These years coincide with an ambitious programme of
economic reforms undertaken by the federal government which aimed at
trade and investment liberalisation. Central Mexico – defined as the
Federal District plus the capitals of the five neighbouring states of Mexico
(Toluca, 624,362), Hidalgo (Pachuca, 261,533), Morelos (Cuernavaca,
331,170), Puebla (Puebla, 261,533) and Tlaxcala (Tlaxcala, 76,182) –
accounted in 1980 for 27.3% of the national population and more than
18
50% of total manufacturing employment.7 This situation changed over the
following decades as industry appeared to decentralise.
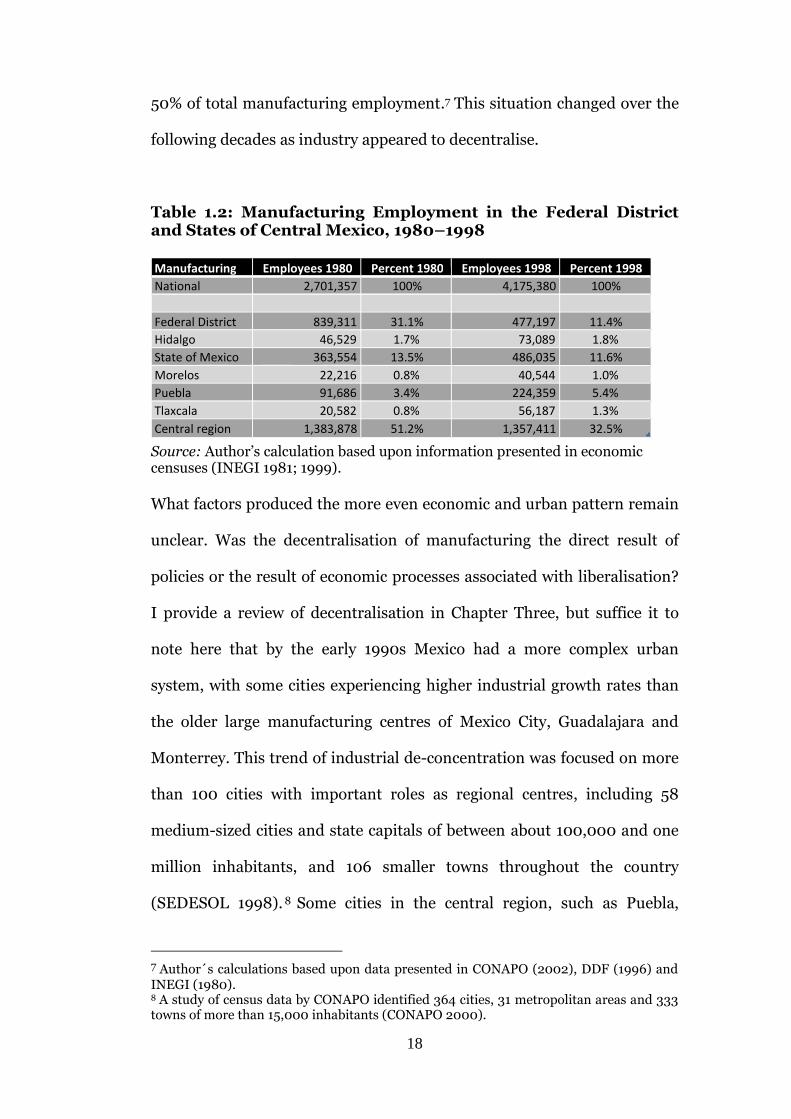
Table 1.2: Manufacturing Employment in the Federal District and States of Central Mexico, 1980–1998
Source: Author’s calculation based upon information presented in economic censuses (INEGI 1981; 1999).
What factors produced the more even economic and urban pattern remain
unclear. Was the decentralisation of manufacturing the direct result of
policies or the result of economic processes associated with liberalisation?
I provide a review of decentralisation in Chapter Three, but suffice it to
note here that by the early 1990s Mexico had a more complex urban
system, with some cities experiencing higher industrial growth rates than
the older large manufacturing centres of Mexico City, Guadalajara and
Monterrey. This trend of industrial de-concentration was focused on more
than 100 cities with important roles as regional centres, including 58
medium-sized cities and state capitals of between about 100,000 and one
million inhabitants, and 106 smaller towns throughout the country
(SEDESOL 1998). 8 Some cities in the central region, such as Puebla,
7 Author´s calculations based upon data presented in CONAPO (2002), DDF (1996) and INEGI (1980). 8 A study of census data by CONAPO identified 364 cities, 31 metropolitan areas and 333 towns of more than 15,000 inhabitants (CONAPO 2000).
Manufacturing Employees 1980 Percent 1980 Employees 1998 Percent 1998 National 2,701,357 100% 4,175,380 100%
Federal District 839,311 31.1% 477,197 11.4% Hidalgo 46,529 1.7% 73,089 1.8% State of Mexico 363,554 13.5% 486,035 11.6% Morelos 22,216 0.8% 40,544 1.0% Puebla 91,686 3.4% 224,359 5.4% Tlaxcala 20,582 0.8% 56,187 1.3% Central region 1,383,878 51.2% 1,357,411 32.5%
19
Querétaro, and Toluca, maintained high growth rates during the 1990s
(4.4%, 5.9% and 4.7% per annum respectively), as did key cities along the
border (Tijuana, Mexicali, Ciudad Juárez) and in the north (Saltillo and
Durango), west (Guadalajara, Guanajuato) and south (Mérida, Cancún,
Campeche), which grew at an average rate of 6% per annum (Aguilar and
Olvera 1991; Aguilar 1997, 1998, 1999; Calva 1995; Delgado 1988, 1991;
Iracheta 1988, 2000; Johns 1997; Legorreta 1983; Pradilla and Castro
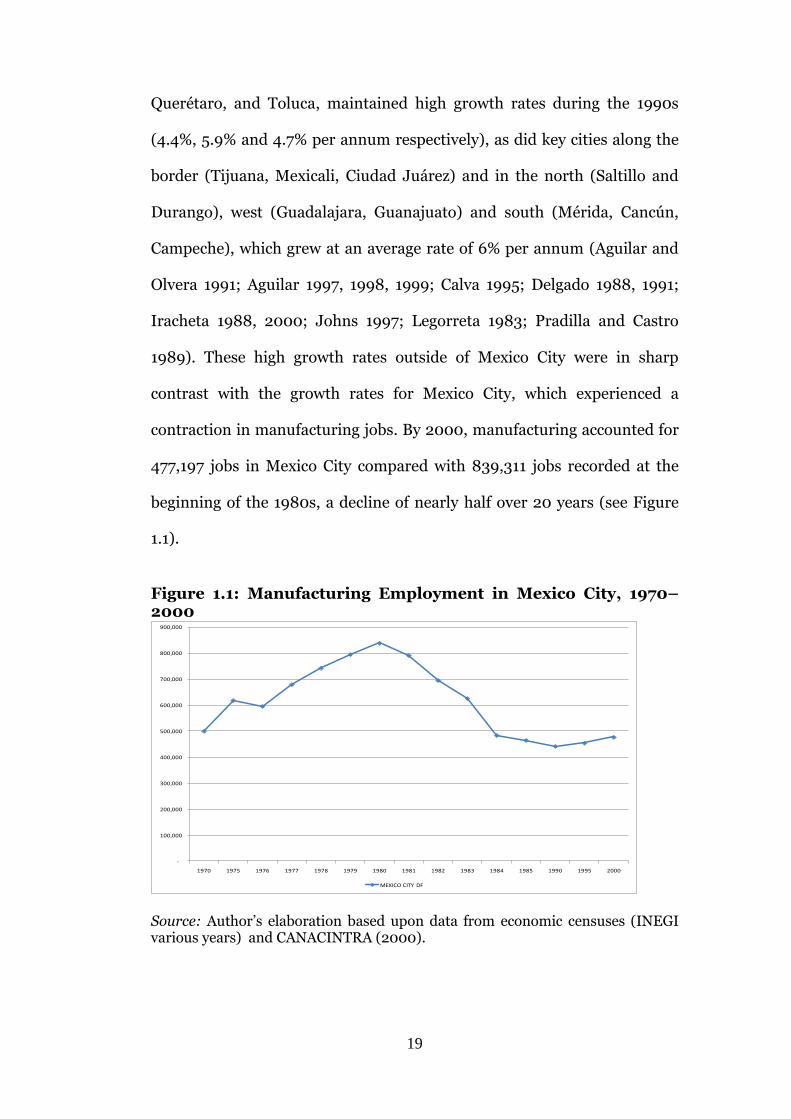
1989). These high growth rates outside of Mexico City were in sharp
contrast with the growth rates for Mexico City, which experienced a
contraction in manufacturing jobs. By 2000, manufacturing accounted for
477,197 jobs in Mexico City compared with 839,311 jobs recorded at the
beginning of the 1980s, a decline of nearly half over 20 years (see Figure
1.1).
Figure 1.1: Manufacturing Employment in Mexico City, 1970–2000
-
100,000
200,000
300,000
400,000
500,000
600,000
700,000
800,000
900,000
1970 1975 1976 1977 1978 1979 1980 1981 1982 1983 1984 1985 1990 1995 2000
MEXICO CITY DF
Source: Author’s elaboration based upon data from economic censuses (INEGI various years) and CANACINTRA (2000).
20
These trends raise important questions about a range of national economic
policies and unplanned outcomes in other fields, such as urban and
regional planning, as to what extent trade policy holds an influence on
industrial location and hence urbanisation. Generally, urban and regional
effects are rarely considered as part of trade policies or vice versa. Indeed,
in the second half of the 20th century the formation of new towns and
cities, or the expansion of existing centres, took place with little attention
to the trade regime (Browder and Godfrey 1999). Similarly, trade policy
rarely took account of the impacts on particular regions other than in the
promotion of opening new commodity markets in, for example, oil (Garza
1986; Gilbert 1997). As I will discuss later in more detail, to some extent
Mexico is an exception – especially in terms of the Maquiladora
Programme, which was designed so that reformed trade regulations
(liberalisation) would promote the development of northern Mexico.9
In the case of Mexico, I will propose that trade liberalisation brought
dynamism to regional development as it opened up local producers to
international competition and new market opportunities. Industries that
9 Formally launched in June 1965 as part of the Border Industrialisation Programme (BIP) implemented by the Díaz Ordaz government (1964–1970), the maquiladora programme set out a series of free trade areas along the US border. Spurred on by high levels of unemployment in the northern states, the programme was a response to the need to attract foreign direct investment without altering the government’s ISI policies for the rest of the country. The maquiladora programme allowed companies to be set up with foreign capital participation of up to 100% and special customs treatment, allowing machinery (including a broad range of equipment) to be imported temporarily free of duty, subject only to a bond guarantee that the goods would not remain in Mexico permanently (hence the maquiladora is also known as in-bond production). The programme allowed products to be assembled and finished in Mexico, with the possibility of re-exporting semi-finished or finished goods to the country of origin or to a third country. Maquiladora production is only liable to tax on the value added created in Mexico. During the 1990s, maquiladoras became the second most important economic export activity after oil and raised employment by almost 20% in some years (Calavita 1992; Craig 1971; Sklair 1993).
21
were no longer protected were forced to modernise and compete under a
new environment dominated by post-Fordist production arrangements,
outsourcing, relocation of affiliate companies, strategic ventures, mergers
and acquisitions, and a general transition towards more capital-intensive
production. In just three years in the 1980s, after four decades of ISI
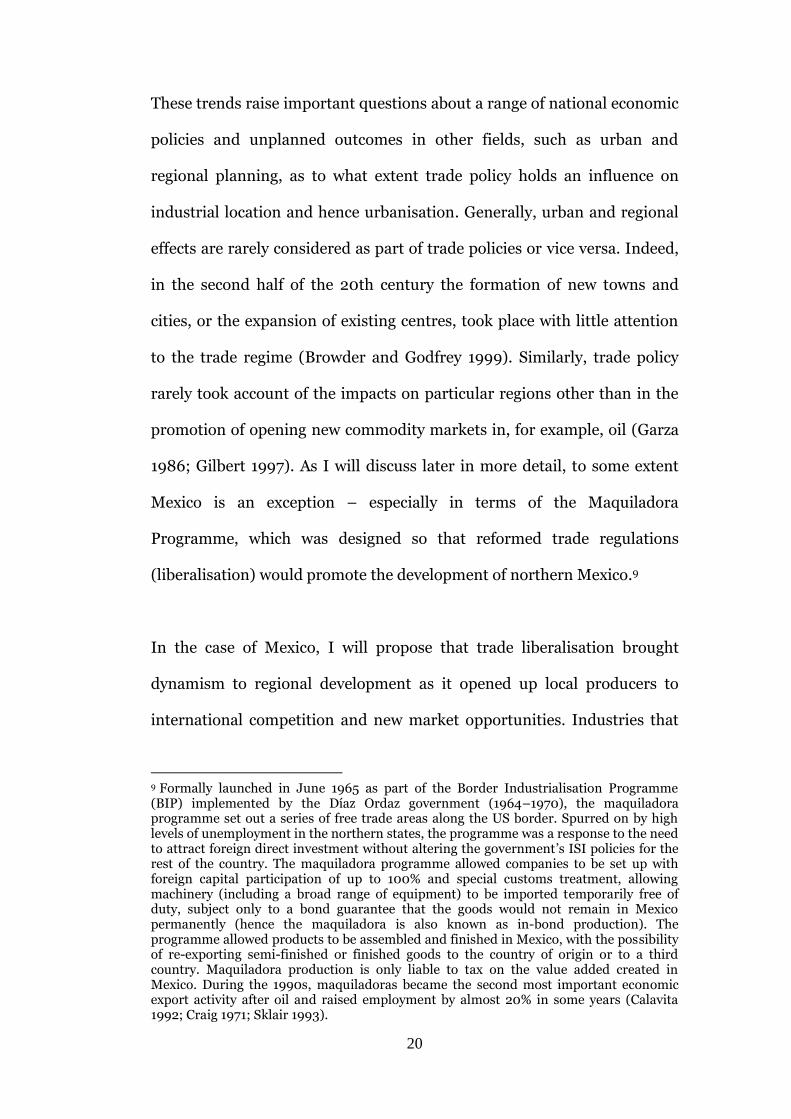
protection, the government lowered most trade barriers. Table 1.3 shows
annual average tariffs and import licence coverage by industry for the
period 1984–1990. In 1985, the national average tariff was 23.5% and
import licence requirements covered 92% of national production. By 1987,
the average tariff was reduced to 11.8%, with a maximum rate of 20%, and
import licence coverage had been reduced to 25% of national production
(SECOFI 1992).
Table 1.3: Average Tariff Requirements for Industry, 1984–1990
Source: SECOFI 1992, p. 7.
Industry (ISIC) 1984 1985 1986 1987 1988 1989 1990 Food products Average tariff rate 42.9% 45.4% 32.1% 22.9% 14.8% 15.8% 16.2%
Share of production subject to quota 100% 80.1% 62.2% 33.3% 20.8% 20.6% 16.8%
Textiles, apparel Average tariff rate 38.6% 43.2% 40.4% 26.6% 16.8% 16.6% 16.7% Share of production subject to to quota 92.9% 66.8% 38% 31.1% 2.8% 1.1% 1%
Wood products Average tariff rate 47.3% 48.5% 44.9% 29.9% 17.7% 17.6% 17.8% Share of production subject to quota 100% 75.6% 25.7% 0 0 0 0
Paper, printing Average tariff rate 33.7% 36.5% 34.8% 23.7% 7.7% 10.1% 9.9% Share of production subject to quota 96.7% 54.1% 11.2% 9.5% 3.4% 4.1% 0
Chemicals Average tariff rate 29.1% 29.9% 27% 20% 13.4% 14.3% 14.4% Share of production subject to quota 58.7% 54% 21.1% 4.8% 0 0 0
Basic metals Average tariff rate 37.1% 38.5% 33.8% 22.4% 13.8% 14.3% 14.3% Share of production subject to quota 99% 53.1% 5.2% 0 0 0 0
Non-metallic minerals Average tariff rate 13.6% 16.7% 18.4% 13.8% 7.9% 11% 11% Share of production subject to quota 93.3% 47.4% 0 0 0 0 0
Metal products Average tariff rate 43.1% 46.3% 30% 20.8% 14.1% 15.9% 16.1% Share of production subject to quota 90.7% 74.8% 54.7% 51.4% 42.7% 44.1% 44.1%
Other industries Average tariff rate 40.9% 42.9% 40.5% 27.5% 17.1% 18.1% 18.4% Share of production subject to quota
100% 50% 0 0 0 0 0
22
The government also abolished export controls and devalued the nominal
exchange rate.10 Although Mexico’s trade reform was unilateral at this
stage, the fact that it had reduced import barriers, and that this in turn had
reversed the lack of incentives for exports, meant that de facto Mexico had
opened the economy to trade and set the conditions for the incorporation
of Mexico into the General Agreement on Tariffs and Trade (GATT) in
1986 and for the signing of the North American Free Trade Agreement
(NAFTA) in 1993 (Aspe 1993; Lustig 1998).
The manufacturing sector’s share in total exports increased from 35% to
56% in 1986 alone. Over the period of this study, from 1980 to 2000, the
net increase in the total value of exports was 1,059%.11 The increase in
exports, however, was insufficient to maintain a balance of trade surplus.
During the first half of the 1990s, Mexico’s trade balance registered a large
deficit as imports increased; this was encouraged by an overvalued peso
against the US dollar, which in turn reduced the cost of inputs to goods
that Mexico exported and introduced fierce competition to Mexican
manufacturing as import barriers for some manufacturing goods were
removed and some maquiladora production was allowed to be sold
domestically under new trade regulations (WTO 2002). Statistics indicate
that international trade as a percentage of GDP increased from 24% in
10 For further discussion of Mexico’s trade liberalisation policies that led to accession to GATT and to the signing of NAFTA, see Aspe (1993); Lustig (1998); and Omahe (1995a). 11 Although the sharpest increase in manufacturing exports as a share of total exports was accentuated in 1985 by a drop in international oil prices, exports increased by a factor of 10 from US$1.111 billion in January 1980 to US$11.252 billion in January 2000, whereas oil exports as a share of total exports went from 59.9% in January 1980 to 10.6% in January 2000 (BIE 2005).
23
1980 to 48% in 1995 and 50.6% in 2000, but a quick glance at foreign
trade figures for the period gives an idea of the extent of the impact of
NAFTA as a boost to trade with the US and Canada. The total share of
exports to NAFTA countries went from 68% in 1980 to 90% in 2000, with
exports to the US accounting for 73% of total Mexican exports, and
imports from NAFTA countries went from 68% in 1980 to 75% in 2000
(BANCOMEXT 2000).12
Although these trends are dramatic and indicate one dimension of
economic adjustment, in terms of increases in total foreign trade activity, a
breakdown of the data by sector, company, region and city reveals that the
trends are not uniform. The differentiated responses of certain industries
to trade liberalisation hint at more complex economic interactions. In this
regard, Mexico City’s transition from manufacturing to a service-sector-
dominated economy over a period of 20 years, and its newly acquired
economic primacy by the end of the study period, underlines the
complexity of economic interactions between liberalisation, government
policy, company decision-making and spatial balance.
This brief survey of the context for the research raises two questions as
points of departure. First, to what extent does the trade regime determine
industrial location patterns and therefore trends of industrial
12 These increases in foreign trade with NAFTA countries were at the expense of Latin American and European countries, with the latter witnessing a fall in relative trade activity with Mexico over the period, reducing its share in exports from 16.8% in 1980 to 3.9% in 2000 and its imports from 18.7% in 1980 to 9.6% in 2000. However, countries in the Pacific Rim dramatically reduced their share of Mexican exports from 10.2% to 1.2% while increasing their uptake of Mexican imports from 7.3% to 11.3% over the same period (BANCOMEXT 2000).
24
concentration and ultimately urbanisation? Second, how does trade
liberalisation influence location decisions and outcomes as one component
of a complex economic process that includes global economic integration?
THE RESEARCH HYPOTHESIS: KRUGMAN’S TRADE REGIME AND
INDUSTRIAL CONCENTRATION
To explore these questions, the thesis draws on, and critiques, an
influential paper by Krugman and Livas (1996) that developed a
theoretical economic model, inspired by the case of Mexico City, to explain
the size and primacy of the “Third World metropolis”. The paper pointed
to agglomeration economies and location decisions that arise when
manufacturing tries to serve a domestic market under ISI. The authors
argued that a trade policy that closes off the domestic market leads to the
emergence of a central megacity, while a policy of opening can lead a
metropolis to lose its dominant position. Using Mexico City as a case
study, Krugman and Livas argue that Mexico underwent a process of
decentralisation as it liberalised trade, further arguing that the change in
patterns of agglomeration in Mexico is associated with a shift in trade
regime and that with extended trade liberalisation a shift from central
Mexico to northern states would follow, leading a process of economic
decentralisation from Mexico City.
A major reason for the concentration of manufacturing in Mexico City,
Krugman and Livas argue, was the powerful backward and forward
linkages the site offered.
25
Firms manufacturing for the Mexican domestic market had an incentive to choose production sites with good access to consumers; the huge and relatively affluent population concentration at Mexico City ensured that sites close to the capital offered the best market access. So the size of the national metropolis is the result of a self-reinforcing process of agglomeration… (Krugman and Livas 1996, p. 39)
The argument relies critically on the assumption of significant economies
of scale and industrialisation oriented primarily toward the domestic
market under an import substitution regime. According to Krugman
(1995) the megacity formation depends on the assumption that
industrialisation is inward-looking, primarily oriented towards the
domestic market. Correspondingly, the shift away from such policies may
limit future growth and eventually result in cities shrinking as
manufacturing relocates. Economic integration through the facilitation of
trade will tend to increase the tendency towards agglomeration in regions
closer to the newly opened markets (Krugman and Livas 1996). A shift
towards concentration or decentralisation will depend therefore on the
balance between economies of scale and the transaction costs imposed by
space (including, for example, tariff barriers as well as transport costs).
Similar conclusions to Krugman and Livas were reached by Hanson
(1996a), who examined how trade liberalisation and economic integration
between the US and Mexico affected the location of economic activity in
Mexico. To Hanson, NAFTA was likely to contribute to the expansion of bi-
national production centres along the US–Mexican border as trade
barriers become progressively lower. Moreover, as manufacturing activity
tended to be relocated from the US to Mexico as a consequence of NAFTA,
26
so complementary manufacturing activity would relocate from the interior
of Mexico, in particular the MAMC, to border cities. Hanson (1996a)
argued that trade liberalisation had contributed to the decline of the
manufacturing belt in and around Mexico City and the reorientation
towards specialised industrial centres in the north, reflecting their lower
transportation costs to the US market. He found that some agglomeration
externalities are associated with clustering of supply industries, but not
with agglomeration of firms in the same industry.
An important dimension of Krugman’s argument is that the shift
(decentralisation) in manufacturing away from Mexico City toward, in
general terms, the northern states would have unfolded even if there were
no special locational advantage to production in the north. As Krugman
and Livas put it:
…before the beginnings of import substitution Mexico City was far less dominant in Mexico’s economy and manufacturing sector than it was later to become, and … since liberalization began in the 1980s there has been a dramatic shift of manufacturing away from Mexico City, especially to the northern states. Admittedly, the Mexican experiment is not as pure as we would like: the northern states are not only less congested than Mexico City, they are also closer to the US border. Our informal argument suggests, however, that much the same history would have unfolded even if there were no special locational advantage to northern production, and that trade liberalization will shrink metropolises in other Third World countries as well. (Krugman and Livas 1996, p. 140)
Their argument is that access to markets under a free trade regime reduces
the transport costs of border cities, triggering circular cumulative
causation. Economic decentralisation therefore occurs eventually because
reliance on the domestic market declines sufficient to make the backward
27
and forward linkages strong enough to support the concentration of
production, and a cumulative unravelling process takes place.
Considering the timing of the liberalisation of trade and of the
decentralisation of industrial activity away from central Mexico, Krugman
and Livas’s and Hanson’s analyses may have been premature. At the time
of their publication, their arguments could only be conjecture based on the
early phases of trade liberalisation that started in 1986 when Mexico
joined the GATT, and were unable to take into account the impact of
NAFTA, which began only two years before. With the benefit of greater
data availability and more time for firms to make decisions according to
the new economic and policy conditions, considering the changes from the
vantage point of the 2000s seems more reasonable. Krugman and Livas’s
work therefore serves as a hypothesis suitable for testing.
AN ALTERNATIVE HYPOTHESIS: GLOBALISATION, POST-FORDISM AND CITIES
In using Krugman and Livas’s work, I am aware of an important set of
critiques and dissenting viewpoints, especially from economic geography
(see Boddy 1999; Dymski 1996; Martin and Rogers 1994a, 1994b; Martin
and Sunley 1996; Scott 1992a; 1998; 2000). These authors have welcomed
the attention to space from orthodox economists but question their
awareness of existing analyses of the “space economy”. The Krugman and
Livas model neglects to take into account a range of variables that might
influence location decisions and how these may affect urban and regional
distribution. Broadly, these “neglected” processes relate to economic
28
globalisation; changes in trade and investment regimes, vertical
disintegration under post-Fordism, and the motives of regional and local
clusters; de-industrialisation and the rise of the service sector; and the role
played by non-national economic agents such as multi- or transnational
corporations (TNCs). 13 A broad church of literature has considered
economic agglomeration using these processes (see Cooke 1988; Harvey
1990; Hirst and Zeitlin 1989; Piore and Sabel 1984; Porter 1990; Sassen
1991; Storper 1997).
Krugman’s approach has also been criticised for its abstract universalism
and mathematical determinism (Boddy 1999; Martin and Sunley 1996), yet
its appreciation of spatial definition is rather under-determined. Krugman
does not offer a definition of an urban area or a “city”. No limits or
boundaries are suggested to help disentangle the “urban” from the “rural”
or “suburban”. As such, “urban agglomeration” obscures not only the
differential and dynamics of economic interactions, but also the linkages
and webs that connect cities together as well as connecting them to regions
and nations. As a number of influential academics have noted, cities and
regions are key nodes in the global economy (Castells 1996; Friedmann
1986, Knox and Taylor 1995; Parnreitier 2001; Sassen 1991; Storper 1997).
Moreover, these authors note that while urban and regional economies
have long been core components of the international economic system,
13 The symbolic starting point of Fordism dates back to 1914, when Henry Ford launched the assembly line method of production. The technological and organisational innovation introduced by Ford was a continuation of existing economic trends. The corporate mode of business organisation had, for example, been developed by the railway industry over the 19th century and spread rapidly after economic partnerships such as the Trust and the Cartel appeared and flourished at the end of the century (Lipietz and Massey 1987).
29
globalisation has been seen to reinforce in dynamic ways the economic use
and necessity of geographic centralisation and consolidation (Sassen 1991).
In particular, this perspective is at odds with Krugman and Livas’s focus
on trade costs and their neglect of other factors that determine company
location decisions. Scholars such as Harvey (1982), Power (2000), Sassen
(1991) Scott (1992b), and Thrift and Leyshon (1994) have noted how
contemporary investment flows tend toward the localisation or embedding
of production activities in certain “nodes” – or “command centres”, in
Sassen’s language – of the global economy, resulting in systems for the
provision of a whole range of specialised “producer” services (Sassen
1991). Importantly, these new services involve a relation with “place”
where processes of global economic management, knowledge creation and
dissemination and exchange occur (Pryke and Lee 1995). It is suggested,
therefore, that there is a range of processes under conditions of
liberalisation that would continue to oblige firms to retain established
locations, to locate to more than one site and to “link up” with new or
expanded service sectors.
The insights of these authors point to what I consider to be an alternative
hypothesis to that of Krugman and Livas; namely, that the complex and
dynamic nature of the spatial economy under globalisation is the foremost
explanation of manufacturing change in Mexico. From this standpoint,
industrial decentralisation from Mexico City is not the result of trade
liberalisation alone, as Krugman and Livas have argued, but the result of
complex interactions in a dynamic global environment rooted in new
30
business practices such as post-Fordism and vertical disintegration; an
international division of labour; and finally the dynamics of new
determinants of localisation under a new logic of global market economic
integration. Subject to the limitations imposed by the data, the thesis will
test this alternative set of ideas.
METHODOLOGICAL APPROACH
The research for this thesis adopted a deductive approach combining
quantitative and qualitative methods. The quantitative analysis was
focused at the company level. This is a major innovation over the work of
Krugman and Livas, which does not consider sectors, much less firms, in
any detail. This level of analysis was chosen because variations within any
sector or industry captured by aggregate data are based on average figures
for production, value added and employment and do not capture cross-
variable interactions which can only be disentangled when looking at
particular firms – their histories, business profiles, economic activities and
business decisions that may be associated with policies.
The research used a unique set of firm-level data. The Top 500 Companies
database compiled by the journal Expansión (“Las 500 empresas más
importantes de México”) was selected as a reliable and comprehensive
compilation of data14. The database appeared for the first time in 1975,
14 Expansión Journal is a Mexican magazine focused on the Economy and Finance based in Mexico City. It is characterised as a planning guide for businesses in Mexico. It provides coverage of the Mexican business character and the ideas that drive the private sector in Mexico and is recognised as one of the leading business magazines in Latin America. It started operations in 1966 and it was redesigned in 1999, currently it is a major publication targeting audiences and global businesses in Mexico and the Hispanic business community in the US. Expansión is owned since 2005 by media giant Time Warner, publishing division, Time Inc, and in 2007 Expansión launched, along with
31
with only the top 350 companies and a ranking based on total sales figures.
A revised format was produced in 1979, the first year in which the database
was computer-generated and 500 companies included. Given the absence
of publicly verifiable data at the time, the original listing was produced
from 40,000 questionnaires, interviews conducted by the Expansión team,
and individual companies willing to participate because of the positive
publicity derived from appearing in or advertisement contracts with
Expansión. The 500 companies on the listing have sales figures that
represent close to 70% of Mexican GDP.
From 1975, data collected in the listing have expanded to include
information from the Mexican Stock Exchange and the Mexican Banking
Association. The early list was weakened by companies declining to
provide all relevant information due to commercial disclosure policies. As
more companies have become listed on the Mexican Stock Exchange and
with other public information measures, the Expansión list has become
more systematic and robust. For the purposes of the present study, the
databases for 1980 and 2000 were originally selected, marking
approximate pre-liberalisation and post-NAFTA periods. But, as the 2000
base was limited as a benchmark to assess the impact of changes during
the 1990s, to which some firms may have been slower to adapt, the
database for 2006 was also acquired. The 2006 dataset from Expansión
adopted a broader definition of firm size and included financial services.
CNN, CNNExpansion.com, a website specialised in economics, finances and businesses in Mexico and Latin America, adapting the model CNNmoney.com to the Hispanic market. Expansión has achieved editorial success over the lifespan of 40 years as the leader of business press in Mexico. Expansión´s annual publication “Las 500 Empresas más importantes de México” is the flagship publication of Expansión Editorial Group.
32
According to Expansión the inclusion of financial companies in the
database was necessary because of their total sales, the principal variable
for company selection, which have remained consistent over time.15
The research explores the profile of companies through the analysis of the
main economic variables contained in the Expansión database. The
records provided include (i) sales, (ii) exports, (iii) imports, (iv) type of
company (i.e., Mexican private company, public company and
transnational corporation), (v) location of company headquarters,16 (vi)
total employment, (vii) share of foreign capital, (viii) origin of foreign
capital, (ix) source of financial resources (banking, Mexican Stock
Exchange), (x) details of receipt of export promotion programme funds,
(xi) export destination, (xii) origin of imports, (xiii) total assets, (xiv) total
debt, (xv) year of starting operations, and (xvi) sector of the economy.
The quantitative methods used in this thesis vary from simple descriptive
methods such as frequencies, cross-tabulations, measures of central
tendency (mean, media and mode) and logarithmic growth rates to more
complex quantitative techniques that require a little more explanation.
First, the research used a concentration coefficient, a measure that allows
for comparisons between sets of subgroups and the total, in this case
between the share of manufacturing as part of the economy at state level
and the share of manufacturing as part of the national economy. Second,
tests were designed to determine the significance of differences between
15 Interview with Elise Lemaire, Commercial Manager of Expansión y Dinero Inteligente, CNN-Expansión. 16 Which, according to Mexican government regulations, is also the fiscal address.
33
two or more groups. Bi-variate analysis explores whether the differences
between the distributions of two variables are statistically significant. As
most of the datasets record ordinal or interval/ratio data, the most
appropriate test was a parametric test allowing a comparison of
parameters, specifically the statistical parameter of means of, for example,
TNCs versus Mexican corporations or export-oriented companies against
non-exporters.
The third technique is principal component analysis (PCA), a data
reduction technique designed to represent a wide range of attributes on a
smaller number of dimensions, which enables an assessment of the degree
to which items measuring the same phenomenon (electoral preferences,
job satisfaction, poverty, etc.) reflect the same concept.17 PCA provides an
assessment of the factorial validity of questions that make up scales by
indicating the extent to which these measure the same concepts or
variables. PCA also helps with a large number of variables by determining
the degree to which they can be reduced to smaller sets. The most common
use of factor analysis is to explain the relationships between a number of
variables without determining the extent to which they fit into a particular
model.
For the present research, PCA is useful in order to determine how
information from various indicators (variables) can be combined to
measure a firm’s relative “global economic orientation” status (globality),
17 PCA is a type of factor analysis. In statistical terminology, both terms are used interchangeably.
34
associated to free trade regime. It is important to remember that PCA is
primarily concerned with describing the variations or “variance” shared by
elements based on three or more variables. The result of PCA is the
creation of a single Globality Index which assigns a specific value or score
to each sample firm representing the company’s global status in relation to
all the other companies in the sample. The index consists of a combination
of individual indicators with a significant correlation to one another based
on shared underlying global components. PCA can be used to identify from
a group of indicators the underlying components that can at least partially
explain why, for the purposes of the present research, the indicator values
differ between companies. Each component is assumed to capture single
attributes that are shared by companies. One of the reasons why
companies have different values for each of the variables is because of their
relative global status. The objective for using PCA in the globality
assessment exercise, therefore, is to extract the “global component” that
can be used to build a company-specific index of relative globality. In
Chapter Three, PCA is applied to indicators that are found to show a strong
correlation with the defined global benchmark indicators (foreign trade
and foreign capital flows). Filtering out the indicators in this way leads to a
reliable global indicator that correlates consistently and strongly to relative
globality. To complete the filtering process all the variables registering a
significant level of correlation are added to the list of globality indicators
(see Chapter Three). The model was constantly refined and the results
were robust and statistically significant.18
18 With a Kaiser-Meyer-Olkin measure of sampling adequacy of >.80 and a Bartlett’s test of spherisity significance of >.0005.
35
The main reason behind the decision to conduct PCA tests was to produce
empirical evidence using a strong statistical tool to create parameters, not
only to allow descriptive analysis but also to analyse the processes
involved. The PCA was constructed to include most of the variables
associated with the global factors mentioned above. 19 The statistical
significance of the model was high, and the results were consistent when
contrasted with individual cases. The results were then ranked. The
analysis is presented with a special focus on the top 100 companies in the
ranking (most globally oriented companies).
A different methodological approach is adopted in Chapters Four and Five,
which present case studies of two important sectors of the Mexican
economy. A qualitative approach at sector level was conducted in order to
analyse decentralisation trends, selecting two sectors with different
characteristics and patterns of concentration (see Appendix 1). The
automotive and consumer electronics sectors were chosen because they
present the highest growth trends in output and exports after trade
19 Factor analysis is primarily concerned with describing the variations or variance shared by element scores (people, units, etc.) based on three or more variables. The Kaiser-Meyer-Olkin measure of sampling adequacy tests an index for comparing the magnitudes of the observed correlation coefficients with the magnitudes of the partial correlation coefficients. The smaller the value of the index, the less appropriate the model. In general, scores above 0.60 are acceptable, above 0.70 are good, and above 0.80 are commendable, here the model score is (0.775). The Bartlett test for sphericity, if significant (as it is here), means that the dependent measures of two or more variables are correlated. In the component matrix the first component that is “extracted” accounts for the largest amount of variance shared by the test. The second factor consists of the next largest amount of variance which is not explained by the first one. In this case the variance accounted for by the first factor is 0.77 or 77% of the total variance. In the component matrix the first factor extracted from an analysis is that which accounts for maximum variance. Since the object of the factor analysis is to reduce the number of variables we have to handle, this would not be achieved if we used all of them. This is really a question of how many of the smaller factors we should retain, as it is the first few that explain most of the variance.
36
liberalisation. For a time they represented the most dynamic sectors of the
economy under the new economic regime, a situation confirmed by the
Globality Index and the scores for firms in both sectors, which ranked at
the top end of global companies.
These two sectors also present different characteristics to be considered
together as candidates for the qualitative research. For example, the
automotive sector has a long tradition in Mexico and has gradually
integrated into the Mexican economy in spite of being a sector dominated
by TNCs, with high value added levels, whereas consumer electronics, also
a sector dominated by TNCs, has a low level of integration in the
productive chain and low levels of value added. Both sectors were
concentrated in the manufacturing belt of Mexico City before the period of
liberalisation, and over the 1990s have changed their location distribution.
The automotive sector, although not exclusively, has re-concentrated in
the cities of central Mexico, and consumer electronics, notably, in cities
along the Mexico–US border.20
The qualitative information for these chapters was gathered through 30
interviews conducted with officials at the Mexican Ministry of Economic
Affairs, as well as officials at companies specialising in machinery and
metal production, and staff and managers of automotive companies
(Nissan, Volkswagen, Ford and General Motors) and consumer electronics
companies (including Philips, Daewoo, Sony and Sanyo). A number of
20 With the exception of Coahuila and Sonora, the largest share of automotive employment is located in non-border states.
37
interviews were also conducted with local suppliers to the automotive or
consumer electronics sectors. A full list is available in Appendix 5.
Finally, a range of national and local newspapers and specialist magazines
was consulted. These included, inter alia, the Automotive Year Book,
Electronics Times, Expansión and Mundo Ejecutivo. Material held in the
following archives was also collected: the Asociación Mexicana de la
Industria Automotriz (AMIA, Mexican Automotive Industry
Association)21; Asociación Nacional de la Industria Electrónica (ANIE,
National Electronics Industry Association); Cámara Nacional de
Manufacturas Eléctricas (CANEME, National Chamber of Electrical
Manufacturing); Cámara Nacional de la Industria de la Transformación
(CANACINTRA, National Chamber of Manufacturing); and Cámara
Nacional de la Industria Electrónica y de Telecomunicaciones (CANIETI,
National Chamber of the Electronics and Telecommunications Industries).
CONCLUSION AND THESIS ORGANISATION
The thesis sets out to examine the transformation of Mexico City against a
context of economic policies, particularly those related to changes in the
trade regime. Broadly, the thesis is motivated by questions regarding the
long-standing debate about the consequences of the so-called neo-liberal
policies. By having a Mexico City-centred approach and by looking at
industrial change, my aim is not to look at the process of decentralisation
per se or to assess the success of regional policies in promoting a more
21 AMIA annual reports are referred to in the text by their individual year of publication, and are referenced in the bibliography as a set.
38
even regional development. The first aim of the research is to contribute to
the debate on the so-called consequences of liberalisation policies in
Mexico by focusing on the deep changes seen at the urban level, notably in
Mexico City, which was the nation’s economic hub for so long.
Chapter Two provides a synoptic critique of the key literature
underpinning the research. One of the most prominent debates in the
social sciences at the beginning of the 21st century has concerned free
trade and the transition from protectionist regimes. Paul Krugman has
been prolific in debating free trade ideas and suggesting the industrial and
regional changes that occur as a consequence of trade liberalisation and
economic integration, and his joint work with Raúl Livas about Mexico
City provides inspiring ideas that form the basis to my main hypothesis.
The chapter also reviews writing on globalisation and draws attention to
debates from economic, sociological and geographical studies, which focus
on post-Fordism, the new international division of labour (NIDL) and the
role of centrality in the global economy.
Chapter Three puts forward the context in which the process of economic
liberalisation in Mexico took place, focusing particularly on trade
liberalisation. It looks closely at how this economic process led to changes
in the balance of Mexico’s national economy, and explores the
relationships between global economic integration and regional
restructuring processes in Mexico. An empirical analysis comparing
Mexico City with the northern part of the country, the latter arguably the
most dynamic region under the aegis of free trade, is also presented in
39
Chapter Three. Using national aggregated data and company-level data
from the Top 500 Companies list, my aim is to present empirical evidence
of the regional transformation described briefly in Chapter One.
The aim of Chapters Four and Five is to analyse the effects of trade
liberalisation in Mexico and test Krugman’s ideas for two specific
industries. This analysis aims to explore, at the most disaggregated level of
economic activity, localisation patterns over time, from the ISI period
onward. By analysing industrial sector performance, from the general to
the particular of the company level, these chapters assess concentration
trends in order to provide a more specific insight into the Krugman
argument that liberalisation promotes industrial decentralisation.
Chapter Six considers decentralisation from the perspective of Mexico
City. The chapter looks at how the city has been affected by economic
change and, by examining the effects of these changes on the case study
automotive and consumer electronics sectors, attempts to understand how
the city’s decline as a location that is attractive to industry has played out.
Rather than investigating the consequences solely from the position of
labour in manufacturing, the analysis looks at the standards of living for
the Mexico City population. Trade liberalisation, to follow the logic of the
principal hypothesis, suggests industries will restructure but outlines no
analysis, or concern, for those actually or formerly employed in the
40
original centres of manufacturing. 22 Using survey data, more fully
explained in Chapter Six, from age group cohorts that were economically
active at the time of economic restructuring (1982), the chapter aims to
gather opinions on how the 20-year transformation affected peoples’
everyday lives. The views gathered on labour conditions and practices,
social mobility and opportunities were particularly helpful in trying to
contextualise concepts such as globalisation and trade liberalisation and
form conclusions from a broader and more pragmatic perspective.
Chapter Seven presents the conclusions to the thesis. These will focus on
the research implications of location being an outcome of economies of
scale and transaction cost interactions in a transitional economy that has
moved from a closed trade regime to an open one, contrasting Krugman
and Livas’s forecasts with the thesis findings.
22 A number of authors have looked at social and economic change in Mexico City over or within the period 1980–2000, but none have done so from the perspective adopted in this thesis (see Coulomb and Schteingart 2006; Parnreitier 2001).
41
Chapter Two: Production, Markets and the Role of Centrality in the Global Economy
OVERVIEW
This chapter provides a critical review of the debates concerning new
economic geography and globalisation in order to establish a theoretical
framework within which to place the research. In the first section, I
present a review of the new economic geography literature, including the
ideas of Krugman, in more detail. In the second section a historical
perspective is put forward, with the aim of providing a time frame and
outlining the circumstances under which processes of globalisation
emerged. The third section draws attention to debates on economic
agglomerations absent in the new economic geography literature. This
section analyses the role that centrality plays in the process of
globalisation and what is termed the global cities hypothesis.
The main focus of this chapter is to identify different analytical approaches
to the understanding of economic agglomerations associated with the rise
and decline of industry and interactions with the trade regime. This
discussion is a prelude to a more detailed review of Mexico City’s
transformation as the result of trade liberalisation and the globalisation of
the Mexican economy.

42
THE NEW ECONOMIC GEOGRAPHY
Paul Krugman’s innovative ideas have brought a new approach to
mainstream economics’ construction of explanatory models of the
relationship between economic agglomerations and geographic space.
Krugman, under what he has branded the “new economic geography”, has
developed a series of models that have explored, from a formal economic
perspective, central place theory, market potential, the free trade regime,
increasing returns and externalities, the localisation of economic activity,
and the idea of circular and cumulative causation deriving models of
economic clustering and industrial agglomeration (Krugman 1991a, 1991b,
1991c, 1993a, 1993b, 1995, 1997). In particular, Krugman (1995)
emphasises the role of the trade regime in generating spatial
agglomeration of economic activity based on a model of increasing returns
and spatial transaction (transport/trade) cost.23 Both international trade
and the location of economic activity more generally are, according to
Krugman (1997), characterised by external economies. He argues that
hitherto the focus on equilibrium models has led to a neglect of the spatial
dimensions of economics and especially a “lack of attention within
mainstream economics to urban and regional economics” (Krugman 1995,
p. 25).
Krugman’s (1991a) approach aims to demonstrate that economic
agglomeration can result from the interaction of increasing returns and
23 Krugman appears to use the terms “transport costs” and “trade costs” interchangeably to denote a general idea that distance matters in determining companies’ access to markets and therefore their locational decisions and the evolution of agglomerations.
43
transaction costs. Using formal mathematical models, he derives single-
cluster and multi-cluster outcomes. The basic economic principles
involved are circular causation, increasing returns, transport costs and the
weight of the externalities. In the presence of economies of scale, Krugman
argues, firms have incentives to concentrate production at one site. If,
furthermore, transport costs also exist and demand is not uniformly
distributed, the optimum location is where demand is greatest. However,
as demand may be greatest where firms are already located, we are faced
with circular causation that can result in the formation of an industrialised
core (Krugman 1991b, 1991c, 1993a).
Krugman sets out to explore the idea that increasing returns represent a
key factor in international trade and in the localisation of economic activity
by arguing that:
…increasing returns affects economic geography at many scales. At the bottom of the scale, the location of particular industries clearly often represents the ‘locking in’ of transitory advantages. At an intermediate level, the existence of cities themselves is evidently an increasing returns phenomenon. At the grand level, the uneven development of whole regions can be driven by cumulative processes that have increasing returns at their root. (Krugman 1991b, p. 10)
Krugman considers the most striking feature of the geography of economic
activity to be geographical concentration, which is “clear evidence of the
pervasive influence of some kind of increasing returns” (Krugman 1991b,
p. 5). The new trade theory argued that “much trade represents arbitrary
specialisation based on increasing returns, rather than an effort to take
advantage of exogenous differences in resources or productivity i.e.
increasing returns rather than comparative advantage” (Krugman 1991b,
44
p. 7). In Geography and Trade, Krugman (1991b) also develops a parallel
argument linking the localisation of economic activity to Marshallian-type
external economies.24 This represents a complementary explanation on the
nature of agglomeration, suggesting that agglomeration based on scale
economies operates at a broader national or regional level while external
economies apply at a more localised level (Krugman 1991b, pp. 70–71).
Krugman’s theoretical lines of thought have been followed by other
scholars in what is now known as the new economic geography (see Abdel-
Rahman and Fujita 1990; Allen 1999; Fujita 1988, Fujita and Thisse 2002;
Hanson 1996a, 1996b, 2005; Hanson and Harrison 1999; Venables 1996,
1998, 2001; Venables and Limao 1999). Krugman, Fujita and Venables
have been central figures associated with attempts within economics to get
the “mainstream” of the discipline to pay attention to the long-neglected
role of geography in accounting for the pattern and nature of economic
phenomena. The new economic geography scholars attempt to analyse this
seeming “fact” of economic life by providing a formalised economic
account of the spatial economy, thereby offering a starting point for
explaining “where economic activity takes place and why” (Fujita 1995, p.
1).
24 Marshallian external economies refer to intra-industry economies of localisation. These are most commonly: (i) economies of specialisation, (ii) labour market economies or (iii) knowledge spillovers. Specialisation refers to a localised industry that can support a greater number of specialised local suppliers of industry-specific intermediate inputs and services, thus obtaining great variety at a lower cost. Labour market economies are localised industries that attract and create pools of workers with similar skills, smoothing the effects of the business cycle both on unemployment and on wages through scale. Knowledge spillovers relate to information flows about innovation among agents located within the same area thanks to social bonds that foster reciprocal trust and face-to-face contact. Clusters offer more innovation opportunities than scattered locations (Marshall 1994; Krugman 1991a).
45
A defining issue of the new economic geography is how to explain the
formation of a large variety of economic agglomeration (or concentration)
in geographical space (Fujita et al. 2001). The new economic geography is
based around two broad questions: when is a spatial concentration of
economic activity sustainable, and when is a symmetric equilibrium,
without spatial concentration, unstable (Fujita et al. 1999, p. 9)? The
approach is based upon the three-way interaction of increasing returns
with the mobility of productive factors and the cost of transportation. In
conjunction with this interaction the authors define the model of the
development and sustainability of industrial agglomerations on the basis
of defined centripetal forces that are loosely based around Marshall’s
trinity of external economies (Marshall 1920) and centrifugal forces such
as immobile production factors, land rent and pure dis-economies.
The resulting account is that firms become drawn towards centres of
population and demand, and develop interdependencies within their
respective industries. Hence, the existence of economic agglomerations
and cities is explained: “the world tends to organize itself into zones of
industrial specialisation: Spatial structure need not be imposed, because it
evolves of its own accord” (Fujita et al. 1999, p. 325). Furthermore,
because of increasing returns and the interdependence of firms’ location
decisions, the thesis suggests that a “lock-in” situation exists which makes
this evolving spatial structure, within a certain range, quite robust to
changes. In creating and sustaining spatial concentrations, we are told it is
backward and forward linkages that play perhaps the key role: in a world
where increasing returns and transport costs are both important, forward
46
and backward linkages can create a circular logic of agglomeration. In
other words, all things being equal, producers want to locate close to
suppliers and to their customers, which means that they will locate close to
each other (Krugman 1991a, 1991b, 1993b, 1998a; Krugman and Livas
1996).
Krugman’s approach has been criticised for its abstracted universalism,
reductionism and mathematical determinism (Boddy 1999; Dymski 1996;
Knox and Agnew 1994; Martin and Sunley 1996). In particular, the basic
geographic units of analysis used throughout the new economic geography
literature are simplistic in that they assume space to be something that can
be abstracted from social, political and cultural constructions and
practices. A first criticism is that Krugman’s urban growth approach
presents no definition of what constitutes an urban area or a city. As
Boddy argues:
There is no attempt here to recognise the fact that the city can be many different things, as Krugman and Livas´use of the term appears to simply refer to a large concentration of population and industry. Such definitions not only hide the differential and place-bound dynamic construction of such interaction, but also the linkages and webs that connect cities together as well as connecting them to each other, their regions and their nations. (Boddy 1999, p. 835)
In essence, Krugman sees the city as a “container” for economic activity.
Second, by focusing on trade or transport costs and neglecting to unpack
the complexity of exchange or interaction costs, Krugman and others are in
danger of missing out on central elements of firms’ location decisions.
They do not allow for the idea that as technology changes both the nature
of production and the nature of transport (for example, through
47
subcontracting in different locations), the possibilities for companies’
“transport” may change in such a way that transport costs become a much
less significant factor. Third, the models have both “firms” and “labour”
opting in and out of locations on the basis of maximisation and
equilibrium, but “labour”, like “firms”, operates with a diverse number of
ties and barriers to entry and exit that make the categories themselves as
well as the assumption of perfect mobility unrealistic (Martin and Sunley
1996). Finally, this approach neglects ideas of internal transaction costs
within firms that are important to understanding both divisions of labour
and economic agglomerations (Storper 1997).
Combining these points raises an awareness that Krugman’s work and the
new economic geography would benefit from modification to
accommodate present conditions. The relative neglect of technological
innovation and knowledge inputs into the models of productive process
gives the models the feel of 19th-century writings that stressed transport,
labour and natural resources; the models therefore fail to explain
agglomeration in contemporary knowledge-based industries such as
finance and Information Technology (IT).25 My research is concerned with
agglomeration or dispersal of economic activity under conditions of global
market economics, technological change, TNCs and the NIDL, particularly
the rise of the service sector and producer services.
25 The assumption of the central place and transport costs in firm behaviour explicitly links the analysis with earlier work within classical location theory (such as Von Thünen 1966, orig. 1826) and regional science (Dimski 1996; Martin and Rogers 1994a, 1994b; Martin and Sunley 1996; Scott 2000).
48
THE GLOBALISATION DEBATES
A different account of economic activity to that of Krugman has come from
attention to globalisation, captured by a multitude of terms such as
Dicken’s “global shift” (1992), Giddens’ “action at a distance” (1990),
Harvey’s “time-space compression” (1990) and Ohmae’s “accelerating
interdependence” (1995b). Most observers agree that globalisation is not a
new phenomenon but the continuation of developments that have been
going on for a considerable time, and that it should therefore be
considered an ongoing process.
The precise depth and timing of the globalisation process, however, has
been subject to considerable debate. To Sachs and Larrain (1993)
globalisation must encompass the idea of “macroeconomic unification”,
which means that the world is now a single economy in the
macroeconomic sense; the main determinants of income and employment
can now only be understood at a global level. According to Cohen and
Zysman (1987) globalisation marks a structural shift in international
markets and the production base of advanced countries, which changes
how production is organised, where it occurs and who plays what role in
the process (Cohen and Zysman 1987, p. 79). Cohen and Zysman, and
Drucker (1989), argue that fundamental and possibly irreversible change
has occurred in the world economy.
49
Similarly, Dicken (1992) has argued that we are witnessing the emergence
of a new “geo-economy” that is qualitatively different from past processes
of integration, in which “processes of globalisation, internationalisation
and deep integration” coexist (Dicken 1992, p. 8). To Harvey the reshaped
world economy has the capacity to work as a unit in real time (Harvey
1990; Held et al. 1999). Harvey argues that the impetus behind
globalisation was the post-Second World War restructuring that involved a
search for new forms of production and market niches. The flexible
production system (or post-Fordism), Harvey argues, was the response of
the market to the rigidities of the Fordist production-line system, which
was adopted as the standard manufacturing system during the first part of
the 20th century (Harvey 1990). Post-Fordism relies on a combination of
outsourcing production – the physical fragmentation of the production
process – and mass consumption patterns, a process where TNCs have
played a key role in leading the transformation of a new geography of
production (Lipietz 1993; Lipietz and Massey 1987; Sassen 1991).
In this regard, a number of theorists argue that the global economy evolves
when core processes and elements of the economic productive system have
the capacity to work as a unit in real time on a global scale under a flexible
specialisation regime (Dunning 1992; Drucker 1989; Held 1999).
According to these authors, technology and the externalisation of
transactions, and thus the disintegration of large firms and the rise of
outsourcing processes undertaken by smaller, less specialised and locally
networked ones, creates a tendency towards spatial re-agglomeration on
the one hand, and regionalisation counteracting the tendency towards
50
dispersion on the other – two apparently contradicting trends, but
coexisting economic expressions of the global economy. In relation to
flexible specialisation, Storper and Thomadakis argue:
“it now seems that a new, hegemonic model of industrialisation, urbanisation and regional development has been making its historical appearance in the US and Western Europe” (1998, p. 21).
The post-Fordist production system relies on the fragmentation of
production and new ways of providing services to producers (financial
services, insurance, marketing, consulting) rather than to consumers, and
this trend naturally creates regional networks of specialised services (Shaw
2002). According to Marcussen (1999), most of the empirical work done
on flexible specialisation has been confined to particular localities and
industrial sectors; this means that these studies offer a weak basis for
generalisation as production techniques and organisational practices
change with geography and culture, and between industries.
Many scholars agree that the concept of flexibility is multidimensional and
can mean different things. The literature employs numerous terms to refer
to flexible specialisation (Browne et al. 1984; Gupta and Goyal 1989;
Upton 1994; Yashuhiro 1993; Zelenovic 1982) – among the two most
popular are “lean production” and “Toyotism”. According to Willaiams et
al. (1992), lean production is based on low inventories (known as “just-in-
time”), exacting quality control, flexibility and rapid response to changing
consumer preferences. In the same way, Monden (1995) uses “Toyotism”
to refer to a system whose goal is to maintain a continuous flow of
products in order to adapt to fluctuations in demand. The basic elements
51
of this system are: (i) just-in-time production; (ii) automation of the
principle, a process where defective units are never passed on to a
subsequent work station; (iii) production smoothing, which allows many
varieties of a product to be made in a single day; (iv) workforce flexibility,
which means that multifunctional workers rotate jobs and their number is
varied to meet changing production quotas; (v) short machine set-up times
and changes to facilitate a continuous and viable flow of products; and (vi)
standardised jobs and operations.
Nevertheless, strong evidence can be found to argue that flexibility is
becoming a major competitive advantage and even a condition for
adaptation and survival for companies operating at a global level (De
Groote 1994; Ettlie and Stoll 1990; Mansfield 1993; Upton 1994). To
Massey (1995), the new possibilities of fragmenting the productive process
and reallocating each part according to comparative advantage is
determined by the price of labour (see also Gordon 1988). As Fröber et al.
(1980) argue, the traditional international division of labour in which less
developed countries were relegated to being producers of raw materials
has changed as TNCs have established a global manufacturing system
based on labour-intensive export platforms in low-wage areas.
The New International Division of Labour (NIDL) thesis, however, does
not explain the decision of TNCs to touch down where labour is relatively
costly (Fernández 1989). Indeed, although labour costs are an important
component of overall production costs, the recent trend towards more
capital-intensive production suggests that other factors such as
52
macroeconomic stability, infrastructure, the availability of skilled labour
(necessary for a more flexible production system), legal framework,
relative productivity, worker attitudes, and crime and security play major
roles in location decisions, especially for TNCs (Porter 1990; Beccattini
1992). Porter (1990) distinguishes between multi-domestic industries,
which are characterised by relatively independent national markets, and
global industries, which target cross-national customer desires using
global supply chains. In global production industries, similarity in product
demand allows firms to reap the benefits of economies of scale through
standardisation. Greater standardisation in turn facilitates the
international integration of operations and encourages the pursuit of
farther-flung economies through production centralisation at fewer
locations, leading to the creation of industrial clusters (DeWitt and Meyer
1998; UNCTAD 1994).26
To writers such as Harvey (1990), Dicken (1992) and Ohmae (1995a),
these changes are only the “surface appearance” of capitalism, with the
underlying logic of capitalist accumulation remaining the same. What has
changed, these authors argue, is the institutional basis of this new global
order, which was formalised at the international conference promoted by
the US and Western European countries at Bretton Woods, New
Hampshire, in 1944. The conference resulted in the creation of two
international financial institutions: the International Monetary Fund
26 Subsidiaries have become an important means for firms to respond to more open economies, with some firms becoming corporate groups of subsidiaries (Zey and Camp 1996) organised through an array of joint ventures, strategic alliances and production consortia. The proliferation of new networks of corporate affiliates means that the traditional structure of the firm has become blurred (OECD 1996a).
53
(IMF) and the International Bank of Reconstruction and Development
(later renamed the World Bank). The primary objective of the Bretton
Woods system was to stabilise and regulate international financial
transactions between nations on the basis of fixed currency exchange rates,
with the US dollar playing the anchor role. The collapse of Bretton Woods
in 1973 with the adoption of floating exchange rates shifted the emphasis
toward fiscal and financial policies as means to ensure national economic
stability (Bird and Killick 1995; Edwards 1995a; Van den Bulcke et al.
2001).
The other major pillar of the post-war international economic order was
the notion of free trade. This led to the creation in 1947 of the GATT, which
was charged with reducing tariff barriers and prohibiting trade
discrimination. Its rulebook called on member countries to further the
expansion of multilateral trade (multilateralism) by dismantling all but
minimum barriers to trade and reducing import tariffs and quotas
(Burtless et al. 1998; Ohmae 1994; Reich 1991).27 Successive negotiations
between the contracting parties, known as rounds, were held with the aim
of reducing tariff levels. The first meeting was held in Geneva in 1947, and
the eighth, the so-called Uruguay round of trade negotiations, was begun
in 1986 and concluded in 1993. The earlier rounds dealt mainly with tariff
27 The economic tools available to a government to restrict the inflow of imports vary between countries; the most common are tariffs, quotas and non-tariff barriers. Import tariffs are taxes imposed on commodities and they may be levied on an ad valorem basis – i.e., as a certain percentage of value or on a specific basis as an amount per unit. Quotas in international trade are the quantitative limits placed on imports of specified commodities. The protection afforded by quotas is more secure than that obtained by raising import tariffs, as the effect of the latter will depend on the price of the imported commodities. Non-tariff barriers may include regulations that favour domestic products over imported products, such as health, environmental or political regulations that affect international trade flows.
54
reductions, but later negotiations included other areas such as anti-
dumping and non-tariff measures. The later rounds culminated in the
creation of the World Trade Organisation (WTO) in 1995 and its extension
to include countries such as China (WTO 2002).28
A key feature of global economic integration, facilitated by greater
liberalism, was the increased importance of international capital through
foreign direct investment (FDI). During the 1980s the real net flow of
funds was from highly indebted developing countries that received less
international financing for their own development but were transferring
resources to developed countries (Maxwell 1999). During the latter part of
the 1980s and through the 1990s, actions were taken to reverse these flows
and attract FDI.29 Unlike trade rules, financial services remained largely
unorganised during economic restructuring. Saturated by currency
liquidity and fearful of a return to crisis, financial markets rejected and
avoided any kind of collective control. Rather, a series of broadly
complementary policy recommendations from international organisations,
some of which were imposed as so-called “IMF conditionality”
arrangements, created a general consensus (Maxwell 1999; Santín 2001).
The consensus, a range of neo-liberal policies inspiring the epithet of
“Washington Consensus”, included central bank autonomy, anti-inflation
28 The transformation of the GATT to the WTO was made possible with the end of the Cold War, which dramatically changed the configuration of world order and strengthened neo-liberal ideas. 29 This change was coterminous with the rise of institutional investors such as pension funds and the “securitisation” of funds (allowing firms to borrow directly from the markets rather than through banks) that increased the supply of tradable financial assets. To mention just one figure, in 2000 the daily average of international stock market activity was about $1.2 trillion per day or 50 times the total value of annual international trade (Mathieson and Schinasi 2001).
55
policies and deregulation of financial and trade activities (Williamson
1993). While net FDI has been channelled to a number of developing
countries, there is much debate about the allocation of capital to financial
services and the threat of sudden withdrawal. As the financial crises in
Mexico in 1994–95 (the Tequila crisis) and in Asia, Russia and Brazil
(1998) and Argentina (2001–04) indicate, the potential for financial
instability in national and regional economies remained (Edwards 1995a,
1995b).
The Organisation for Economic Cooperation and Development (OECD)
stresses an important distinction when it comes to understanding the
geographical dispersion of industrial and service activities and the cross-
border networking of companies such as TNCs (OECD 1992). The OECD
distinguishes globalisation from internationalisation, the latter being the
simple extension of economic activities across national boundaries, a
single dimension referred to as market integration that leads to a more
extensive geographical pattern of economic activity. By contrast,
globalisation takes market integration a stage further to a functional
network of productive activities (global production) underpinned by the
development of worldwide systems of transport and communication,
increasing the speed at which the world can exchange goods, information,
capital and people. Globalisation reflects the emergence of interregional
networks between communities, states, international institutions, non-
governmental organisations and TNCs. As proposed by Reich (1991) and
Ohmae (1995b), this argument leads to the idea of a borderless world in
which nation-states are no longer significant actors or meaningful
56
economic units, and in which consumer tastes and cultures are
homogenised and satisfied through the provision of standardised global
goods produced by corporations with no allegiance to place or community
in a truly international division of labour (Massey 1983).
In making the shift from internationalisation to globalisation,
technological change has played a crucial role through its impact on the
economics of production and on the flow of information (Dicken 1992).
Technology reduces transport and information costs and strengthens the
formation of a free market system. In the previous stage of capitalism, the
productive system relied on physical infrastructure – roads, electricity and
transport – whereas in the global economy, Dicken believes, the
infrastructure is telematics, or as he puts it, the “great growling engine of
change” (1992, p.73). It is argued that technological trends are
reconfiguring the location, ownership, and management of productive
activities among countries and regions. The increasing ease with which
technical and market knowledge, capital, physical goods and managerial
control can be extended around the globe has made the integration of
economic activity between far-flung locations possible (Guile and Brools
1987).
Castells (1996) takes this argument further, coming up with a theory of a
new world order by asserting that we are now living in an “informational”
society where global forces mediated by the IT and communications
revolutions are reshaping states, ethnicity and ideology around the world.
According to Buzan and Little (2000) the “interaction capacity” defined
57
primarily but not exclusively by communications technology increases the
potential velocity of the global diffusion of goods, information, capital and
people that may be more or less regularised through networks or sites of
power (Castells 1996; Mann 1986).30
Other authors are more sceptical or more cautious as to the exact timing
and extent of globalisation. Perhaps the most well-known critique is
offered by Hirst and Thompson (1999), who agree that the world economy
was more open and more integrated between 1870 and 1913, when an open
regulatory framework dominated, short- and long-run capital movements
were unsupervised, and citizenship was freely granted to immigrants.
Hirst and Thompson argue that under these conditions markets linked a
growing share of world resources and output, exports outgrew domestic
output in the majority of capitalist countries, and migration levels were
unprecedented. Their argument receives qualified support from Gordon
(1988) and Glyn and Sutcliffe (1992), who argue that while in relative
quantitative terms the world economy was perhaps at least as integrated
economically before 1913 as it is today, the nature of integration was
qualitatively different and, in particular, the spatial organisation of
production has changed over the 20th century.
Another group of concerns relates to the governance of globalisation, and
specifically whether nation-states are being eclipsed by private
corporations and larger political structures such as multi-country regional
30 These ideas owe their origin to McLuhan’s notion of a “global village” (McLuhan and Powers 1989), which describes the impact of radio in the 1920s in bringing faster and more intimate contact (see Drucker 1989).
58
trading blocs like NAFTA, the European Union or Mercosur (Kothari 1995;
Luard 1990). Hirst and Thompson (1999) argue that the world economy is
dominated by uncontrollable market forces, and that it has as its principal
economic actors and major agents of change truly transnational
corporations which owe allegiance to no nation-state and locate wherever
in the global market advantage dictates (1999, p. 17). As reported by
Berger and Dore (1996), Koechlin (1995) and Mann (1997) national
political structures remain important even as economies internationalise
or globalise. Indeed, according to Giddens (1990) and Held (1999),
globalisation requires the concerted effort and agreement of states that are
in command of national market regulation and therefore are ultimately
responsible for the policies that lead to the creation of regional and global
markets. 31 There is also evidence that while tariff barriers have been
lowered on average, non-tariff barriers such as local content rules have
been more scrupulously monitored while liberalisation agreements for
sectors such as agriculture, energy and steel have been resisted (WTO
2002; Stiglitz 2002).32
From this standpoint, the state appears to have retained considerable
leverage over the specific location decisions of firms (Cox 1993, 1997;
31 There is an argument for new regionalism indicated by the relative declines in inter-bloc trade even as intra-bloc trade increases (Emmerij 1992; Johnson 1991; Sturgeon 2001). 32 Protectionist voices can still be heard – for example, with regard to nurturing “infant” industries, including IT, and countering ‘dumping’ (the sale of a commodity in a foreign market at below the production cost in order to gain a competitive advantage in the new market), and as retaliation against restrictive measures imposed by other countries (WTO 2002). In addition, a new set of protectionist barriers known as “rules of origin” has been introduced as the result of the consolidation of the trade blocs. These rules usually measure the percentage of value added produced and traded within countries bound by free trade agreements against those which were not produced within the bloc (WTO 2002).
59
Massey et al. 1992; Shoenberger 1994; Storper 1997). As pointed out by
Stiglitz (2002), certain nations and regional blocs have managed to
determine the form and means of achieving globalisation:
The critics of globalisation accuse Western countries of hypocrisy, and the critics are right. The Western countries have pushed poor countries to eliminate trade barriers, but keep up their own barriers, preventing developing countries from exporting their agricultural products and so depriving them of desperately needed export income … the West has driven the globalisation agenda, ensuring that it garners a disproportionate share of the benefits, at the expense of the developing world. (Stiglitz 2002, p. 6).
Stiglitz was pointing to asymmetrical outcomes, especially for developing
countries. The observation is supported by Goldsmith and Mander (2001)
and Morris (2001), who charge that the changing integration of economies
through trade increases income inequality. Trade liberalisation, they
argue, allows developed countries to export goods that intensively use the
production factors with which they are abundantly endowed (skilled
labour) and import goods that use the production factors which are
relatively scarce in these countries (unskilled labour). In such conditions it
is not surprising that so many authors were pessimistic that globalisation
would enhance equitable economic growth, social mobility and improved
welfare (Gray 1998; Hirst and Thompson 1999; Stiglitz 2002).
Yet despite recent advances in growth theory, the effect of trade and
economic integration on national and regional economic growth is still
very much a matter of debate (Rodrik 1999). Authors such as Wood (1994)
and Krugman (1991a) assert that there is a positive association between
trade liberalisation and a reduction in regional economic disparities.
Contrary to this vision, other authors (Goldsmith and Mander 2001; Gray
60
1998; Hirst and Thompson 1999; Sassen 1991) consider that liberalisation
of trade leads to greater concentration of economic activity and greater
polarisation. They assert that world trade is organised under conditions
that favour only rich nations, leaving poor countries unable to compete
against often subsidised goods and products, with negative social and
environmental consequences for poor countries (Retallack 2001).
Finally, the idea that globalisation might “close the gap” between
developing and developed countries has been critiqued for the effect that
globalisation has on the prospects for internal equality. For a number of
authors, the primacy of freer private investment may be good for growth,
but it will be achieved at the price of rising inequality (Christopherson and
Hovey 1996; Panuco 1999; Sen 1999). Data show that for most OECD
countries, including Germany, the Netherlands, New Zealand, Norway,
Japan, Sweden, the US and the UK, there has been an increase in wage and
income inequality (Milanovic 2005). Aghion and Howit (1998) explain the
increase in income inequality as being due to changes in wages (expected
to be a factor in a globalised economy), which in turn can be broken down
into four elements: (i) an increase in the level of education wage
differentials – i.e., in wage inequalities across different education cohorts;
(ii) an increase in occupational wage differentials; (iii) an increase in age-
related differentials; and (iv) an increase within group wage inequality.
Rather than putting the emphasis on wage premiums following skills as
technology is taken up, as Aghion and Howit do, others have argued that
inequality through globalisation is due to simple labour exploitation
through an erosion of working conditions in the South and greater
61
accumulation of high-value-added activities in the North (Hay and Marsh
1999; Rifkin 2001; Sassen 1991).
GLOBALISATION AND REGIONALISATION OF MARKETS
Current debates on globalisation have centred on the degree of integration
of the global economy and its effects. A crucial theoretical argument
present in debates is the distinction between two different, interactive
economic processes: globalisation of markets and globalisation of
production. In broader terms, as has been argued above, globalisation
refers in general to the globalisation of capitalism. In this sense, it can
mean one of two things: the spread of capitalist production relations
(global production networks), or an increase in the international
interdependence of the world economic system (expansion of global
trade).
It is a general practice that governments regulate overseas trade via a
combination of import tariffs and quotas, export subsidies or incentives,
and influence exchange and interest rates in order to favour foreign trade,
and to consider exports as a dynamic growth engine (Hanson 1996b).
Figure 2.1 shows how world trade has increased dramatically from the late
1970s to the end of 2000, the end point for this thesis. Exported goods
grew on average by 6% annually from 1950 to 2000 (OECD 2001b). This
trade is also “freer”. Since 1945–47, tariffs on industrial products have
fallen and were close to 4% on average in OECD countries by the start of
the 21st century.
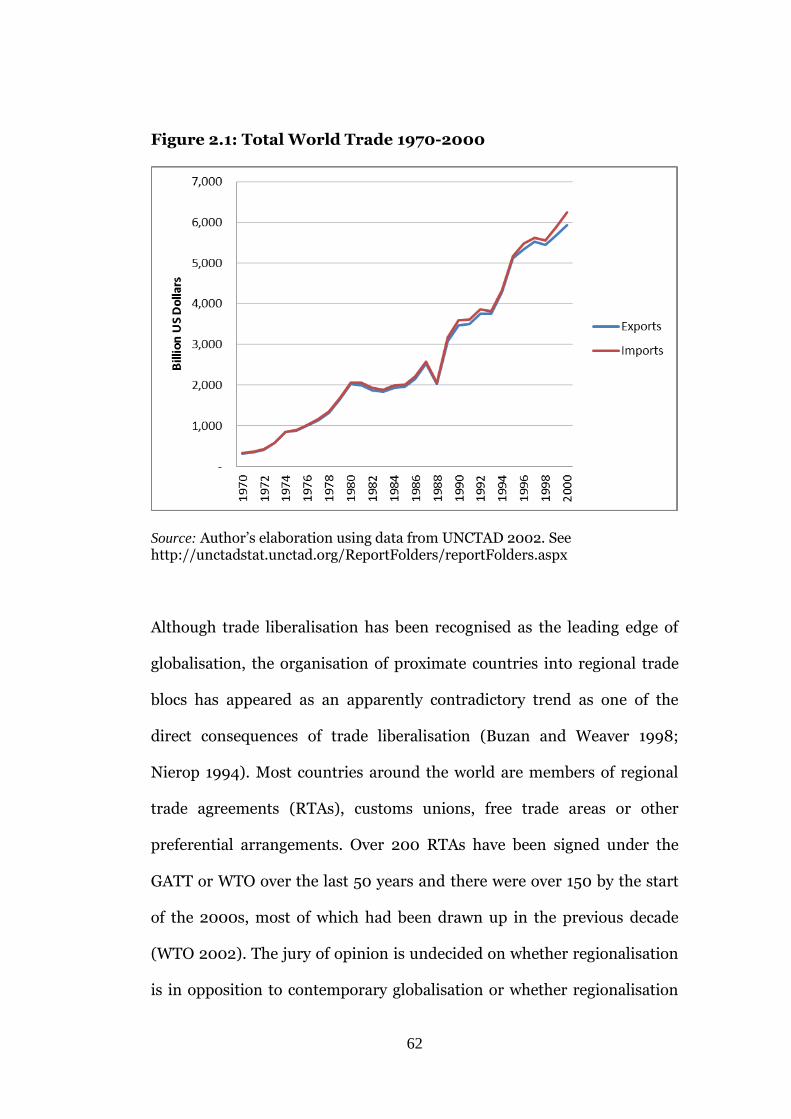
62
Figure 2.1: Total World Trade 1970-2000
Source: Author’s elaboration using data from UNCTAD 2002. See http://unctadstat.unctad.org/ReportFolders/reportFolders.aspx
Although trade liberalisation has been recognised as the leading edge of
globalisation, the organisation of proximate countries into regional trade
blocs has appeared as an apparently contradictory trend as one of the
direct consequences of trade liberalisation (Buzan and Weaver 1998;
Nierop 1994). Most countries around the world are members of regional
trade agreements (RTAs), customs unions, free trade areas or other
preferential arrangements. Over 200 RTAs have been signed under the
GATT or WTO over the last 50 years and there were over 150 by the start
of the 2000s, most of which had been drawn up in the previous decade
(WTO 2002). The jury of opinion is undecided on whether regionalisation
is in opposition to contemporary globalisation or whether regionalisation
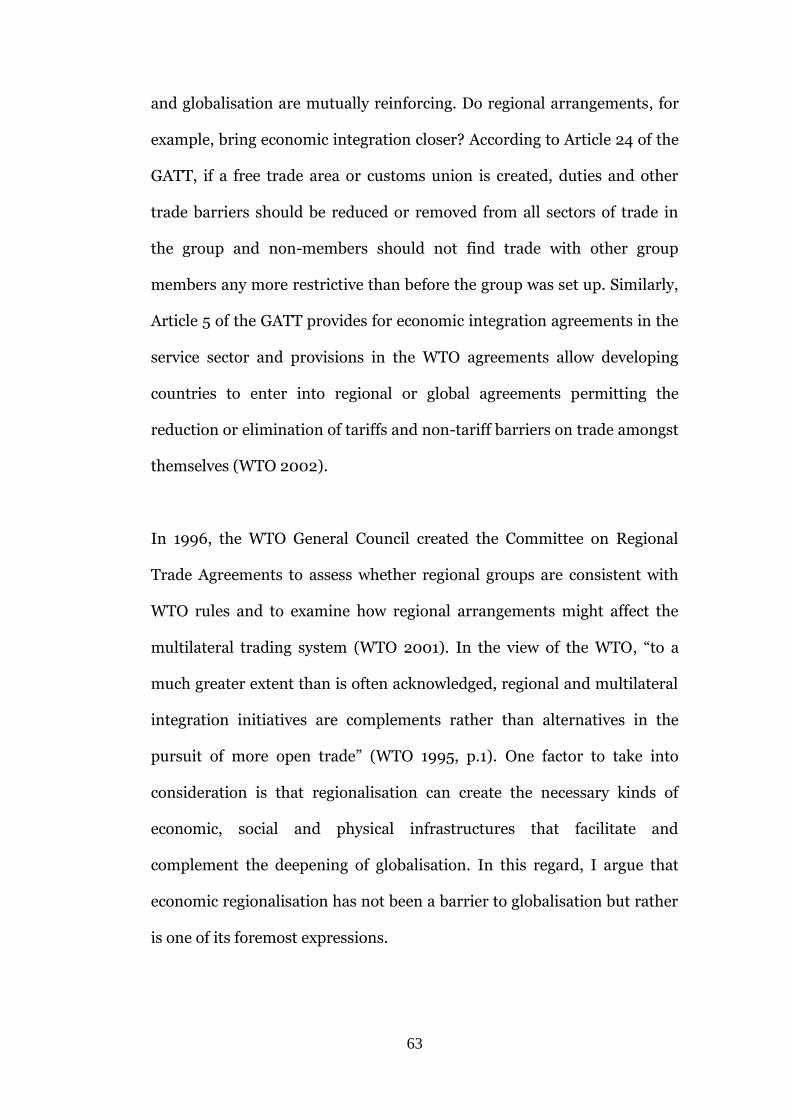
63
and globalisation are mutually reinforcing. Do regional arrangements, for
example, bring economic integration closer? According to Article 24 of the
GATT, if a free trade area or customs union is created, duties and other
trade barriers should be reduced or removed from all sectors of trade in
the group and non-members should not find trade with other group
members any more restrictive than before the group was set up. Similarly,
Article 5 of the GATT provides for economic integration agreements in the
service sector and provisions in the WTO agreements allow developing
countries to enter into regional or global agreements permitting the
reduction or elimination of tariffs and non-tariff barriers on trade amongst
themselves (WTO 2002).
In 1996, the WTO General Council created the Committee on Regional
Trade Agreements to assess whether regional groups are consistent with
WTO rules and to examine how regional arrangements might affect the
multilateral trading system (WTO 2001). In the view of the WTO, “to a
much greater extent than is often acknowledged, regional and multilateral
integration initiatives are complements rather than alternatives in the
pursuit of more open trade” (WTO 1995, p.1). One factor to take into
consideration is that regionalisation can create the necessary kinds of
economic, social and physical infrastructures that facilitate and
complement the deepening of globalisation. In this regard, I argue that
economic regionalisation has not been a barrier to globalisation but rather
is one of its foremost expressions.
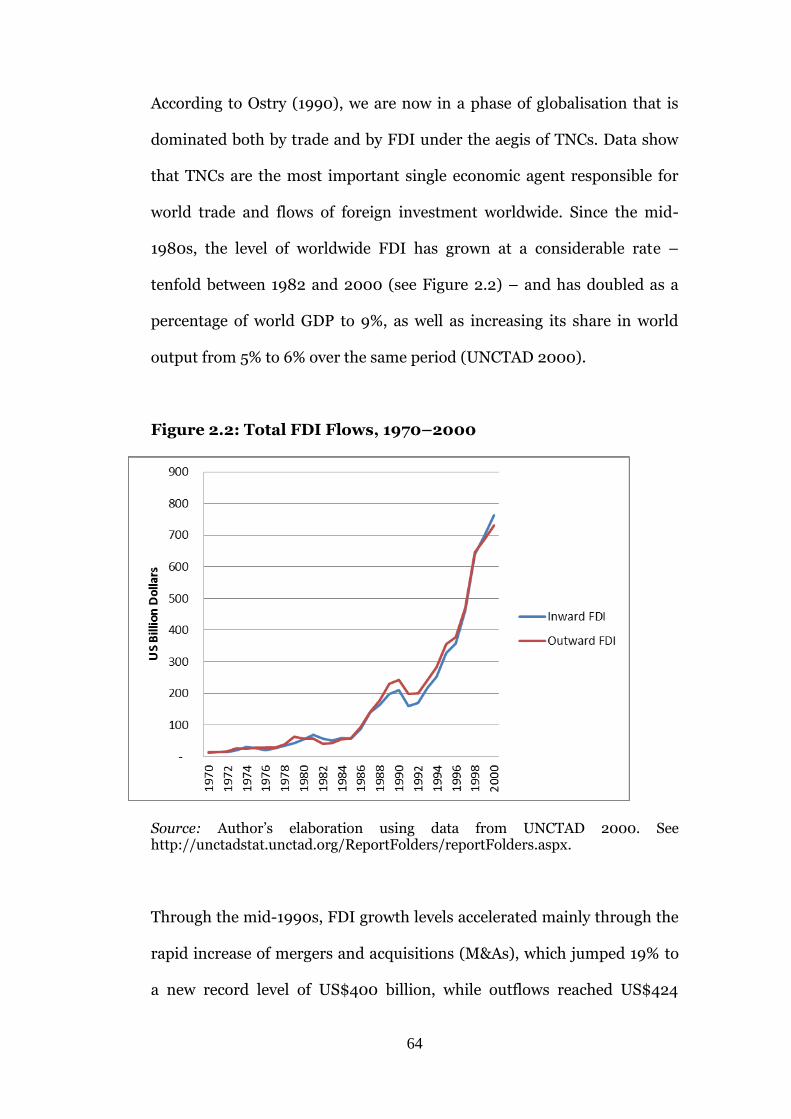
64
According to Ostry (1990), we are now in a phase of globalisation that is
dominated both by trade and by FDI under the aegis of TNCs. Data show
that TNCs are the most important single economic agent responsible for
world trade and flows of foreign investment worldwide. Since the mid-
1980s, the level of worldwide FDI has grown at a considerable rate –
tenfold between 1982 and 2000 (see Figure 2.2) – and has doubled as a
percentage of world GDP to 9%, as well as increasing its share in world
output from 5% to 6% over the same period (UNCTAD 2000).
Figure 2.2: Total FDI Flows, 1970–2000
Source: Author’s elaboration using data from UNCTAD 2000. See http://unctadstat.unctad.org/ReportFolders/reportFolders.aspx.
Through the mid-1990s, FDI growth levels accelerated mainly through the
rapid increase of mergers and acquisitions (M&As), which jumped 19% to
a new record level of US$400 billion, while outflows reached US$424
65
billion (UNCTAD 1998).33 According to Mytelka (1990), FDI in the late
1980s grew at an average annual rate almost three times higher than that
of trade and four times greater than world output. The 1990s are thus
characterised as a decade in which international production by TNCs,
financed through FDI, gradually began to replace trade between firms as
the mode through which economies were interlinked (OECD 1994a).
THE ROLE OF CENTRALITY IN THE GLOBAL ECONOMY AND THE GLOBAL
CITY HYPOTHESIS
The geography and composition of global networks of trade and
production appear to be traversed by three simultaneous trends:
dispersion, regionalisation (within and among countries) and
concentration or re-concentration of economic activity (Castells 1996;
Dicken 1992; Friedmann and Wolf 1982; Sassen 1991). Indeed, while the
global economy may have become more decentralised, it is not decentred.
Even in a world with better communications, Amin and Thrift (1992) argue
that centres are needed to generate and disseminate information, to test
and track innovations and to identify gaps in the market. This is the basic
assumption underpinning at least two broad bodies of literature: global
cities and new industrial clusters/global city regions. In providing a review
of each I aim to focus attention on how the combination of spatial
dispersal of production processes and global integration of markets has
created a new strategic role for cities – first, as nodes of information
33 M&As have become the dominant form of corporate entry to a country, exceeding green-field entry by a wide margin in value terms. For OECD countries, M&As rose to 86% of the value of inward FDI by the end of the 1980s (Cooke 1988). The main motivating factors for these mergers appear to be diversification, regional market consolidation and technological innovation (OECD 2001a).
66
networks needed to manage and coordinate global/regional market
integration, or what Sassen calls the “command functions” of the global
economy; and second, as global production sites embedded in a network of
specialised, multi-production circuits. These two basic “global functions”
take place because global production circuits are increasingly more
decentralised and less hierarchically governed, contributing to problems of
integration and coordination.
Recent urban studies emphasise a select group of cities where unique
cultural, social and economic processes take place, and the way in which
trade and production shape networks (Allen 1999; Borja and Castells
1997).34 Picked up by Hall (1977) as a useful descriptor and by Friedman
and Wolff (1982) as a valuable means of unpicking the features of different
categories of city, “world” has become increasingly replaced by “global”. In
setting out to define this category of cities, studies have identified a range
of criteria, including national standing, cultural function and, primarily,
their role in the global economy. This economic determination is closely
tied to world systems theory and to an interest in identifying the
transnational business connections of a new global economic order
(Beaverstock and Taylor 1999; Fainstein 2001; Friedman and Wolff 1982,
1986; Knox and Taylor 1995; Scott 2001; Sassen 1988, 1991, 1994a, 1994b,
1996; 1999, 2001; Taylor 1997). According to Sassen:
…with the partial unbundling or at least weakening of the national as a spatial unit due to privatisation and deregulation and the associated strengthening of globalisation, comes conditions for the ascendance of other spatial units or scales. Among these are the sub-national,
34 Although regarded as a quintessential feature of the late 20th century city, the phrase “world city” was coined by Patrick Geddes in 1915, (Geddes 1915).
67
notably cities and regions … I locate the emergence of global cities in this context and against this range of instantiations of strategic scales and spatial units. In the case of global cities, the dynamics and processes that get territorialized are global… (Sassen 2001, p. xviii)
Global cities, then, capture a distinctive feature of the current phase during
which a spatially dispersed global economy requires locally based and
integrated organisation, and this, Sassen suggests, takes place in cities
(Sassen 1988, 1991, 1994a, 1994b). As Sassen has noted:
“Apart from issues related to capital, labour markets, goods and services are becoming increasingly globally traded, in this regard, cities around the world are rising as ‘regional centres’ connecting the network of interactions on which the global trade is based ground outwards” (Sassen 1991, p. 3).
To Sassen, globalisation is driving forward a process that connects
advanced services, producer centres and markets in a global network, and
all of them function in relation to the consolidation of a global market.
Sassen identifies changes in international banking and finance, a series of
advanced producer services and the concentration of corporate
headquarters in certain “command centres” as being the main forces
behind the formation of global cities (see also Botchie et al. 1995).
Although advanced services are present in all large cities and in nearly all
countries, it is claimed that the higher levels of concentration of advanced
service networks can be seen only in particular “nodes” (Beaverstock and
Taylor 2000; Baum 1999; Fu Chen and Yue Man 1998; Hamnett 2002;
Thornley and Rydin 2001). The notion of the command centre is a useful
tool so long as it is limited to the identification of (market) “command
processes”, of the dynamics and interaction between different actors
68
taking place in these cities, and of the networks of cities and the power and
economic hierarchy associated to them.35
However, as indicated in the work of Borja and Castells (1997), the
interaction networks on which the global economy is based are being
ordered around new “regional centres”. Borja and Castells point out that as
soon as a region becomes integrated into the global economy, the setting
up of the urban node for advanced services becomes necessary, invariably
around an international airport, a satellite telecommunications system,
luxury hotels with appropriate security systems, and local and regional
government offices capable of providing information and infrastructure to
back up international investors. Similar research by Thrift and Leyshon
(1994) and Beaverstock and Taylor (1999, 2000) on the location patterns
of producer services provides empirical evidence of the validity of the
notion of a hierarchy of emerging global city regions.
GLOBALISATION AND ECONOMIC AGGLOMERATIONS
Driven by the new geography of globalisation (i.e., the dispersion of
production and the rise of new production sites), at the end of the 1990s
there was a renewed interest in the phenomenon of the formation of
economic agglomerations and particularly in the geography of industrial
clusters, or what was termed new industrial districts (NIDs) theory. From
35 Sassen considers that at the top of the global city hierarchy are New York, London and Tokyo, which have “joint dominance” in international finance and in most consulting and business services of international scope, referring again to purely market functions. These three centres are referred to as the command centres that together cover the spectrum of time zones for the purpose of financial trading and work largely as a unit in the same system of endless transactions, with a number of regional centres rapidly joining the network as emergent markets. Please note that Sassen again is referring to markets.
69
disciplines such as economic geography (Scott 1998), sociology (Lazerson
1988), political science (Hirst and Zeitlin 1989; Sabel 1993) and
international management (Porter 1990), best known is the work of Piore
and Sabel (1984), who coined the term “flexible specialisation” for
networks that are characterised by an extensive horizontal and vertical
division of work among relatively flexible companies with a tendency to
concentrate on their core competencies and agglomerate around highly
specialised activities. In this view, clusters of customers and suppliers are
embedded in regional infrastructures of cooperation and supply, and it is
from these that local networks emerge. Based upon the successful
expansion of mature industries in the Emilio Romagna region in Italy,
Piore and Sabel (1984) argue that NIDs owe their success to the role of
small, innovative firms, embedded within a regional cooperative system of
industrial governance which enables them to adapt and flourish within a
global competitive environment. Most NIDs theorists claim that certain
production centres have emerged as global production nodes (Piore and
Sabel 1984; Scott 1988; Raco 1988). This change, it is argued, implies a
return to place, a dependence on location proximity between different
agents embedded in a broader production circuit.
Contrary to the emphasis on small firms in NIDs formulation, some
alternative models demonstrate the continued power of the state and/or
TNCs to shape and anchor industrial districts. According to Marcussen
(1999) this power provides the “glue” that makes it difficult for smaller
producers to leave, encouraging them to stay and expand, attracting
newcomers into the region and thus reinforcing agglomeration trends.
70
Marcussen’s model exhibits greater propensity for networking across
rather than within district lines, and suggest that industrial clusters have a
greater tendency than in the NIDs formulation to be exogenously driven
within a global economy framework.
Drawing upon the same line of argument, Scott (1998) says that these
nodes constitute distinctive sub-national (i.e., regional) social formations
whose local character and dynamics are undergoing major transformation
due to the impact of globalisation. NIDs and the global city region thesis
thereby contradict Krugman’s hypothesis that a fall in the cost of
transportation and communications from a removal of trade barriers
would lead to a more diffuse pattern of industrial agglomeration or a
relocation of some industries, as the industries of these regions have
become so closely tied to physical infrastructures and to clustered flexible
networks of firms that by virtue of the agglomeration economies are able
to compete in increasingly extended (global) markets (Allen 1999; Scott
2000).
The main point to address here is how from different assumptions and
methodologies (i.e., new economic geography vis-à-vis NIDs or NIDL)
there is some convergence of observation, particularly on how location
decisions are much more complex than Krugman’s work on regional
analysis through the interpretation of factors such as distance to markets,
trade barriers, wages and infrastructure would suggest. Among the most
important factors highlighted, and which go against the current of
arguments from the NIDL theorists, is the relevance of low wages in
71
driving the relocation (migration) decisions of firms from rich to poor
countries. As Fujita, Krugman and Venables argue:
…low wages in the South are not enough to attract manufacturing because of the lack of sufficient forward and backward linkages. Eventually, however, further reductions in transport costs move the world into a globalisation phase. The value of proximity to customer and supplier firms diminishes as transport costs fall, and so the sustainable gap between North and South narrows. (Fujita et al. 2001, p. 254)
Agglomerations are formed and survive because of the economic benefits
derived from interaction (agglomeration economies), in which spatial
concentration itself creates the favourable economic environment that
supports further and continued concentration. Producers want to choose
locations that have good access to large markets and to suppliers of goods
that they or their workers require (Scott 2000). A place that already has a
concentration of producers tends to offer a large market, a good supply of
inputs and consumer goods (some of which are made by producers that are
already there). Because of what are essentially backward and forward
linkages, spatial concentrations of production tend to persist once
established. Thus the relevance of centrality is that these geographical
centres are place-bound communities in which agglomerations and
interaction between firms, institutions and social groups act to generate
and reinforce an “industrial atmosphere”. This atmosphere nurtures the
knowledge, communication and innovation structures required for
retaining competitive advantage in a given global production circuit.
72
CONCLUSION
Krugman and Livas’s “migration to the north” hypothesis is useful in
understanding the process of manufacturing decline and growth in Mexico
City and Northern cities, but by focusing on trade or transport costs alone
and neglecting to unpack the complexity of exchange or interaction costs
they are in danger of missing out on central elements of firms’ locational
decisions. In a world where consolidated markets lead to specialisation
driven by the competitive advantages of specific economies, firms will get
increasingly involved in globalised production to serve local or global
markets. More integrated markets reduce production costs and allow firms
to compete globally, thereby providing incentives to engage in global
production. This distinction is important because it allows us to
understand that globalisation may advance regardless of how quickly free
trade regimes develop.
Krugman and Livas do not allow for the idea that as technology evolves
both the nature of production and the nature of transport (for example, by
outsourcing in different locations under a free trade regime brought about
by globalisation of production), the possibilities for companies’ “transport”
may change in such a way that transport costs become a much less
significant factor. “Labour”, like “firms”, however, operates with a diverse
number of ties and barriers to exit that make the categories themselves as
well as the assumption of perfect mobility unrealistic. Also, this approach
neglects ideas of internal transaction costs within firms that are important
to understanding both divisions of labour and economic agglomerations,
and there is no account of global markets economics, technological change,
73
the role of TNCs or the NIDL, or particularly the rise of the service sector,
crucial in understanding the new configuration Mexico City has acquired
as a service sector global centre, but also as a manufacturing hub, in the
aftermath of economic liberalisation.
If global production requires decentralised coordination and control, the
“de-verticalisation” of the division of labour between independent but
interlinked units, greater workforce task flexibility, a greater reliance on
innovation and skills, and the elimination of time and waste in supply and
delivery, then proximity between agents would seem to be more, not less,
important. The literature on industrial location talks up the re-emergence
of local economies. This literature is associated with a flexible production
model that recognises the importance of emerging global corporate
networks and considers that production globalisation is taking place (and
is rooted) in a series of dense nodes scattered across the world. Regardless
of the construct used when referring to urban agglomerations (these are
understood independently of their political delimitations and include
clusters, agglomeration, functional urban regions or city regions), cities are
increasingly viewed as offering a series of advantages upon which a system
of production can draw within a globally organised structure. Echoing the
factors first identified by Alfred Marshall (1842–1924) in his work on small
firms (see Davenport 1935), these advantages are said to include the build-
up of a local pool of expertise and know-how and a culture of labour
flexibility and cooperation resulting from dense social interactions and
trust, lower transport and transaction costs, and the growth of a local
74
infrastructure of specialised services, distribution networks and supply
structures, which in a way are the basis of Sassen’s global cities hypothesis.
Sassen’s argument is relevant for placing in perspective the “global cities
studies” that present detailed analyses broken down by sector of the
economy, analysing the characteristics of sectors of the economy that
successfully adjusted to the new economic environment and grew in the
aftermath of the liberalisation process through the interconnection of
economic activity in cities dispersed around the world. In this sense, the
enhancement of specialisation that follows on from the liberalisation of
trade, increased competition, the upgrading of productive processes and so
on, is destructive as well as creative, as it has been argued that it leads to
an exclusionary dynamic and income inequality. The relationship between
inequality and per capita income in OECD countries suggests that income
inequality is largely due to changes in wages and to technological
innovation that has caused an increase in the demand for skilled labour
relative to unskilled, since this has enhanced differences in ability among
workers, across or within education cohorts. This situation can be
potentially aggravated by a decline in manufacturing jobs accompanied by
an increase in service sector jobs, as was witnessed in Mexico City after
1980.
75
Chapter Three: Global Integration and Economic Restructuring in Mexico
OVERVIEW
The aim of this chapter is to test Krugman’s hypothesis that trade
liberalisation and relocation effects have led manufacturing companies to
move out of Mexico City, mostly to the border region. By looking at
aggregate economic census data for employment and economic units
(firms), and later at disaggregated company-level data, the aim is to
explore the effects on patterns of concentration and de-concentration, and
to assess the degree to which trade liberalisation and globalisation have led
to changes in the regional distribution of economic activity in Mexico.
Specifically, the chapter is focused on two questions:
What is the relationship between trade liberalisation and the
relocation patterns of manufacturing companies moving out of
Mexico City?
To what degree is trade liberalisation strong enough to explain
forces of attraction in the border states up to the point of competing
with Mexico City as the most attractive location for export
companies, as suggested by Krugman?
The methodological approach used to answer the first question is based
upon Sassen’s global cities hypothesis and on her proxies to measure the
relative importance of locations in the context of the globalisation of the
76
economy. Location proxy is defined according to Sassen’s work on global
cities and refers to patterns of concentration of national and transnational
corporations’ headquarters and the changes of these location patterns as a
proxy for decentralisation of the economy. The location becomes relevant
in the concentration of TNC headquarters as it denotes certain levels of
infrastructure, provision of goods and services, and access to suppliers and
markets.
In the second part of this chapter, Sassen’s methodological approach is
explored in order to specify a proxy variable for changes in location using
the Expansión database of the Top 500 Companies’ headquarters.
Following Sassen’s “new conceptual architecture” on global cities, the
globalisation of economic activity entails a new form of organisational
structure that requires a new type of conceptual architecture. There have
long been cross-border economic processes – flows of capital, labour,
goods, raw materials and tourists – but to a large extent these have taken
place within the inter-state system, where the key articulators have been
national states. This arrangement has changed over the last decade as a
result of privatisation, deregulation, digitalisation, the opening up of
national economies to foreign firms, and the growing participation of
national economic actors in global markets. It is in this context, Sassen
argues, that we can see a rescaling of strategic territories that articulate the
new system, with the ascendance of other spatial units or scales. Among
these are the subnational, notably cities and regions; and cross-border
regions encompassing two or more subnational entities, i.e. global
digitalised markets and free trade blocs (Sassen 2001, p. xx).
77
There are seven hypotheses by which Sassen organises the data and the
theorisation of the global city model. I will present four in order to offer a
way of presenting a more precise justification as to why I chose to use
headquarters location as a proxy of centralisation/decentralisation of
economic activity in Mexico City. According to Sassen’s “The Global City
Model: Organizing Hypotheses”:
First, the geographic dispersal of economic activities that marks globalization, along with the simultaneous integration of such geographically dispersed activities, is a key factor feeding the growth and importance of central corporate functions. The more dispersed a firm’s operations across different countries, the more complex and strategic its central functions – that is, the work of managing, coordinating, servicing, financing, a firms network of operations.
Second, these central functions become so complex that increasingly the headquarters of large global firms outsource them. They buy a share of their central functions from highly specialized services firms: accounting, legal, public relations, programming, telecommunications, and other such services. Thus while even then years ago, the key site for the production of these central headquarters functions was the headquarters of a firm, today there is a second key site, the specialized service firms contracted by headquarters to produce some of these central functions or components of them. This is especially the case with firms involved in global markets and non-routine operations. But increasingly the headquarters of all large firms are buying more of such inputs rather that producing them in-house.
Third, those specialized service firms engaged in the most complex and globalized markets are subject to agglomeration economies. The complexity of the services they need to produce, the uncertainty of the markets they are involved with either directly or through the headquarters for which they are producing the service, and the growing importance of speed in all these transactions, is a mix of conditions that constitutes a new agglomeration dynamic. The mix of firms, talents, and expertise from a broad range of specialized fields makes a certain type of urban environment function as an information center. Being in a city becomes synonymous with being in an extremely intense and dense information loop. This is a type of information loop that as of now still cannot be replicated fully in electronic space, and has as one of its value-added features the fact of unforeseen and unplanned mixes of information, expertise and talent, which can produce a higher order of information. This does not hold for routinized activities which are not as subject to uncertainty and non-standardized forms of complexity. Global cites
78
are, in this regard, production sites for the leading information industries of our time.
A fourth hypothesis, derived from the preceding one, is that the more headquarters outsource their most complex, unstandardized functions, particularly those subject to uncertain and changing markets and to speed, the freer they are to opt for any location, because less work actually done in the headquarters is subject to agglomeration economies. This further underlines that the key sector specifying the distinctive production advantages of global cities is the highly specialized and networked services sector. In developing this hypothesis I was responding to a very common notion that the number of headquarters is what specifies a global city. Empirically it may still be the case in many countries that the leading business center is also the leading concentration of headquarters, but this may well be because there is an absence of alternative locational options. But in countries with a well-developed infrastructure outside the leading business center there are likely to be multiple locational options for such headquarters. (Sassen 2001, p. xxi)
The Expansión database results are consistent with Sassen’s approach, as
more than half (296) of the firms in the Top 500 Companies list are either
national/international conglomerates of companies or affiliates of
national/foreign companies with multi-location production sites. My
analysis, therefore, will consider the degree to which location patterns can
be explained from the perspective of Mexico City as a “global” location
with supremacy over the rest of the country as a preferred location in
certain economic sectors at the beginning of the period of study. However,
I will suggest that analysing the distribution of headquarters of the Top
500 Companies over a period of time can add explanatory value beyond
the trade hypothesis suggested by Krugman and others.
The second part of this chapter presents the empirical results of a
quantitative analysis tracing location patterns associated with (foreign)
trade activity at the company level. As such analysis is not possible using
aggregate data, the Top 500 Companies database for 1980, 2000 and 2006
79
is used in order to explore business profile and performance. The analysis
looks at particular economic factors – foreign trade, foreign investment,
labour and financial practices – that appear to be the most influential in
“unleashing attraction forces” with regard to the changing regional balance
of Mexico and industrial location patterns, looking at Mexico City’s
economic dynamism in contrast to the border states. The main variable
under scrutiny is foreign trade, as this relates directly to Krugman’s
argument, with the expectation that companies with high export levels (as
a percentage of total sales) should be located closer to the border with the
US. According to the literature on globalisation, we might expect to find
companies that have high foreign investment shares, participate in the
Mexican Stock Exchange and operate through labour-intensive processes
among the list of more export-oriented companies.
KRUGMAN’S LIBERALISATION OF TRADE HYPOTHESIS
In order to test Krugman’s ideas, economic census data were examined to
discover regional economic growth trends for labour and economic units
in the manufacturing sector. The idea was to contrast systematically
Mexico City with the six states of the Mexico–US border: Baja California,
Sonora, Chihuahua, Coahuila, Nuevo León and Tamaulipas. Data for
Mexico City are the sum of figures for the Federal District (DF, Distrito
Federal) and the State of Mexico as recorded by the economic census data
for 1970 to 1998.36
36 Data for economic census of 2008 are included to carry forward trends as relevant to specific points.
80
Between 1940 and 1970 Mexico developed a relatively large, although
highly inefficient, manufacturing sector founded on import substitution
and protectionist practices. Particularly in Mexico City and its surrounding
states, manufacturing became the main source of employment and the
leading sector of the economy. Trade liberalisation brought new market
opportunities for Mexican products, but also fierce competition, triggering,
according to the principal hypothesis of this research, a process of
industrial transformation. The first signs were seen in Mexico City’s
manufacturing sector as it declined over the 1980s. Mexico City’s share of
manufacturing GDP declined from 1980, when it represented 25.2%,
through 1985 and 1994, when it represented 21% and 19.8% respectively,
to 1998 when 18.5% of manufacturing GDP was based in the capital (Table
3.1).37
Over the same period, the border increased its share of manufacturing
GDP from 19% to 28.5%. The border states combined showed a
manufacturing GDP growth rate of 4.1% on average between 1980 and
1994, and of 8% between 1994 and 1998 (see Table 3.2). For the same
period the rate for Mexico City fell below the national average, with a
decline of –1.9% between 1980 and 1994, and moderate growth of 1.5%
between 1994 and 1998, according to economic census data. The net result
was an increase in manufacturing output for the border region and a
37 Data are from the Mexico´s economic censuses, which is a comprehensive survey of manufacturing establishments by state and four-digit (ISIC) industry.
81
decline for Mexico City between 1980 and 2000, the period of the most
intense trade liberalisation and the time frame covered by this research.
In terms of employment, the regional trends need to be understood in the
context of the national trend of 57% manufacturing employment growth
between 1980 and 1998. Some border states registered especially high
growth rates – Baja California, for example, had a growth rate of 358%,
while Chihuahua registered 352% – and there was a 157% increase in
employment for the border region as a whole, contrasting with a dramatic
decline in absolute numbers for manufacturing employment in Mexico
City (the only region of the country to record a decline) of –41%, from
839,311 in 1980 to 477,197 in 1998. Over the period 1980-1998, Mexico
City’s share of national manufacturing employment fell from 44.5% to
23.3%, while the border region’s share increased from 21.1% to reach
34.1% in 1998 (Table 3.2). In general terms, these trends in the data lend
support to a Krugman-type hypothesis – the aggregate data indicate a
“magnetic” attraction toward the border states.
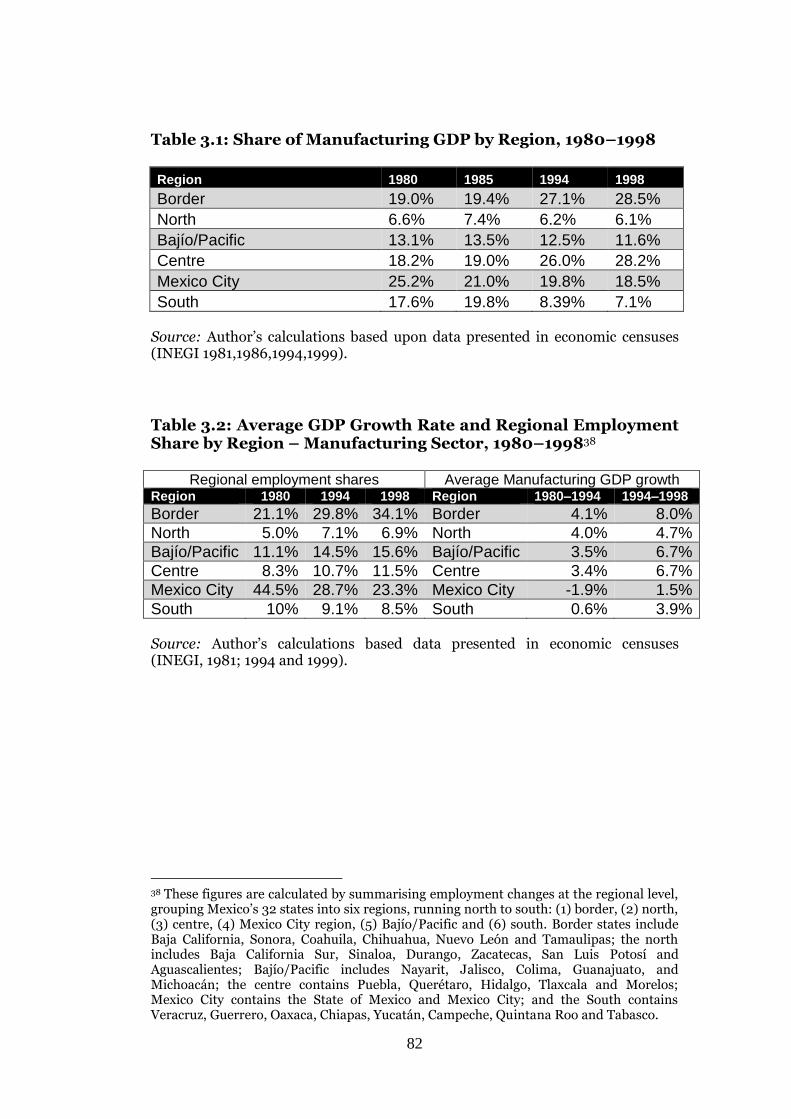
82
Table 3.1: Share of Manufacturing GDP by Region, 1980–1998
Region 1980 1985 1994 1998
Border 19.0% 19.4% 27.1% 28.5%
North 6.6% 7.4% 6.2% 6.1%
Bajío/Pacific 13.1% 13.5% 12.5% 11.6%
Centre 18.2% 19.0% 26.0% 28.2%
Mexico City 25.2% 21.0% 19.8% 18.5%
South 17.6% 19.8% 8.39% 7.1% Source: Author’s calculations based upon data presented in economic censuses (INEGI 1981,1986,1994,1999).
Table 3.2: Average GDP Growth Rate and Regional Employment Share by Region – Manufacturing Sector, 1980–199838
Regional employment shares Average Manufacturing GDP growth Region 1980 1994 1998 Region 1980–1994 1994–1998
Border 21.1% 29.8% 34.1% Border 4.1% 8.0%
North 5.0% 7.1% 6.9% North 4.0% 4.7%
Bajío/Pacific 11.1% 14.5% 15.6% Bajío/Pacific 3.5% 6.7%
Centre 8.3% 10.7% 11.5% Centre 3.4% 6.7%
Mexico City 44.5% 28.7% 23.3% Mexico City -1.9% 1.5%
South 10% 9.1% 8.5% South 0.6% 3.9% Source: Author’s calculations based data presented in economic censuses (INEGI, 1981; 1994 and 1999).
38 These figures are calculated by summarising employment changes at the regional level, grouping Mexico’s 32 states into six regions, running north to south: (1) border, (2) north, (3) centre, (4) Mexico City region, (5) Bajío/Pacific and (6) south. Border states include Baja California, Sonora, Coahuila, Chihuahua, Nuevo León and Tamaulipas; the north includes Baja California Sur, Sinaloa, Durango, Zacatecas, San Luis Potosí and Aguascalientes; Bajío/Pacific includes Nayarit, Jalisco, Colima, Guanajuato, and Michoacán; the centre contains Puebla, Querétaro, Hidalgo, Tlaxcala and Morelos; Mexico City contains the State of Mexico and Mexico City; and the South contains Veracruz, Guerrero, Oaxaca, Chiapas, Yucatán, Campeche, Quintana Roo and Tabasco.
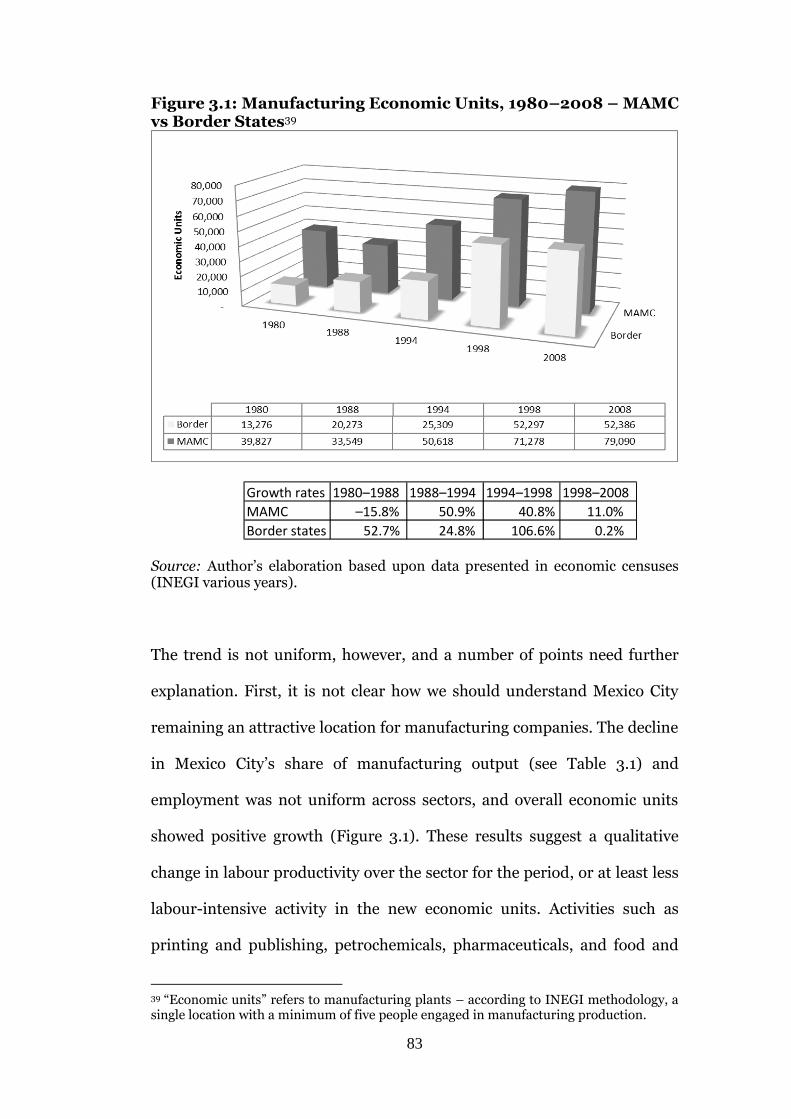
83
Figure 3.1: Manufacturing Economic Units, 1980–2008 – MAMC vs Border States39
Source: Author’s elaboration based upon data presented in economic censuses (INEGI various years).
The trend is not uniform, however, and a number of points need further
explanation. First, it is not clear how we should understand Mexico City
remaining an attractive location for manufacturing companies. The decline
in Mexico City’s share of manufacturing output (see Table 3.1) and
employment was not uniform across sectors, and overall economic units
showed positive growth (Figure 3.1). These results suggest a qualitative
change in labour productivity over the sector for the period, or at least less
labour-intensive activity in the new economic units. Activities such as
printing and publishing, petrochemicals, pharmaceuticals, and food and
39 “Economic units” refers to manufacturing plants – according to INEGI methodology, a single location with a minimum of five people engaged in manufacturing production.
Growth rates 1980–1988 1988–1994 1994–1998 1998–2008
MAMC –15.8% 50.9% 40.8% 11.0%
Border states 52.7% 24.8% 106.6% 0.2%
84
tobacco showed a positive growth trend in terms of output, employment
and an increase in economic units (as updated figures until 2008 confirm).
These results raise questions about the continuation of patterns of location
and specialisation associated with trade liberalisation suggested by
Markusen (1999), Martin and Rogers (1994a) and OECD (2002).
Second, Krugman argued that companies in the border region would
export to the US and Canada. Indeed, he put considerable emphasis on
transport/trade costs and access to markets as a result of trade
liberalisation as the most influential forces determining location. However,
general data on the changing manufacturing regional balance does not
take into consideration whether all companies moving to the border are
engaged in exports or whether they are more likely to do so compared to
those located elsewhere. The counter-analysis also needs to be considered;
namely, companies that remain in or locate to Mexico City during the
period of trade liberalisation may also be exporters or may be located in
the city due to other factors. As it is not possible to conduct such an
analysis with aggregate data, I chose to focus on a sample of companies.
The Top 500 Companies list for 2000 and 2006 as recorded by Expansión
allows for detailed analysis due to the presentation of a large number of
variables for individual companies.
THE MEXICAN ECONOMY ACCORDING TO THE TOP 500 COMPANIES
This section investigates how trade liberalisation in Mexico has led to
changes in industrial location using firm-level data from the Expansión
database. The section presents, first, the results of a statistical analysis of
85
the main economic variables available in the database, paying particular
attention to the location of the Top 500 Companies by looking at the year
of starting operations in order to identify the most attractive industrial
location after the liberalisation of trade from 1986. The next section
develops the Globality Index, briefly described in Chapter One, to provide
a score for each firm in the sample, ranking companies according to a set
of global characteristics in order to identify the location pattern for the
most “global” companies under the new economic regime. Instead of
building an econometric model, reliant on proxy data, the section tests
Krugman’s trade liberalisation and location arguments from a variety of
different angles using actual data. In setting out this analysis my
hypothesis is for there to be a positive correlation between manufacturing
companies exporting to the US and relocation to the border states.
The Expansión database composition for 1980 is as follows: the primary
sector represents 6% of companies in the sample, manufacturing 68% and
service/commerce 26% (Table 3.3).40 The variation in the composition of
the sample in 2000 was not large: primary sector companies represented
3.6% (–2.4 percentage points) of the sample, manufacturing 65% (–3
percentage points), and services 31% (+5 percentage points). In 2006, due
to the inclusion in the database of the financial sector, manufacturing was
reduced to 149 companies in relation to the 2000 database; this meant a
40 These Expansión sector shares differ from national shares, with an over-representation of manufacturing and an under-representation of services both in 1980 and 2000. The composition of the Mexican economy in 1980 using GDP data from INEGI’s economic censuses (INEGI 1981 and 1999) was 5.1% primary activities, 37.4% manufacturing and 57.4% service. In 2000 the primary and manufacturing sectors showed a decline and there was an increase in the service sector nationwide, with data of 3.8% (a difference of –1.3 percentage points), 34.9% (–2.5 percentage points) and 61.2% (+3.8 percentage points) respectively.

86
proportional reduction of nearly half of the manufacturing subsectors
represented in the sample, but interestingly the reduction is not uniform
as some subsectors such as automotive and auto parts showed an increase
in 2006.
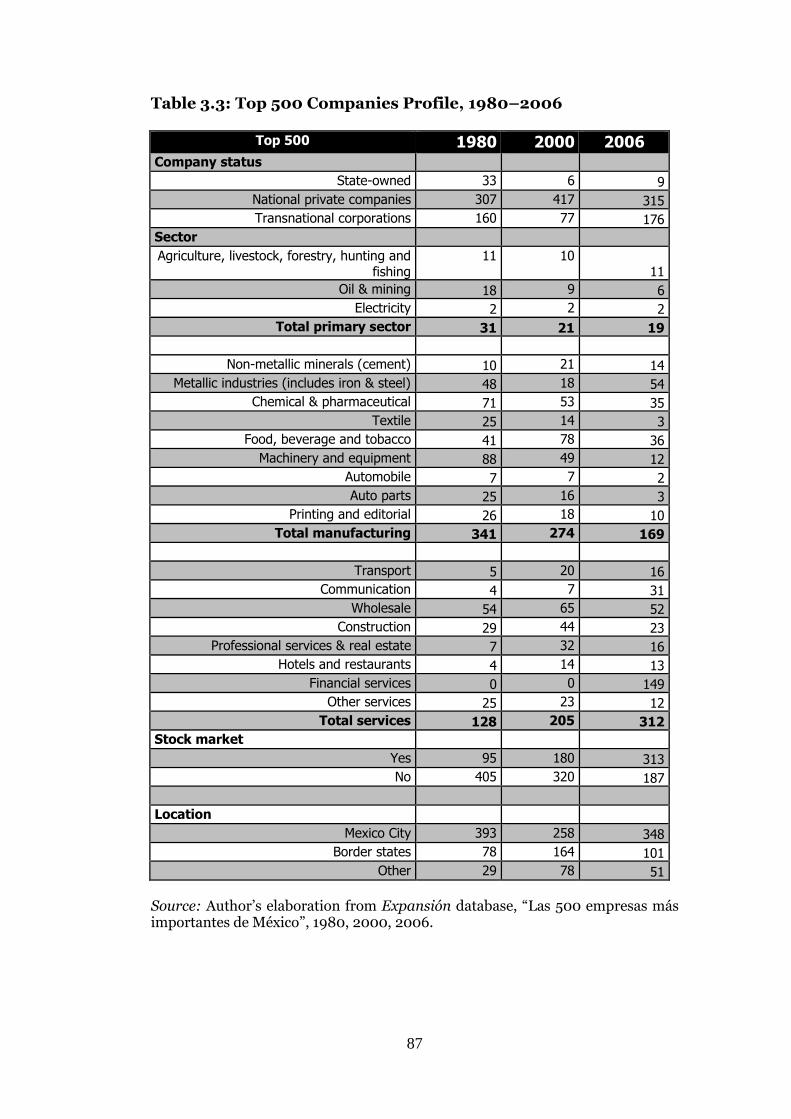
87
Table 3.3: Top 500 Companies Profile, 1980–2006
Top 500 1980 2000 2006 Company status
State-owned 33 6 9
National private companies 307 417 315
Transnational corporations 160 77 176
Sector
Agriculture, livestock, forestry, hunting and fishing
11 10 11
Oil & mining 18 9 6
Electricity 2 2 2
Total primary sector 31 21 19
Non-metallic minerals (cement) 10 21 14
Metallic industries (includes iron & steel) 48 18 54
Chemical & pharmaceutical 71 53 35
Textile 25 14 3
Food, beverage and tobacco 41 78 36
Machinery and equipment 88 49 12
Automobile 7 7 2
Auto parts 25 16 3
Printing and editorial 26 18 10
Total manufacturing 341 274 169
Transport 5 20 16
Communication 4 7 31
Wholesale 54 65 52
Construction 29 44 23
Professional services & real estate 7 32 16
Hotels and restaurants 4 14 13
Financial services 0 0 149
Other services 25 23 12
Total services 128 205 312
Stock market
Yes 95 180 313
No 405 320 187
Location
Mexico City 393 258 348
Border states 78 164 101
Other 29 78 51
Source: Author’s elaboration from Expansión database, “Las 500 empresas más importantes de México”, 1980, 2000, 2006.
88
There appears to be a noteable transformation in the ranking of the Top
500 Companies between 1980, 2000 and 2006 with regard to changes in
ownership status. The size of the public sector had grown significantly as a
result of a government policy aimed at acquiring bankrupt private
companies with the intention of guaranteeing employment (and supplies)
during the ISI period, and growth was especially intense between 1979 and
1981. This situation led to an increase in public-owned companies from
272 in 1970 to 1,115 in 1982, and as a proportion of GDP from 6.5% to
13.5% over the same period.41 By the end of 1988 the government held 560
companies, including commercial banks that had been in its hands since
nationalisation in 1982. In total, public companies in Mexico accounted at
their peak in 1982 for 18.5% of GDP and employed nearly one million
people or 10% of the total formal sector workforce (Rogozinski 1998, p.76).
Of the 1,155 firms under state control in 1982, by the end of 1996 the
government had divested itself of 936 through public bid processes,
closures, mergers, or transfers to the private sector (see Table 3.4).42
41 In 1973, the Federal Congress approved the Ley para Promover la Inversión Mexicana y Regular la Inversión Extranjera (Law to Promote Mexican Investment and Regulate Foreign Investment). This law set a maximum of 49% for a foreign stakeholding in any given company in Mexico. Nevertheless, it provided room for exceptions “for sectors of the economy, and regions or special cases where it might be convenient for the development of the country” (Article 8). The decree also created the Comisión Nacional de Inversiones Extranjeras (National Commission of Foreign Investment) to regulate and control foreign investment. TNCs in the consumer electronics sector were the direct beneficiaries of this law and particularly enjoyed the benefits of discretionary treatment. In terms of FDI, secondary legislation was passed in May 1989 modifying the law of 1973, with the provision of a clear non-discretionary framework aimed at favouring the development of projects involving the transfer of technology, the generation of net foreign exchange earnings and the creation of employment. Investments that contributed to the decentralisation of economic activity and to higher rates of capital formation were also given priority (Aspe 1991; Rogozinski 1998). 42 By the end of 1991 these represented cumulative sales of US$15 billion (around 5% of GDP); this increased the margin for manoeuvre in the public sector, as it provided the government with resources and transferred a quarter of a million employees to the private sector. As a result of the privatisation process, the importance of the public sector was sharply reduced in terms of total employment and production within the national
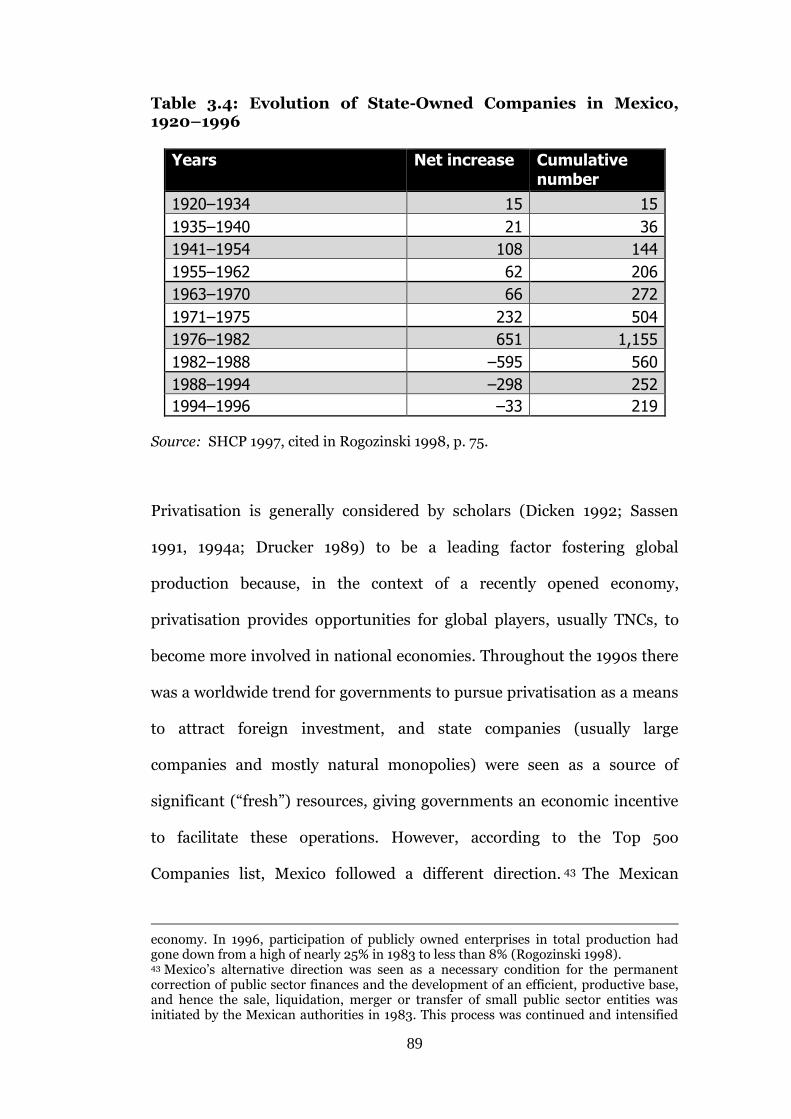
89
Table 3.4: Evolution of State-Owned Companies in Mexico, 1920–1996
Years Net increase Cumulative number
1920–1934 15 15
1935–1940 21 36
1941–1954 108 144
1955–1962 62 206
1963–1970 66 272
1971–1975 232 504
1976–1982 651 1,155
1982–1988 –595 560
1988–1994 –298 252
1994–1996 –33 219 Source: SHCP 1997, cited in Rogozinski 1998, p. 75.
Privatisation is generally considered by scholars (Dicken 1992; Sassen
1991, 1994a; Drucker 1989) to be a leading factor fostering global
production because, in the context of a recently opened economy,
privatisation provides opportunities for global players, usually TNCs, to
become more involved in national economies. Throughout the 1990s there
was a worldwide trend for governments to pursue privatisation as a means
to attract foreign investment, and state companies (usually large
companies and mostly natural monopolies) were seen as a source of
significant (“fresh”) resources, giving governments an economic incentive
to facilitate these operations. However, according to the Top 5oo
Companies list, Mexico followed a different direction. 43 The Mexican
economy. In 1996, participation of publicly owned enterprises in total production had gone down from a high of nearly 25% in 1983 to less than 8% (Rogozinski 1998). 43 Mexico’s alternative direction was seen as a necessary condition for the permanent correction of public sector finances and the development of an efficient, productive base, and hence the sale, liquidation, merger or transfer of small public sector entities was initiated by the Mexican authorities in 1983. This process was continued and intensified
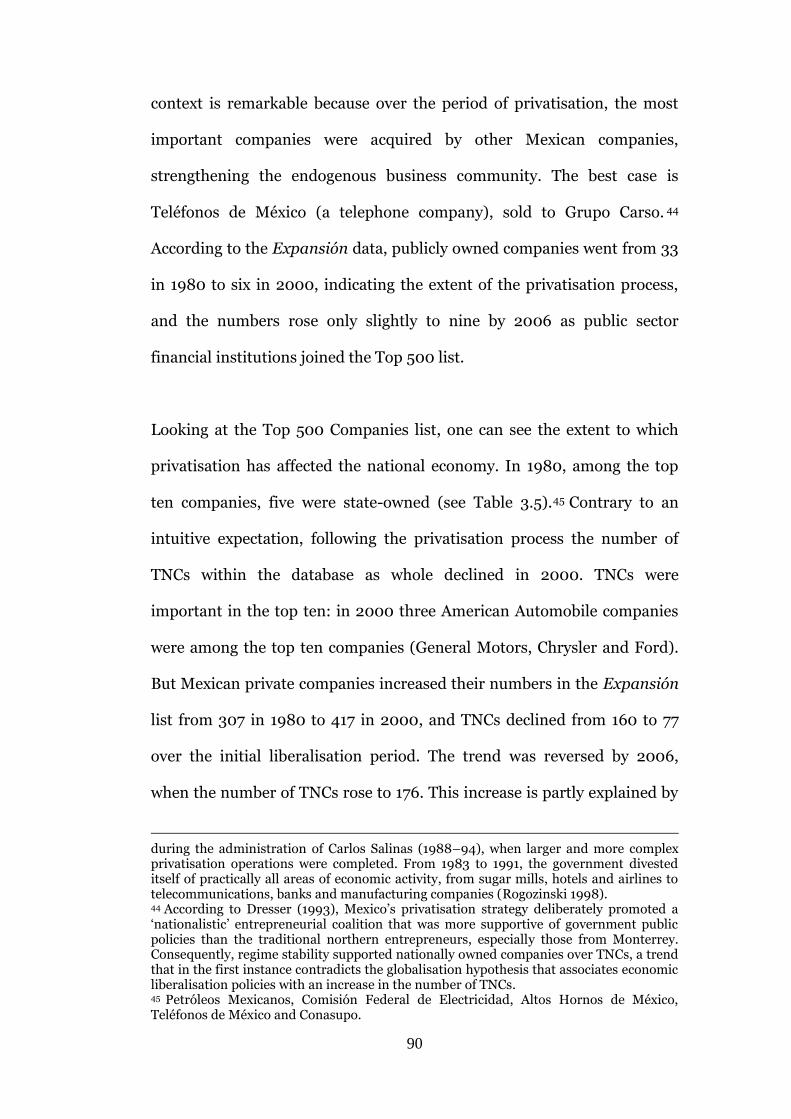
90
context is remarkable because over the period of privatisation, the most
important companies were acquired by other Mexican companies,
strengthening the endogenous business community. The best case is
Teléfonos de México (a telephone company), sold to Grupo Carso. 44
According to the Expansión data, publicly owned companies went from 33
in 1980 to six in 2000, indicating the extent of the privatisation process,
and the numbers rose only slightly to nine by 2006 as public sector
financial institutions joined the Top 500 list.
Looking at the Top 500 Companies list, one can see the extent to which
privatisation has affected the national economy. In 1980, among the top
ten companies, five were state-owned (see Table 3.5).45 Contrary to an
intuitive expectation, following the privatisation process the number of
TNCs within the database as whole declined in 2000. TNCs were
important in the top ten: in 2000 three American Automobile companies
were among the top ten companies (General Motors, Chrysler and Ford).
But Mexican private companies increased their numbers in the Expansión
list from 307 in 1980 to 417 in 2000, and TNCs declined from 160 to 77
over the initial liberalisation period. The trend was reversed by 2006,
when the number of TNCs rose to 176. This increase is partly explained by
during the administration of Carlos Salinas (1988–94), when larger and more complex privatisation operations were completed. From 1983 to 1991, the government divested itself of practically all areas of economic activity, from sugar mills, hotels and airlines to telecommunications, banks and manufacturing companies (Rogozinski 1998). 44 According to Dresser (1993), Mexico’s privatisation strategy deliberately promoted a ‘nationalistic’ entrepreneurial coalition that was more supportive of government public policies than the traditional northern entrepreneurs, especially those from Monterrey. Consequently, regime stability supported nationally owned companies over TNCs, a trend that in the first instance contradicts the globalisation hypothesis that associates economic liberalisation policies with an increase in the number of TNCs. 45 Petróleos Mexicanos, Comisión Federal de Electricidad, Altos Hornos de México, Teléfonos de México and Conasupo.
91
the inclusion of the financial sector in the 2006 database; however, out of
149 financial sector firms, 78 are Mexican majority capital and 71 are
TNCs. In 2006, the sector distribution of the top ten gives an idea of the
diversification of the Mexican economy over the last decade, with two state
companies (PEMEX and Comisión Federal de Electricidad, both large
monopolies in oil and electricity respectively), two from the
telecommunications industry (Telmex and América Móvil), two
automotive firms (General Motors and DaimlerChrysler), one from the
wholesale retail sector (Wal-Mart), one from the food and beverage sector
(FEMSA), and the largest financial group in México BBVA-Bancomer.
Table 3.5: The Top Ten Companies, 1980–2006
1980 2000 2006
1. Petróleos Mexicanos 1. Petróleos Mexicanos 1. Petróleos Mexicanos
2. Grupo Sidermex 2. Carso 2. América Móvil
3. Grupo Industrial Alfa 3. Teléfonos de Mexico 3. Comisión Federal de Electricidad
4. Comisión Federal de Electricidad
4. DaimlerChrysler 4. Wal-Mart de México
5. Valores industriales 5. General Motors 5. CEMEX
6. Conasupo 6. Volkswagen de México
6. Teléfonos de México/ Telcel
7. Fomento Industrial Somex
7. Wal-Mart de México 7. General Motors de México
8. Empresas ICA 8. Cementos Mexicanos 8. Fomento Económico Mexicano
9. Chrysler 9. Ford Motor Company 9. DaimlerChrysler de México
10. Ford Motor Company 10. Group Carso 10. BBVA-Bancomer
Source: Author’s calculations from Expansión database, “Las 500 empresas más importantes de México”, 1980, 2000, 2006.
The Top 500 sample also indicates the effects of deregulation on foreign
investment. In 2000 there were 152 companies in the sample with some
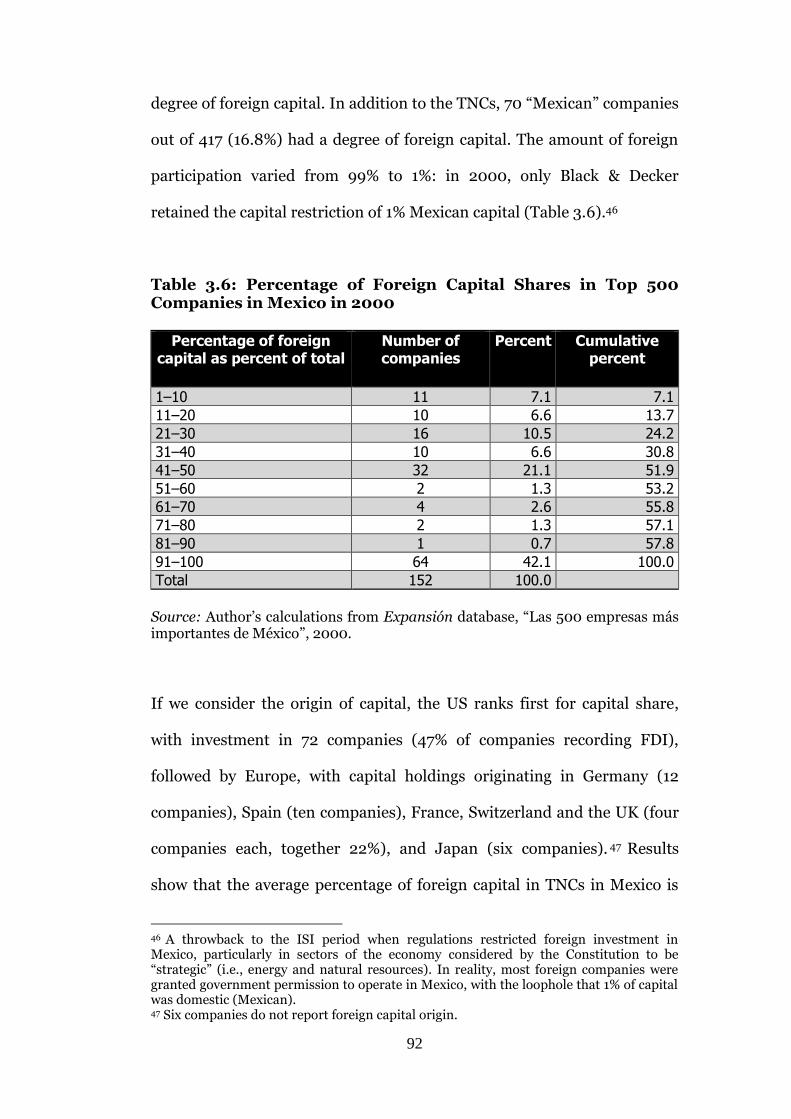
92
degree of foreign capital. In addition to the TNCs, 70 “Mexican” companies
out of 417 (16.8%) had a degree of foreign capital. The amount of foreign
participation varied from 99% to 1%: in 2000, only Black & Decker
retained the capital restriction of 1% Mexican capital (Table 3.6).46
Table 3.6: Percentage of Foreign Capital Shares in Top 500 Companies in Mexico in 2000
Percentage of foreign capital as percent of total
Number of companies
Percent Cumulative percent
1–10 11 7.1 7.1
11–20 10 6.6 13.7
21–30 16 10.5 24.2
31–40 10 6.6 30.8
41–50 32 21.1 51.9
51–60 2 1.3 53.2
61–70 4 2.6 55.8
71–80 2 1.3 57.1
81–90 1 0.7 57.8
91–100 64 42.1 100.0
Total 152 100.0
Source: Author’s calculations from Expansión database, “Las 500 empresas más importantes de México”, 2000.
If we consider the origin of capital, the US ranks first for capital share,
with investment in 72 companies (47% of companies recording FDI),
followed by Europe, with capital holdings originating in Germany (12
companies), Spain (ten companies), France, Switzerland and the UK (four
companies each, together 22%), and Japan (six companies). 47 Results
show that the average percentage of foreign capital in TNCs in Mexico is
46 A throwback to the ISI period when regulations restricted foreign investment in Mexico, particularly in sectors of the economy considered by the Constitution to be “strategic” (i.e., energy and natural resources). In reality, most foreign companies were granted government permission to operate in Mexico, with the loophole that 1% of capital was domestic (Mexican). 47 Six companies do not report foreign capital origin.
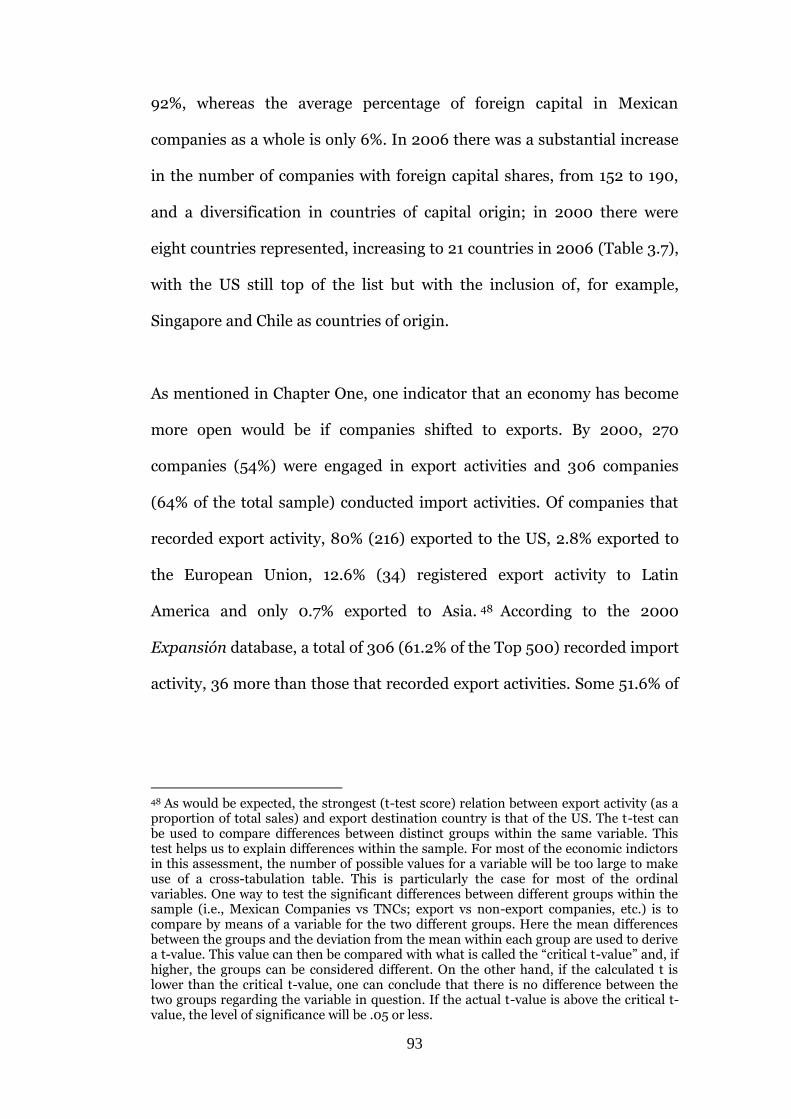
93
92%, whereas the average percentage of foreign capital in Mexican
companies as a whole is only 6%. In 2006 there was a substantial increase
in the number of companies with foreign capital shares, from 152 to 190,
and a diversification in countries of capital origin; in 2000 there were
eight countries represented, increasing to 21 countries in 2006 (Table 3.7),
with the US still top of the list but with the inclusion of, for example,
Singapore and Chile as countries of origin.
As mentioned in Chapter One, one indicator that an economy has become
more open would be if companies shifted to exports. By 2000, 270
companies (54%) were engaged in export activities and 306 companies
(64% of the total sample) conducted import activities. Of companies that
recorded export activity, 80% (216) exported to the US, 2.8% exported to
the European Union, 12.6% (34) registered export activity to Latin
America and only 0.7% exported to Asia. 48 According to the 2000
Expansión database, a total of 306 (61.2% of the Top 500) recorded import
activity, 36 more than those that recorded export activities. Some 51.6% of
48 As would be expected, the strongest (t-test score) relation between export activity (as a proportion of total sales) and export destination country is that of the US. The t-test can be used to compare differences between distinct groups within the same variable. This test helps us to explain differences within the sample. For most of the economic indictors in this assessment, the number of possible values for a variable will be too large to make use of a cross-tabulation table. This is particularly the case for most of the ordinal variables. One way to test the significant differences between different groups within the sample (i.e., Mexican Companies vs TNCs; export vs non-export companies, etc.) is to compare by means of a variable for the two different groups. Here the mean differences between the groups and the deviation from the mean within each group are used to derive a t-value. This value can then be compared with what is called the “critical t-value” and, if higher, the groups can be considered different. On the other hand, if the calculated t is lower than the critical t-value, one can conclude that there is no difference between the two groups regarding the variable in question. If the actual t-value is above the critical t-value, the level of significance will be .05 or less.
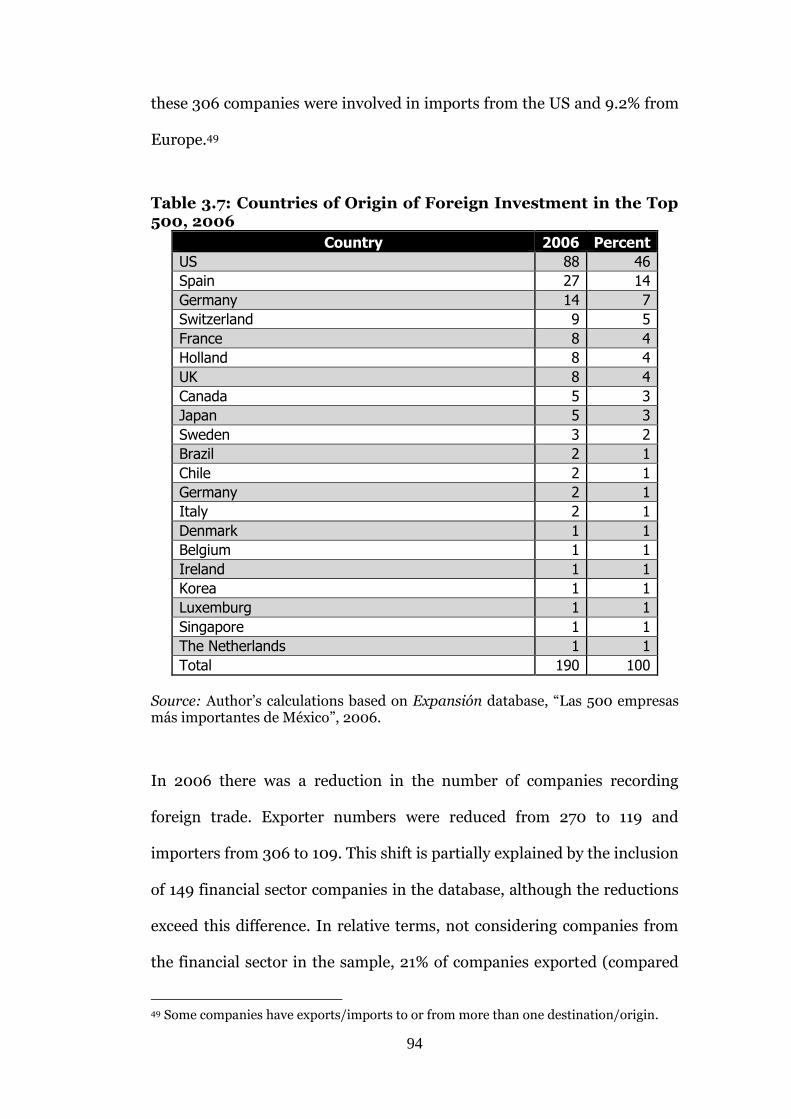
94
these 306 companies were involved in imports from the US and 9.2% from
Europe.49
Table 3.7: Countries of Origin of Foreign Investment in the Top 500, 2006
Country 2006 Percent
US 88 46
Spain 27 14
Germany 14 7
Switzerland 9 5
France 8 4
Holland 8 4
UK 8 4
Canada 5 3
Japan 5 3
Sweden 3 2
Brazil 2 1
Chile 2 1
Germany 2 1
Italy 2 1
Denmark 1 1
Belgium 1 1
Ireland 1 1
Korea 1 1
Luxemburg 1 1
Singapore 1 1
The Netherlands 1 1
Total 190 100
Source: Author’s calculations based on Expansión database, “Las 500 empresas más importantes de México”, 2006.
In 2006 there was a reduction in the number of companies recording
foreign trade. Exporter numbers were reduced from 270 to 119 and
importers from 306 to 109. This shift is partially explained by the inclusion
of 149 financial sector companies in the database, although the reductions
exceed this difference. In relative terms, not considering companies from
the financial sector in the sample, 21% of companies exported (compared
49 Some companies have exports/imports to or from more than one destination/origin.
95
with 43% in 2000) and 23% imported (from 64% in 2000). The results
contradict national aggregate trends for foreign trade, since in this case
companies recording exports and imports in a six-year period decreased.
Two possible interpretations of this situation are: (i) the increase in
companies in the service sector within the 500 companies, particularly
those in telecommunication and producer services, which became the
largest companies by sales; and (ii) the increase in chain values and intra-
firm trade, along with the rules of origin leading to more Mexican content
in products in order to comply with NAFTA regulations, and the end of
government export promotion programmes and incentives.50
There is support for this second point from worldwide data that points to
certain forms of trade having become spatially significant in the context of
globalisation. International sourcing (the purchase of intermediate inputs
from foreign sources) grew faster than domestic sourcing between 1990
and 2000 accounted for at least one-half of all imports by major countries
(UNCTAD 2002). Intra-firm trade kept pace with total trade and grew
rapidly in countries with high levels of foreign investment. Intra-industry
trade rose significantly in almost all OECD countries over the 1990s
(OECD 1996a, 2001a). For Mexico, the most obvious manifestation of this
shift concerns the Maquiladora Programme. In the 2000 sample there
were 16 maquila companies, all exporting to the US, with 14 importing
from the US and only two importing materials from elsewhere: namely,
Germany, with one company involved in the automotive sector and
50 In 2004, export promotion programmes such as the Maquiladora Programme, PITEX and ALTEX came to an end according to NAFTA provisions.
96
another in electronics. Out of the 16 companies, six were TNCs with 100%
foreign capital and ten were controlled by Mexican (domestic) capital with
less than 40% of foreign capital share.
The Top 500 database also allows for an exploration of company location
over time. The data reveal that in 2000 the trend for the top companies
was similar to the relocation patterns for economic activity shown by the
census data: a decline between 1980 and 2000 in companies located in
Mexico City (from 393 to 258) and a significant increase in companies
located in states with a long-standing manufacturing role – Jalisco with 42
and Nuevo León with 50. The border states increased their presence – for
example, Chihuahua, which had no Top 500 ranking companies in 1980,
gained 17 by 2000 – as did some other states. In 2000 there were 17
companies in Baja California, 12 in Tamaulipas, ten in Coahuila and six in
Sonora. In 1980 there were 78 companies in the border states, and the
number rose 120% by 2000. However, except for Nuevo León, the border
states do not show significantly different economic growth trends than
other states located outside the region for companies in the Top 500 over
the period 1980–2000. Three states, for example, that failed to register
any companies in the 1980 database but are not border states recorded a
significant presence by 2000: ten companies were located in Veracruz, ten
in Durango and nine in Sinaloa.
In the 2000 sample, Mexico City records 258 companies compared with
164 in the border states, indicating the strong appeal of Mexico City. In
absolute numbers in 2000 Mexico City remained the lead location, hosting
97
51.6% of the Top 500 Companies, despite the fact that this figure means a
significant reduction from 393 in 1980 (–34.4%). In 2006 the number of
companies located in Mexico City increased to 348, mostly due to the
different composition of the database. So, while the border has
experienced an increase in numbers as Krugman predicted, the effect on
Mexico City is not clear, at least not to the degree expected by Krugman
and Livas; and, the increase in company presence at the border is not
exclusive, as other states emerged onto the list just as strongly. This simple
descriptive and comparative analysis, therefore, points to a more complex
explanation for change to the national regional economy than trade
liberalisation can provide alone.
The next section therefore presents a more detailed comparison between
companies located in Mexico City and companies located in the border
region in order to test Krugman’s argument. The analysis looks at the year
of starting operations and trade – exports to the US – to test whether
location decisions can be related to trade liberalisation post-1986 (when
Mexico became a full GATT member). According to Krugman, companies
starting operation in Mexico after 1986 with export activity to the US
would be expected to locate in the border region. Companies located in
Mexico City would be expected to have lower (or no) export activity
compared with those located in the border region.
Mexico City vs Border Region: Trade and Location
Krugman (1995) considers that the transition to an open economy affects
the location of economic activity. A reduction of trade barriers lowers
98
transport costs between domestic and external markets, prompting some
firms to relocate in response to transport costs. In a closed economy, the
location of an industrial centre may be determined by the interaction of
transport costs, increasing returns and congestion costs, implying that
firms are most likely to agglomerate in a single region (Krugman and Livas
1996). As the economy moves from closed to more open conditions, firms
have to consider their location options. According to Krugman, if external
demand for goods manufactured in the economy is sufficiently large, then
firms will have an incentive to relocate to regions that have relatively low-
cost access to the external market. If, however, the existing industrial
centre formed during the closed economy is located far from the least-cost
region, then firms may be reluctant to improve access to foreign markets if
they have to forego the benefits of being near to established suppliers, or
industries from which they derive externalities, and domestic demand
(Krugman 1991a). Therefore, in the case of Mexico one might expect that
Krugman’s argument, although uncertain for companies already located in
Mexico City (and therefore subject to detailed research in the case study
chapters), would apply to new companies starting operation after trade
liberalisation in 1986.
In order to compare both locations I will start with an overview of the
general features of companies located in Mexico City and the border states
in 2000. Looking at the characteristics of companies located in Mexico
City, this location ranks better in absolute numbers compared to the
border region in terms of export and import companies, TNCs and
companies listed on the Mexican Stock Exchange. Seen from a different
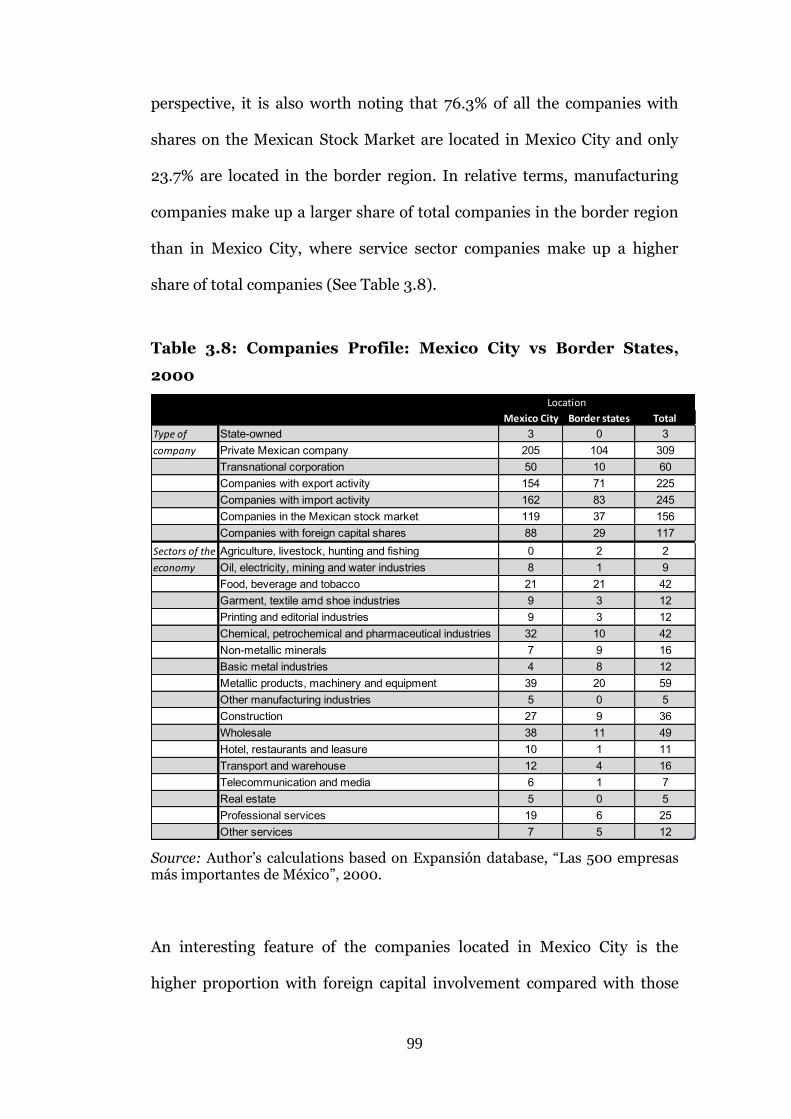
99
perspective, it is also worth noting that 76.3% of all the companies with
shares on the Mexican Stock Market are located in Mexico City and only
23.7% are located in the border region. In relative terms, manufacturing
companies make up a larger share of total companies in the border region
than in Mexico City, where service sector companies make up a higher
share of total companies (See Table 3.8).
Table 3.8: Companies Profile: Mexico City vs Border States,
2000
Columna1 Columna2 Mexico City Border states Total
Type of State-owned 3 0 3
company Private Mexican company 205 104 309
Transnational corporation 50 10 60
Companies with export activity 154 71 225
Companies with import activity 162 83 245
Companies in the Mexican stock market 119 37 156
Companies with foreign capital shares 88 29 117
Sectors of the Agriculture, livestock, hunting and fishing 0 2 2
economy Oil, electricity, mining and water industries 8 1 9
Food, beverage and tobacco 21 21 42
Garment, textile amd shoe industries 9 3 12
Printing and editorial industries 9 3 12
Chemical, petrochemical and pharmaceutical industries 32 10 42
Non-metallic minerals 7 9 16
Basic metal industries 4 8 12
Metallic products, machinery and equipment 39 20 59
Other manufacturing industries 5 0 5
Construction 27 9 36
Wholesale 38 11 49
Hotel, restaurants and leasure 10 1 11
Transport and warehouse 12 4 16
Telecommunication and media 6 1 7
Real estate 5 0 5
Professional services 19 6 25
Other services 7 5 12
Location
Source: Author’s calculations based on Expansión database, “Las 500 empresas más importantes de México”, 2000.
An interesting feature of the companies located in Mexico City is the
higher proportion with foreign capital involvement compared with those
100
located at the border. If we look at the percentage of Mexican companies
with participation of foreign capital for Mexico City and the border region,
the data show Mexico City to be the location for 75.2% (88 out of 117
companies with some participation of foreign capital in the database),
greater than the border region, with 24.8% (29 out of 117 companies with
some participation of foreign capital in the database). Moreover, the
average share of foreign capital as a percentage of total social capital (for
Mexican companies) is significantly higher for those companies located in
Mexico City (34%) compared with those located at the border (20.7%).51
From the total number of export companies within the 500 database (287),
225 are located in Mexico City and the border states; 154 in Mexico City
(53.7% of all export companies) and 71 (24.7%) in border states. What
these data suggest is that companies located in Mexico City are more
internationally oriented, at least in one sense, than those at the border.
Table 3.9, below, presents the companies in the border states and Mexico
City with exports to the US, cross-tabulated with companies’ starting
operation years. The first feature is that of the 219 companies with export
activity to the US, Mexico City (with 49.3%) and the border states (with
29.3%) represent 78.6% of companies, leaving one-fifth (21.4%) of
companies with exports to the US distributed over the other states.
Looking at the year these companies started operations is revealing, as out
of the 219 companies exporting to the US in 2000, 77 started operations in
51 Foreign capital shares is the variable with the highest t-test score, suggesting the strongest statistical relationship with the location variable. In other words, the higher the foreign capital shares in any given company, the more likely the company is to be located in Mexico City, according to these results.
101
Mexico after 1986, meaning that 142 US-export companies (almost double
the 1986 figure) were already established in Mexico in 2000 and started
operations before trade liberalisation took place. This suggests that these
companies went into a market orientation transformation, a shift from
producing for the Mexican market to an export-oriented model.
If we consider the date of starting operation and look at company location,
one expectation according to Krugman’s hypothesis might be to find more
companies located in border states than in Mexico City (see Table 3.9).
However, the number of companies starting operations after 1986 and
locating in Mexico City is greater (37) than the number of companies
locating in border states over the same period of time (23), challenging
Krugman’s claims. Two situations contradict Krugman’s argument. First,
based on the analysis of the 500 top companies, 65.3% of companies
exporting to the US and Canada were established in Mexico before the
liberalisation of trade in 1986; and second, the fact that the number of
export companies starting operation in Mexico after 1986 and exporting to
the US is larger in Mexico City than in the border states also contradicts
Krugman’s ideas. Therefore the nature of Mexico City’s centripetal force on
the 37 companies with exports to the US and Canada that located in
Mexico City after trade liberalisation in 1986, and particularly the seven
that did so after the start of NAFTA, requires further research.52
52 Sassen’s ideas on the global city hypothesis will be used to explore further the economic features that make Mexico City an attractive location under an open, more global economic regime in Mexico.
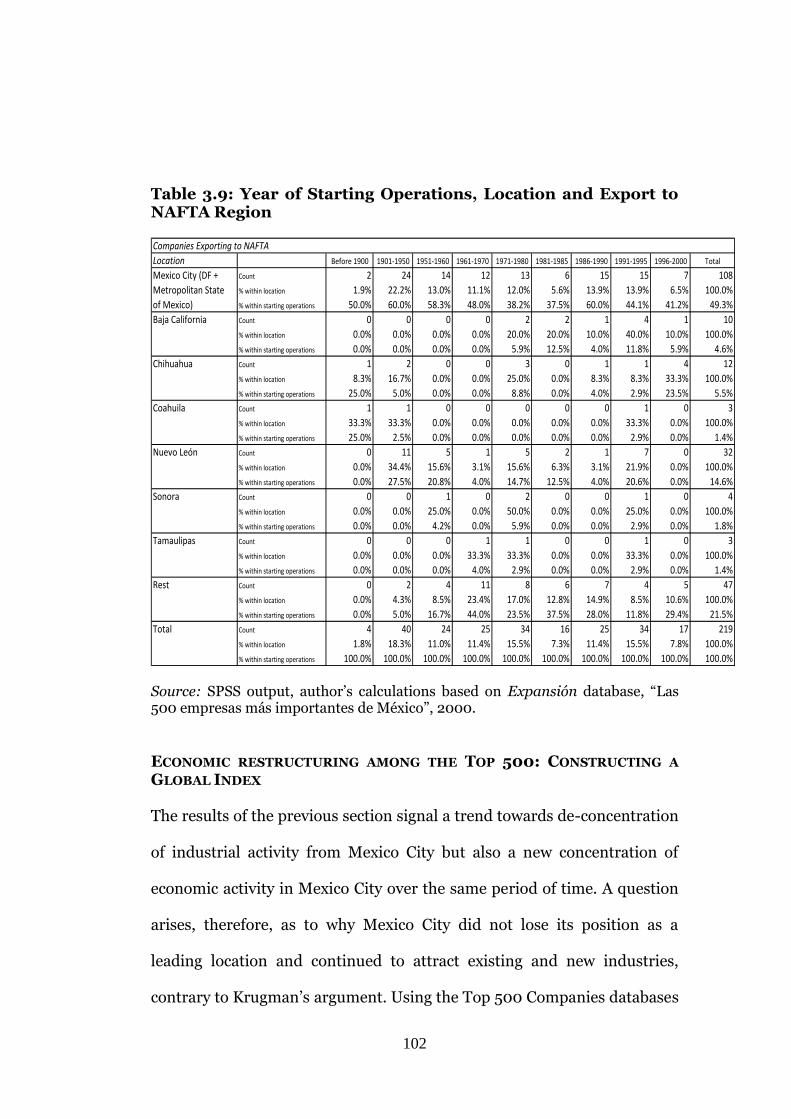
102
Table 3.9: Year of Starting Operations, Location and Export to NAFTA Region
Companies Exporting to NAFTA
Location Before 1900 1901-1950 1951-1960 1961-1970 1971-1980 1981-1985 1986-1990 1991-1995 1996-2000 Total
Mexico City (DF + Count 2 24 14 12 13 6 15 15 7 108
Metropolitan State % within location 1.9% 22.2% 13.0% 11.1% 12.0% 5.6% 13.9% 13.9% 6.5% 100.0%
of Mexico) % within starting operations 50.0% 60.0% 58.3% 48.0% 38.2% 37.5% 60.0% 44.1% 41.2% 49.3%
Baja California Count 0 0 0 0 2 2 1 4 1 10
% within location 0.0% 0.0% 0.0% 0.0% 20.0% 20.0% 10.0% 40.0% 10.0% 100.0%
% within starting operations 0.0% 0.0% 0.0% 0.0% 5.9% 12.5% 4.0% 11.8% 5.9% 4.6%
Chihuahua Count 1 2 0 0 3 0 1 1 4 12
% within location 8.3% 16.7% 0.0% 0.0% 25.0% 0.0% 8.3% 8.3% 33.3% 100.0%
% within starting operations 25.0% 5.0% 0.0% 0.0% 8.8% 0.0% 4.0% 2.9% 23.5% 5.5%
Coahuila Count 1 1 0 0 0 0 0 1 0 3
% within location 33.3% 33.3% 0.0% 0.0% 0.0% 0.0% 0.0% 33.3% 0.0% 100.0%
% within starting operations 25.0% 2.5% 0.0% 0.0% 0.0% 0.0% 0.0% 2.9% 0.0% 1.4%
Nuevo León Count 0 11 5 1 5 2 1 7 0 32
% within location 0.0% 34.4% 15.6% 3.1% 15.6% 6.3% 3.1% 21.9% 0.0% 100.0%
% within starting operations 0.0% 27.5% 20.8% 4.0% 14.7% 12.5% 4.0% 20.6% 0.0% 14.6%
Sonora Count 0 0 1 0 2 0 0 1 0 4
% within location 0.0% 0.0% 25.0% 0.0% 50.0% 0.0% 0.0% 25.0% 0.0% 100.0%
% within starting operations 0.0% 0.0% 4.2% 0.0% 5.9% 0.0% 0.0% 2.9% 0.0% 1.8%
Tamaulipas Count 0 0 0 1 1 0 0 1 0 3
% within location 0.0% 0.0% 0.0% 33.3% 33.3% 0.0% 0.0% 33.3% 0.0% 100.0%
% within starting operations 0.0% 0.0% 0.0% 4.0% 2.9% 0.0% 0.0% 2.9% 0.0% 1.4%
Rest Count 0 2 4 11 8 6 7 4 5 47
% within location 0.0% 4.3% 8.5% 23.4% 17.0% 12.8% 14.9% 8.5% 10.6% 100.0%
% within starting operations 0.0% 5.0% 16.7% 44.0% 23.5% 37.5% 28.0% 11.8% 29.4% 21.5%
Total Count 4 40 24 25 34 16 25 34 17 219
% within location 1.8% 18.3% 11.0% 11.4% 15.5% 7.3% 11.4% 15.5% 7.8% 100.0%
% within starting operations 100.0% 100.0% 100.0% 100.0% 100.0% 100.0% 100.0% 100.0% 100.0% 100.0%
Source: SPSS output, author’s calculations based on Expansión database, “Las 500 empresas más importantes de México”, 2000. ECONOMIC RESTRUCTURING AMONG THE TOP 500: CONSTRUCTING A
GLOBAL INDEX The results of the previous section signal a trend towards de-concentration
of industrial activity from Mexico City but also a new concentration of
economic activity in Mexico City over the same period of time. A question
arises, therefore, as to why Mexico City did not lose its position as a
leading location and continued to attract existing and new industries,
contrary to Krugman’s argument. Using the Top 500 Companies databases
103
for 2000 and 2006, this section examines the trend of ecnomic localisation
between Mexico City and the rest of the country. I am interested in testing
the free trade location argument for Mexico City to consider what
economic factors beyond the free trade regime are important to location
decisions; for example, the presence of TNCs, flows of foreign investment,
labour availability and financial specialisation.
In pursuing this analysis I consider Sassen’s ideas and the alternative
hypothesis outlined in Chapter One in order to explore a statistical
association between the globalisation of companies’ business activities and
location. The aim is to identify the economic factors that make one
location more attractive than others under the free trade regime which in
the case of Mexico can be described as a “global regime” as a consequence
not only of trade but also financial liberalisation, economic deregulation
and economic integration into North America. Testing Sassen’s “global
city” ideas using multivariate analysis, I compare Mexico City’s “global
economic factors” with other Mexican states.
The multivariate econometric model was used to generate an index in
order to construct a new ranking for the top 100 companies in terms of
global characteristics, aiming at identifying the companies with the highest
levels in globally oriented activity.53
53 The sample was reduced to 100 companies in order to analyse only those with a “global reach” – companies involved almost entirely with the domestic market would produce a zero or very low global score. Using the top 100 companies in global terms allows statistical consistency and comparison.
104
A PCA model was constructed based on variables that reflect dimensions
of globalisation and applied to determine how indicators can be most
effectively combined to measure a firm’s relative “global” status (globality).
Hence, the application of PCA used indicators that showed strong
correlations with the defined “global benchmark” indicators such as
foreign trade and foreign capital flows.54 Filtering the indicators in this
way provided a stronger measure of globality. To complete the filtering
process, all other variables registering a significant level of correlation
were added to the list of globality indicators. The linear correlation
coefficient – a statistical procedure used to measure the degree to which
two variables are associated – is the primary means of filtering global
indicators to determine which variables appear to be the strongest for
capturing differences in the relative globality of firms. The correlation
coefficient can determine the level and direction of a relationship between
two variables. 55 The indicators listed in Table 3.10 can be considered
measures of the level of global activity for each company in the Top 500
sample. Table 3.10 explains the “global dimension” that is considered to be
measured by each variable as a justification for inclusion in the model. In
brief, the results indicate that 26 out of 40 variables correlated with
exports, imports and FDI were found to be significantly (statistically)
associated. Output from the analysis has been summarised in Table 3.11,
54 Usually used in globalisation literature as proxies to measure economic globalisation. 55 Linear correlation does not require that the units used in each variable be the same. The values of the correlation coefficient range from –1.00 to +1.00, and their sign and magnitude indicate how the two variables relate to each other. A coefficient value at or near –1 indicates that the variables are inversely related, or that a higher value for one is associated with a lower value for the other. In contrast, a value at or near 1 suggests a strong positive relationship between the two variables. Coefficient values at or near 0 suggest that no strong relation exists between the variables.
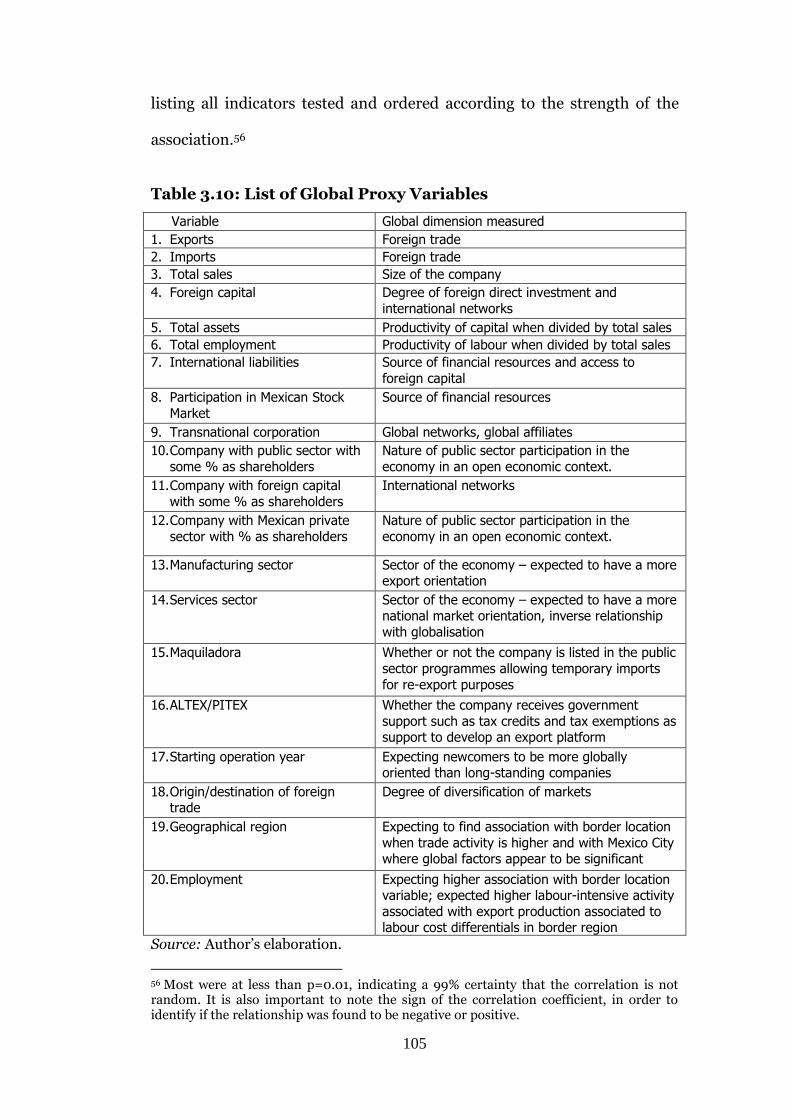
105
listing all indicators tested and ordered according to the strength of the
association.56
Table 3.10: List of Global Proxy Variables
Variable Global dimension measured
1. Exports Foreign trade
2. Imports Foreign trade
3. Total sales Size of the company
4. Foreign capital Degree of foreign direct investment and
international networks
5. Total assets Productivity of capital when divided by total sales
6. Total employment Productivity of labour when divided by total sales
7. International liabilities Source of financial resources and access to
foreign capital
8. Participation in Mexican Stock
Market
Source of financial resources
9. Transnational corporation Global networks, global affiliates
10. Company with public sector with
some % as shareholders
Nature of public sector participation in the
economy in an open economic context.
11. Company with foreign capital
with some % as shareholders
International networks
12. Company with Mexican private
sector with % as shareholders
Nature of public sector participation in the
economy in an open economic context.
13. Manufacturing sector Sector of the economy – expected to have a more export orientation
14. Services sector Sector of the economy – expected to have a more national market orientation, inverse relationship
with globalisation
15. Maquiladora Whether or not the company is listed in the public
sector programmes allowing temporary imports
for re-export purposes
16. ALTEX/PITEX Whether the company receives government
support such as tax credits and tax exemptions as support to develop an export platform
17. Starting operation year Expecting newcomers to be more globally oriented than long-standing companies
18. Origin/destination of foreign trade
Degree of diversification of markets
19. Geographical region Expecting to find association with border location
when trade activity is higher and with Mexico City where global factors appear to be significant
20. Employment Expecting higher association with border location variable; expected higher labour-intensive activity
associated with export production associated to labour cost differentials in border region
Source: Author’s elaboration.
56 Most were at less than p=0.01, indicating a 99% certainty that the correlation is not random. It is also important to note the sign of the correlation coefficient, in order to identify if the relationship was found to be negative or positive.
106
Linear Correlation Results
An intuitive expectation, subsequently confirmed by the statistical results,
is that exports are associated positively with the following proxy variables:
employment, imports, total sales, total assets, total international liabilities
and manufacturing industries (see Table 3.11). The first unexpected
finding is that the operation start-up year and exports variables are
negatively correlated, suggesting that the older the company, the more
likely it is to have a higher share of export activity as proportion of total
sales. This is contrary to what might have been expected and goes against
the idea that global companies arrived in Mexico under liberalisation to
take advantage of the new economic relations with the US and world
economy. Furthermore, this finding seems to challenge an earlier point
about firms in the 1980s not exporting and instead producing for the
national market under the ISI regime. (In fact, the two case studies
discussed in the following chapters suggest that in order to survive or take
advantage of export/import conditions during the 1980s, firms shifted to a
pro-export position). Finally, a high correlation between publicly owned
companies (state capital variable) and exports suggests that the six
publicly owned companies in the sample have high levels of export
activity.57
57 Apart from Petróleos Mexicanos, Mexico’s biggest company, the other publicly owned companies at this time were in more globalised sectors such as telecommunications and transport (for example, AeroMéxico, Mexicana and Satélites Mexicanos).
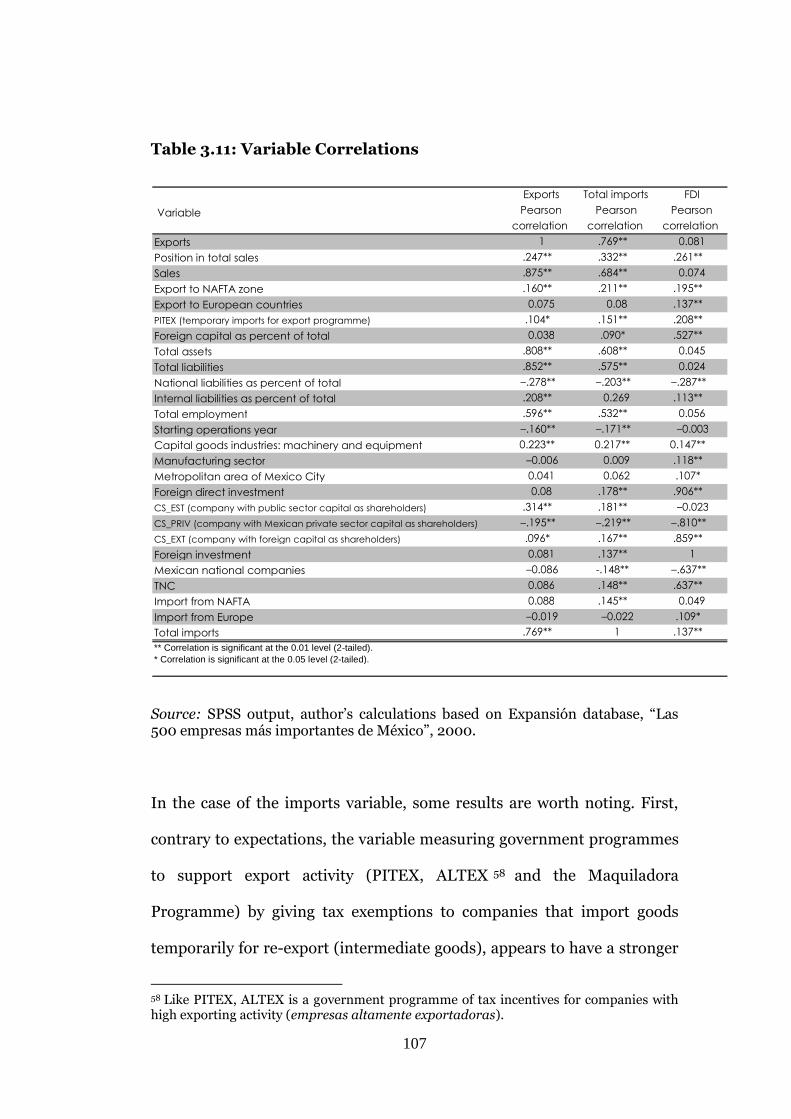
107
Table 3.11: Variable Correlations
Source: SPSS output, author’s calculations based on Expansión database, “Las 500 empresas más importantes de México”, 2000.
In the case of the imports variable, some results are worth noting. First,
contrary to expectations, the variable measuring government programmes
to support export activity (PITEX, ALTEX 58 and the Maquiladora
Programme) by giving tax exemptions to companies that import goods
temporarily for re-export (intermediate goods), appears to have a stronger
58 Like PITEX, ALTEX is a government programme of tax incentives for companies with high exporting activity (empresas altamente exportadoras).
Exports Total imports FDI
Variable Pearson Pearson Pearson correlation correlation correlation
Exports 1 .769** 0.081 Position in total sales .247** .332** .261** Sales .875** .684** 0.074 Export to NAFTA zone .160** .211** .195** Export to European countries 0.075 0.08 .137** PITEX (temporary imports for export programme) .104* .151** .208** Foreign capital as percent of total 0.038 .090* .527** Total assets .808** .608** 0.045 Total liabilities .852** .575** 0.024 National liabilities as percent of total –.278** –.203** –.287** Internal liabilities as percent of total .208** 0.269 .113** Total employment .596** .532** 0.056 Starting operations year –.160** –.171** –0.003 Capital goods industries: machinery and equipment 0.223** 0.217** 0.147** Manufacturing sector –0.006 0.009 .118** Metropolitan area of Mexico City 0.041 0.062 .107* Foreign direct investment 0.08 .178** .906** CS_EST (company with public sector capital as shareholders) .314** .181** –0.023 CS_PRIV (company with Mexican private sector capital as shareholders) –.195** –.219** –.810** CS_EXT (company with foreign capital as shareholders) .096* .167** .859** Foreign investment 0.081 .137** 1 Mexican national companies –0.086 -.148** –.637** TNC 0.086 .148** .637** Import from NAFTA 0.088 .145** 0.049 Import from Europe –0.019 –0.022 .109* Total imports .769** 1 .137** ** Correlation is significant at the 0.01 level (2-tailed). * Correlation is significant at the 0.05 level (2-tailed).
108
correlation to import than to export variables. This suggests companies
taking advantage of these programmes do not export all the resulting
products as the subsidy requires. This may be due to the complexity of the
PITEX quantification procedure or the lack of enforcement measures. In
the same way, the import variable is more strongly correlated to exports
within the NAFTA region. This could be explained by the fact that export
companies under maquiladora “business practices” still operate under
temporary import schemes assembling products in Mexico to be re-
exported to the US and Canadian markets. Second, the positive correlation
between imports and TNCs confirms the idea of global production circuits
where TNCs import a large number of products in the supply chain (often
intra-firm trade) from home-country affiliates and produce final products
bound for the Mexican market. This is confirmed by the exports variable
being uncorrelated to TNCs and the presence of foreign capital in Mexican
companies.
Introducing a spatial dimension to FDI flows, the analysis provides
statistical grounds to confirm that business location in Mexico City is
highly correlated with foreign capital flows, and that no other region is
statistically significant. This variable is strongly associated with the high
share of foreign investment for both TNCs and Mexican capital companies
(suggesting larger shares of foreign capital in both types of companies)
located in Mexico City, and furthermore confirms the leadership position
109
of Mexico City as having the largest number of TNCs with operations in the
country.59
PCA EMPIRICAL RESULTS
The objective for using PCA in the globality assessment exercise is to
extract the “global component” that can be used to build a company-
specific index of relative globality. Therefore, a company can rank highly
for a single global factor such as net exports or imports (i.e., CEMEX,
PEMEX), or as a TNC subsidiary with a high percentage of foreign capital
(i.e., Sears Roebuck), or be top of the list of sales (i.e., Carso Telecom), and
still get a low score due to the importance given by the model to a
combination of factors that express some degree of globality.
As shown in Appendix 2, the top ten companies according to the global
score are, in order: Ford Motor Company; Wal-Mart; Grupo México;
Grupo Modelo; DaimlerChrysler; Hewlett-Packard; Gruma Alimentos;
Hylsamex; Kimberly-Clark; and Grupo Minero. 60 The ten most global
companies according to factor analysis are companies that share the
following characteristics: eight out of ten are located in Mexico City; nine
have strong export activity (the only exception being Wal-Mart); nine have
received foreign investment, for which the main source is from the US; six
59 This finding runs in parallel with disaggregated trends by state 1994–2000, which confirm that Mexico City (DF) has consistently been the main recipient of FDI. According to official data from the Dirección General de Inversión Extranjera Secretaría de Economía, FDI into Mexico between 1994 and 2000 was on average US$11.4 billion, and the average of that amount going to Mexico City (DF) was 54.8%. Total FDI in 2006 was US$20.05 billion, of which 49.8% went into Mexico City (Secretaría de Economía 2008). 60 For the full list of the top 100 global companies see Appendices 2 and 3.
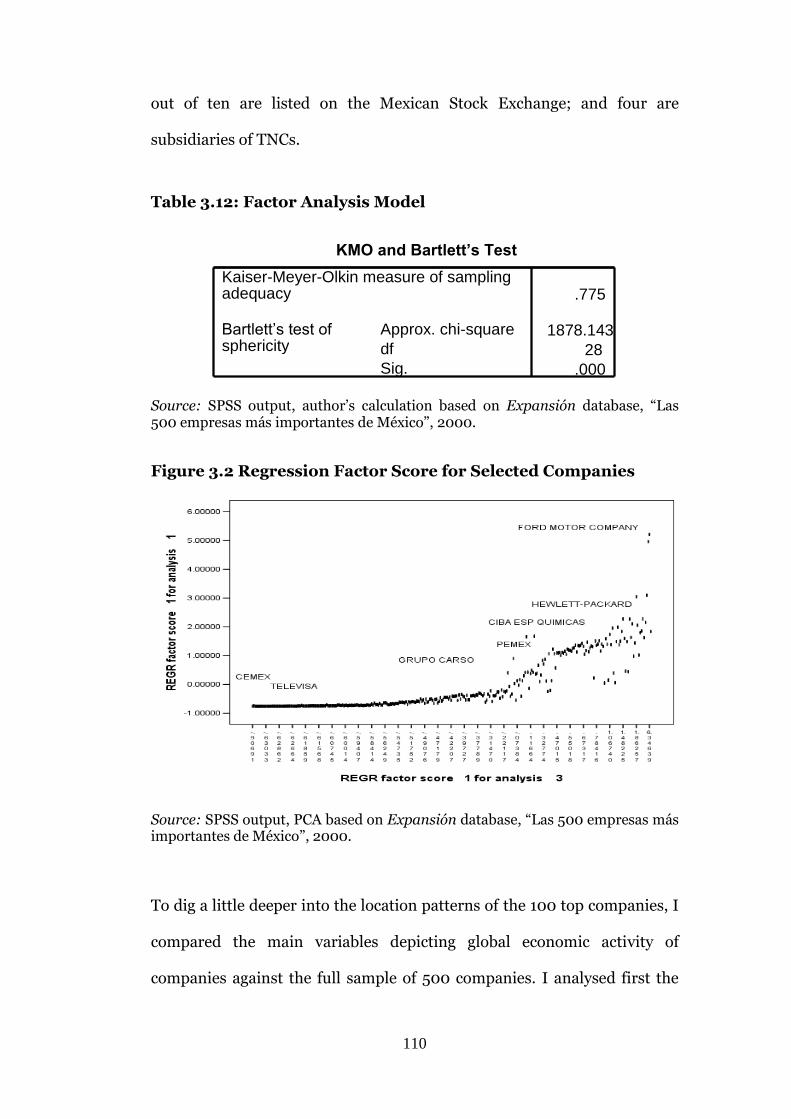
110
out of ten are listed on the Mexican Stock Exchange; and four are
subsidiaries of TNCs.
Table 3.12: Factor Analysis Model
Source: SPSS output, author’s calculation based on Expansión database, “Las 500 empresas más importantes de México”, 2000.
Figure 3.2 Regression Factor Score for Selected Companies
Source: SPSS output, PCA based on Expansión database, “Las 500 empresas más importantes de México”, 2000.
To dig a little deeper into the location patterns of the 100 top companies, I
compared the main variables depicting global economic activity of
companies against the full sample of 500 companies. I analysed first the
KMO and Bartlett’s Test
.775
1878.143
28
.000
Kaiser-Meyer-Olkin measure of sampling adequacy
Approx. chi-square
df
Sig.
Bartlett’s test of sphericity
111
particularities of companies according to what scholars of globalisation
would identify as key variables: (i) sectors of the economy; (ii) starting
operations year; (iii) foreign trade, i.e., exports and imports as a
percentage of total sales; (iv) financial activity, i.e., foreign capital as a
percentage of total shares, international liabilities as a percentage of total
liabilities, and participation in the Mexican Stock Market as percentage of
total social capital (TNCs); (v) total employment and productivity
measures as sales divided by total number of employees; and (vi) location.
The results of this analysis show:
(i) According to the analysis, manufacturing companies are those with the
highest global scores. Comparing the samples, there is an increase in the
proportion of manufacturing companies in the top 100 sample, from 56%
to 79%, and a consequent reduction in the percentage of companies in the
service sector, from 31% to 19%. Particular over-representation in the top
100 sample is seen in the following manufacturing sectors by those with
higher global scores: automotive industry, consumer electronics, office and
computing machinery, and chemical and petrochemical. This confirms
some studies which point to these sectors as the most globalised
manufacturing sectors (OECD 1994b; 1996a). The reduction in the number
of service sector companies is logical if we consider that the sector, in
general, has a national market scope. Also, most of the trade agreements
do not consider the provision of services as part of the trade negotiations
(at least not the ones signed by Mexico until 2000). However, following
Sassen’s ideas, the increase in global services is seen as an important
component of the global production network. Therefore it is worth noting
112
that among the top 100 global companies in 2000 there are 19 service
sector companies, among them companies in the transport sector,
professional services, hotels and restaurants, and communications, most
of the sectors correctly pointed to by Sassen. 61 A reduction in the
representation of sectors between the two samples reflects these least
globally oriented activities, which are those that aim to serve the national
market, such as food, beverages and tobacco; construction; wood and
wood product industries; and real estate. The last three do not appear in
the top 100 global sample (see Table 3.13).
(ii) One might expect to find those companies with higher global scores
among those that started operations after liberalisation of trade. It would
therefore be expected that the average starting operations year would be
significantly higher – closer to 2000 – for the top 100 global companies
than the average for the Top 500 Companies list for the same year. One
would expect to see “newcomers” having a more global character than
those “old established” companies in Mexico. Yet according to PCA results,
the average year for both samples is the same: 1972. This can be
interpreted to mean that after the liberalisation of the economy there was
not a massive influx of “global companies” arriving in Mexico. Most
important is the conclusion that the old established companies operating
under a closed regime did not disappear, or collapse, with the
61 Sassen points to the financial sector as crucial to globalisation of the economy, and commonly refers to insurance and financial services as the leading sectors in global cities. The 2000 database does not include financial sector companies, but the rest of the industries in the “global services sector” to which Sassen makes reference appear in the top 100 with high global scores.
113
liberalisation of the economy. What these data suggest is that large firms
have adapted to economic restructuring.
(iii) One might expect to have in the subsample of the most global
companies a higher number of companies with imports and exports, and a
higher share of this foreign trade activity as a percentage of total sales. The
data results confirm both cases. First, the percentage of exporting
companies in the Expansión 500 is 56.4% compared with 86% in the top
100 companies, and import figures marginally increase between the
Expansión 500 and top global 100 from 63.2% to 66% (see Table 3.14).
However important these variations are, among the top 100 companies
exports are shown to be higher than imports, thereby characterising
companies in this sample as export-oriented. These export companies have
on average more than double the export activity (56.6% of total sales) of
the Top 500 (21.6%).
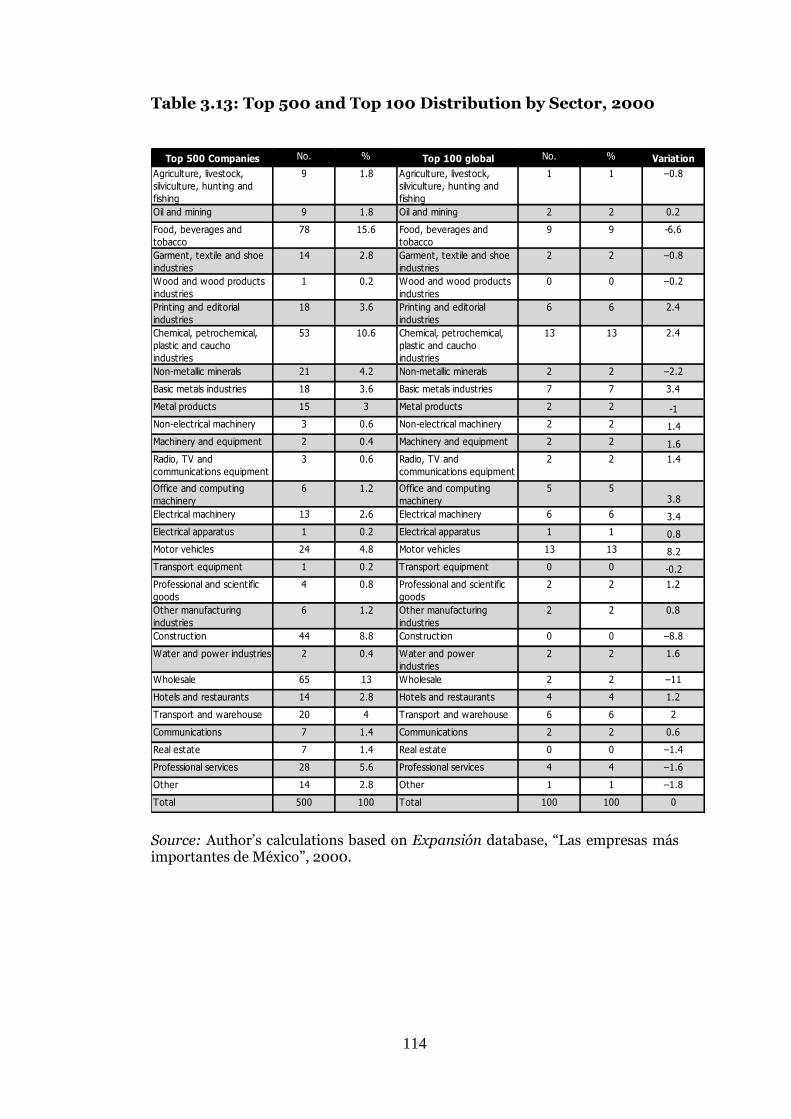
114
Table 3.13: Top 500 and Top 100 Distribution by Sector, 2000
Top 500 Companies No. % Top 100 global No. % Variation
Agriculture, livestock,
silviculture, hunting and
fishing
9 1.8 Agriculture, livestock,
silviculture, hunting and
fishing
1 1 –0.8
Oil and mining 9 1.8 Oil and mining 2 2 0.2
Food, beverages and
tobacco
78 15.6 Food, beverages and
tobacco
9 9 -6.6
Garment, textile and shoe
industries
14 2.8 Garment, textile and shoe
industries
2 2 –0.8
Wood and wood products
industries
1 0.2 Wood and wood products
industries
0 0 –0.2
Printing and editorial
industries
18 3.6 Printing and editorial
industries
6 6 2.4
Chemical, petrochemical,
plastic and caucho
industries
53 10.6 Chemical, petrochemical,
plastic and caucho
industries
13 13 2.4
Non-metallic minerals 21 4.2 Non-metallic minerals 2 2 –2.2
Basic metals industries 18 3.6 Basic metals industries 7 7 3.4
Metal products 15 3 Metal products 2 2 -1
Non-electrical machinery 3 0.6 Non-electrical machinery 2 2 1.4
Machinery and equipment 2 0.4 Machinery and equipment 2 2 1.6
Radio, TV and
communications equipment
3 0.6 Radio, TV and
communications equipment
2 2 1.4
Office and computing
machinery
6 1.2 Office and computing
machinery
5 53.8
Electrical machinery 13 2.6 Electrical machinery 6 6 3.4
Electrical apparatus 1 0.2 Electrical apparatus 1 1 0.8
Motor vehicles 24 4.8 Motor vehicles 13 13 8.2
Transport equipment 1 0.2 Transport equipment 0 0 -0.2
Professional and scientific
goods
4 0.8 Professional and scientific
goods
2 2 1.2
Other manufacturing
industries
6 1.2 Other manufacturing
industries
2 2 0.8
Construction 44 8.8 Construction 0 0 –8.8
Water and power industries 2 0.4 Water and power
industries
2 2 1.6
Wholesale 65 13 Wholesale 2 2 –11
Hotels and restaurants 14 2.8 Hotels and restaurants 4 4 1.2
Transport and warehouse 20 4 Transport and warehouse 6 6 2
Communications 7 1.4 Communications 2 2 0.6
Real estate 7 1.4 Real estate 0 0 –1.4
Professional services 28 5.6 Professional services 4 4 –1.6
Other 14 2.8 Other 1 1 –1.8
Total 500 100 Total 100 100 0
Source: Author’s calculations based on Expansión database, “Las empresas más importantes de México”, 2000.
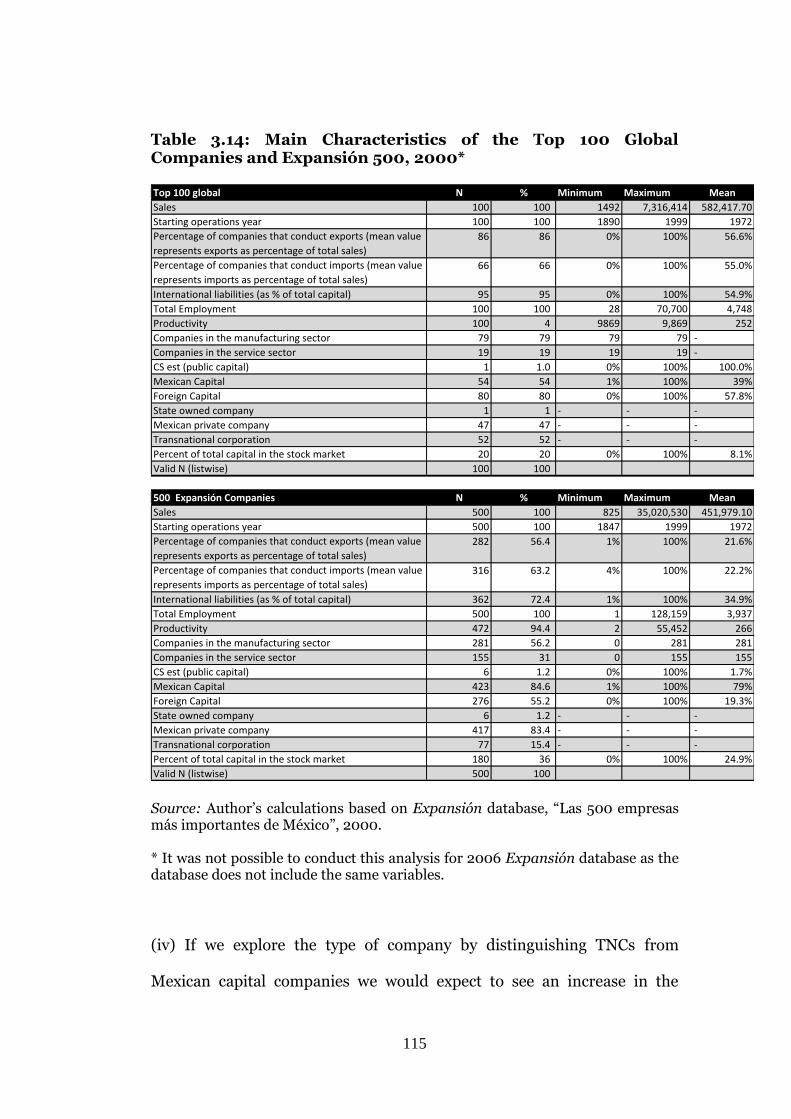
115
Table 3.14: Main Characteristics of the Top 100 Global Companies and Expansión 500, 2000* Top 100 global N % Minimum Maximum Mean
Sales 100 100 1492 7,316,414 582,417.70
Starting operations year 100 100 1890 1999 1972
Percentage of companies that conduct exports (mean value
represents exports as percentage of total sales)
86 86 0% 100% 56.6%
Percentage of companies that conduct imports (mean value
represents imports as percentage of total sales)
66 66 0% 100% 55.0%
International liabilities (as % of total capital) 95 95 0% 100% 54.9%
Total Employment 100 100 28 70,700 4,748
Productivity 100 4 9869 9,869 252
Companies in the manufacturing sector 79 79 79 79 -
Companies in the service sector 19 19 19 19 -
CS est (public capital) 1 1.0 0% 100% 100.0%
Mexican Capital 54 54 1% 100% 39%
Foreign Capital 80 80 0% 100% 57.8%
State owned company 1 1 - - -
Mexican private company 47 47 - - -
Transnational corporation 52 52 - - -
Percent of total capital in the stock market 20 20 0% 100% 8.1%
Valid N (listwise) 100 100
500 Expansión Companies N % Minimum Maximum Mean
Sales 500 100 825 35,020,530 451,979.10
Starting operations year 500 100 1847 1999 1972
Percentage of companies that conduct exports (mean value
represents exports as percentage of total sales)
282 56.4 1% 100% 21.6%
Percentage of companies that conduct imports (mean value
represents imports as percentage of total sales)
316 63.2 4% 100% 22.2%
International liabilities (as % of total capital) 362 72.4 1% 100% 34.9%
Total Employment 500 100 1 128,159 3,937
Productivity 472 94.4 2 55,452 266
Companies in the manufacturing sector 281 56.2 0 281 281
Companies in the service sector 155 31 0 155 155
CS est (public capital) 6 1.2 0% 100% 1.7%
Mexican Capital 423 84.6 1% 100% 79%
Foreign Capital 276 55.2 0% 100% 19.3%
State owned company 6 1.2 - - -
Mexican private company 417 83.4 - - -
Transnational corporation 77 15.4 - - -
Percent of total capital in the stock market 180 36 0% 100% 24.9%
Valid N (listwise) 500 100
Source: Author’s calculations based on Expansión database, “Las 500 empresas más importantes de México”, 2000. * It was not possible to conduct this analysis for 2006 Expansión database as the database does not include the same variables.
(iv) If we explore the type of company by distinguishing TNCs from
Mexican capital companies we would expect to see an increase in the
116
percentage of TNCs in the top 100, as many scholars point to the business
practices of TNCs as the main force behind the globalisation of the
economy. These companies are usually responsible for the largest amounts
of foreign trade (much of it intra-trade among affiliates) and the largest
amounts of foreign investment. Results confirm that the proportion of
TNCs increases from 15.4% to 52% between the Top 500 and Top 100,
confirming that TNCs are influential economic agents (or “carriers”) of the
globalisation process. But also important is the fact that 80% of the top
global companies have at least some degree of participation of foreign
capital, and this would include the 52% of TNCs and nearly 30% of
Mexican companies that have on average 57% of foreign capital, almost
three times the average percentage for the 276 companies within the Top
500 sample with some degree of foreign capital.
Data on the financial practices of the top 100 companies in 2000 show that
a large number receive financial support from institutions outside of
Mexico. It was a surprise to see that 316 companies (out of 500 in 2000)
had international liabilities, and also worth noting was the figure for
international liabilities as a percentage of total liabilities for 362 of the Top
500, at 34.9%, underlining the global character not only of the TNCs but of
the Mexican companies too. Within these data we can note that for the top
100 companies, 95 have international liabilities, representing an average of
54.9% of total liabilities. These data seem to confirm that integration
which goes beyond “pure trade and investment” will extend to further
transnational business practices, which also confirms the results related to
the participation of the Top 500 in the Mexican Stock Exchange.
117
Due to the “global” nature of the stock exchange one would expect to see a
larger number of companies in the Top 100 vis-à-vis the Top 500 list to be
publically-quoted companies with a higher share of capital in the Stock
Exchange as a percentage of total capital. The data indicate otherwise: 36%
of companies listed in the Stock Market in 2000 in the Top 500 fell to 20%
in the Top 100. Moreover, their share in the stock market in terms of total
capital was also smaller; the average share of capital for the 180 top 500
companies listed on the Mexican Stock Exchange was 24.9%, whereas for
the 20 top 100 companies the share was only 8.1%. The result is related to
the previous point on international liabilities – if a company gains access
to finance from abroad, it is rational for that company to take up this
option.
(v) Comparing the location of the top 100 global companies in 2000 to the
top 100 in 2006 reveals a higher dispersion of companies in 2000; there
were 13 states with companies in the top 100 list in that year, against nine
states in 2006. Mexico City is the location with the largest number of top
100 global companies, with 61 in 2000 and 73 in 2006 (see Table 3.15).
The border states that appeared on the list with companies among the top
100 in 2000 are: Baja California (4), Chihuahua (2), Nuevo León (14),
Sonora (1), and Tamaulipas (1). The 2006 top 100 global list showed a
reduction in the number of the states represented, the number of
companies located in the border states (from 23 to nine) and the number
of border states represented (from five to three: Nuevo León (6),
Chihuahua (2) and Sonora (1)).
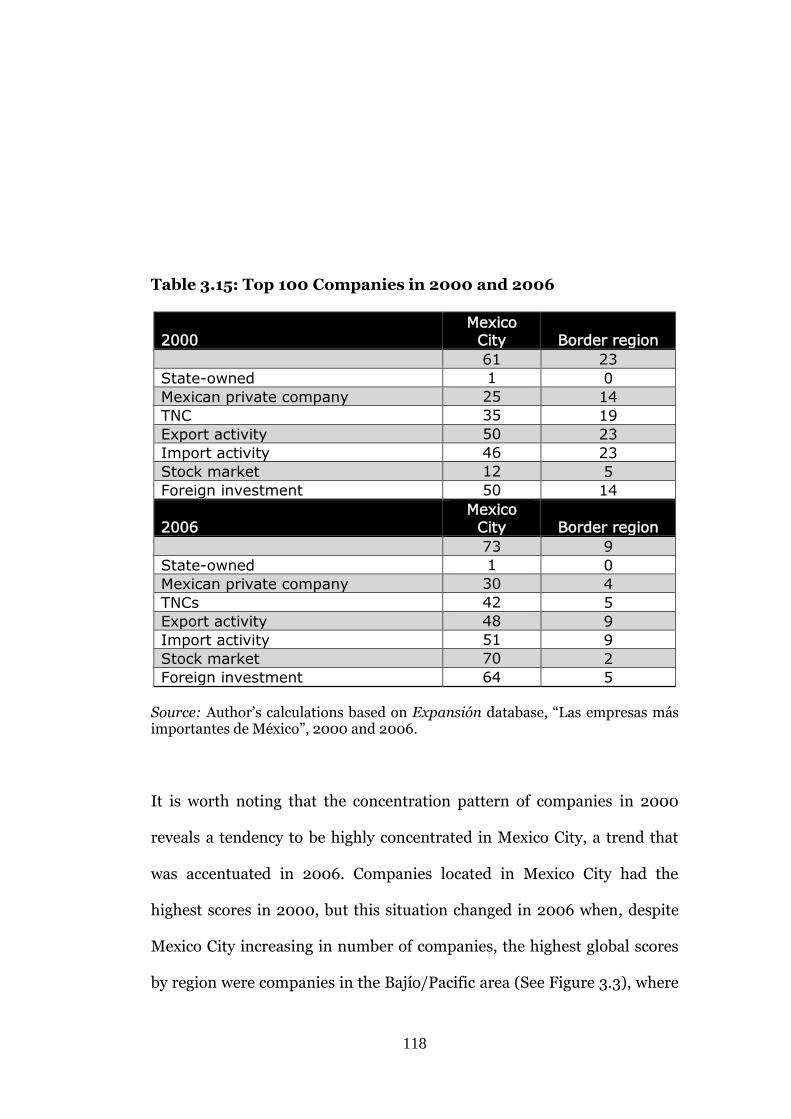
118
Table 3.15: Top 100 Companies in 2000 and 2006
2000 Mexico
City Border region
61 23
State-owned 1 0
Mexican private company 25 14
TNC 35 19
Export activity 50 23
Import activity 46 23
Stock market 12 5
Foreign investment 50 14
2006 Mexico
City Border region
73 9
State-owned 1 0
Mexican private company 30 4
TNCs 42 5
Export activity 48 9
Import activity 51 9
Stock market 70 2
Foreign investment 64 5
Source: Author’s calculations based on Expansión database, “Las empresas más importantes de México”, 2000 and 2006.
It is worth noting that the concentration pattern of companies in 2000
reveals a tendency to be highly concentrated in Mexico City, a trend that
was accentuated in 2006. Companies located in Mexico City had the
highest scores in 2000, but this situation changed in 2006 when, despite
Mexico City increasing in number of companies, the highest global scores
by region were companies in the Bajío/Pacific area (See Figure 3.3), where
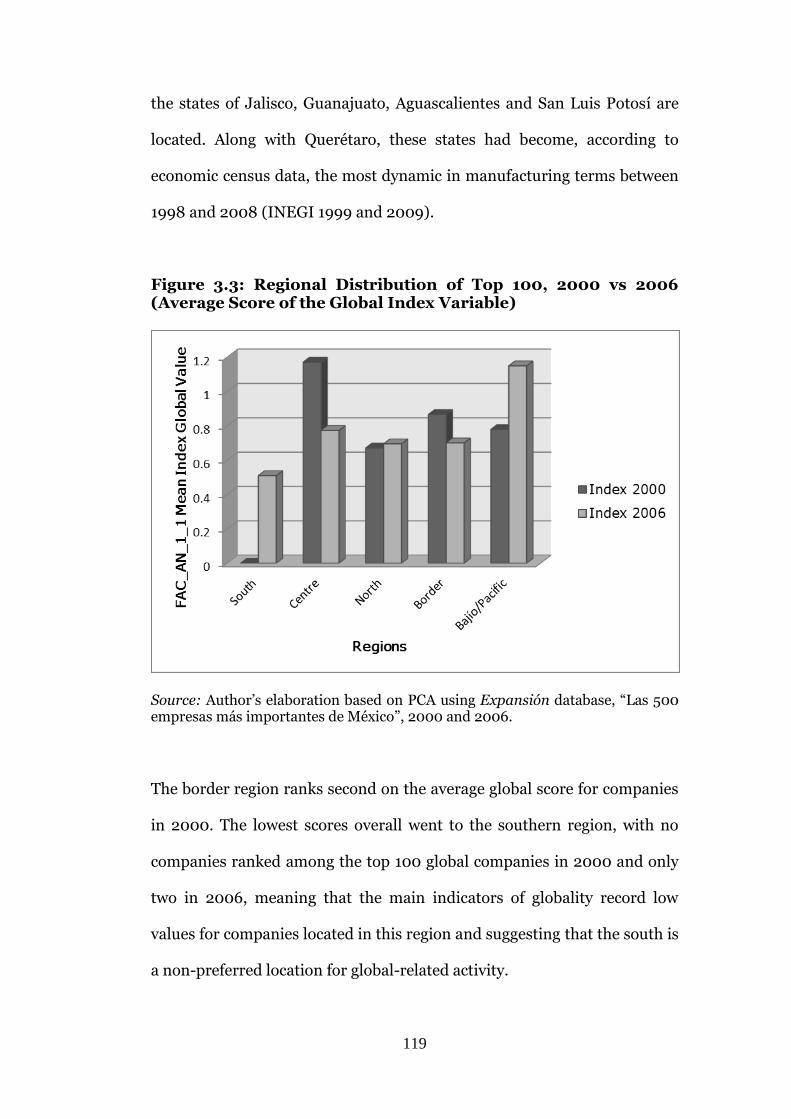
119
the states of Jalisco, Guanajuato, Aguascalientes and San Luis Potosí are
located. Along with Querétaro, these states had become, according to
economic census data, the most dynamic in manufacturing terms between
1998 and 2008 (INEGI 1999 and 2009).
Figure 3.3: Regional Distribution of Top 100, 2000 vs 2006 (Average Score of the Global Index Variable)
Source: Author’s elaboration based on PCA using Expansión database, “Las 500 empresas más importantes de México”, 2000 and 2006.
The border region ranks second on the average global score for companies
in 2000. The lowest scores overall went to the southern region, with no
companies ranked among the top 100 global companies in 2000 and only
two in 2006, meaning that the main indicators of globality record low
values for companies located in this region and suggesting that the south is
a non-preferred location for global-related activity.
120
Focusing on manufacturing specifically, one could argue that some degree
of industrial decentralisation has taken place over the 20 years studied
here. Among the top 100 global companies, for example, employment
trends follow a pattern suggested by the international division of labour
hypothesis – i.e., that global companies look for less developed regions to
take advantage of the low labour costs that in an appropriate business
environment account for an important part of total production costs. The
results are consistent comparing the total number of employees that on
average are in companies located in Mexico City against companies in the
border states within the top 100. It was found that companies in the
border states have a higher number of employees (4,784) on average in
comparison to companies in Mexico City (3,937). This suggests that
companies located in border states have on average more labour-intensive
production, with lower levels of labour productivity compared to those in
Mexico City.62
But is this decentralisation per se? Are location decisions made to take
advantage of less expensive, less congested locations and more labour-
intensive production? The “migration to the border” hypothesis for export
companies seems to be only partially supported, as most of the companies
with international trade activity are still located far from the border and
mostly within the central region. And even though it is true that the border
region hosts a good number of the most global companies, the score in
terms of the Globality Index is far lower than for the central part of the
62 This productivity is measured by dividing total sales by total number of employees. The figure is US$251,990 per employee for companies in the border states against US$296,060 for companies in Mexico City.
121
country and in particular Mexico City. The border region does indicate a
strong correlation with imports and exports, and other trade-related
variables. For the top export companies, the higher their export ranking,
the more likely they are to be located in a border state.
CONCLUSION
It is possible to draw an initial set of conclusions concerning the
transformation of the Mexican economy between 1980 and 2000. The data
show the leading economic role for Mexico City and the border but also
highlight differences in structure and timing of change between the two.
The drift to the border began before global drivers were present – that is,
in the early 1980s – and therefore suggests that other forces, possibly
government programmes to support maquilas, were important to bring
change. The analysis also reveals that despite liberalisation of trade and
new manufacturing centres that made the border more attractive for
export/import-oriented companies, especially those with the US as the
final destination for manufacturing products, Mexico City remains the
nation’s major manufacturing centre. Companies located in Mexico City
record high scores on the Globality Index.
The analysis provided in this chapter offers a critical reflection on the
hypothesis prompted by the work of Paul Krugman. It should be clear that
transport costs and access to markets do not determine alone, or even in
the main, the regional shape of the national economy. Missed by Krugman
is the extent to which the changing structure and geographical location of
economic activity in the 1980s, which he attributes to economic “opening”,
122
had already begun in a de facto sense. The data also suggest that when
reform did take place, long-established companies were able to adapt to a
shift in market focus from national to global. Companies located in border
states in 2000 were more likely to be exporters, but contrary to Krugman’s
ideas, they were not newly established companies. Indeed, some of the
oldest established companies in Mexico were among the top exporters by
2000 and 2006, and more remarkable is that some were not located in the
border region but in Mexico City.
The data presented in this chapter confirm that Mexico City’s dominant
role in manufacturing has decreased in relative terms, but the city has
maintained its position as the largest manufacturing centre in terms of
employment and output. Although the Top 500 database methodology
changed between 2000 and 2006, the data show the preference of
financial services to locate in Mexico City, displacing manufacturing as the
driver of the city economy, and that Mexico City is the preferred location
for TNC headquarters. Thus, Mexico City is the preferred location for
global companies overall, and especially for those engaged in more globally
oriented activities, following the trends described in Sassen’s global cities
hypothesis.
Finally, a comment on method. The main reason behind the decision to
conduct PCA tests was to produce empirical evidence using a strong
statistical tool to create parameters, not only to allow descriptive analysis
but also to analyse the processes involved. The PCA also enabled
interaction within the trade liberalisation process, which involves a large
123
number of economic factors and economic agents. The PCA was
constructed to include most of the variables associated with the economic
liberalisation process, and was used to identify underlying components
that can at least partially explain why the indicator values differ between
companies. A result of the PCA was the creation of a single index which
assigns a specific value to each firm representing global status in relation
to all the other companies in the sample. The statistical significance of the
model was high (.775), and the results were consistent when contrasted
with individual cases and with national trends. The analysis was presented
with a special focus on the top 100 companies in the ranking in order to
focus on those companies that access foreign markets – i.e., exports
associated with companies with foreign capital and with access to foreign
financial services, mostly TNCs. It is important to remember that the PCA
is primarily concerned with describing the “variance” shared by elements
based on three or more variables (i.e., export, imports, foreign investment,
etc.); therefore, some companies with only one high value in exports,
contrary to expectations, did not necessarily received a high score. This
was the case for companies such as PEMEX and CEMEX.
124
Chapter Four: Global and Local Actors, Economic Restructuring and Location Decisions: The Case of the Automotive Industry
OVERVIEW
This and the next chapter present case studies of the automotive and
consumer electronics sectors. The aim of these chapters is to analyse the
effects on Mexico’s regional geography brought about by the trade
liberalisation of the Mexican economy, which I argue to be the leading
factor explaining industrial restructuring in Mexico City. I am interested
especially in companies that have been affected by economic liberalisation
but have managed to compete effectively in world markets. According to
the Globality Index, the manufacturing metal products sector (ISIC 38)
has the highest global scores, and within that sector automotive and
consumer electronics are the industries (subsectors) that rank the highest.
Therefore these two subsectors were chosen as case studies to help narrow
down the analysis hitherto conducted at the national scale, and to consider
the industrial sector and company level. The aim is to identify whether the
de-concentration of Mexico City’s manufacturing sector is a consequence
of trade liberalisation, the main hypothesis of the research, or is the result
of different economic factors and economic trends other than trade
liberalisation alone, the alternative hypothesis as outlined in Chapter One.
More specifically, in looking at the automotive sector I want to test
whether the trade liberalisation proposed by Krugman and Livas as the
125
explanation for a “migration to the north” is robust now that data are
available to unpack the location decisions of the automotive assembly
TNCs in Mexico.
THE AUTOMOTIVE INDUSTRY: A CASE FOR GLOBALISATION
The automotive sector has been one of the most dynamic sectors
worldwide for growth in production, trade and investment, and has been
one of the manufacturing sectors with the highest rates of economic
growth in Mexico from the period of liberalisation of trade at the end of the
1980s (Schlie and Yip 2000). This period of growth is the latest phase in a
century-long transition from manual assembly plant production to the
manufacture of automobiles according to a single design for all markets,
the so-called “world car”, with minor local adaptations and operating with
assembly-line methods associated with Fordism. This pattern was first
applied by US companies that expanded internationally through direct car
exporting and then through FDI, mainly in Europe and later in Latin
America (Van Biesebroeck 2003). This export strategy was also adopted by
Japanese firms in the initial stage of their international expansion
(Mortimore 2000).
The main forces shaping patterns of production, trade and sourcing in the
automotive industry are related to technological evolution and new
approaches to organisation, including “Toyotism” or “lean production”
(Yasuhiro 1993). Technological and organisational innovations facilitate
production flexibility and enable a wider range of products to be produced
126
efficiently and rapidly to meet new consumer, energy, safety and
environmental demands. The new production methods are based on low
inventories, known as “just-in-time” inventories (Sakakibara et al. 1997;
Sturgeon and Lester 2004), which allow for quality control, flexibility and
rapid response to changing consumer preferences. These methods have
fostered the introduction of new models of production differentiation and
contribute toward changes to the geographical distribution of operations
as producers are able to locate production in major markets and respond
more efficiently to changing consumer tastes.
Another related development is the externalisation of the previous internal
production of goods and services by assemblers, a process known as
“vertical disintegration”, driving further changes in industry structure and
new patterns of investment and production (Holmes 1999). The industry is
characterised by extensive foreign investment and international
alliances,63 with high levels of intra-firm and intra-industry trade and
international sourcing. High levels of trade in components and parts to
supply foreign affiliates and final assembly plants are a notable feature of
the industry. These patterns may, however, change as producers of parts
and components establish extensive production facilities abroad in order
to supply more parts locally with just-in-time delivery (Ruigrok 1991).
63 International alliances include Mercedes-Benz and BMW in the US, Daihatsu and Toyota, Isuzu and GM, and Rover and initially Honda, then from the end of 1993 Rover and BMW.
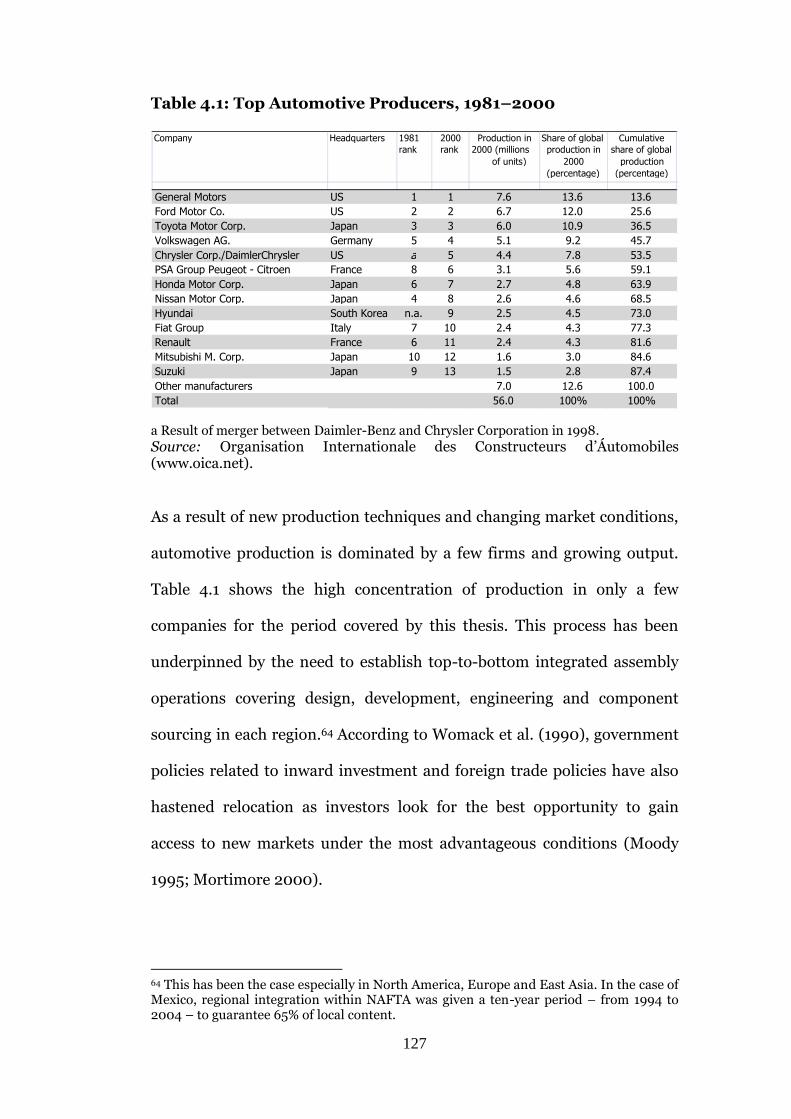
127
Table 4.1: Top Automotive Producers, 1981–2000
a Result of merger between Daimler-Benz and Chrysler Corporation in 1998.
Source: Organisation Internationale des Constructeurs d’Áutomobiles (www.oica.net). As a result of new production techniques and changing market conditions,
automotive production is dominated by a few firms and growing output.
Table 4.1 shows the high concentration of production in only a few
companies for the period covered by this thesis. This process has been
underpinned by the need to establish top-to-bottom integrated assembly
operations covering design, development, engineering and component
sourcing in each region.64 According to Womack et al. (1990), government
policies related to inward investment and foreign trade policies have also
hastened relocation as investors look for the best opportunity to gain
access to new markets under the most advantageous conditions (Moody
1995; Mortimore 2000).
64 This has been the case especially in North America, Europe and East Asia. In the case of Mexico, regional integration within NAFTA was given a ten-year period – from 1994 to 2004 – to guarantee 65% of local content.
Company Headquarters 1981 rank
2000 rank
Production in 2000 (millions
of units)
Share of global production in
2000 (percentage)
Cumulative share of global
production (percentage)
General Motors US 1 1 7.6 13.6 13.6 Ford Motor Co. US 2 2 6.7 12.0 25.6 Toyota Motor Corp. Japan 3 3 6.0 10.9 36.5 Volkswagen AG. Germany 5 4 5.1 9.2 45.7 Chrysler Corp./DaimlerChrysler US a 5 4.4 7.8 53.5 PSA Group Peugeot - Citroen France 8 6 3.1 5.6 59.1 Honda Motor Corp. Japan 6 7 2.7 4.8 63.9 Nissan Motor Corp. Japan 4 8 2.6 4.6 68.5 Hyundai South Korea n.a. 9 2.5 4.5 73.0 Fiat Group Italy 7 10 2.4 4.3 77.3 Renault France 6 11 2.4 4.3 81.6 Mitsubishi M. Corp. Japan 10 12 1.6 3.0 84.6 Suzuki Japan 9 13 1.5 2.8 87.4 Other manufacturers 7.0 12.6 100.0 Total 56.0 100% 100%
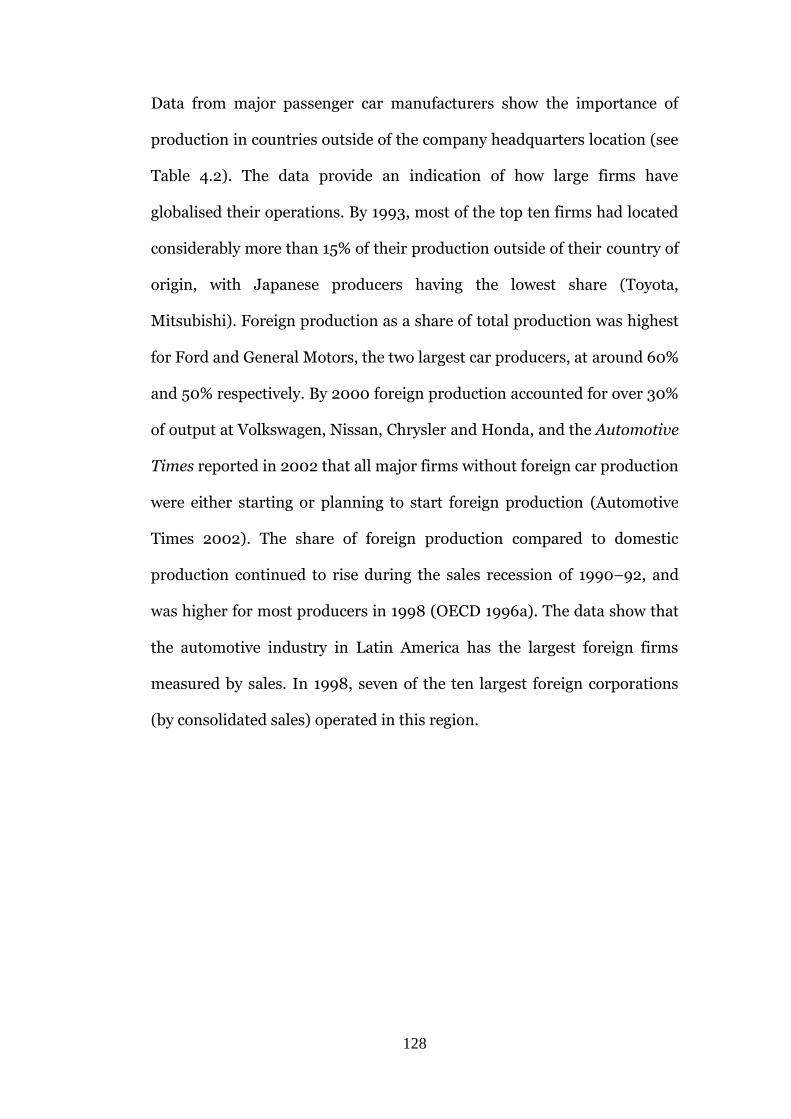
128
Data from major passenger car manufacturers show the importance of
production in countries outside of the company headquarters location (see
Table 4.2). The data provide an indication of how large firms have
globalised their operations. By 1993, most of the top ten firms had located
considerably more than 15% of their production outside of their country of
origin, with Japanese producers having the lowest share (Toyota,
Mitsubishi). Foreign production as a share of total production was highest
for Ford and General Motors, the two largest car producers, at around 60%
and 50% respectively. By 2000 foreign production accounted for over 30%
of output at Volkswagen, Nissan, Chrysler and Honda, and the Automotive
Times reported in 2002 that all major firms without foreign car production
were either starting or planning to start foreign production (Automotive
Times 2002). The share of foreign production compared to domestic
production continued to rise during the sales recession of 1990–92, and
was higher for most producers in 1998 (OECD 1996a). The data show that
the automotive industry in Latin America has the largest foreign firms
measured by sales. In 1998, seven of the ten largest foreign corporations
(by consolidated sales) operated in this region.
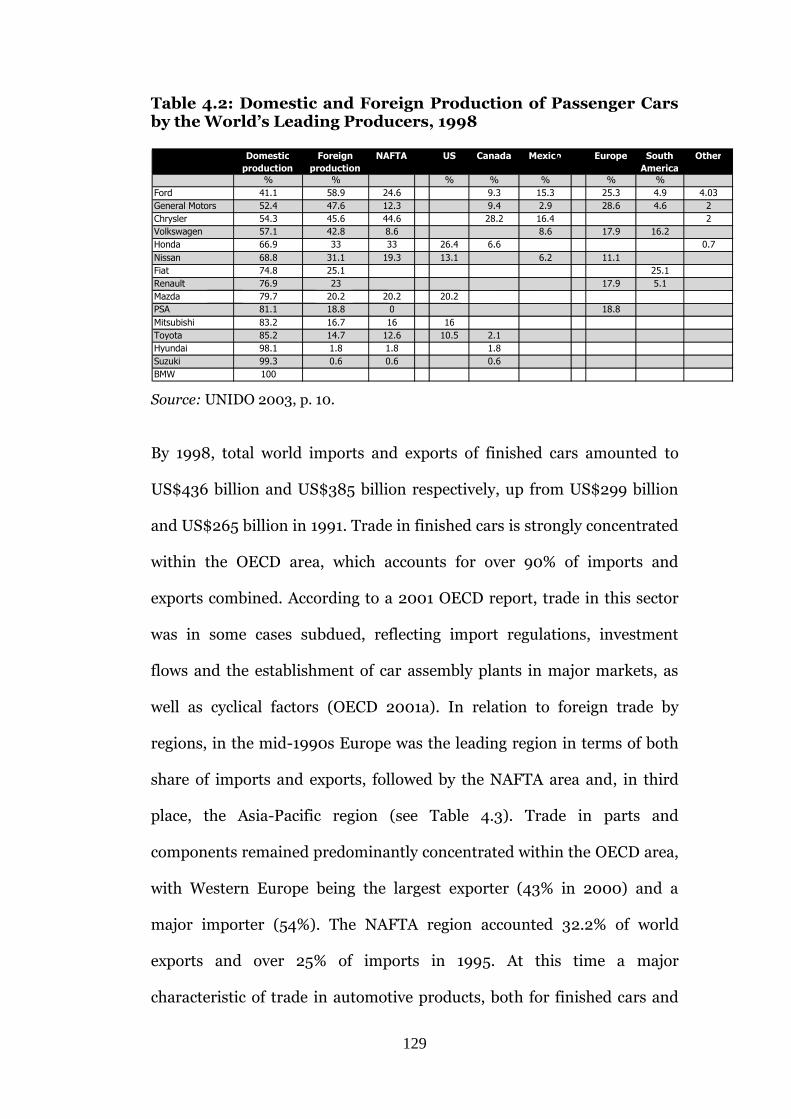
129
Table 4.2: Domestic and Foreign Production of Passenger Cars by the World’s Leading Producers, 1998
Source: UNIDO 2003, p. 10.
By 1998, total world imports and exports of finished cars amounted to
US$436 billion and US$385 billion respectively, up from US$299 billion
and US$265 billion in 1991. Trade in finished cars is strongly concentrated
within the OECD area, which accounts for over 90% of imports and
exports combined. According to a 2001 OECD report, trade in this sector
was in some cases subdued, reflecting import regulations, investment
flows and the establishment of car assembly plants in major markets, as
well as cyclical factors (OECD 2001a). In relation to foreign trade by
regions, in the mid-1990s Europe was the leading region in terms of both
share of imports and exports, followed by the NAFTA area and, in third
place, the Asia-Pacific region (see Table 4.3). Trade in parts and
components remained predominantly concentrated within the OECD area,
with Western Europe being the largest exporter (43% in 2000) and a
major importer (54%). The NAFTA region accounted 32.2% of world
exports and over 25% of imports in 1995. At this time a major
characteristic of trade in automotive products, both for finished cars and
Columna1 Domestic
production Foreign
production NAFTA C
ol US Canada Mexico Columna4 Europe South
America Other
% % % % % % % Ford 41.1 58.9 24.6 9.3 15.3 25.3 4.9 4.03 General Motors 52.4 47.6 12.3 9.4 2.9 28.6 4.6 2 Chrysler 54.3 45.6 44.6 28.2 16.4 2 Volkswagen 57.1 42.8 8.6 8.6 17.9 16.2 Honda 66.9 33 33 26.4 6.6 0.7 Nissan 68.8 31.1 19.3 13.1 6.2 11.1 Fiat 74.8 25.1 25.1 Renault 76.9 23 17.9 5.1 Mazda 79.7 20.2 20.2 20.2 PSA 81.1 18.8 0 18.8 Mitsubishi 83.2 16.7 16 16 Toyota 85.2 14.7 12.6 10.5 2.1 Hyundai 98.1 1.8 1.8 1.8 Suzuki 99.3 0.6 0.6 0.6 BMW 100
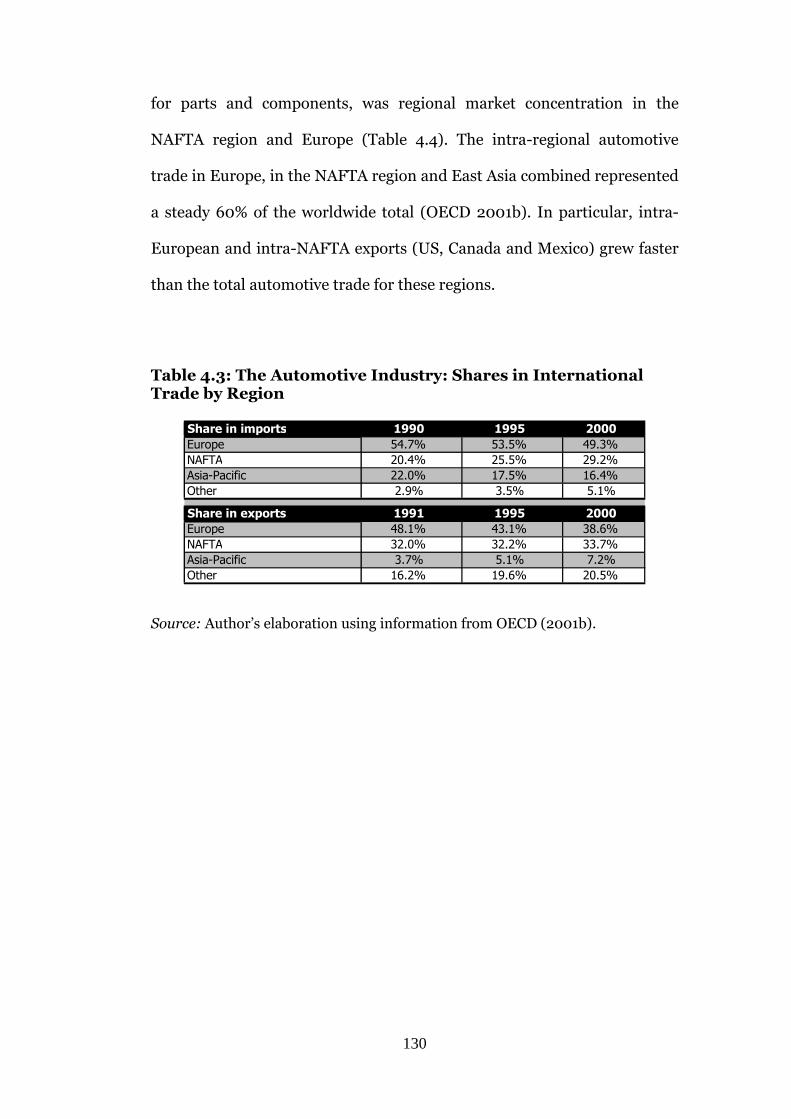
130
for parts and components, was regional market concentration in the
NAFTA region and Europe (Table 4.4). The intra-regional automotive
trade in Europe, in the NAFTA region and East Asia combined represented
a steady 60% of the worldwide total (OECD 2001b). In particular, intra-
European and intra-NAFTA exports (US, Canada and Mexico) grew faster
than the total automotive trade for these regions.
Table 4.3: The Automotive Industry: Shares in International Trade by Region
Source: Author’s elaboration using information from OECD (2001b).
Share in imports 1990 1995 2000 Europe 54.7% 53.5% 49.3% NAFTA 20.4% 25.5% 29.2% Asia-Pacific 22.0% 17.5% 16.4% Other 2.9% 3.5% 5.1%
Share in exports 1991 1995 2000 Europe 48.1% 43.1% 38.6% NAFTA 32.0% 32.2% 33.7% Asia-Pacific 3.7% 5.1% 7.2% Other 16.2% 19.6% 20.5%
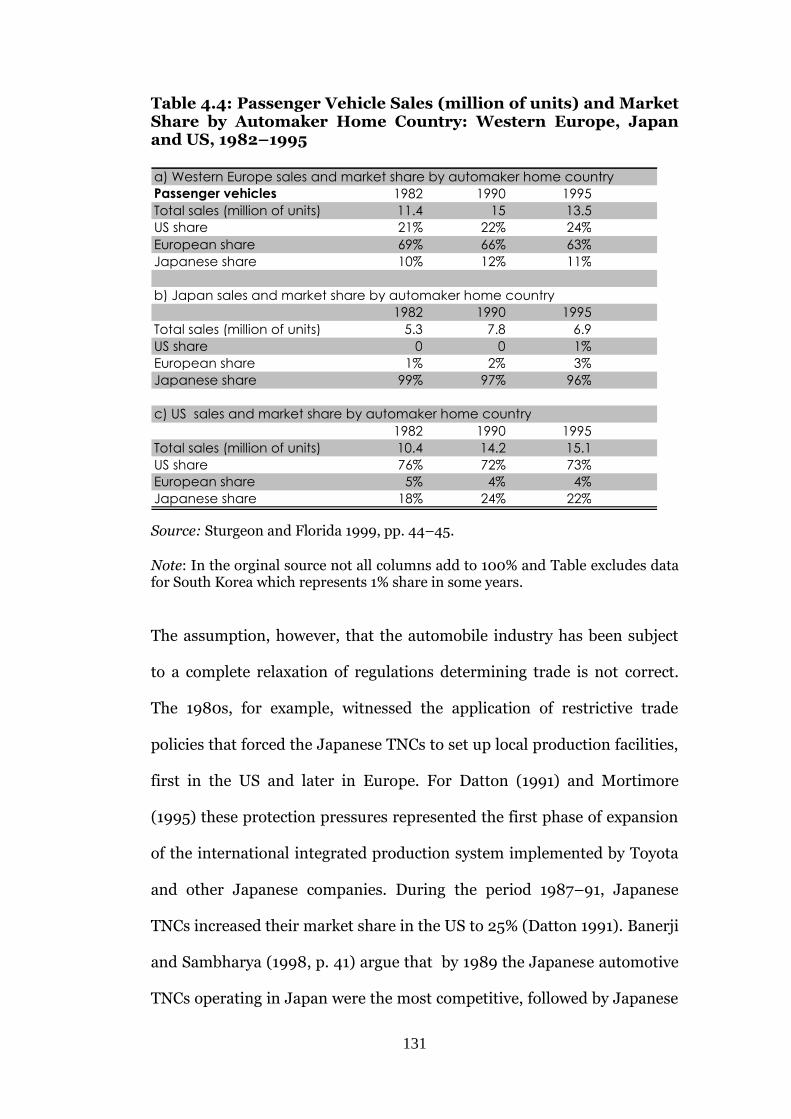
131
Table 4.4: Passenger Vehicle Sales (million of units) and Market Share by Automaker Home Country: Western Europe, Japan and US, 1982–1995
Source: Sturgeon and Florida 1999, pp. 44–45. Note: In the orginal source not all columns add to 100% and Table excludes data for South Korea which represents 1% share in some years. The assumption, however, that the automobile industry has been subject
to a complete relaxation of regulations determining trade is not correct.
The 1980s, for example, witnessed the application of restrictive trade
policies that forced the Japanese TNCs to set up local production facilities,
first in the US and later in Europe. For Datton (1991) and Mortimore
(1995) these protection pressures represented the first phase of expansion
of the international integrated production system implemented by Toyota
and other Japanese companies. During the period 1987–91, Japanese
TNCs increased their market share in the US to 25% (Datton 1991). Banerji
and Sambharya (1998, p. 41) argue that by 1989 the Japanese automotive
TNCs operating in Japan were the most competitive, followed by Japanese
a) Western Europe sales and market share by automaker home country Passenger vehicles 1982 1990 1995 Total sales (million of units) 11.4 15 13.5 US share 21% 22% 24% European share 69% 66% 63% Japanese share 10% 12% 11%
b) Japan sales and market share by automaker home country 1982 1990 1995
Total sales (million of units) 5.3 7.8 6.9 US share 0 0 1% European share 1% 2% 3% Japanese share 99% 97% 96%
c) US sales and market share by automaker home country 1982 1990 1995
Total sales (million of units) 10.4 14.2 15.1 US share 76% 72% 73% European share 5% 4% 4% Japanese share 18% 24% 22%
132
automotive TNCs operating in the US, with US firms operating in the US
in third place and European firms in fourth place. This Japanese challenge
to the global automotive market provoked sharp reactions from
competitors, especially from the US, which sought to compete by seeking
to establish more efficient production facilities in Mexico (Mortimore
1995).
THE AUTOMOTIVE INDUSTRY IN THE NAFTA REGION
Douglas Bennett and Kenneth Sharpe (1979; 1985) trace the development
of the automobile industry through its expansion from developed country
markets to its internationalisation to developing country markets. With a
particular focus on Latin America, Bennett and Sharpe delineate the
transition paths through three stages: (1) the pre-industrial stage, in which
vehicles were imported as kits to be assembled; (2) the ISI stage of
manufacture partially taking place in the domestic market; and (3) the
export stage of vehicles or components. These authors assert that the
automobile industry is often a centrepiece for the promotion of
industrialisation (Bennett and Sharpe 1979, p. 225).
With reference to the case of the automobile industry in Mexico, at the end
of the 1970s, before trade liberalisation and under restricted
(maquiladora) export and import policies, Bennett and Sharpe argued
that:
the Mexican car industry proves interesting to study the potential for shifting from an import substitution to an export promotion strategy, having been an important substitution focus in the early
133
1960s and now seen as ‘an overprotected and inefficient industry (Bennett and Sharpe 1979, p. 181).
According to Bennett and Sharpe the Mexican government’s attempt to
shift to export promotion in 1969 brought certain difficult problems.
The experience has shown that such a policy may be difficult to carry through a) because of demand rigidities … b) because of … decision dependency … c) because of certain difficulties in enforcing such a policy should it encounter recalcitrance … and because of d) the unequal distribution of benefits it may produce between foreign-owned and domestically-owned firms... (Bennett and Sharpe 1979, p. 200).
According to Delbridge (1998), the decision to build motor assembly
facilities in Mexico allowed US companies to reap a triple benefit: they
could take advantage of lower labour costs in a labour-intensive activity;
they could organise a system of subcontracting (outsourcing) which would
be easy to relocate; and they were producing high-value-added products.
The latter factor was very important since the companies had to provide
financial compensation for imports (Mortimore 2000). Although labour
costs tend to be higher in the car industry than in manufacturing in
general, the average dollar-indexed hourly rate of pay for new workers in
Mexico in 2000 amounted to US$4.18 per hour (ILO 2000; OECD 1996b).
This is extremely competitive compared with wages in Mexico’s NAFTA
partner countries, Europe and Japan. Labour costs for unskilled workers
in the automotive industry in Mexico range from 9.2% to 15.5% of US costs
for the period 1993-2000 (see Table 4.5).
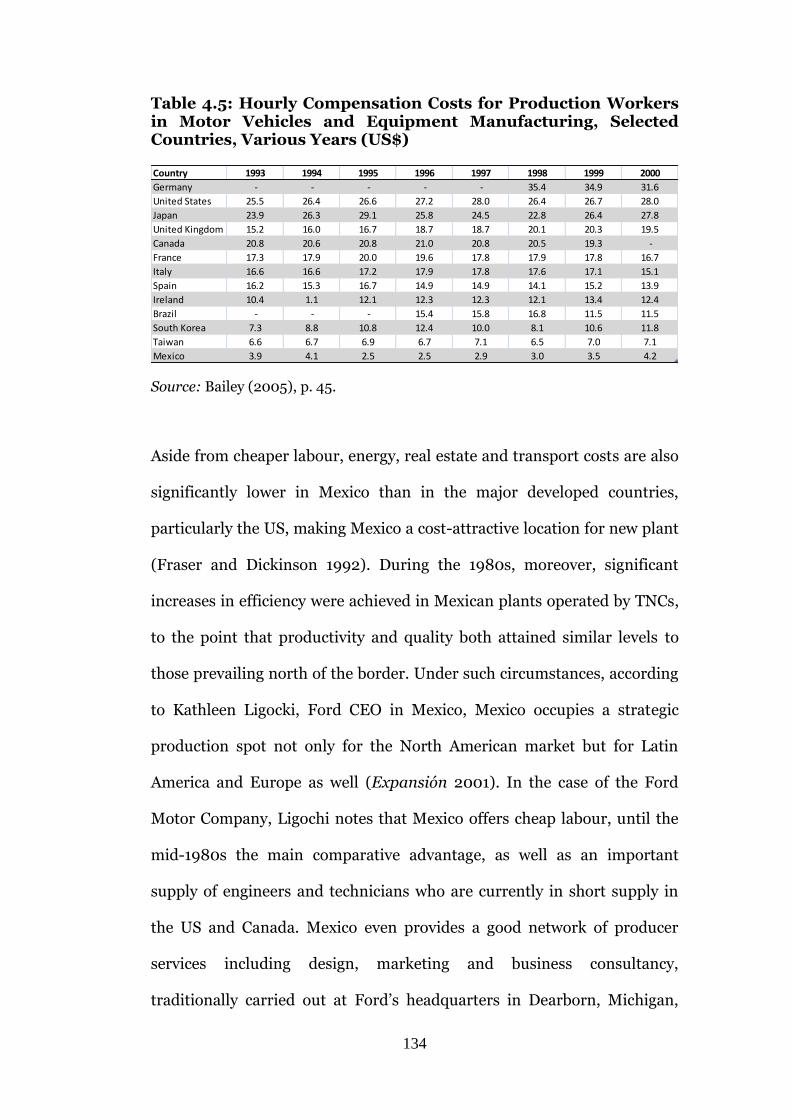
134
Table 4.5: Hourly Compensation Costs for Production Workers in Motor Vehicles and Equipment Manufacturing, Selected Countries, Various Years (US$) Country 1993 1994 1995 1996 1997 1998 1999 2000
Germany - - - - - 35.4 34.9 31.6
United States 25.5 26.4 26.6 27.2 28.0 26.4 26.7 28.0
Japan 23.9 26.3 29.1 25.8 24.5 22.8 26.4 27.8
United Kingdom 15.2 16.0 16.7 18.7 18.7 20.1 20.3 19.5
Canada 20.8 20.6 20.8 21.0 20.8 20.5 19.3 -
France 17.3 17.9 20.0 19.6 17.8 17.9 17.8 16.7
Italy 16.6 16.6 17.2 17.9 17.8 17.6 17.1 15.1
Spain 16.2 15.3 16.7 14.9 14.9 14.1 15.2 13.9
Ireland 10.4 1.1 12.1 12.3 12.3 12.1 13.4 12.4
Brazil - - - 15.4 15.8 16.8 11.5 11.5
South Korea 7.3 8.8 10.8 12.4 10.0 8.1 10.6 11.8
Taiwan 6.6 6.7 6.9 6.7 7.1 6.5 7.0 7.1
Mexico 3.9 4.1 2.5 2.5 2.9 3.0 3.5 4.2
Source: Bailey (2005), p. 45.
Aside from cheaper labour, energy, real estate and transport costs are also
significantly lower in Mexico than in the major developed countries,
particularly the US, making Mexico a cost-attractive location for new plant
(Fraser and Dickinson 1992). During the 1980s, moreover, significant
increases in efficiency were achieved in Mexican plants operated by TNCs,
to the point that productivity and quality both attained similar levels to
those prevailing north of the border. Under such circumstances, according
to Kathleen Ligocki, Ford CEO in Mexico, Mexico occupies a strategic
production spot not only for the North American market but for Latin
America and Europe as well (Expansión 2001). In the case of the Ford
Motor Company, Ligochi notes that Mexico offers cheap labour, until the
mid-1980s the main comparative advantage, as well as an important
supply of engineers and technicians who are currently in short supply in
the US and Canada. Mexico even provides a good network of producer
services including design, marketing and business consultancy,
traditionally carried out at Ford’s headquarters in Dearborn, Michigan,
135
making Mexico more attractive than other locations in the less developed
world. Since 1994, proximity to the US market has been reinforced by the
preferential treatment afforded to Mexico via membership of NAFTA
(Carrillo and Hualde 1997).
To a number of scholars these trends appear to be proof of a spatial
division of labour, and these authors assert that the decentralisation of
labour-intensive production is driving late industrialisation in countries
like Mexico (see Massey 1983). For instance, Carrillo and Hualde (1997)
assert that Mexico offers ideal conditions for US companies, which can
reduce production costs by transferring labour-intensive operations across
the border. This view, however, is opposed by officials at Ford and
Volkswagen, who argue that access to markets (especially the NAFTA
area), the domestic market, and the availability of skilled labour and
service supplies are equally important (Karig 1999; Jackonkkari 2000).65
Furthermore, the labour cost argument is vulnerable to the possibility of
price convergence with economic integration. Although some prices in
Mexico, notably energy, are likely to remain significantly below US levels
in the future, the price of some other services has been relatively high.66
Transportation costs used to be comparatively high in Mexico because of a
lack of adequate railway infrastructure and insufficient port capacity. As a
result, companies were forced to rely heavily on more expensive highway
transport. While this provided indirect benefits to the Mexican trucking
65 Volkswagen production is oriented mainly to Veracruz port for export purposes. 66 Electricity costs in Mexico amounted to 80% of US costs in the early 1990s, while oil was available at nearly half the US price (De Maria y Campos 2002).
136
industry, it was to the disadvantage of the Mexican car assembly industry.
The US-based automotive firms operating in Mexico complained that the
country’s high transport and associated costs in many cases outweighed
Mexico’s overall lower manufacturing costs for automotive assembly (Gray
1992). Significant efforts were made to solve this problem during the
second part of the Salinas administration and then during the Zedillo
administration, including opening up the highway industry to private
sector participation, and the privatisation of both ports and railways
(Carrillo and Hualde 1997). Miles Bryand (2000), CEO of DaimlerChrysler
Mexico, recognised in an interview that the rail and highway systems in
Mexico had been improved and therefore the losses and damage had been
reduced. But, he cautioned, “although significant improvements have been
made in highway infrastructure that reduced costs, there is still a
significant shortage in physical infrastructure that needs to be looked at by
the government, particularly ports and airports”.
In spatial terms the literature on the automotive industry argues that the
reaction to globalisation which Mexico witnessed at the end of the 20th
century led to the emergence of a “three-tier” industry (Mortimore 1995,
2000; Carrillo and Hualde 1997). The first tier is the most modern and
export-oriented, along the border with the US; the second is located in
states midway between Mexico City and the border, where the modern
plants supplying the national market would be located; and the third, the
oldest and most inefficient, is nationally oriented (towards the south) and
located in the states neighbouring Mexico City. Macario (2000) predicted
that the greater outward orientation and its associated increases in
137
efficiency would extend to a large share of firms in the productive sector,
small as well as large, traditional as well as modern, and those located in
less developed regions of the country, thus benefiting a broad segment of
the population.
The aim of this chapter is to look at the competing arguments associated
with the NIDL and Krugman’s prioritisation of trade liberalisation by
considering what is happening at the company level. The example of Ford
is revealing. Table 4.6 shows that plants in Mexico have a lower
productivity rate, suggesting that they are more labour-intensive
compared with those in the US and Canada. But there are discrepancies.
First, even though Mexican plants are generally low in productivity, the
lowest productivity rate is at Ford’s Wixom assembly plant in Michigan,
and the AutoAlliance Ford plant, also located in Michigan, is just three
places higher. Thus, while the findings support the general hypothesis of
manufacturing migration to less developed countries, the argument is
challenged by the performance of specific plants. Second, one might expect
that the plants located in Mexico would be larger than those in developed
countries, to take advantage of labour-intensive assembly while US plants
focus on research, design and specialist manufacture. However, the largest
Ford plant in Mexico, at Cuautitlán, had 3,479 employees in 2000, despite
being significantly smaller than the biggest plant in the US, located in
Kansas City, Missouri, with 5,114 employees. Third, and most damaging
for the Krugman perspective, is the fact that during the 1970s and 1980s
Ford continued to build new plants in the US even though the
liberalisation process had begun in Mexico. The AutoAlliance Flat Rock
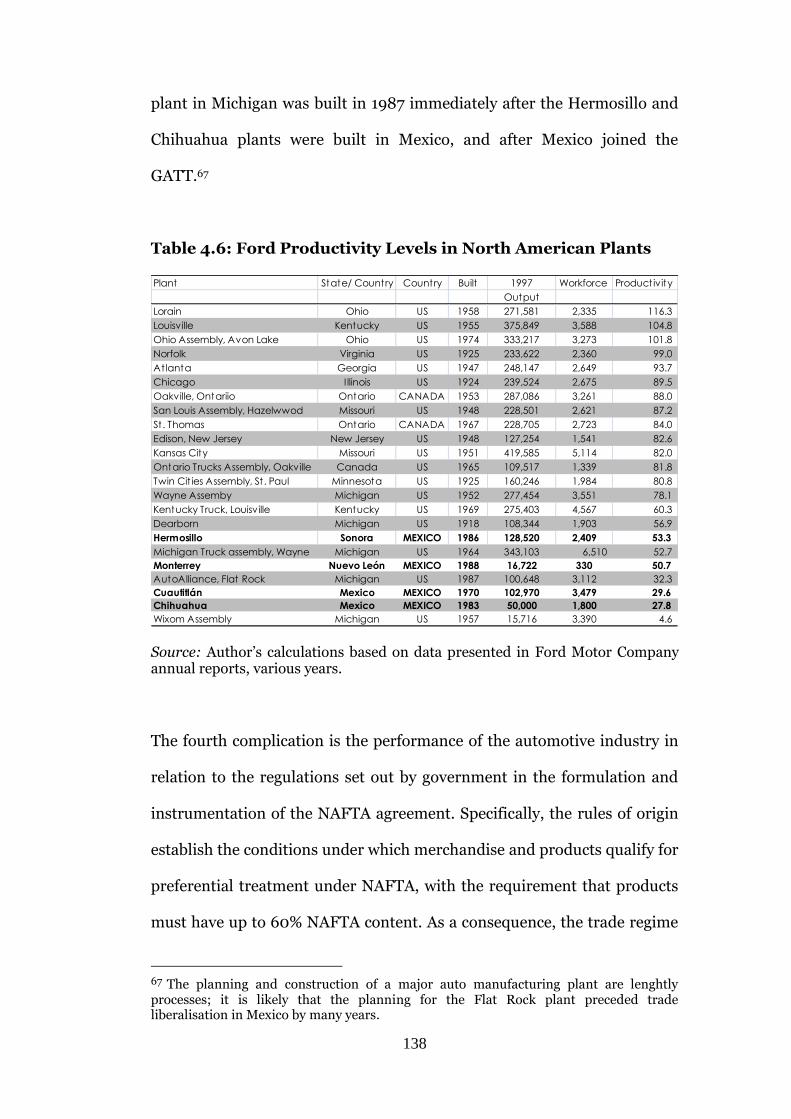
138
plant in Michigan was built in 1987 immediately after the Hermosillo and
Chihuahua plants were built in Mexico, and after Mexico joined the
GATT.67
Table 4.6: Ford Productivity Levels in North American Plants
Plant State/ Country Country Built 1997 Workforce Productivity
Output
Lorain Ohio US 1958 271,581 2,335 116.3
Louisville Kentucky US 1955 375,849 3,588 104.8
Ohio Assembly, Avon Lake Ohio US 1974 333,217 3,273 101.8
Norfolk Virginia US 1925 233,622 2,360 99.0
At lanta Georgia US 1947 248,147 2,649 93.7
Chicago Illinois US 1924 239,524 2,675 89.5
Oakville, Ontariio Ontario CANADA 1953 287,086 3,261 88.0
San Louis Assembly, Hazelwwod Missouri US 1948 228,501 2,621 87.2
St . Thomas Ontario CANADA 1967 228,705 2,723 84.0
Edison, New Jersey New Jersey US 1948 127,254 1,541 82.6
Kansas City Missouri US 1951 419,585 5,114 82.0
Ontario Trucks Assembly, Oakville Canada US 1965 109,517 1,339 81.8
Twin Cit ies Assembly, St. Paul Minnesota US 1925 160,246 1,984 80.8
Wayne Assemby Michigan US 1952 277,454 3,551 78.1
Kentucky Truck, Louisville Kentucky US 1969 275,403 4,567 60.3
Dearborn Michigan US 1918 108,344 1,903 56.9
Hermosillo Sonora MEXICO 1986 128,520 2,409 53.3
Michigan Truck assembly, Wayne Michigan US 1964 343,103 6,510 52.7
Monterrey Nuevo León MEXICO 1988 16,722 330 50.7
AutoAlliance, Flat Rock Michigan US 1987 100,648 3,112 32.3
Cuautitlán Mexico MEXICO 1970 102,970 3,479 29.6
Chihuahua Mexico MEXICO 1983 50,000 1,800 27.8
Wixom Assembly Michigan US 1957 15,716 3,390 4.6 Source: Author’s calculations based on data presented in Ford Motor Company annual reports, various years.
The fourth complication is the performance of the automotive industry in
relation to the regulations set out by government in the formulation and
instrumentation of the NAFTA agreement. Specifically, the rules of origin
establish the conditions under which merchandise and products qualify for
preferential treatment under NAFTA, with the requirement that products
must have up to 60% NAFTA content. As a consequence, the trade regime
67 The planning and construction of a major auto manufacturing plant are lenghtly processes; it is likely that the planning for the Flat Rock plant preceded trade liberalisation in Mexico by many years.
139
discriminates against products with high levels of content from outside the
NAFTA region, promoting the growth of industrial productive chains,
especially in those industries that used to have high levels of content from
outside the NAFTA region – typically Asiatic and European companies
operating under the Maquiladora Programme – with lower levels of
Mexican value added. I will return to the issue of NAFTA later, but for the
moment I would argue that these rules have disrupted the simple
Krugman formulation of trade liberalisation and the force of attraction of
the border regions due to their proximity to the US market, and have
supported industrial regionalisation according to a wider set of criteria.
THE AUTOMOTIVE INDUSTRY IN MEXICO
This section reviews the economic regulatory framework and policy actions
directly affecting the automotive sector, from just before the period of
import substitution to NAFTA. This discussion is relevant for assessing the
time of decentralisation of the automotive industry, from a territorial
perspective and in relation to specific policies of trade liberalisation. I aim
to explore how the economic regime set by government intervention
generated incentives for, or inhibited, the location decisions of companies
in the automotive sector, with the intention of testing Krugman’s ideas.
In October 1925, the Mexican government issued a provision which cut the
duty on the import of automotive parts by 50% and placed high quota
restrictions on imported automobiles assembled abroad. The change was
designed to encourage the import of unassembled vehicles and to boost the
140
assembly industry in Mexico; in other words, one of the aims of the decree
was to create employment for Mexican workers and to give impetus to
national assembly companies. This began a process of trade protectionism
under the guise of import substitution (Camarena 1981). By 1951, due to
pressure from assembly companies, restrictions on the importing of
automotive parts were lifted, but a strict price control for imported
vehicles was fixed by the government. Also, a minimum Mexican content
of 20% was established for relatively simple components – this can be seen
as the first attempt on behalf of the Mexican government to vertically
integrate the industry (Camarena 1981).
By 1954, the implementation of an import quota system for each company
was in operation, creating incentives for the incorporation of national
parts in the assembly process with a view to restricting the number of
models produced by each company. This aimed to prevent segmentation in
the car industry and enable industry production to reach more efficient
levels through economies of scale. Paradoxically, although the economies
might have driven prices down, to the benefit of consumers if not labour,
the change drove an increase in vehicle prices as the import quota system
restricted product offer, which was of benefit to foreign producers. This
was reflected in the proliferation of foreign assembly plants; by 1958 there
were 19 manufacturers, of which 12 were assembly plants and all were
vehicle importers, representing 75 different brands and approximately 117
different vehicle models for sale.68
68 Author’s analysis based on information presented in AMIA annual reports, various years.
141
The Mexican government’s “support” for the automotive sector remained
inconsistent through the 1950s and 1960s. In 1958, a new rule froze the
price of vehicles on the national market. This cut into the profits of foreign
producers and once again made the Mexican market less attractive for the
automotive industry.69 In 1962, the importing of finished vehicles was
subjected to an increase in the percentage of nationally produced parts for
vehicles assembled in Mexico in a compensatory system of the sector’s
trade balance (Diario Oficial de la Federación (DOF), 23 August 1962). At
the end of the 1960s and the start of the 1970s, the expansion of the
domestic market, combined with the pressure put on assembly companies
to increase the national content of automotive manufacturing above the
legal minimum, led to an increase in imports and a deficit in the balance of
payments in the industry.
The lack of success of the 1962 and 1963 decrees in promoting the
automotive industry – given that the industry now recorded a balance of
trade deficit – motivated the publication in 1972 of a new decree (DOF, 20
October 1972). Exporting was now set as a condition for assembly
companies to be able to operate in the country. Moreover, the export of
engines was favoured, with the decree stipulating that assembly companies
producing more than one kind of engine for cars had to export 60% of
their total engine production. As a consequence of this measure, which was
69 Author’s analysis based on information presented in AMIA annual reports, various years.
142
aimed mainly at TNCs operating in Mexico, a series of investments in
engine production plants began, mainly in the north of the country.
The 1980s witnessed trade reforms aimed at the automotive sector in line
with the joining of the GATT (DOF, 15 September 1983). In 1984, the total
value of imports subject to tariffs and permits was reduced from 100% to
55%. A programme of tariff reductions was implemented in four stages,
starting with a maximum 74.8% tariff in 1984 and ending in 1988 with a
maximum import tariff of 14.1%.70 In 1989, measures set out that the
regional content of vehicles had to be 50%, while the national value added
was set at 30% for the automotive parts industry and 36% for the assembly
companies and national producers (DOF, 11 December 1989). Tariffs for
finished vehicles were set at 20% and 14% on average for automotive parts.
The most important measure stipulated that the industry trade balance
must be in surplus. Specific regulations were also directed towards
granting TNCs some important privileges, notably the decision to allow
20% of maquiladora production to be sold on the domestic market for the
first time (Truett and Truett 1994).
In January 1994, NAFTA came into force. The implications for the
Mexican automotive industry were reflected in the set of regulations
gradually applied from 1994 and ending in 2004. Starting in January 1994,
the minimum content of national value added was reduced in a
transitional ten-year period for the automobile industry and for auto parts.
For the automotive parts companies authorised by the Secretaría de
70 As part of the GATT, Mexico set a maximum trade tariff of 50% from 1986.
143
Comercio y Fomento Industrial (SECOFI, Ministry of Trade and Industry),
the minimum content for national value added was reduced from 30% to
20%, with the aim of reducing it to zero by 2000. For the automotive
assembly industry, the minimum content was reduced from 36% to 29% in
1994. For 2004, the minimum national value added was set at zero. The
national rule of content was transformed into a regional rule, and since
2004 all automobiles must have at least 62.5% of regional value added as
the minimum rule of content.71
Regulations requiring firms to export were reduced. All automotive
assembly plants over the period 1994–2004 were required to export at
least 55% of total production in order to be granted permission to import
finished cars, although the restriction to import finished cars was to be
removed by 2004. Automobile import permits are also no longer
exclusively granted to assembly plants but are granted to individual
consumers from 2004. Additionally, the import tax on new cars was
reduced from 50% to 20% in 1994, to 7% in 1997 and to zero in 2004.
From 1998, 82% of all auto parts products had an import tariff of zero
while the remaining 18% were granted a five-year transition period to
reach a zero import tariff by 2003.72
In summary, at the end of the transition period in December 2003, the
Decree of the Automotive industry and the Automotive Industry Law
(Reglamento) was removed. The national rule of content was transformed
71 Author’s analysis based on information presented in SECOFI (1994). 72 Idem
144
into a regional rule of content for the NAFTA countries, and companies
under the Maquiladora Programme were authorised to sell up to 100% of
total production in the national market.
AUTOMOTIVE INDUSTRY TRENDS IN MEXICO
By the beginning of the 21st century, Mexico’s car assembly industry was
dominated by a few TNCs: DaimlerChrysler, Ford, General Motors,
Nissan-Renault and Volkswagen. In 1991, Ford and Volkswagen accounted
for 50.6% of car production in Mexico and by 2000 General Motors and
Volkswagen together accounted for 46.6% of total production (see Table
4.7). The arrival of the TNCs took place in what I classify as three waves,
all of which showed similar location patterns.
The first wave started between 1920 and 1940, when the “big three” from
the US – General Motors, Ford Motor Company and Chrysler – were
established in Mexico; the second wave occurred during the 1960s, with
European and Japanese TNCs following the US firms and clustering
around them; and the third wave happened as a reaction to the new
economic regulations during the post-NAFTA period, when Honda and
BMW moved into Mexico. During this third period, a number of
companies also became involved in increased M&As and strategic alliances
with effects at the local level. This was the case for Renault, which acquired
a large share of Nissan, the merger of Mercedes and Chrysler, and Volvo’s
acquisition by Ford.
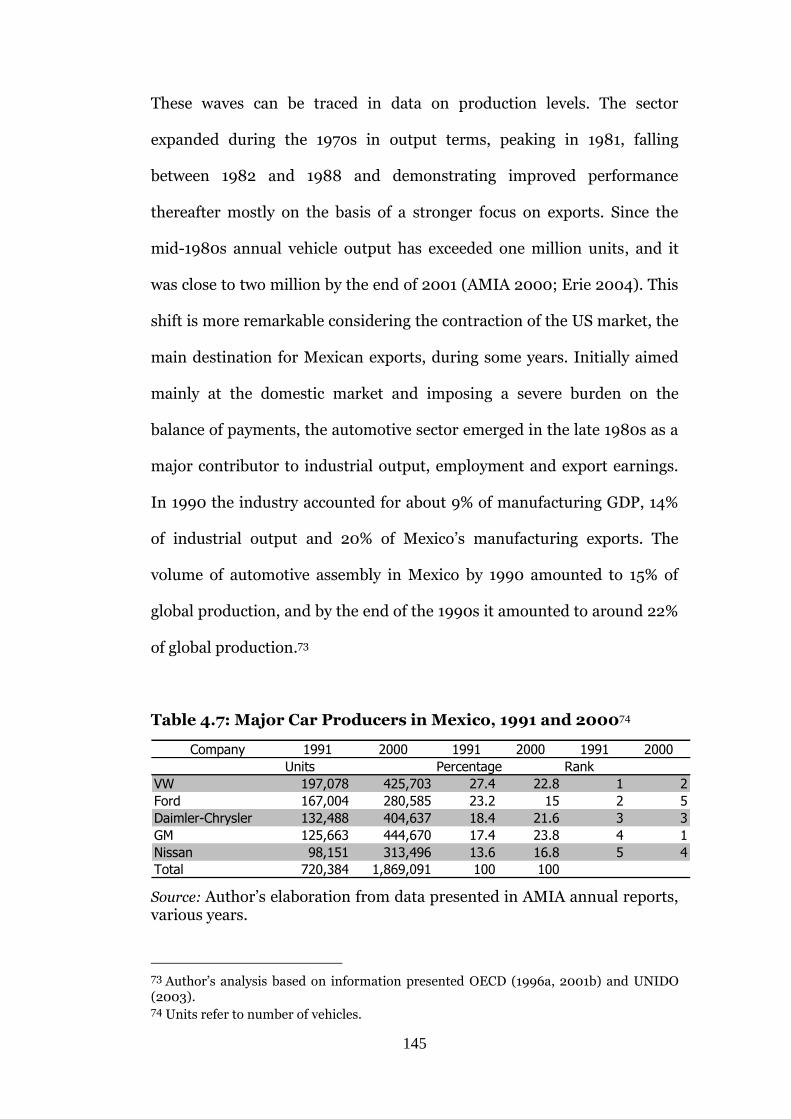
145
These waves can be traced in data on production levels. The sector
expanded during the 1970s in output terms, peaking in 1981, falling
between 1982 and 1988 and demonstrating improved performance
thereafter mostly on the basis of a stronger focus on exports. Since the
mid-1980s annual vehicle output has exceeded one million units, and it
was close to two million by the end of 2001 (AMIA 2000; Erie 2004). This
shift is more remarkable considering the contraction of the US market, the
main destination for Mexican exports, during some years. Initially aimed
mainly at the domestic market and imposing a severe burden on the
balance of payments, the automotive sector emerged in the late 1980s as a
major contributor to industrial output, employment and export earnings.
In 1990 the industry accounted for about 9% of manufacturing GDP, 14%
of industrial output and 20% of Mexico’s manufacturing exports. The
volume of automotive assembly in Mexico by 1990 amounted to 15% of
global production, and by the end of the 1990s it amounted to around 22%
of global production.73
Table 4.7: Major Car Producers in Mexico, 1991 and 200074
Source: Author’s elaboration from data presented in AMIA annual reports, various years.
73 Author’s analysis based on information presented OECD (1996a, 2001b) and UNIDO (2003). 74 Units refer to number of vehicles.
Company 1991 2000 1991 2000 1991 2000
Units Percentage Rank
VW 197,078 425,703 27.4 22.8 1 2
Ford 167,004 280,585 23.2 15 2 5
Daimler-Chrysler 132,488 404,637 18.4 21.6 3 3
GM 125,663 444,670 17.4 23.8 4 1
Nissan 98,151 313,496 13.6 16.8 5 4
Total 720,384 1,869,091 100 100
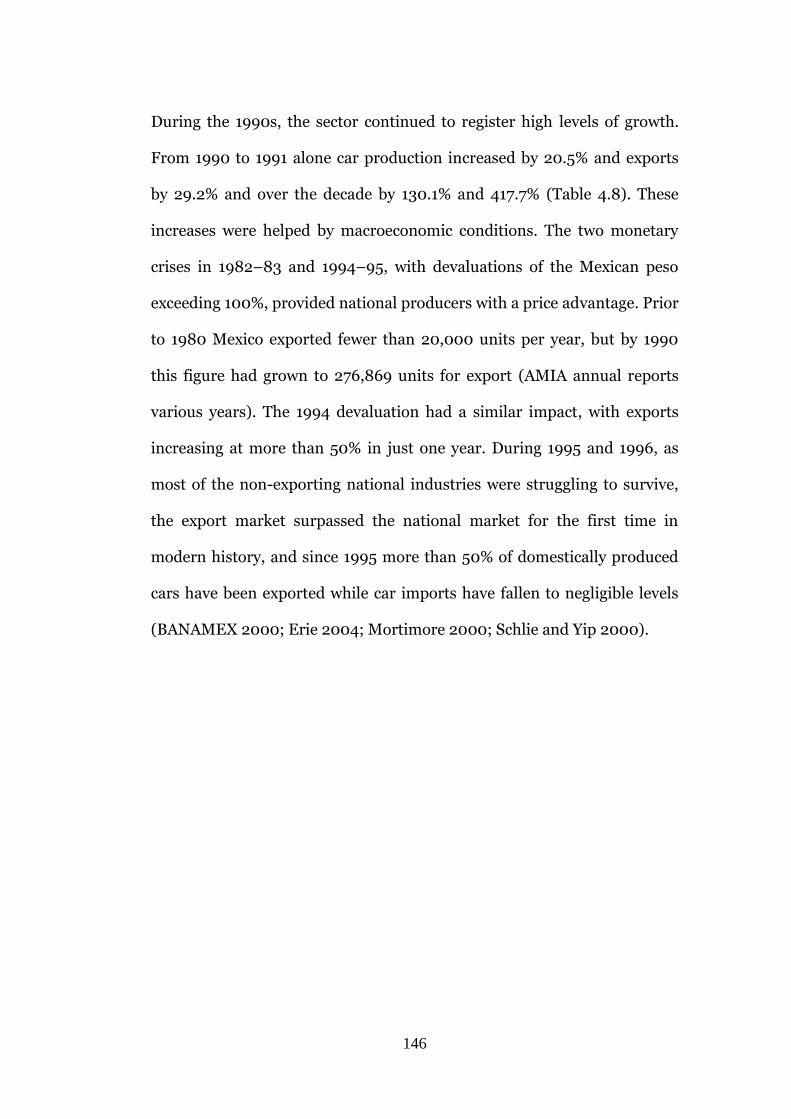
146
During the 1990s, the sector continued to register high levels of growth.
From 1990 to 1991 alone car production increased by 20.5% and exports
by 29.2% and over the decade by 130.1% and 417.7% (Table 4.8). These
increases were helped by macroeconomic conditions. The two monetary
crises in 1982–83 and 1994–95, with devaluations of the Mexican peso
exceeding 100%, provided national producers with a price advantage. Prior
to 1980 Mexico exported fewer than 20,000 units per year, but by 1990
this figure had grown to 276,869 units for export (AMIA annual reports
various years). The 1994 devaluation had a similar impact, with exports
increasing at more than 50% in just one year. During 1995 and 1996, as
most of the non-exporting national industries were struggling to survive,
the export market surpassed the national market for the first time in
modern history, and since 1995 more than 50% of domestically produced
cars have been exported while car imports have fallen to negligible levels
(BANAMEX 2000; Erie 2004; Mortimore 2000; Schlie and Yip 2000).
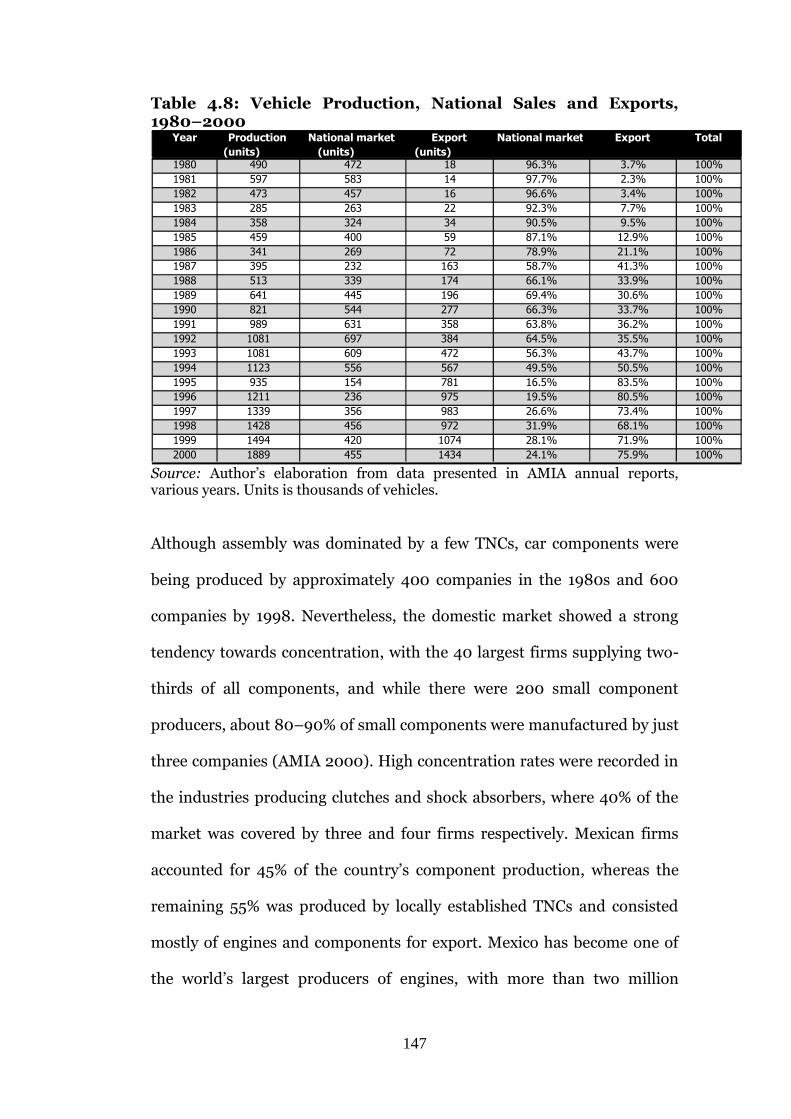
147
Table 4.8: Vehicle Production, National Sales and Exports, 1980–2000
Source: Author’s elaboration from data presented in AMIA annual reports, various years. Units is thousands of vehicles.
Although assembly was dominated by a few TNCs, car components were
being produced by approximately 400 companies in the 1980s and 600
companies by 1998. Nevertheless, the domestic market showed a strong
tendency towards concentration, with the 40 largest firms supplying two-
thirds of all components, and while there were 200 small component
producers, about 80–90% of small components were manufactured by just
three companies (AMIA 2000). High concentration rates were recorded in
the industries producing clutches and shock absorbers, where 40% of the
market was covered by three and four firms respectively. Mexican firms
accounted for 45% of the country’s component production, whereas the
remaining 55% was produced by locally established TNCs and consisted
mostly of engines and components for export. Mexico has become one of
the world’s largest producers of engines, with more than two million
Year Production (units)
National market (units)
Export (units)
National market Export Total
1980 490 472 18 96.3% 3.7% 100% 1981 597 583 14 97.7% 2.3% 100% 1982 473 457 16 96.6% 3.4% 100% 1983 285 263 22 92.3% 7.7% 100% 1984 358 324 34 90.5% 9.5% 100% 1985 459 400 59 87.1% 12.9% 100% 1986 341 269 72 78.9% 21.1% 100% 1987 395 232 163 58.7% 41.3% 100% 1988 513 339 174 66.1% 33.9% 100% 1989 641 445 196 69.4% 30.6% 100% 1990 821 544 277 66.3% 33.7% 100% 1991 989 631 358 63.8% 36.2% 100% 1992 1081 697 384 64.5% 35.5% 100% 1993 1081 609 472 56.3% 43.7% 100% 1994 1123 556 567 49.5% 50.5% 100% 1995 935 154 781 16.5% 83.5% 100% 1996 1211 236 975 19.5% 80.5% 100% 1997 1339 356 983 26.6% 73.4% 100% 1998 1428 456 972 31.9% 68.1% 100% 1999 1494 420 1074 28.1% 71.9% 100% 2000 1889 455 1434 24.1% 75.9% 100%
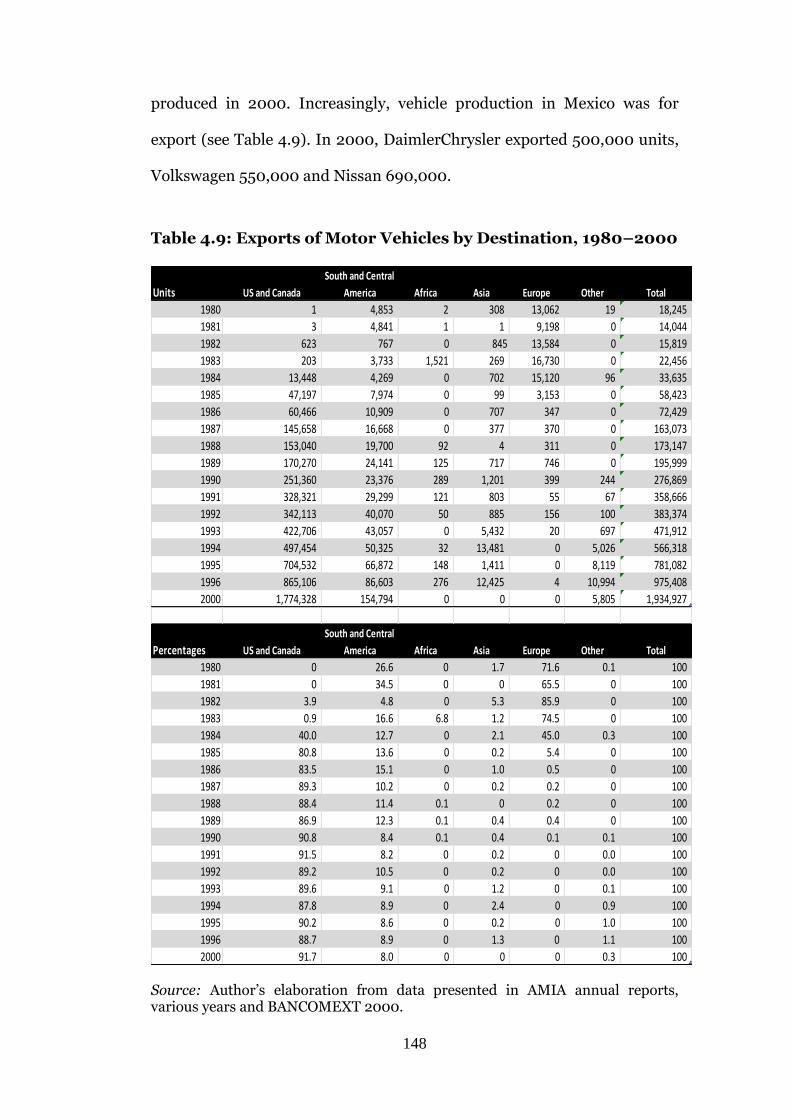
148
produced in 2000. Increasingly, vehicle production in Mexico was for
export (see Table 4.9). In 2000, DaimlerChrysler exported 500,000 units,
Volkswagen 550,000 and Nissan 690,000.
Table 4.9: Exports of Motor Vehicles by Destination, 1980–2000
South and Central
Units US and Canada America Africa Asia Europe Other Total
1980 1 4,853 2 308 13,062 19 18,245
1981 3 4,841 1 1 9,198 0 14,044
1982 623 767 0 845 13,584 0 15,819
1983 203 3,733 1,521 269 16,730 0 22,456
1984 13,448 4,269 0 702 15,120 96 33,635
1985 47,197 7,974 0 99 3,153 0 58,423
1986 60,466 10,909 0 707 347 0 72,429
1987 145,658 16,668 0 377 370 0 163,073
1988 153,040 19,700 92 4 311 0 173,147
1989 170,270 24,141 125 717 746 0 195,999
1990 251,360 23,376 289 1,201 399 244 276,869
1991 328,321 29,299 121 803 55 67 358,666
1992 342,113 40,070 50 885 156 100 383,374
1993 422,706 43,057 0 5,432 20 697 471,912
1994 497,454 50,325 32 13,481 0 5,026 566,318
1995 704,532 66,872 148 1,411 0 8,119 781,082
1996 865,106 86,603 276 12,425 4 10,994 975,408
2000 1,774,328 154,794 0 0 0 5,805 1,934,927
South and Central
Percentages US and Canada America Africa Asia Europe Other Total
1980 0 26.6 0 1.7 71.6 0.1 100
1981 0 34.5 0 0 65.5 0 100
1982 3.9 4.8 0 5.3 85.9 0 100
1983 0.9 16.6 6.8 1.2 74.5 0 100
1984 40.0 12.7 0 2.1 45.0 0.3 100
1985 80.8 13.6 0 0.2 5.4 0 100
1986 83.5 15.1 0 1.0 0.5 0 100
1987 89.3 10.2 0 0.2 0.2 0 100
1988 88.4 11.4 0.1 0 0.2 0 100
1989 86.9 12.3 0.1 0.4 0.4 0 100
1990 90.8 8.4 0.1 0.4 0.1 0.1 100
1991 91.5 8.2 0 0.2 0 0.0 100
1992 89.2 10.5 0 0.2 0 0.0 100
1993 89.6 9.1 0 1.2 0 0.1 100
1994 87.8 8.9 0 2.4 0 0.9 100
1995 90.2 8.6 0 0.2 0 1.0 100
1996 88.7 8.9 0 1.3 0 1.1 100
2000 91.7 8.0 0 0 0 0.3 100 Source: Author’s elaboration from data presented in AMIA annual reports, various years and BANCOMEXT 2000.
149
The largest market for Mexico’s exports is the NAFTA area, which had a
92% share in 1991, of which the US accounted for 73% and Canada 19%. In
2000, the US alone was the recipient of 90% of automotive exports, while
the rest was shipped to South America (6%) and Central America (2%),
and only 0.3% of all exports went outside the American continent. Mexican
producers of components did not show the same dynamism at the
beginning of the liberalisation period, but according to the president of the
AMIA, they had been able to penetrate the international TNC supply
network on a large scale by the end of the 1990s. The traditional reluctance
to procure components from Mexican producers beyond the legally
required minimum level has changed dramatically (Mortimore 1995). Here
corporate strategies and the rules of origin have played a very important
part in the establishment of a large car component industry. In the case of
Volkswagen, nearly 60% of total auto component purchases are made from
260 national suppliers that are mostly, according to Thomas Karig (1999),
subsidiaries of European companies. In this particular case, the number of
national suppliers rose due to the high costs of importing auto parts from
Europe and the price advantage of the Mexican market.75
The introduction of NAFTA brought drastic changes to the structure
governing the automotive sector in Mexico. The agreement gradually
eliminated barriers to vehicle, engine and auto parts trade over a ten-year
period, ending in 2004. It also eliminated (1) restrictions on foreign
investment in the sector, particularly in Mexican auto parts producers, (2)
75 Components produced in Mexico by TNCs are not usually directed at the Mexican car industry but constitute a part of inter- or intra-industry trade within car manufacturing groups.
150
domestic sales and trade balance requirements, and (3) domestic value-
added requirements (but inserted regional rules of origin). Each NAFTA
country was expected to phase out all duties on imports of North American
automotive goods during the transition period. Canada and the US
eliminated tariffs on their vehicle trade under the Canada–US free trade
agreements. 76 The elimination of restrictions applies to trade and
investment to and from the US and Canada, but not with third countries
such as Japan (Hufbauer and Schott 1993; Weintraub 1994).
NAFTA changed the rules of origin, giving precedence to supply from
within the North American region over Mexican rules that specified a
minimum local content of 36% for all cars sold in the country. In order to
avoid import duty, by 2002 the new rule required that passenger
automobiles and light trucks as well as engines and transmissions for these
vehicles built in any of the NAFTA countries but sold in one of the other
two had to have a minimum 62.5% North American parts content, and
60% for other vehicles and automobile parts (Dobell and Neufeld 1993). In
calculating the content level of automobile goods, the value of parts
imported from outside the NAFTA region is traced through the production
chain to improve the accuracy of content calculation. In accordance with
NAFTA investment provisions, Mexico must immediately permit “NAFTA
76 Under NAFTA, for its imports from Mexico, the US would: (1) immediately eliminate its tariffs on passenger automobiles; (2) immediately reduce its tariffs on light trucks to 10% and phase out the remaining tariffs over the next five years; and (3) phase out its tariffs on other vehicles over the next ten years. Regarding imports from Canada and the US, Mexico would: (1) immediately reduce its tariffs on passenger automobiles by 50% and phase out the remaining tariffs over ten years; (2) immediately reduce its tariffs on light trucks by 50% and phase out the remaining tariffs over five years; and (3) phase out its tariffs on all other vehicles over the next ten years. Canada would eliminate its tariffs on vehicles imported from Mexico following the same schedule as Mexico would follow for imports from Canada and the US.
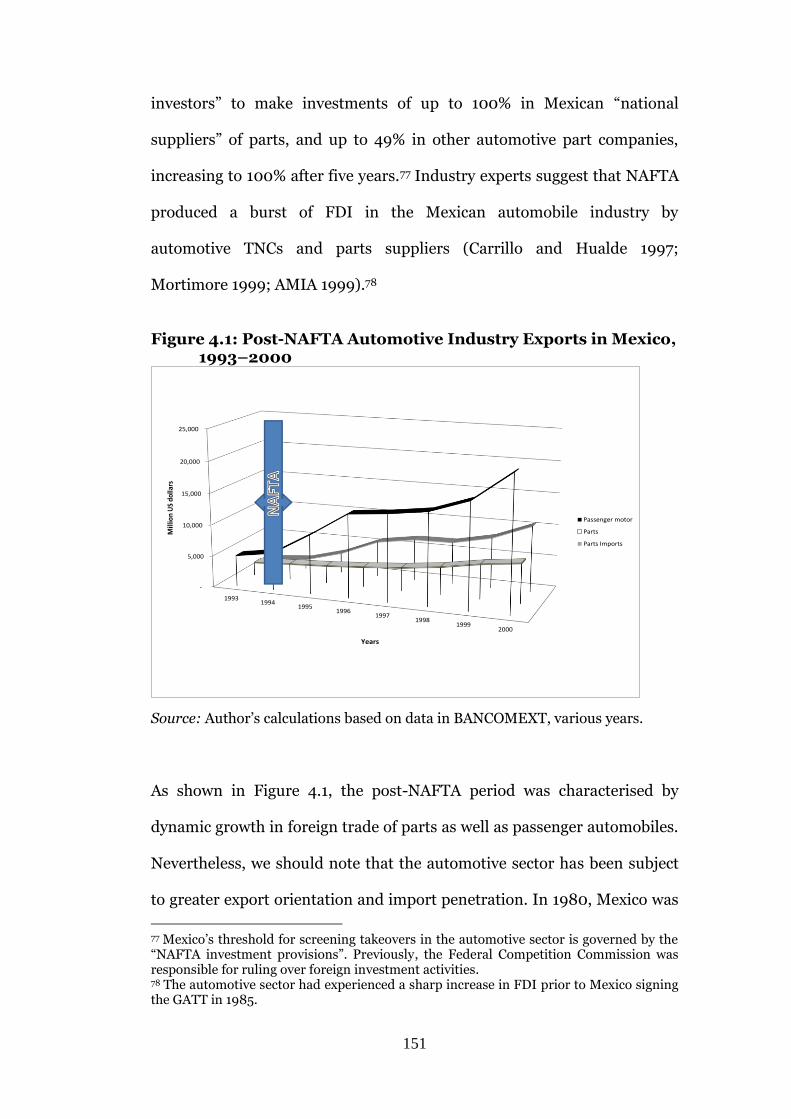
151
investors” to make investments of up to 100% in Mexican “national
suppliers” of parts, and up to 49% in other automotive part companies,
increasing to 100% after five years.77 Industry experts suggest that NAFTA
produced a burst of FDI in the Mexican automobile industry by
automotive TNCs and parts suppliers (Carrillo and Hualde 1997;
Mortimore 1999; AMIA 1999).78
Figure 4.1: Post-NAFTA Automotive Industry Exports in Mexico,
1993–2000
-
5,000
10,000
15,000
20,000
25,000
19931994
19951996
19971998
19992000
Mill
ion
US
dol
lars
Years
Passenger motor
Parts
Parts Imports
Source: Author’s calculations based on data in BANCOMEXT, various years.
As shown in Figure 4.1, the post-NAFTA period was characterised by
dynamic growth in foreign trade of parts as well as passenger automobiles.
Nevertheless, we should note that the automotive sector has been subject
to greater export orientation and import penetration. In 1980, Mexico was
77 Mexico’s threshold for screening takeovers in the automotive sector is governed by the “NAFTA investment provisions”. Previously, the Federal Competition Commission was responsible for ruling over foreign investment activities. 78 The automotive sector had experienced a sharp increase in FDI prior to Mexico signing the GATT in 1985.
152
not linked to the North American vehicle market. It exported 18,245
vehicles, 3.7% of total vehicle production, with 98% of vehicles exported to
Latin America and Western Europe (UNIDO 2003). By 1990, the profile of
vehicle exports had completely altered. Total exports had increased to
276,869 units, 33.7% of total vehicle production, with 90% now exported
to North America. By 2001, total vehicle exports had risen to 1.8 million
units. NAFTA has also opened up vehicle imports into Mexico. Up to 1995,
the domestic market was protected; while Mexico exported more than
250,000 vehicles in 1990, it imported only 5,376 vehicles (less than 1% of
domestic vehicle sales). Under NAFTA, vehicle imports began to increase
(UNIDO 2003).
THE AUTOMOTIVE INDUSTRY AND THE KRUGMAN HYPOTHESIS
Mexico City has long been a key location for the automotive sector. The
three longest established car manufacturers in Mexico – Ford Motor
Company, General Motors and Chrysler, which started operations in 1925,
1937 and 1938 respectively – began in Mexico City. In 1932, seven years
after starting operations, Ford began operation of a plant in the northern
delegación (borough) of Gustavo A. Madero. Not far away from Ford’s
plant was General Motors which began operations at its plant in the
Cuauhtémoc delegación in 1937. The third-oldest company in Mexico,
Chrysler (today DaimlerChrysler), also opened up in Mexico City, starting
operations in 1938 at a site that remained in operation until 2006 as the
general offices of Chrysler de Mexico.79
79 Chrysler closed the plant in 2006 and a shopping centre was developed on the site.
153
The second wave of automotive TNCs that came to Mexico during the
1960s were all non-US companies: Volkswagen (Germany), Renault
(France) and Datsun (later Nissan, Japan). The critical issue here is that all
three non-US companies decided to build plants outside of but still near to
Mexico City: Puebla (Puebla), Cuernavaca (Morelos) and Ciudad Sahagún
(Municipality of Tapealulco, Hidalgo). In 1954 Volkswagen imported its
first car into Mexico, and in 1962 the first Mexican Volkswagen assembly
plant was built in Xalostoc (State of Mexico), but it only operated until
1966. In 1965, construction of the Puebla plant started and Volkswagen
gradually shifted operations to the new plant, which was officially
inaugurated in 1966. Renault arrived in Mexico in 1956 and started
operations in association with the public-owned company Dina at Dina’s
plant in Ciudad Sahagún in 1960. In 1959, Nissan Motor Company arrived
in Mexico as a distribution company for the Datsun brand. In 1961 it
changed its name and began operating as Nissan Mexicana S.A.
(NISMEX), an importer and distributor of Datsun vehicles. In 1966,
Datsun Motor Company established its first plant in Cuernavaca.80
In 1962 Ford set up a production facility in Mexico City’s neighbouring
municipality of Tlalnepantla, only 10 km from its Mexico City plant.81 Soon
after, in 1963, GM built assembly production facilities in Toluca (State of
80 According to AMIA reports NISMEX had invested $US12 million by the end of the 1960s in the Cuernavaca plant. 81 This facility was bought from Studebaker. Studebaker Corporation was a US wagon and automobile manufacturer based in South Bend, Indiana. Founded in 1852 under the name of the Studebaker Brothers Manufacturing Company, the firm was originally a producer of wagons for farmers, miners and the military. Studebaker entered the automotive industry in 1912. The South Bend plant ceased production on 20 December 1963, and the last Studebaker car rolled off the assembly line in Hamilton, Ontario, Canada on 16 March 1966 (Hendry 1972).
154
Mexico), and Chrysler completed the building of a plant there in 1968. In
1970, Ford gradually started transferring its operations to a new plant in
Cuautitlán (State of Mexico); the shift was not fully completed until 1984,
but the plant has since become the core of Ford’s Mexican production.
The late 1960s and 1970s were mostly characterised by the absence of new
international arrivals into the automotive sector and by the consolidation
of existing ones. During this period all existing TNCs started to build
facilities to increase their productive capacity. This was particularly the
case for US-origin TNCs, which remained loyal to the metropolitan
municipalities of Mexico City.82 At this time, decentralisation represented
a shift within the metropolitan area motivated by the modernisation and
consolidation of manufacturing capacity, rather than a move away from
Mexico City. Indeed, most of the municipalities where plants were built in
the 1960s and 1970s were metropolitan municipalities located in the four
neighbouring states of Mexico City: Diesel Nacional and Renault in the
state of Hidalgo; Nissan in Morelos; Volkswagen in Puebla; and Ford, GM
and Chrysler in the State of Mexico. In all cases, plants were located in
municipalities within a 150 km radius of Mexico City.83
The beginning of the 1980s marked a period of more pronounced
decentralisation to the north by the subsidiaries and production facilities
82 It is important to mention that between 1954 and 1966, under three different presidents, Mexico City was governed by Ernesto P. Uruchurtu (known as the “iron mayor”), a period characterised by the mayor’s inflexibility in allowing new settlements. This led to the rapid urbanisation of the neighbouring municipalities of the State of Mexico, which is exactly where new automotive manufacturing plants began to locate (Gamboa de Buen 1994; Davis 1994; Ward 1986, 1990, 1998). 83 Analysis by the author based on AMIA annual reports, various years.
155
of most TNCs that had previously arrived in Mexico. The location decisions
were motivated by an export strategy focused on the US market, reacting
and taking advantage of the government’s export promotion policies, in
particular the Maquiladora Programme, and the price competitive
advantage generated by the devaluation of 1982. The three US-origin
TNCs, as well as Renault and Nissan, all began moving northwards during
the ISI period and long before trade liberalisation, starting in the 1980s.
Ford, GM and Chrysler built manufacturing plants in the border states of
Sonora, Chihuahua, Coahuila and Nuevo León, but now the main facilities
were relocated to border municipalities.
In 1981, GM inaugurated a manufacturing plant after an investment of
US$250 million in Ramos Arizpe (Coahuila), 408 km from the border with
the US and 869 km from Mexico City, becoming the first TNC in the
automotive sector to build a facility outside Mexico City’s manufacturing
belt and the furthest away from it in terms of distance. In the early 1980s,
Ford also began an export strategy that led to the construction of plants in
Chihuahua in 1983, in Hermosillo (Sonora) in 1986 and in Monterrey
(Nuevo León) in 1988, on average 300 km from the border. The Sonora
plant was the furthest from Mexico City at 2,002 km. Renault and Nissan
followed the northwards migration, but still remained far from the border.
In 1982, Renault built a plant in Gómez Palacio in the northern state of
Durango, closer to the border than to Mexico City. Nissan remained loyal
to the central part of the country, building its new plant in the state of
Aguascalientes, some 504 km north of Mexico City, in 1982. Table 4.10
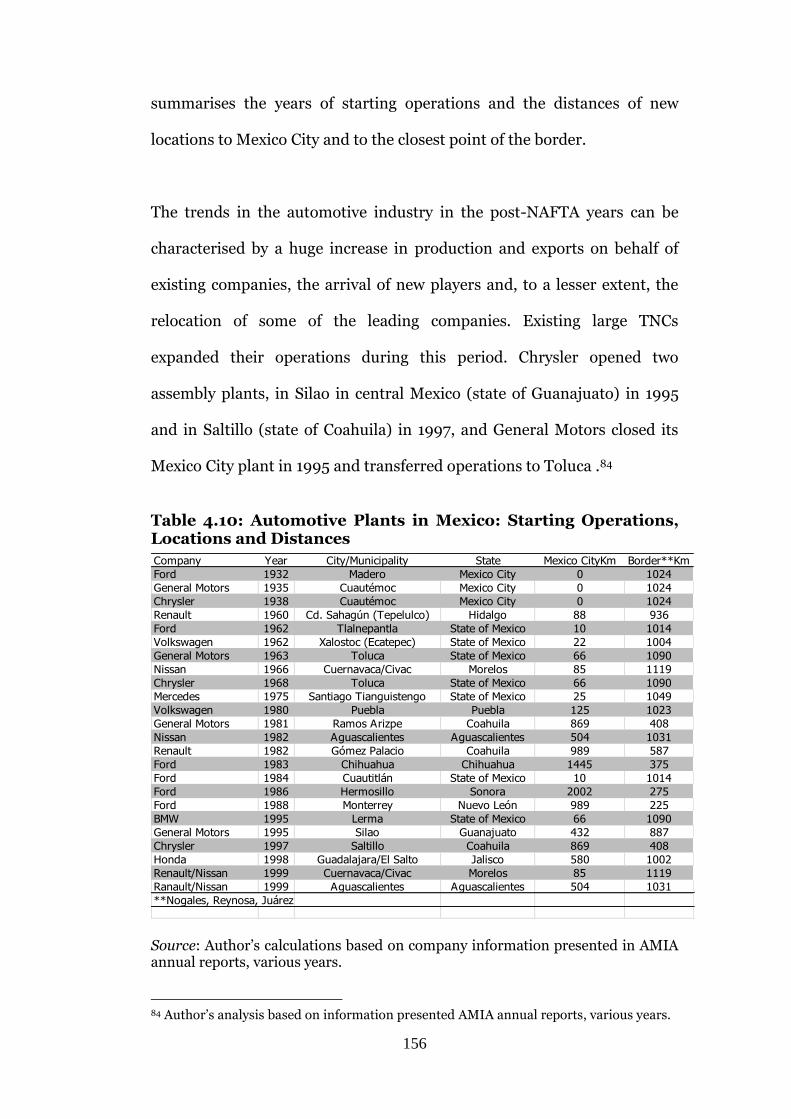
156
summarises the years of starting operations and the distances of new
locations to Mexico City and to the closest point of the border.
The trends in the automotive industry in the post-NAFTA years can be
characterised by a huge increase in production and exports on behalf of
existing companies, the arrival of new players and, to a lesser extent, the
relocation of some of the leading companies. Existing large TNCs
expanded their operations during this period. Chrysler opened two
assembly plants, in Silao in central Mexico (state of Guanajuato) in 1995
and in Saltillo (state of Coahuila) in 1997, and General Motors closed its
Mexico City plant in 1995 and transferred operations to Toluca .84
Table 4.10: Automotive Plants in Mexico: Starting Operations, Locations and Distances
Source: Author’s calculations based on company information presented in AMIA annual reports, various years.
84 Author’s analysis based on information presented AMIA annual reports, various years.
Company Year City/Municipality State Mexico CityKm Border**Km
Ford 1932 Madero Mexico City 0 1024
General Motors 1935 Cuautémoc Mexico City 0 1024
Chrysler 1938 Cuautémoc Mexico City 0 1024
Renault 1960 Cd. Sahagún (Tepelulco) Hidalgo 88 936
Ford 1962 Tlalnepantla State of Mexico 10 1014
Volkswagen 1962 Xalostoc (Ecatepec) State of Mexico 22 1004
General Motors 1963 Toluca State of Mexico 66 1090
Nissan 1966 Cuernavaca/Civac Morelos 85 1119
Chrysler 1968 Toluca State of Mexico 66 1090
Mercedes 1975 Santiago Tianguistengo State of Mexico 25 1049
Volkswagen 1980 Puebla Puebla 125 1023
General Motors 1981 Ramos Arizpe Coahuila 869 408
Nissan 1982 Aguascalientes Aguascalientes 504 1031
Renault 1982 Gómez Palacio Coahuila 989 587
Ford 1983 Chihuahua Chihuahua 1445 375
Ford 1984 Cuautitlán State of Mexico 10 1014
Ford 1986 Hermosillo Sonora 2002 275
Ford 1988 Monterrey Nuevo León 989 225
BMW 1995 Lerma State of Mexico 66 1090
General Motors 1995 Silao Guanajuato 432 887
Chrysler 1997 Saltillo Coahuila 869 408
Honda 1998 Guadalajara/El Salto Jalisco 580 1002
Renault/Nissan 1999 Cuernavaca/Civac Morelos 85 1119
Ranault/Nissan 1999 Aguascalientes Aguascalientes 504 1031
**Nogales, Reynosa, Juárez
157
The major new players in the third wave of automotive TNCs to Mexico
were Audi, BMW, Honda, Mercedes, Volvo and Renault. Three of these
entered Mexico courtesy of global mergers, with Volvo cars being produced
at Ford plants, Audi output supported by Volkswagen, and Mercedes-Benz
working with Chrysler. Honda and BMW were by far the most important
new players, establishing new production facilities in Mexico with no
previous presence. Honda set up production facilities in El Salto, a part of
the metropolitan region of Guadalajara, in 1998, deciding not to locate in
any of the states with automotive clusters or a presence of automotive
TNCs but instead choosing one of the most dynamic manufacturing
regions in the country in recent years.
Opting for a different strategy to Honda, BMW set up a production facility
in Toluca in 1995, where an automotive cluster (Ford, Chrysler, Chevrolet)
was well established. The greatest transformation, however, was that of
Renault, which exited Mexico in the 1980s (along with its US plants) when
accumulated debt almost bankrupted the parent company. In 1999,
Renault bought 36% of Nissan Motor and 22.5% of Nissan Diesel, with the
option to increase the share four years later. This merger allowed Renault
to re-enter the Mexican and North American markets, and immediately
propelled it to the position of fourth-largest global producer with 9.1% of
global production. Renault made its comeback by assembling its first cars
in the Nissan Cuernavaca Plant (Morelos) and at the Nissan plant in
Aguascalientes. As explained by Louis Schwitzer, president of Renault
Mexico, “After 14 years we are back with a consolidated, strong and solid
158
company” (interview in Expansión, 25 October 1998). In the period 1999–
2005, Renault decided to make an investment in Mexico worth a total of
US$400 million.
THE TOP 100 COMPANIES IN THE AUTOMOTIVE INDUSTRY
I was interested to discover whether the location patterns of auto parts
firms were related to the location decisions made by TNCs in the
automotive sector. To do so, I gathered data from AMIA and SECOFI on
the top 100 parts companies in the automotive sector. One of the clearest
ways to ascertain a location link was by looking at the timing of decisions
made by companies to locate in Mexican states in relation to the presence
of TNCs.
From the data, I ranked states according to concentration of firms in the
automotive sector. At the top of the list are the states of Aguascalientes,
Puebla, Jalisco, the State of Mexico and Mexico City. Although this might
seem unsurprising as these are established locations for assembly plants,
the ranking suggests that the automotive sector displays a highly
concentrated location pattern. Table 4.11 provides initial support for the
idea that flexible production patterns are less relevant in Mexico than
might be supposed, as the strong concentration pattern suggests a high
level of manufacturing integration.
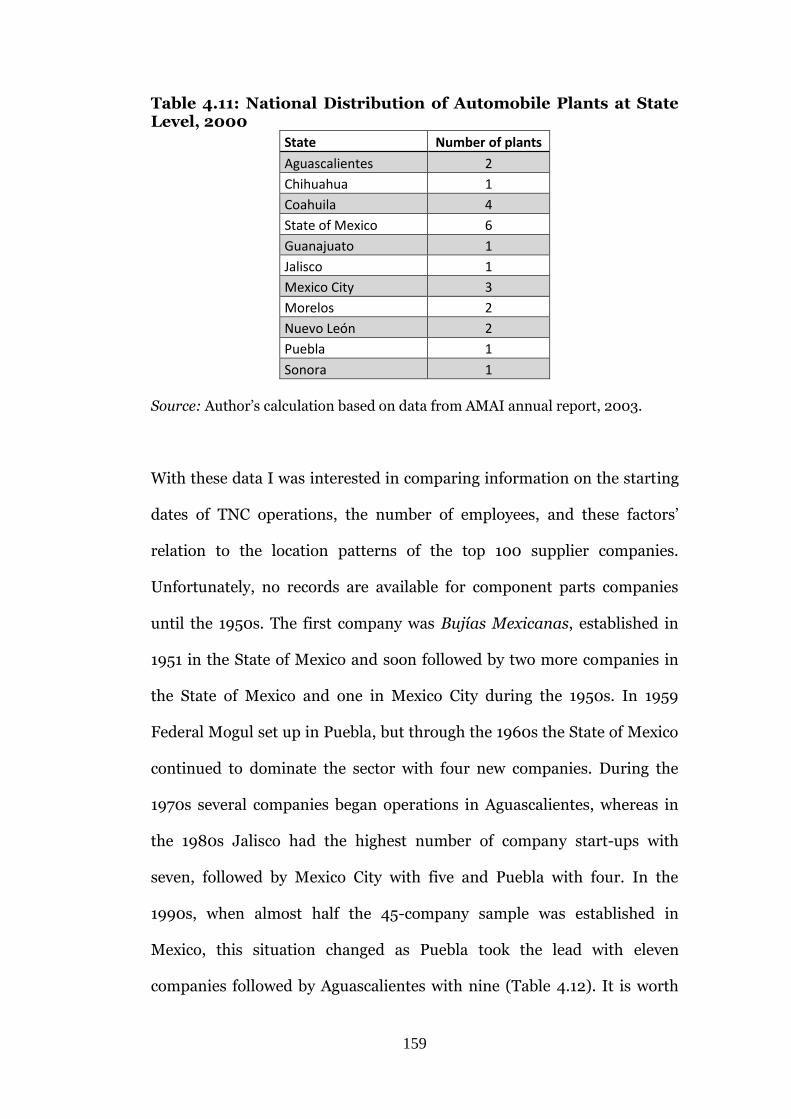
159
Table 4.11: National Distribution of Automobile Plants at State Level, 2000
State Number of plants
Aguascalientes 2
Chihuahua 1
Coahuila 4
State of Mexico 6
Guanajuato 1
Jalisco 1
Mexico City 3
Morelos 2
Nuevo León 2
Puebla 1
Sonora 1
Source: Author’s calculation based on data from AMAI annual report, 2003.
With these data I was interested in comparing information on the starting
dates of TNC operations, the number of employees, and these factors’
relation to the location patterns of the top 100 supplier companies.
Unfortunately, no records are available for component parts companies
until the 1950s. The first company was Bujías Mexicanas, established in
1951 in the State of Mexico and soon followed by two more companies in
the State of Mexico and one in Mexico City during the 1950s. In 1959
Federal Mogul set up in Puebla, but through the 1960s the State of Mexico
continued to dominate the sector with four new companies. During the
1970s several companies began operations in Aguascalientes, whereas in
the 1980s Jalisco had the highest number of company start-ups with
seven, followed by Mexico City with five and Puebla with four. In the
1990s, when almost half the 45-company sample was established in
Mexico, this situation changed as Puebla took the lead with eleven
companies followed by Aguascalientes with nine (Table 4.12). It is worth
160
mentioning that states like Jalisco, San Luis Potosí, Tamaulipas and
Querétaro, which do not have TNC assembly plants, have clusters of parts
companies serving national and international markets, most of them
under the Maquiladora Programme (AMIA 1993; BANCOMEXT 2000).
The increase in the number of companies in the auto parts sector in recent
years goes hand in hand with the transformation of production systems in
the automotive industry towards post-Fordism. It does not necessarily
imply a more scattered pattern of production, as confirmed by
concentration patterns and through interviews conducted with officials
from the different TNCs. According to Ford officials, outsourcing has been
a necessity from the 1980s onwards, and whole parts of the production
process are increasingly given to providers and outside contractors. This
specialisation trend has led to the reduction of labour-intensive practices,
particularly at the Cuautitlán plant (Maceda 2000).
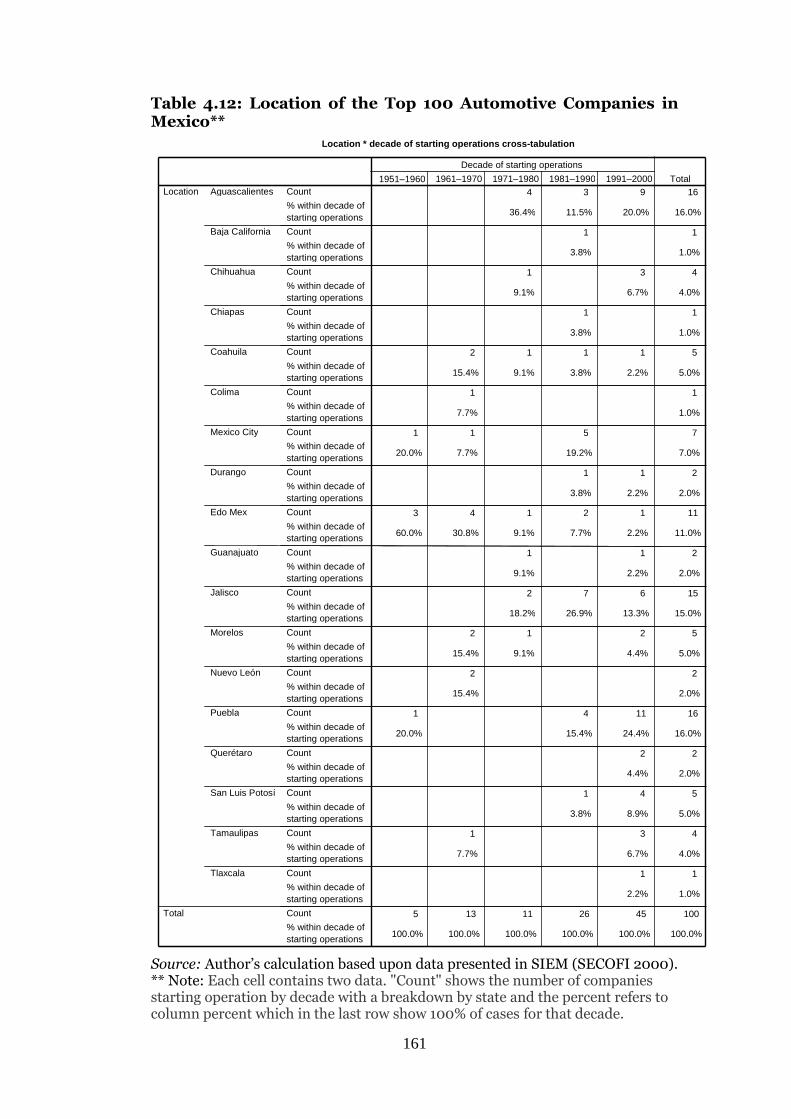
161
Table 4.12: Location of the Top 100 Automotive Companies in Mexico**
Source: Author’s calculation based upon data presented in SIEM (SECOFI 2000). ** Note: Each cell contains two data. "Count" shows the number of companies starting operation by decade with a breakdown by state and the percent refers to column percent which in the last row show 100% of cases for that decade.
Location * decade of starting operations cross-tabulation
4 3 9 16
36.4% 11.5% 20.0% 16.0%
1 1
3.8% 1.0%
1 3 4
9.1% 6.7% 4.0%
1 1
3.8% 1.0%
2 1 1 1 5
15.4% 9.1% 3.8% 2.2% 5.0%
1 1
7.7% 1.0%
1 1 5 7
20.0% 7.7% 19.2% 7.0%
1 1 2
3.8% 2.2% 2.0%
3 4 1 2 1 11
60.0% 30.8% 9.1% 7.7% 2.2% 11.0%
1 1 2
9.1% 2.2% 2.0%
2 7 6 15
18.2% 26.9% 13.3% 15.0%
2 1 2 5
15.4% 9.1% 4.4% 5.0%
2 2
15.4% 2.0%
1 4 11 16
20.0% 15.4% 24.4% 16.0%
2 2
4.4% 2.0%
1 4 5
3.8% 8.9% 5.0%
1 3 4
7.7% 6.7% 4.0%
1 1
2.2% 1.0%
5 13 11 26 45 100
100.0% 100.0% 100.0% 100.0% 100.0% 100.0%
Count % within decade of starting operations Count % within decade of starting operations Count % within decade of starting operations Count % within decade of starting operations Count % within decade of starting operations Count % within decade of starting operations Count % within decade of starting operations Count % within decade of starting operations Count % within decade of starting operations Count % within decade of starting operations Count % within decade of starting operations Count % within decade of starting operations Count % within decade of starting operations Count % within decade of starting operations Count % within decade of starting operations Count % within decade of starting operations Count % within decade of starting operations Count % within decade of starting operations Count % within decade of starting operations
Aguascalientes
Baja California
Chihuahua
Chiapas
Coahuila
Colima
Mexico City
Durango
Edo Mex
Guanajuato
Jalisco
Morelos
Nuevo León
Puebla
Querétaro
San Luis Potosí
Tamaulipas
Tlaxcala
Location
Total
1951–1960
1960
1961–1970 1971–1980 1981–1990 1991–2000 Decade of starting operations
Total
162
PATTERNS OF EMPLOYMENT CONCENTRATION IN MEXICO’S
AUTOMOTIVE SECTOR In order to identify the level of concentration in Mexico City and forward-
backward linkages in the automotive industry during the 1980s, I decided
to look at the industrial classification (also known as class level) data.85 By
analysing different economic activities within the automotive sector, I was
able to pinpoint the concentration of activities to states where particular
TNCs are located. For instance, “manufacturing of motor vehicles”
(384110), which covers assembly and final production activity, was highly
concentrated: in 1980, Mexico City, the State of Mexico and Hidalgo
accounted for 82.9% of employment share (Table 4.13). Classification
384110 therefore appears strongly linked to the location of three US
companies in Mexico City and the State of Mexico, and Renault in Hidalgo.
With regard to parts manufacturing, Mexico City, the State of Mexico and
Nuevo León accounted for over 5o% of employment for each economic
activity within the automotive sector. Two cases stand out in terms of
activity concentration: Puebla, with 45.7% of jobs in manufacturing
engines and parts (384122); and the State of Mexico, with 49.5% of jobs in
transmission parts production (384123). Also worth noting are Coahuila,
Chihuahua, Puebla and Sonora, which were in the process of building
assembly plants (384110) that had yet to come on stream but which were
producing automotive parts.
85 The automotive industry is classified as four-digit according to ISIC (3840). Class level disaggregates automotive manufacturing activities into their various components as shown in Table 4.17.
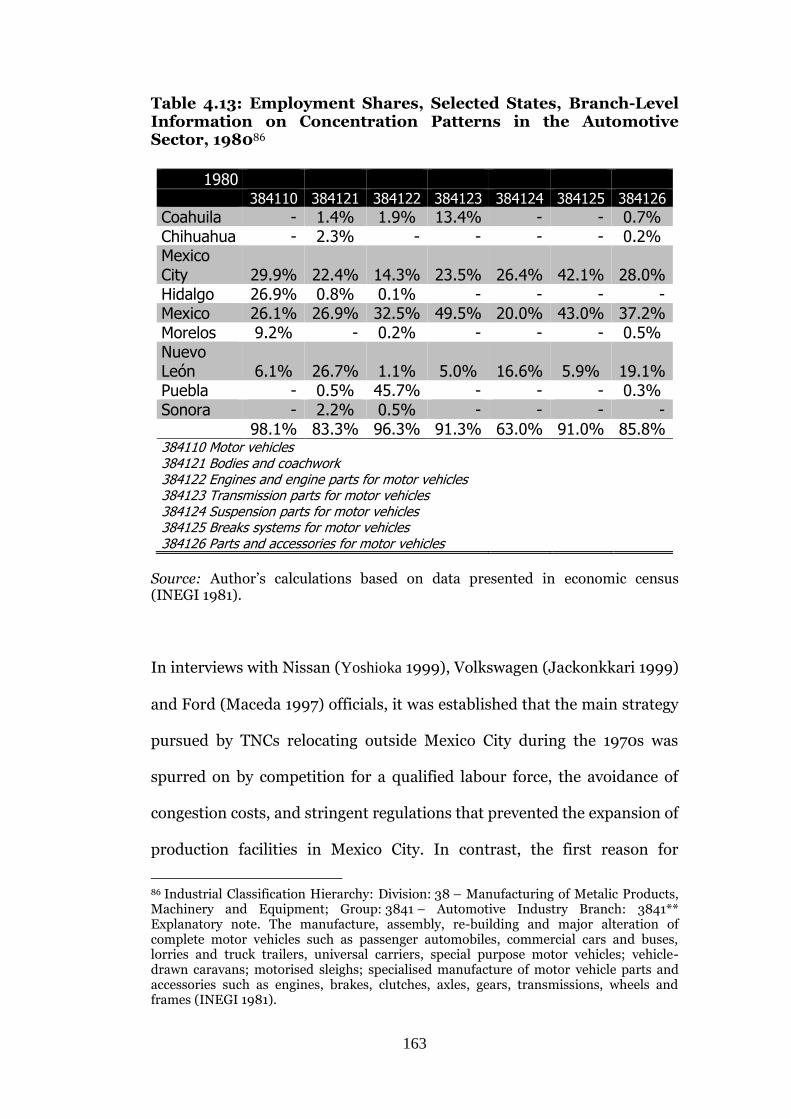
163
Table 4.13: Employment Shares, Selected States, Branch-Level Information on Concentration Patterns in the Automotive Sector, 198086
Source: Author’s calculations based on data presented in economic census (INEGI 1981).
In interviews with Nissan (Yoshioka 1999), Volkswagen (Jackonkkari 1999)
and Ford (Maceda 1997) officials, it was established that the main strategy
pursued by TNCs relocating outside Mexico City during the 1970s was
spurred on by competition for a qualified labour force, the avoidance of
congestion costs, and stringent regulations that prevented the expansion of
production facilities in Mexico City. In contrast, the first reason for
86 Industrial Classification Hierarchy: Division: 38 – Manufacturing of Metalic Products, Machinery and Equipment; Group: 3841 – Automotive Industry Branch: 3841** Explanatory note. The manufacture, assembly, re-building and major alteration of complete motor vehicles such as passenger automobiles, commercial cars and buses, lorries and truck trailers, universal carriers, special purpose motor vehicles; vehicle-drawn caravans; motorised sleighs; specialised manufacture of motor vehicle parts and accessories such as engines, brakes, clutches, axles, gears, transmissions, wheels and frames (INEGI 1981).
1980 384110 384121 384122 384123 384124 384125 384126
Coahuila - 1.4% 1.9% 13.4% - - 0.7% Chihuahua - 2.3% - - - - 0.2% Mexico City 29.9% 22.4% 14.3% 23.5% 26.4% 42.1% 28.0% Hidalgo 26.9% 0.8% 0.1% - - - - Mexico 26.1% 26.9% 32.5% 49.5% 20.0% 43.0% 37.2% Morelos 9.2% - 0.2% - - - 0.5% Nuevo León 6.1% 26.7% 1.1% 5.0% 16.6% 5.9% 19.1% Puebla - 0.5% 45.7% - - - 0.3% Sonora - 2.2% 0.5% - - - - 98.1% 83.3% 96.3% 91.3% 63.0% 91.0% 85.8% 384110 Motor vehicles
384121 Bodies and coachwork
384122 Engines and engine parts for motor vehicles 384123 Transmission parts for motor vehicles
384124 Suspension parts for motor vehicles 384125 Breaks systems for motor vehicles
384126 Parts and accessories for motor vehicles
164
locating in the nearby surrounding states was that at the time of the de-
concentration process, approximately 60% of the Mexican market was
located in the Metropolitan Area of Mexico City (MAMC) – according to
Nissan and Ford officials this figure is still high, at around 40%. The
second reason was related to the supply chain: as the central part of
Mexico was where most of the parts suppliers were concentrated, moving
far away was a gamble that no company was willing to take. However, with
the dismantling of trade protections, most companies could source
supplies from abroad, and thus central Mexico lost its pull. In this respect
Krugman’s ideas on access to markets gain some support, even if not as he
foresaw it – access to consumers – but because trade liberalisation granted
access to suppliers for car producers in Mexico. This change alone, of
course, might not have triggered de-concentration, but it seems to have
determined new location patterns, as was seen with the TNCs entering
Mexico during the 1990s. Nevertheless, although automotive and supply
companies started to build plants closer to the US border in order to start
operating under the Maquiladora Programme, there were no signs of any
company closing down in central locations and moving northwards, and
most of the companies with significant investments in the northern part of
Mexico are US companies.
By the end of the 1990s, 36% of total jobs in the automotive sector
nationwide were concentrated in the border states; this industry is now
dominated by exports, especially to the US. Also, according to
BANCOMEXT (2000), by the end of the 1990s the automotive industry
exported nearly 75% of total production, which makes the balance and
165
concentration towards more central and southern locations somewhat
counterintuitive and goes against the northern migration hypothesis. The
data do not support the idea that geographical location is directly related
to export orientation as Krugman argues. I identified locations from which
company exports originate in order to test the hypothesis that only plants
located in the border export to the US and those in the south produce for
the national market. This simple division appears to have little validity. In
Toluca, GM produces mainly for export to the US while the Ramos Arizpe
plant in Coahuila, 225 km from the US border, mostly exports to Japan,
Canada and Central America rather than the US (GM 2000).
For both Ford (Ford 2000) and Daimler Chrysler (Daimler Chrysler
2000), their northern and central locations specialise in different parts of
the production process. In Saltillo (Coahuila), Chrysler opened two
assembly plants in 1995 and 1997 producing engines both for national
consumption and for export, although the latter takes precedence, while
the company’s Toluca plant has been producing vehicles for domestic and
export markets (US and Canadian) since it started operations. At the Ford
Hermosillo plant, engines are produced to supply the two other Ford
plants in Mexico as well as for export to the US Ford plants (AMIA 2000).
The example of Volkswagen, located approximately 1,000 km from the
closest crossing point of the US border in Puebla, illustrates the limitations
of the post-Fordist fragmentation hypothesis. All the elements of the
production chain for the plant are located nearby. In 1997, a process of
specialisation got under way and Volkswagen began to assemble the first
166
car to be produced entirely in Mexico for the world market. The Puebla
plant is now geared for exports, with a car that contains the highest
percentage of national content of any produced in Mexico. This
transformation goes against Krugman’s “migration to the north”
hypothesis. It also goes against the flexible production system argument,
as the Puebla plant was an export leader in 2000 and only one-fifth of its
total production went to the Mexican market.87
A slightly different pattern applies to Nissan. Production is based at the
Cuernavaca assembly plant, opened in 1966, although materials came
mainly from Japan (Hiroshi 2000). Exports of both components
(stampings, engines etc.) and finished cars to Latin America began in 1972,
and by 1995 Nissan Mexicana was designated as the regional sales centre
for the Americas, with 60% of total exports to Latin America coming from
Mexico. In 2000, with an annual vehicle production capacity of more than
300,000, Nissan vehicles produced in Mexico were exported to 35
countries around the world. However, Mexico City “is still the biggest
market”, according to Nissan Mexico official Mr. Yoshioka (2000),
accounting for 40% of the plant’s output. The link with Renault has opened
the North American market to Nissan, according to Yoshiharu Hanawa
(1999), president of Nissan in Mexico, while interviewees at Renault
claimed that the interest in entering the North American market was due
to the attraction of the big auto parts companies and global suppliers.
87 Author’s analysis based on information presented in AMIA annual report 2000.
167
Using employment data for the 1998 industrial census it was possible to
calculate a Concentration Index for the automotive industry.88 As Table
4.14 indicates, by the late 1990s employment was increasingly
concentrated in the north and border region, with a significant share
remaining in the centre. The Concentration Index shows the importance of
Aguascalientes, Puebla and Coahuila (Table 4.15). The most important
finding is that the first two states are home to TNCs from outside the US,
i.e., Nissan and Volkswagen. These companies must fulfil the rules of
origin set up by NAFTA. Interviewed about this particular issue, the CEO
of Nissan Mexico commented that this is not a problem for Nissan due to
its high integration in the Mexican economy: 70% of its suppliers (all of
them Japanese) were already located in Mexico. Volkswagen officials
declined to offer a precise figure but stated that the figure is over the 70%
given by Nissan, but the remarkable fact is that none of them are
companies with German capital. From the US companies’ point of view,
the rules of origin have minor relevance; however, they have clustered in
certain cities, not for the sake of complying with the rules of origin, but to
gain from specialisation and cooperation among US firms. It is no
coincidence that the three are nested in two states: the State of Mexico and
88 The concentration coefficient is a measure that allows for comparisons between sets of subgroups and the total, in this case between the share of automotive manufacturing, measured in terms of employment, as part of the state economy, and the share of automotive manufacturing as part of the national economy. The formula is:
GDPPmt
GDPiPmi
where Pm is automotive manufacturing employment, i is the state and t is total. A coefficient equal to 1 for a state means that the proportion of manufacturing in the state and in the country as a whole is the same. If greater than 1 (>1), the concentration of the activity is higher than the national average, while if the index is less than 1 (<1) it is lower. The coefficient is used to compare the degree of concentration of an economic sector in different states.
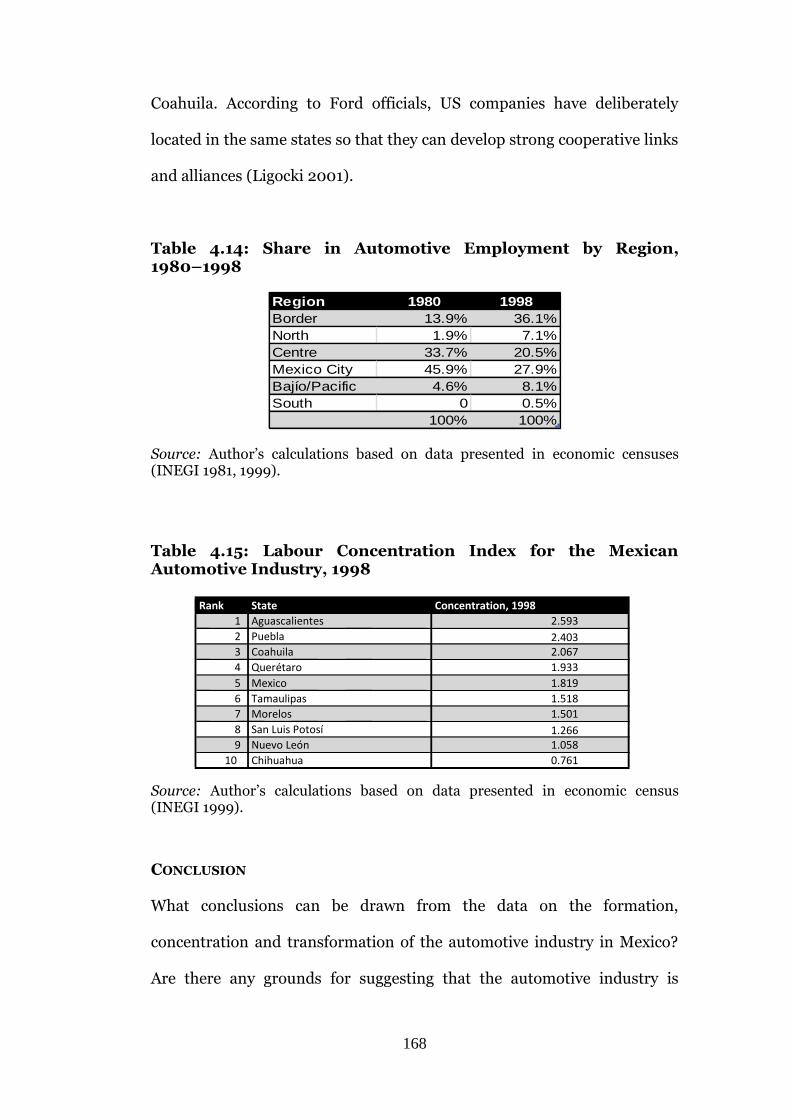
168
Coahuila. According to Ford officials, US companies have deliberately
located in the same states so that they can develop strong cooperative links
and alliances (Ligocki 2001).
Table 4.14: Share in Automotive Employment by Region, 1980–1998
Region 1980 1998
Border 13.9% 36.1%
North 1.9% 7.1%
Centre 33.7% 20.5%
Mexico City 45.9% 27.9%
Bajío/Pacific 4.6% 8.1%
South 0 0.5%
100% 100% Source: Author’s calculations based on data presented in economic censuses (INEGI 1981, 1999).
Table 4.15: Labour Concentration Index for the Mexican Automotive Industry, 1998
Source: Author’s calculations based on data presented in economic census (INEGI 1999).
CONCLUSION
What conclusions can be drawn from the data on the formation,
concentration and transformation of the automotive industry in Mexico?
Are there any grounds for suggesting that the automotive industry is
Rank State Concentration, 1998 1 Aguascalientes 2.593 2 Puebla 2.403 3 Coahuila 2.067 4 Querétaro 1.933 5 Mexico 1.819 6 Tamaulipas 1.518 7 Morelos 1.501 8 San Luis Potosí 1.266 9 Nuevo León 1.058
10 Chihuahua 0.761
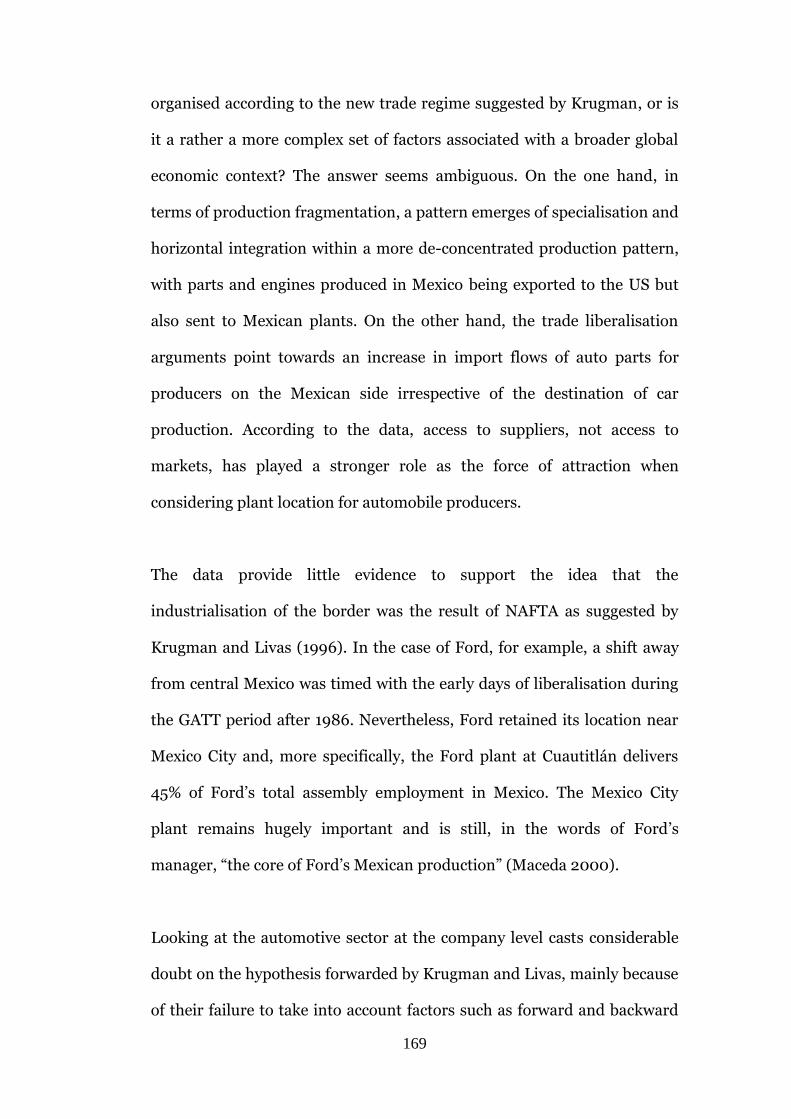
169
organised according to the new trade regime suggested by Krugman, or is
it a rather a more complex set of factors associated with a broader global
economic context? The answer seems ambiguous. On the one hand, in
terms of production fragmentation, a pattern emerges of specialisation and
horizontal integration within a more de-concentrated production pattern,
with parts and engines produced in Mexico being exported to the US but
also sent to Mexican plants. On the other hand, the trade liberalisation
arguments point towards an increase in import flows of auto parts for
producers on the Mexican side irrespective of the destination of car
production. According to the data, access to suppliers, not access to
markets, has played a stronger role as the force of attraction when
considering plant location for automobile producers.
The data provide little evidence to support the idea that the
industrialisation of the border was the result of NAFTA as suggested by
Krugman and Livas (1996). In the case of Ford, for example, a shift away
from central Mexico was timed with the early days of liberalisation during
the GATT period after 1986. Nevertheless, Ford retained its location near
Mexico City and, more specifically, the Ford plant at Cuautitlán delivers
45% of Ford’s total assembly employment in Mexico. The Mexico City
plant remains hugely important and is still, in the words of Ford’s
manager, “the core of Ford’s Mexican production” (Maceda 2000).
Looking at the automotive sector at the company level casts considerable
doubt on the hypothesis forwarded by Krugman and Livas, mainly because
of their failure to take into account factors such as forward and backward
170
linkages, the availability of skilled labour, physical infrastructure and even
factors such as social and political stability, most of which are scarce in the
border states of Mexico, as confirmed by trends in FDI. The results
presented in this chapter indicate that the industrial concentration of the
automotive industry has undergone gradual modifications since the 1960s
– and not dramatic shifts since the mid-1980s or after 1994 – although
economic liberalisation was a partial factor in these earlier changes. The
policies and programmes undertaken by successive federal governments
since the 1980s in pursuit of the promotion of export activities, and
especially the Maquiladora Programme, could claim some credit for
relocation patterns in Mexico. But this chapter has shown that these
programmes helped to consolidate a trend that had started in the 1960s
rather than the 1980s or 1990s.
Even so, one of the most important effects of economic liberalisation in the
automotive sector has been the regional re-concentration outside of the
central part of the country, where in addition to trade liberalisation other
less obvious factors have played an important role. All interviewees agreed
that these include, in descending order of importance: (1) availability of
physical infrastructure, (2) access to suppliers and a more efficient supply
of inputs from local contractors, (3) over-congestion in Central Mexico, (4)
labour shortages, (5) new long-term investments (and therefore
commitments from local authorities), and (6) access to markets.89 The
89 Although not as crucial, some of the interviewees mentioned federal, state and municipal tax incentives, including tax rebates and local tax exemptions such as the Impuesto Predial (Property Tax), or electricity (under state control), as playing a minor role in deciding whether to remain in a current location or to relocate.
171
huge investment made by leading companies in their current locations is
strong evidence of their commitment. Therefore, there is no evidence to
suggest that the spatial structure of manufacturing at state level will be
different in the near future. Within the new economic environment, not
only could labour costs be reduced, but also a wide range of new
production processes could be introduced to combine different economic
factors at a time of adjustment. These factors include: the development of
new (local) suppliers, low labour costs, lower infrastructure costs and the
right combination of national and international suppliers in order to take
advantage of cheaper options brought about by NAFTA.
172
Chapter Five: Transformation at the Sector Level: The Case of the Consumer Electronics Industry
OVERVIEW
This chapter presents a second case study in my analysis of the changes
brought by trade liberalisation or globalisation to the Mexican economy.
By looking at the performance of the consumer electronics sector, my
intention is to test Krugman’s ideas by exploring the association between
trade liberalisation and industrial location patterns for one of the most
dynamic industrial sectors in the world, a sector driven by constant
innovation and technological change. Specifically, I chose the consumer
electronics sector because it ranks top, along with the automotive industry,
in the Globality Index outlined in Chapter Three, and is the highest-ranked
sector in terms of global trade and investment according to national
statistics (BANCOMEXT 2000; Secretaria de Economía 2001). The fact
that in Mexico consumer electronics has been a highly dynamic sector,
both under ISI and since the beginning of the trade liberalisation process,
also made it a good candidate for a case study.
Data were gathered from the Sistema de Información Empresarial
Mexicana (SIEM, Mexican Enterprise Information System) on the top 100
companies in the consumer electronics sector, including subsectors ISIC
383206 (assembly of consumer electronics products) and ISIC 383204
173
(manufacturing and assembly of parts). The intention was to identify
location patterns by state and to see whether they are related to the
starting date of the company’s operations. The expectation was that a
significant majority of companies in this sector would be localised in the
US border states and that the start of operations date would be linked to
the different stages of the trade liberalisation process (over the 1980s and
1990s according to Krugman’s argument). A review of the economic
regulatory framework and policy actions affecting the consumer
electronics sector in Mexico was also conducted; this review looked for
associations between the regulatory framework and location decisions in
the consumer electronics sector, which in comparison to the automotive
sector could have been more directly influenced by policy and regulation as
this sector is less disaggregated into subsectors, with fewer inter-industry
networks and with a lesser degree of manufacturing value added in Mexico
than the automotive sector. A systematic review of the archives of the
Cámara Nacional de la Industria Electrónica y de Comunicaciones
Eléctricas (CANIECE, National Chamber of the Electronics and Electric
Communications Industries), predecessor of the Cámara Nacional de la
Industria Electrónica y de Telecomunicaciones y Tecnologías de la
Información (CANIETI, National Chamber of the Electronics Industry,
Telecommunications and Information Technology), was conducted,
looking for industry trends and particular company information.
The question underpinning this chapter is: to what extent has trade
liberalisation influenced the relocation of industrial activity in Mexico’s
consumer electronics sector? The case study tests Krugman’s hypothesis
174
that behind the decline of industrial manufacturing in Mexico City and the
concentration of industrial activity along the US border was the removal of
trade barriers that took place in Mexico over the 1980s and 1990s. I am
also interested in contrasting the findings against the alternative
hypothesis, that Mexico’s economic and spatial restructuring was not a
direct consequence of liberalisation of trade but a consequence of a
broader economic change associated with globalisation. In this regard I am
interested in following the post-decline process in order to understand the
extent to which de-concentration was spurred by the conditions set under
the new global economic environment. The first section of the chapter
outlines a series of key facts relating to the consumer electronics industry
at the global level before shifting the focus to Mexico and to Mexico City.
THE GLOBAL CONSUMER ELECTRONICS SECTOR
Consumer electronics constitutes one of the four main subsectors of the
electrical and electronics industry, according to the International Standard
Industrial Classification (ISIC 383).90 Consumer electronics (ISIC 3832)
includes audio products such as radio broadcast receivers, TV sets, VCRs,
DVD and CD players, portable audio equipment, in-car entertainment
systems and video cameras. Over the 1990s the bulk of the industry’s
production value was made up of colour TVs and VCRs.91
90 The other three are: electrical appliances and consumer products (white goods – ISIC 3827), industrial electronic equipment, which includes computers and communication systems (ISIC 3825), and electronic components and devices (ISIC 3833). 91 A number of professional items, including telephones and faxes, CD-based information systems and personal computers, are increasingly a part of the consumer electronics sector and in some national statistics are already considered to be so, although not in this particular analysis.
175
Before looking at production in more detail it should be noted that the
global trade in consumer electronics grew rapidly over the period covered
by this thesis, with above average rates of expansion, during the 1980s.
Over the study period, data suggest that OECD countries are the main
consumers, although their share decreased over the 1990s (OECD 2001a).
The major growth of consumer demand in the OECD area took place
during the 1960s and 1970s with the development of new technologies that
allowed mass production and the reduction of prices that followed.
Consumer growth in this sector increasingly came from developing
countries, especially those in South-East Asia, Latin America and the
Middle East (OECD 1992; 1994b; 1996a).
The production process itself consists of three principal stages. First, the
design stage, which is research-intensive. Indeed, the emergence of the
consumer electronics industry, usually dated from around 1947, is the
result of research aimed at developing radio sets and gramophones. A
fundamental technological breakthrough came with the development of
the transistor by a group of scientists at AT&T Bell Laboratories in Murray
Hill, New Jersey. 92 This allowed substantial reductions in product
dimensions and improved quality and productivity, and paved the way for
further innovations (Lucent 2001). It is worth noting that these
92 The transistor was the result of efforts to develop a better amplifier and a replacement for mechanical relays. The vacuum tube had amplified music and voice during the first half of the 20th century, and it had made long-distance calling practical, but it consumed a large amount of power, became hot when used and burned out rapidly. The telephone network required hundreds of thousands of relays to connect circuits together to complete calls. Cheaper to make than the vacuum tube and far more reliable, the transistor cut the cost and improved the quality of phone service and, seemingly overnight, spawned countless new products and whole new industries. Dr. John Bardeen, Dr. Walter Brattain and Dr. William Shockley discovered the transistor effect, and as a result were awarded the Nobel Prize in Physics in 1956 (Bell 2000).
176
innovations, originally intended for the consumer segment, have had other
increasingly widespread consumer and industrial applications, building
upon the increasing convergence between technologies as part of the
telecommunications revolution.
The second stage, the manufacture of components, is highly capital-
intensive and is subject to economies of scale and a high minimum
efficient scale of production. Components are essential for the production
of consumer electronics items.93 Parts and component manufacturing and
final assembly are often carried out in different locations by different
companies, and most of the time the high-value-added activities associated
with R&D and technological innovation in this sector are conducted by
leading TNCs in their main headquarters, the majority of them located in
East Asia. The third and final stage is assembly, which is the most labour-
intensive and lends itself most to the employment of large numbers of
unskilled workers, representing a very slim share of total value added in
this sector. Outsourcing is conducted mainly in less developed countries,
following the trends suggested by the international division of labour
scholars (Harvey et al. 2001; Massey 1995; Sturgeon 2003; Todd 1990).
Global production is highly concentrated, and the growing international
character of consumer electronics goods has been driven by the activities
of TNCs. Most consumer electronics are produced by companies from
developed countries, with Japan, the US and Western Europe together
93 Principally the production of semi-conductors, integrated circuits and cathode tubes (Sturgeon 2003).
177
accounting for 68% of production by value, estimated to be US$1.064
trillion in 2000. Japan was by far the largest producer, accounting for
32.3% of global output in 2000, followed by South Korea at 19.6% and the
US at 17.5%.94 The EU’s overall share at this time was around 27%. The
data also record the rapid annual growth of the sector at 7% between 1990
and 2000, making it one of the fastest-growing sectors of the global
economy. In absolute terms the sector ranked first in global exports for the
period, with growth from US$59 billion in 1990 to US$284 billion in
2000.95
A major shift between 1970 and 2000 was represented by the increasing
competitiveness of production from Japan and South-East Asia, which also
focused much earlier and more intensely than European and US producers
on consumer-oriented electronic goods. The US electronics industry was
the world leader in the mid-1950s in terms of output, employment,
technological invention and innovation, and international trade, with well-
known firms such as RCA, Zenith, Motorola, Admiral, Magnavox, General
Electric, Sylvania and Philco (Sobel 1993; Harvey et. al. 2001). Not far
behind were European firms such as Telefunken, ITT, Saba, Dual, Siemens
and Grundig in Germany; Ferguson, Thorn EMI and Warwick from the
UK; Bang & Olufsen from Denmark; Thomson and Oceanica of France;
Nokia from Finland; and Philips from the Netherlands. By the mid-1960s
Matsushita, Sony and Sanyo from Japan, and Taiwan’s Tatung, were
becoming better known and taking increased market share. This growth of
94 Author´s calculations using data from European Electronic Market Forecast 2000; OECD (2001b); UNCTAD Industrial database 2000. 95 Author´s calculations using data from OECD (2002); UNCTAD (2000).
178
firms from South-East Asia is more remarkable if we consider that in the
1960s most companies from the region lacked technological adaptation
and the ability to produce critical electronics components (Feenstra 1998).
At the time they required licensing agreements and joint ventures with US
and Western European companies. Nevertheless, from the mid-1960s it
was US and European manufacturers that were forced to rationalise, cut
jobs and concentrate on key production areas in order to compete. The
1970s saw a rapid expansion of Japanese and South Korean companies
locating to Europe and the US.96 In 1972, Sony was the first Japanese
company to assemble TVs in the US, followed by Tatung of Taiwan in 1976
and the first South Korean company, LG Electronics, in 1981 (Harvey et.
al. 2001; Steinfeld 2004; Sturgeon 2003). By the end of the 1980s there
were 32 Japanese-owned plants making or assembling electronic items in
the EU, 18 of which were in the UK. South Korea’s “big three” – LG
Electronics, Samsung and Daewoo – followed during the second half of the
1980s. In 1991 there were 68 Japanese and South Korean plants in the EU
(against 108 European firms), employing around one-sixth of the total
consumer electronics workforce. At the end of the 1990s the UK remained
the preferred European location of consumer electronics manufacturing
plants, followed by Germany, Spain and France (Electronics Times 1999;
Sturgeon 2002, 2003).
96 According to Harvey (1990), in the 1950s US companies failed to fully utilise transistors because they wanted to protect their investments in vacuum tubes. This paved the way for companies like Sony to make transistor radios. Throughout the 1960s the leading firms in the electronics distribution industry grew by acquisition. In its 1969 annual report, Arrow’s management sketched the future of the electronics distribution industry: it would soon be dominated by “those few substantial distribution companies with the financial resources, the professional management, and the modern control systems necessary to participate in the industry’s current consolidation phase” (Arrow Electronics 2001, p1).
179
According to Zampetti et al. (1994), the Japanese presence in European
markets was a reaction to restrictive trade policies such as those in the US
wherein government introduced minimum local content rules of 50% on
the assembly consumer electronics sector, designed to protect US
producers from Japanese competition. Darin (1996) adds that the
enormous increase in foreign investment was partly due also to the
imposition of anti-dumping duties by the US at the end of the 1980s
against cathode tubes imported from Japan, South Korea, Singapore and
Canada. A different view is taken by Todd (1990), who argues that the
strong Yen provided a powerful economic incentive for locating plants
offshore and taking advantage of the exchange rate. Japanese companies
began investing abroad much later than Philips. The industry leader
Matsushita, albeit admittedly quite a “conservative” firm, had been
particularly slow in shifting production abroad, at least until the mid-
1980s. In 1985 overseas production only accounted for 12% of its
worldwide sales, but this figure had reached 18% by 2003 (Sturgeon
2003).
Regardless of motive, however, Japanese firms not only relocated but also
quickly transformed the industry by combining economies of scale, lean
production techniques and design improvements driven by heavy R&D
investment.97 The establishment of large-scale component plants linked
via just-in-time procurement networks of owned, independent and semi-
independent suppliers operating under subcontract and original
equipment manufacturer (OEM) arrangements gave Japanese firms a
97 The bulk of Japanese R&D is carried out in Japan (Kazis 1988).
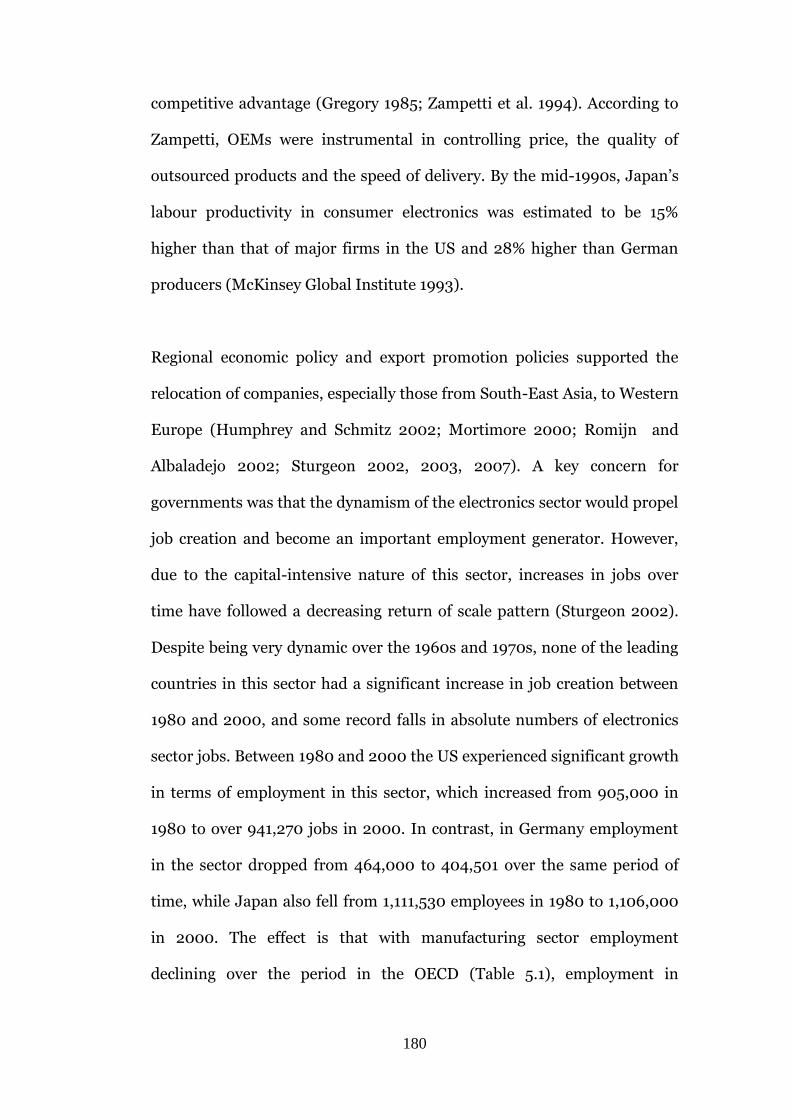
180
competitive advantage (Gregory 1985; Zampetti et al. 1994). According to
Zampetti, OEMs were instrumental in controlling price, the quality of
outsourced products and the speed of delivery. By the mid-1990s, Japan’s
labour productivity in consumer electronics was estimated to be 15%
higher than that of major firms in the US and 28% higher than German
producers (McKinsey Global Institute 1993).
Regional economic policy and export promotion policies supported the
relocation of companies, especially those from South-East Asia, to Western
Europe (Humphrey and Schmitz 2002; Mortimore 2000; Romijn and
Albaladejo 2002; Sturgeon 2002, 2003, 2007). A key concern for
governments was that the dynamism of the electronics sector would propel
job creation and become an important employment generator. However,
due to the capital-intensive nature of this sector, increases in jobs over
time have followed a decreasing return of scale pattern (Sturgeon 2002).
Despite being very dynamic over the 1960s and 1970s, none of the leading
countries in this sector had a significant increase in job creation between
1980 and 2000, and some record falls in absolute numbers of electronics
sector jobs. Between 1980 and 2000 the US experienced significant growth
in terms of employment in this sector, which increased from 905,000 in
1980 to over 941,270 jobs in 2000. In contrast, in Germany employment
in the sector dropped from 464,000 to 404,501 over the same period of
time, while Japan also fell from 1,111,530 employees in 1980 to 1,106,000
in 2000. The effect is that with manufacturing sector employment
declining over the period in the OECD (Table 5.1), employment in
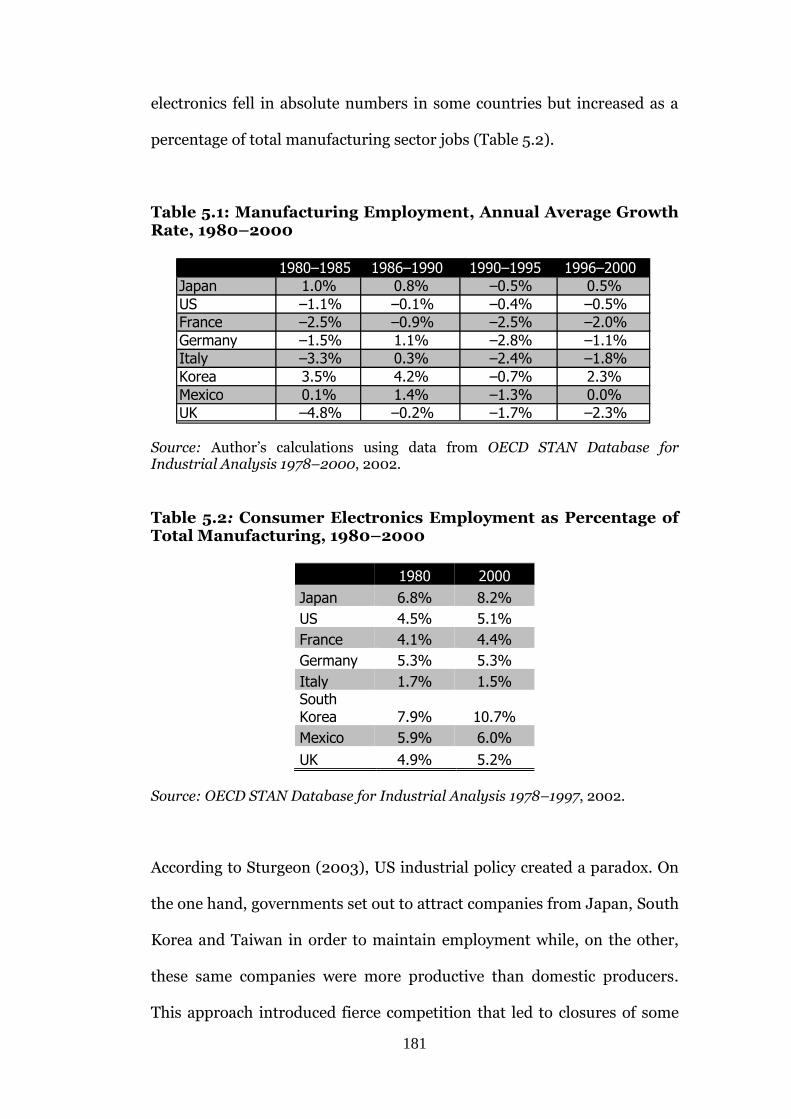
181
electronics fell in absolute numbers in some countries but increased as a
percentage of total manufacturing sector jobs (Table 5.2).
Table 5.1: Manufacturing Employment, Annual Average Growth Rate, 1980–2000
Source: Author’s calculations using data from OECD STAN Database for Industrial Analysis 1978–2000, 2002. Table 5.2: Consumer Electronics Employment as Percentage of Total Manufacturing, 1980–2000
1980 2000
Japan 6.8% 8.2%
US 4.5% 5.1%
France 4.1% 4.4%
Germany 5.3% 5.3%
Italy 1.7% 1.5% South Korea 7.9% 10.7%
Mexico 5.9% 6.0%
UK 4.9% 5.2%
Source: OECD STAN Database for Industrial Analysis 1978–1997, 2002.
According to Sturgeon (2003), US industrial policy created a paradox. On
the one hand, governments set out to attract companies from Japan, South
Korea and Taiwan in order to maintain employment while, on the other,
these same companies were more productive than domestic producers.
This approach introduced fierce competition that led to closures of some
Columna1 1980–1985 1986–1990 1990–1995 1996–2000 Japan 1.0% 0.8% –0.5% 0.5%
US –1.1% –0.1% –0.4% –0.5% France –2.5% –0.9% –2.5% –2.0%
Germany –1.5% 1.1% –2.8% –1.1% Italy –3.3% 0.3% –2.4% –1.8%
Korea 3.5% 4.2% –0.7% 2.3%
Mexico 0.1% 1.4% –1.3% 0.0% UK –4.8% –0.2% –1.7% –2.3%
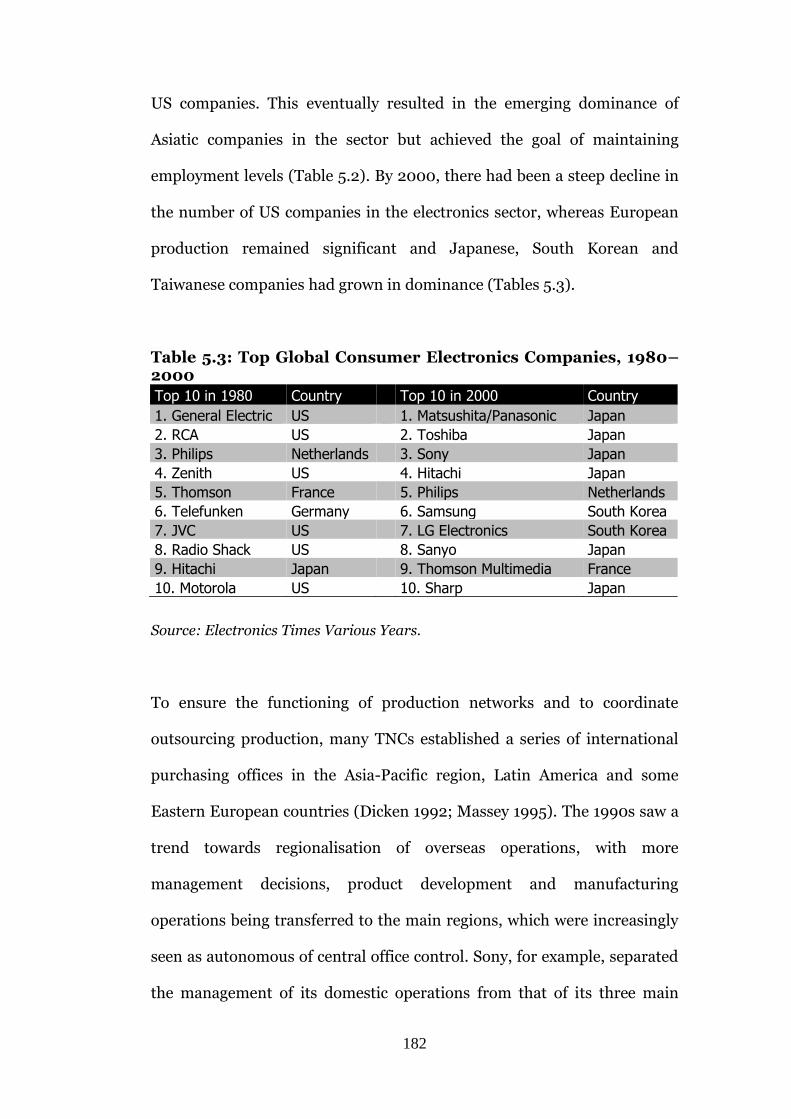
182
US companies. This eventually resulted in the emerging dominance of
Asiatic companies in the sector but achieved the goal of maintaining
employment levels (Table 5.2). By 2000, there had been a steep decline in
the number of US companies in the electronics sector, whereas European
production remained significant and Japanese, South Korean and
Taiwanese companies had grown in dominance (Tables 5.3).
Table 5.3: Top Global Consumer Electronics Companies, 1980–2000
Top 10 in 1980 Country Top 10 in 2000 Country
1. General Electric US 1. Matsushita/Panasonic Japan
2. RCA US 2. Toshiba Japan
3. Philips Netherlands 3. Sony Japan
4. Zenith US 4. Hitachi Japan
5. Thomson France 5. Philips Netherlands
6. Telefunken Germany 6. Samsung South Korea
7. JVC US 7. LG Electronics South Korea
8. Radio Shack US 8. Sanyo Japan
9. Hitachi Japan 9. Thomson Multimedia France
10. Motorola US 10. Sharp Japan
Source: Electronics Times Various Years.
To ensure the functioning of production networks and to coordinate
outsourcing production, many TNCs established a series of international
purchasing offices in the Asia-Pacific region, Latin America and some
Eastern European countries (Dicken 1992; Massey 1995). The 1990s saw a
trend towards regionalisation of overseas operations, with more
management decisions, product development and manufacturing
operations being transferred to the main regions, which were increasingly
seen as autonomous of central office control. Sony, for example, separated
the management of its domestic operations from that of its three main
183
markets, while Thomson and Matsushita adopted a tripolar system of
headquarters across Europe, North America and Asia (Electronics Times
1998 p. 21). Regionalisation also involved extensive restructuring, in
particular via M&As, resulting in the consolidation of a single production
system (see Figure 5.1). US and European producers were affected
significantly: virtually all US manufacturers in the consumer electronics
sector were taken over by either Japanese, South Korean or European
competitors. In 1974, Matsushita acquired the TV division of Motorola
(and its brand Quasar); Philips purchased Magnavox that same year and in
1980 bought the Sylvania and Philco brands. Thomson acquired
Nordmende, Saba, Dual and Telefunken between 1978 and 1983, and the
consumer electronics divisions of Thorn EMI and General Electric in 1987,
GE having absorbed RCA a year earlier. In 1984 Philips acquired Grundig
(Grundig had started operations in 1979), and in 1990 it bought a minority
stake in Bang & Olufsen. In 1987, Nokia became the third-largest
European consumer electronics company through the acquisition of shares
in Oceanica and ITT. In 1977 Sanyo acquired Warwick and in 1996 LG
Electronics purchased Zenith.98 By 1996, not one of the 27 US consumer
electronics producers that had existed in 1960 had survived.99
98 As will be discussed later, as a result of the Sanyo takeover all Warwick operating plants in Mexico were closed. This illustrates how an event beyond national boundaries can have effects in a distant location. 99 Author’s analysis of information from Electronic Forecast, various years; Reed Television Digest, various years; European Electronics Markets Forecast, various years.
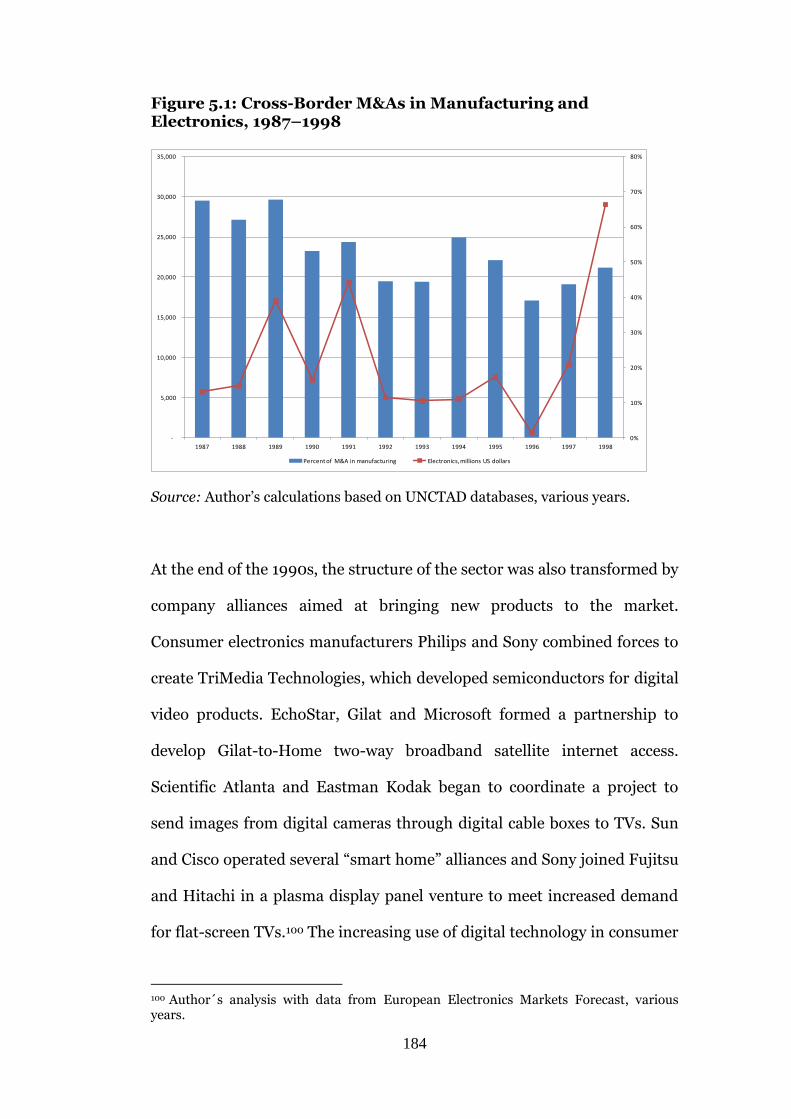
184
Figure 5.1: Cross-Border M&As in Manufacturing and Electronics, 1987–1998
0%
10%
20%
30%
40%
50%
60%
70%
80%
-
5,000
10,000
15,000
20,000
25,000
30,000
35,000
1987 1988 1989 1990 1991 1992 1993 1994 1995 1996 1997 1998
Percent of M&A in manufacturing Electronics, millions US dollars
Source: Author’s calculations based on UNCTAD databases, various years.
At the end of the 1990s, the structure of the sector was also transformed by
company alliances aimed at bringing new products to the market.
Consumer electronics manufacturers Philips and Sony combined forces to
create TriMedia Technologies, which developed semiconductors for digital
video products. EchoStar, Gilat and Microsoft formed a partnership to
develop Gilat-to-Home two-way broadband satellite internet access.
Scientific Atlanta and Eastman Kodak began to coordinate a project to
send images from digital cameras through digital cable boxes to TVs. Sun
and Cisco operated several “smart home” alliances and Sony joined Fujitsu
and Hitachi in a plasma display panel venture to meet increased demand
for flat-screen TVs.100 The increasing use of digital technology in consumer
100 Author´s analysis with data from European Electronics Markets Forecast, various years.
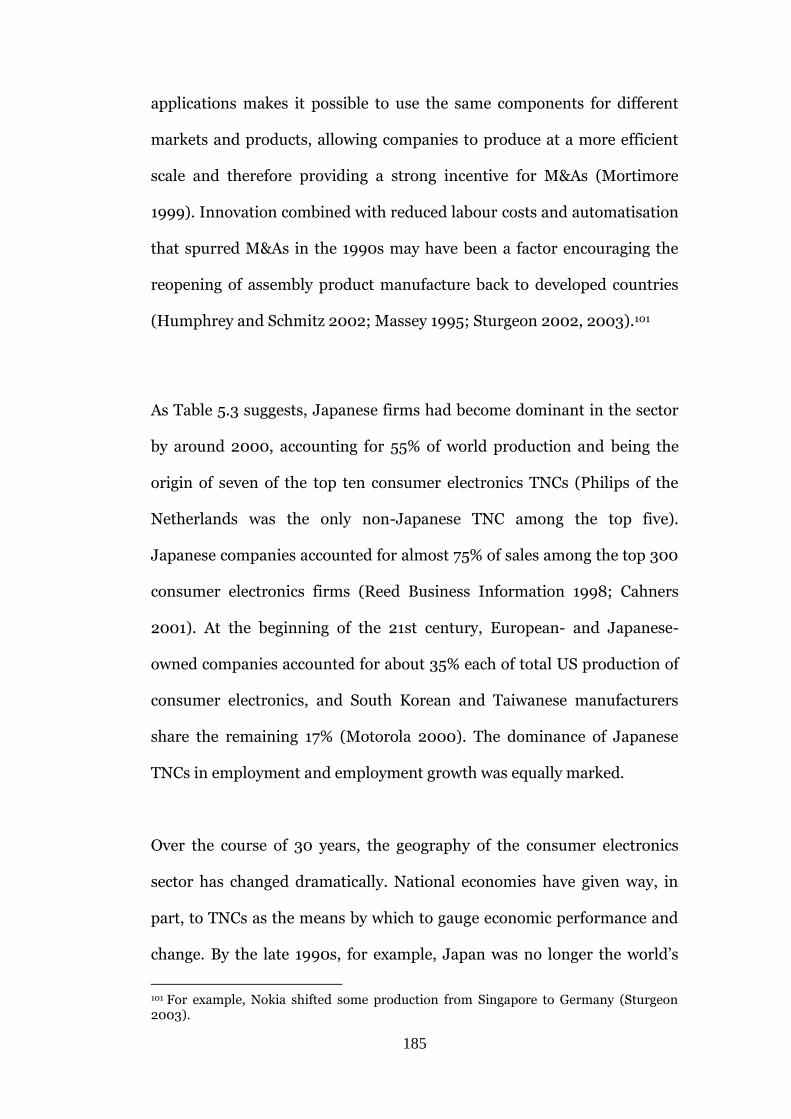
185
applications makes it possible to use the same components for different
markets and products, allowing companies to produce at a more efficient
scale and therefore providing a strong incentive for M&As (Mortimore
1999). Innovation combined with reduced labour costs and automatisation
that spurred M&As in the 1990s may have been a factor encouraging the
reopening of assembly product manufacture back to developed countries
(Humphrey and Schmitz 2002; Massey 1995; Sturgeon 2002, 2003).101
As Table 5.3 suggests, Japanese firms had become dominant in the sector
by around 2000, accounting for 55% of world production and being the
origin of seven of the top ten consumer electronics TNCs (Philips of the
Netherlands was the only non-Japanese TNC among the top five).
Japanese companies accounted for almost 75% of sales among the top 300
consumer electronics firms (Reed Business Information 1998; Cahners
2001). At the beginning of the 21st century, European- and Japanese-
owned companies accounted for about 35% each of total US production of
consumer electronics, and South Korean and Taiwanese manufacturers
share the remaining 17% (Motorola 2000). The dominance of Japanese
TNCs in employment and employment growth was equally marked.
Over the course of 30 years, the geography of the consumer electronics
sector has changed dramatically. National economies have given way, in
part, to TNCs as the means by which to gauge economic performance and
change. By the late 1990s, for example, Japan was no longer the world’s
101 For example, Nokia shifted some production from Singapore to Germany (Sturgeon 2003).
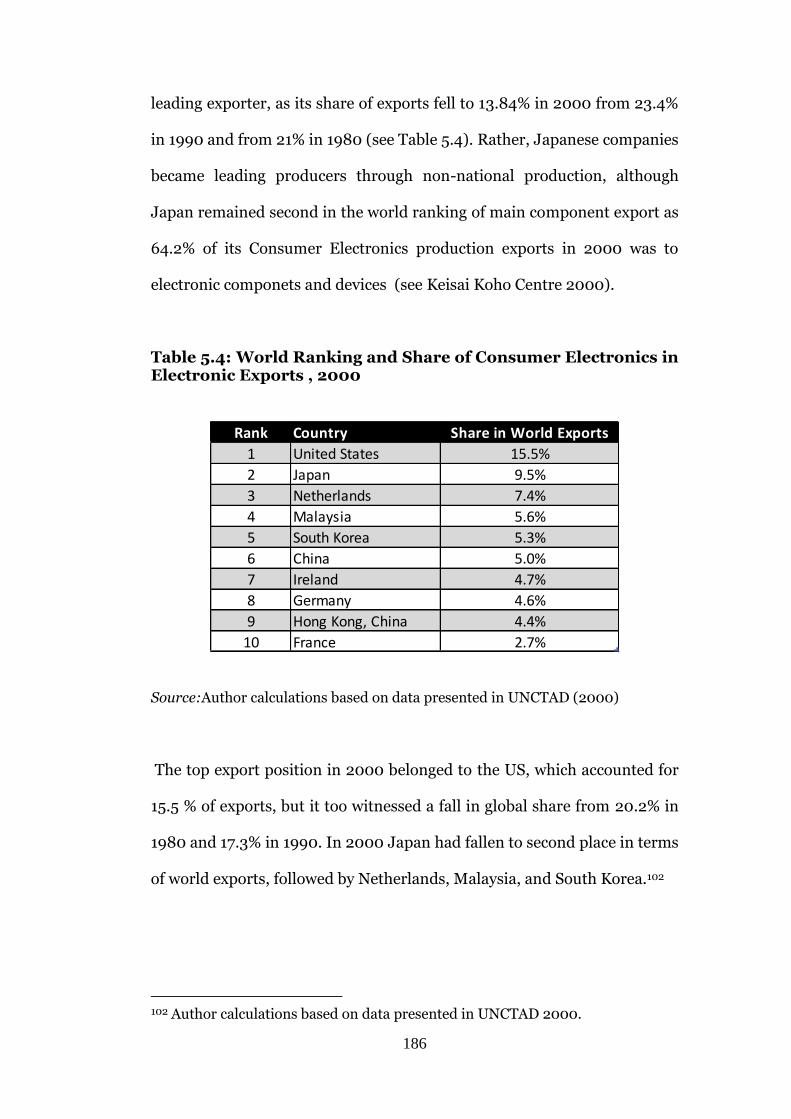
186
leading exporter, as its share of exports fell to 13.84% in 2000 from 23.4%
in 1990 and from 21% in 1980 (see Table 5.4). Rather, Japanese companies
became leading producers through non-national production, although
Japan remained second in the world ranking of main component export as
64.2% of its Consumer Electronics production exports in 2000 was to
electronic componets and devices (see Keisai Koho Centre 2000).
Table 5.4: World Ranking and Share of Consumer Electronics in Electronic Exports , 2000
Rank Country Share in World Exports
1 United States 15.5%
2 Japan 9.5%
3 Netherlands 7.4%
4 Malaysia 5.6%
5 South Korea 5.3%
6 China 5.0%
7 Ireland 4.7%
8 Germany 4.6%
9 Hong Kong, China 4.4%
10 France 2.7%
Source:Author calculations based on data presented in UNCTAD (2000)
The top export position in 2000 belonged to the US, which accounted for
15.5 % of exports, but it too witnessed a fall in global share from 20.2% in
1980 and 17.3% in 1990. In 2000 Japan had fallen to second place in terms
of world exports, followed by Netherlands, Malaysia, and South Korea.102
102 Author calculations based on data presented in UNCTAD 2000.
187
Rather, Asia as a whole was the leading export region, accounting for
47.3% of global exports, an increase from 45.9% in the early 1990s. Looked
at regionally, Europe was a distant second with 28.7% of global exports in
2000 (from 32% in 1990), followed by the NAFTA region with 18.2%.
These three regions together accounted for 94.2% of global exports in the
sector in 2000.103
THE CONSUMER ELECTRONICS INDUSTRY IN MEXICO
Consumer electronics production in Mexico began during the 1930s with
the assembly of radios. By the 1950s Mexican firms had started to
manufacture transistor radios and black-and-white TVs, and through the
1960s a large number of Mexican companies and TNCs emerged in the
electronics sector. The first TNC to set up production facilities in Mexico
City was General Electric in 1929, followed by RCA, which arrived in
1935.104 Most consumer electronics firms at this time were located near
Mexico City and primarily supplied the growing domestic market: during
the early 1970s, 85–90% of the total value of colour TV sales was produced
in Mexico (Nuñez 1990). Fairly atypical were companies such as Majestic,
which started production in 1957 as a conglomerate of 57 Mexican firms
located in and around Mexico City and became the largest Mexican
manufacturer of radios and TVs, selling products across Latin America
with parts sourced from throughout Mexico (Business Week 1970, p. 49).
103 All figures are author’s calculations from UNCTAD industrial database, 2000. Note: the EU shows the strongest concentration of regional trade within the consumer electronics sector, with 72.2% of total exports going to countries within the region. This is especially high compared with Asia, which has just 44.6%, and the NAFTA region’s 22.1% (authors analysis with data from UNCTAD 2000). 104 Author’s analysis from CANIEC annual reports, various years.
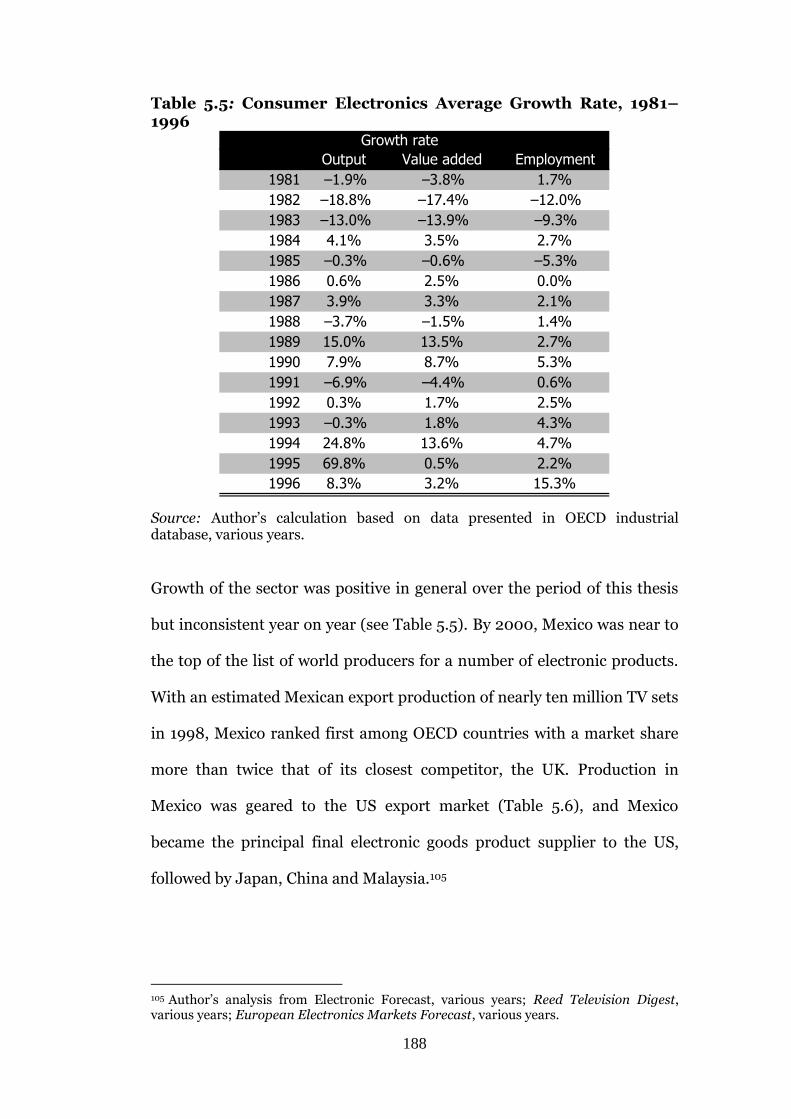
188
Table 5.5: Consumer Electronics Average Growth Rate, 1981–1996
Source: Author’s calculation based on data presented in OECD industrial database, various years.
Growth of the sector was positive in general over the period of this thesis
but inconsistent year on year (see Table 5.5). By 2000, Mexico was near to
the top of the list of world producers for a number of electronic products.
With an estimated Mexican export production of nearly ten million TV sets
in 1998, Mexico ranked first among OECD countries with a market share
more than twice that of its closest competitor, the UK. Production in
Mexico was geared to the US export market (Table 5.6), and Mexico
became the principal final electronic goods product supplier to the US,
followed by Japan, China and Malaysia.105
105 Author’s analysis from Electronic Forecast, various years; Reed Television Digest, various years; European Electronics Markets Forecast, various years.
Output Value added Employment
1981 –1.9% –3.8% 1.7%
1982 –18.8% –17.4% –12.0%
1983 –13.0% –13.9% –9.3%
1984 4.1% 3.5% 2.7%
1985 –0.3% –0.6% –5.3%
1986 0.6% 2.5% 0.0%
1987 3.9% 3.3% 2.1%
1988 –3.7% –1.5% 1.4%
1989 15.0% 13.5% 2.7%
1990 7.9% 8.7% 5.3%
1991 –6.9% –4.4% 0.6%
1992 0.3% 1.7% 2.5%
1993 –0.3% 1.8% 4.3%
1994 24.8% 13.6% 4.7%
1995 69.8% 0.5% 2.2%
1996 8.3% 3.2% 15.3%
Growth rate
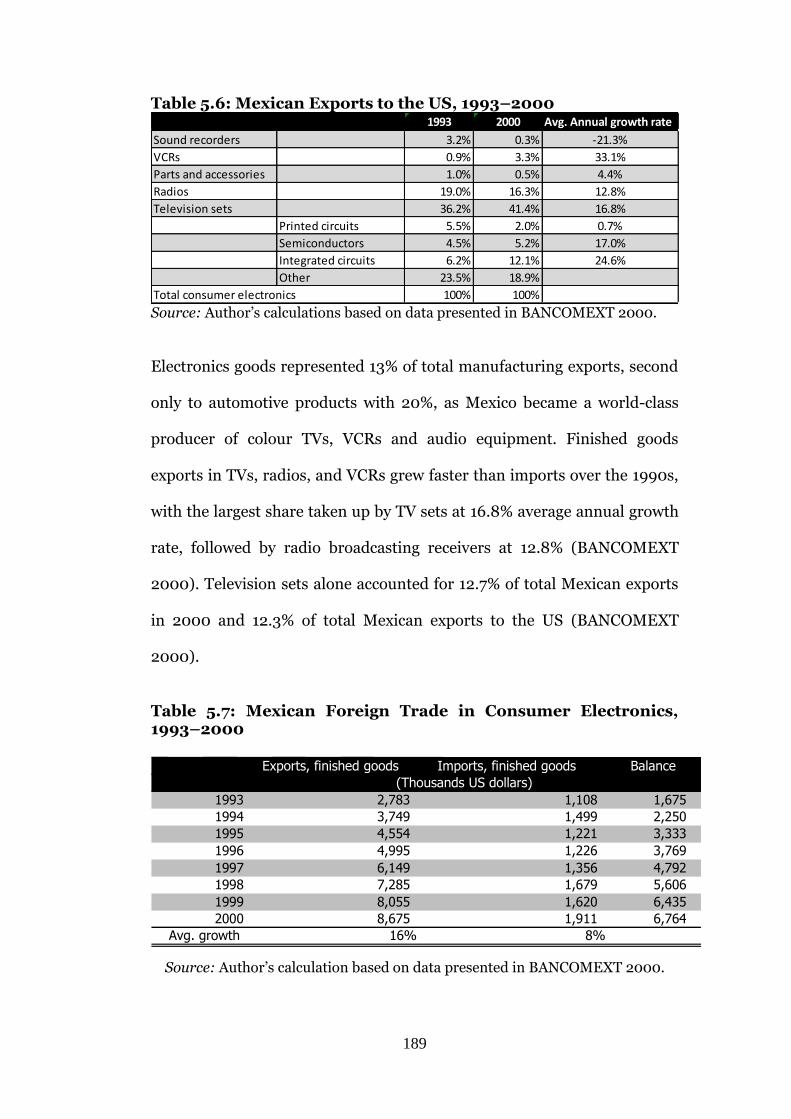
189
Table 5.6: Mexican Exports to the US, 1993–2000 1993 2000 Avg. Annual growth rate
Sound recorders 3.2% 0.3% -21.3%
VCRs 0.9% 3.3% 33.1%
Parts and accessories 1.0% 0.5% 4.4%
Radios 19.0% 16.3% 12.8%
Television sets 36.2% 41.4% 16.8%
Printed circuits 5.5% 2.0% 0.7%
Semiconductors 4.5% 5.2% 17.0%
Integrated circuits 6.2% 12.1% 24.6%
Other 23.5% 18.9%
Total consumer electronics 100% 100% Source: Author’s calculations based on data presented in BANCOMEXT 2000.
Electronics goods represented 13% of total manufacturing exports, second
only to automotive products with 20%, as Mexico became a world-class
producer of colour TVs, VCRs and audio equipment. Finished goods
exports in TVs, radios, and VCRs grew faster than imports over the 1990s,
with the largest share taken up by TV sets at 16.8% average annual growth
rate, followed by radio broadcasting receivers at 12.8% (BANCOMEXT
2000). Television sets alone accounted for 12.7% of total Mexican exports
in 2000 and 12.3% of total Mexican exports to the US (BANCOMEXT
2000).
Table 5.7: Mexican Foreign Trade in Consumer Electronics, 1993–2000
Source: Author’s calculation based on data presented in BANCOMEXT 2000.
Exports, finished goods Imports, finished goods Balance
1993 2,783 1,108 1,675 1994 3,749 1,499 2,250 1995 4,554 1,221 3,333 1996 4,995 1,226 3,769 1997 6,149 1,356 4,792 1998 7,285 1,679 5,606 1999 8,055 1,620 6,435 2000 8,675 1,911 6,764
Avg. growth 16% 8%
(Thousands US dollars)
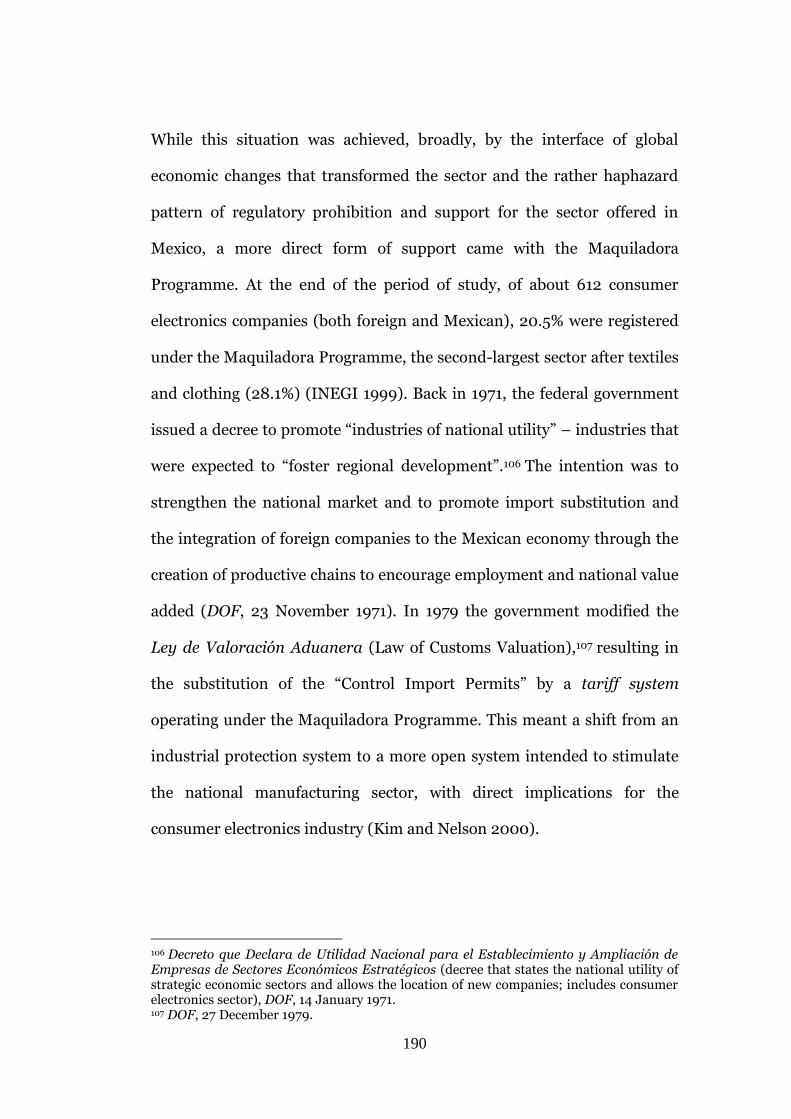
190
While this situation was achieved, broadly, by the interface of global
economic changes that transformed the sector and the rather haphazard
pattern of regulatory prohibition and support for the sector offered in
Mexico, a more direct form of support came with the Maquiladora
Programme. At the end of the period of study, of about 612 consumer
electronics companies (both foreign and Mexican), 20.5% were registered
under the Maquiladora Programme, the second-largest sector after textiles
and clothing (28.1%) (INEGI 1999). Back in 1971, the federal government
issued a decree to promote “industries of national utility” – industries that
were expected to “foster regional development”.106 The intention was to
strengthen the national market and to promote import substitution and
the integration of foreign companies to the Mexican economy through the
creation of productive chains to encourage employment and national value
added (DOF, 23 November 1971). In 1979 the government modified the
Ley de Valoración Aduanera (Law of Customs Valuation),107 resulting in
the substitution of the “Control Import Permits” by a tariff system
operating under the Maquiladora Programme. This meant a shift from an
industrial protection system to a more open system intended to stimulate
the national manufacturing sector, with direct implications for the
consumer electronics industry (Kim and Nelson 2000).
106 Decreto que Declara de Utilidad Nacional para el Establecimiento y Ampliación de Empresas de Sectores Económicos Estratégicos (decree that states the national utility of strategic economic sectors and allows the location of new companies; includes consumer electronics sector), DOF, 14 January 1971. 107 DOF, 27 December 1979.
191
In fact, according to a 1981 CANIECE report this modification of the trade
policy hit the consumer electronics industry because import permits under
the Maquiladora Programme were granted for some products that were
manufactured nationally. Subsequently, representatives of the consumer
electronics sector (Luis Vera-Vallejo, president of CANIECE) filed a
request to the government asking it to modify the tariff policy with an
increase reduction in the import taxes to several tariffs that affected
consumer electronics supply. The aim was to reduce foreign inputs to a
minimum and to allow only those products for which supply chains were
insufficient. According to a 1981 CANIECE report the electronic industry
was “in a very deep crisis”, without enough proper supply, subject to unfair
competition against foreign products and on its way to collapse:
The macroeconomic policies of the 1970s left Mexico’s electronics sector highly vulnerable to internal and external conditions. These conditions have sharply turned against all manufacturing products produced in Mexico in the early 1980s, and caused the worst decline in the electronic sector, particularly of those companies relying upon foreign supplies. At the beginning of the 1980s, the manufacturing sector faces higher interest rates, rising inflation, a chronically devalued peso (affecting imports), and a deteriorating demand for Mexican products in Mexico as the result of unfair commercial practices to foreign products imported with the support of an insensitive government trade policy. This disequilibrium, along with the virtual disappearance of complete chains of production, has placed in jeopardy this sector’s future within the Mexican economy. (CANIECE 1981, p. 5)
As these takeovers were of companies that had become established in
Mexico City, at a time when production was dedicated mostly to the
national market and relied on local clusters for the supply of parts, and in
the midst of an economic downturn, their closure hit the consumer
electronics cluster in Mexico City hard (AMIE 2001). By the late 1980s
192
only 25% of the original audio manufacturers and 47% of video equipment
makers continued to produce for the domestic market. Some surviving
firms were forced out of manufacturing altogether and focused instead on
assembly and distribution of imported Asian products (Harvey et al.
2001).
In response to pressure from the (Mexican) private sector and in
preparation for Mexico’s joining the GATT, the federal government
initiated a number of important reforms to the maquiladora rules in 1984
(Sklair 1993). In that year, the total value of imports in the consumer
electronics sector under tariffs and permits was reduced from 100% to
55%. A transitional period for reduction of tariffs was implemented in four
stages, starting with a maximum 74.8% tariff in 1984 and ending in 1988
with a maximum import tariff of 14.1% (SECOFI 1992).108
Particularly important was considered the decree which allowed
maquiladoras to sell up to 20% of their national production to the national
market – this decree had the most detrimental effect on the “traditional
nationally oriented Mexican electronics industry” as it accelerated the
dismantling of the traditional consumer electronics industry that was by
then in severe crisis and facilitated the transformation into the new export-
oriented consumer electronics sector (Fernández 1989; Sklair 1993).109
Over the 1990s approximately one-third of all maquiladora plants were
engaged in some form of electronics production, with most being foreign-
108 As part of the GATT, Mexico set a maximum trade tariff of 50% from 1986. 109 Decreto que Regula la Maquila de Exportación, DOF, 15 August 1983.
193
owned and absorbing a large part of the increase in FDI in the electronics
sector, which rose from US$3.044 billion in 1988 to US$45.355 billion in
2000 (Banxico 2000). The initial investments in consumer electronics
maquiladoras were made by US companies: in 1971 Mexico hosted 293
predominantly US-owned maquiladora plants and in 1978 there were 540,
of which 32% were in the electrical/electronics industries (Fernández
1989).
An important wave of US companies entered Mexico over the 1960s as the
result of the Maquiladora Programme. American electronics companies
were using Mexico to manufacture products more economically and escape
the high-labour market in the US. According to Weber (1969), low-cost
labour competitive with that in Asia and Europe was the key reason
leading US manufacturers to “flood” Mexico with financial, technical and
production personnel in order to boost their production bellow the border.
Proximity to the Mexican border, particularly to Tijuana and Mexicali and to their low-cost labor market yelled the marriage between US companies and American-financially supported but Mexican-owned firms. Many view Mexico’s industrialization as a three-step process involving: 1) American capital investment 2) Infusion of Mexican capital into firms started by Americans; 3) American technical and production advisers and consultants training Mexican labor… (Weber 1969, p. 8)
The use of OEMs further enhanced the cost advantages of Mexico,
especially as the electronics sector began to adopt system-level or so-called
“box-built” services. System-level final assembly processes are very labour-
intensive and rely on direct-order fulfilment, which fits well with Mexico’s
194
strength as a low-cost manufacturing base and proximity to the US. Box
5.1 describes the organisation of an OEM in Nuevo Laredo, Tamaulipas.
Data show that these cost regimes provided maquiladoras with
increasingly high productivity levels, a fact also confirmed in interviews
with Mexican OEM producers (Couttolenc 2000; Hidalgo 2000; Mata
2000).
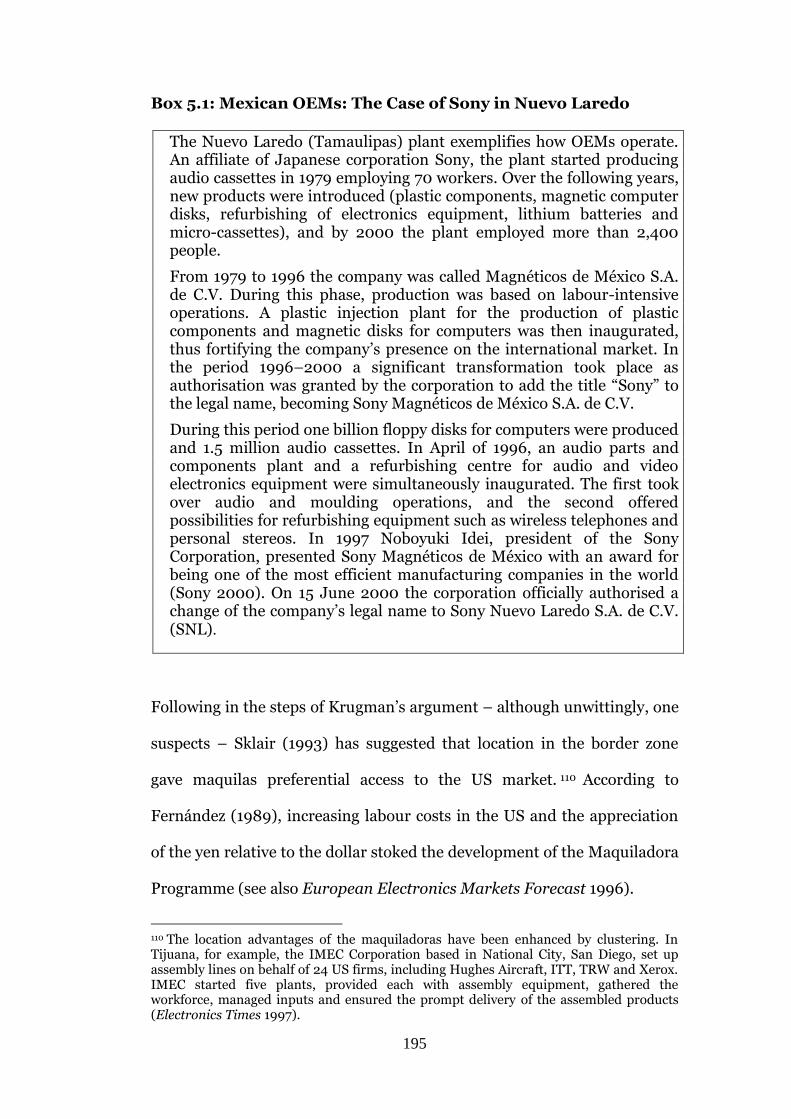
195
Box 5.1: Mexican OEMs: The Case of Sony in Nuevo Laredo
The Nuevo Laredo (Tamaulipas) plant exemplifies how OEMs operate. An affiliate of Japanese corporation Sony, the plant started producing audio cassettes in 1979 employing 70 workers. Over the following years, new products were introduced (plastic components, magnetic computer disks, refurbishing of electronics equipment, lithium batteries and micro-cassettes), and by 2000 the plant employed more than 2,400 people.
From 1979 to 1996 the company was called Magnéticos de México S.A. de C.V. During this phase, production was based on labour-intensive operations. A plastic injection plant for the production of plastic components and magnetic disks for computers was then inaugurated, thus fortifying the company’s presence on the international market. In the period 1996–2000 a significant transformation took place as authorisation was granted by the corporation to add the title “Sony” to the legal name, becoming Sony Magnéticos de México S.A. de C.V.
During this period one billion floppy disks for computers were produced and 1.5 million audio cassettes. In April of 1996, an audio parts and components plant and a refurbishing centre for audio and video electronics equipment were simultaneously inaugurated. The first took over audio and moulding operations, and the second offered possibilities for refurbishing equipment such as wireless telephones and personal stereos. In 1997 Noboyuki Idei, president of the Sony Corporation, presented Sony Magnéticos de México with an award for being one of the most efficient manufacturing companies in the world (Sony 2000). On 15 June 2000 the corporation officially authorised a change of the company’s legal name to Sony Nuevo Laredo S.A. de C.V. (SNL).
Following in the steps of Krugman’s argument – although unwittingly, one
suspects – Sklair (1993) has suggested that location in the border zone
gave maquilas preferential access to the US market. 110 According to
Fernández (1989), increasing labour costs in the US and the appreciation
of the yen relative to the dollar stoked the development of the Maquiladora
Programme (see also European Electronics Markets Forecast 1996).
110 The location advantages of the maquiladoras have been enhanced by clustering. In Tijuana, for example, the IMEC Corporation based in National City, San Diego, set up assembly lines on behalf of 24 US firms, including Hughes Aircraft, ITT, TRW and Xerox. IMEC started five plants, provided each with assembly equipment, gathered the workforce, managed inputs and ensured the prompt delivery of the assembled products (Electronics Times 1997).
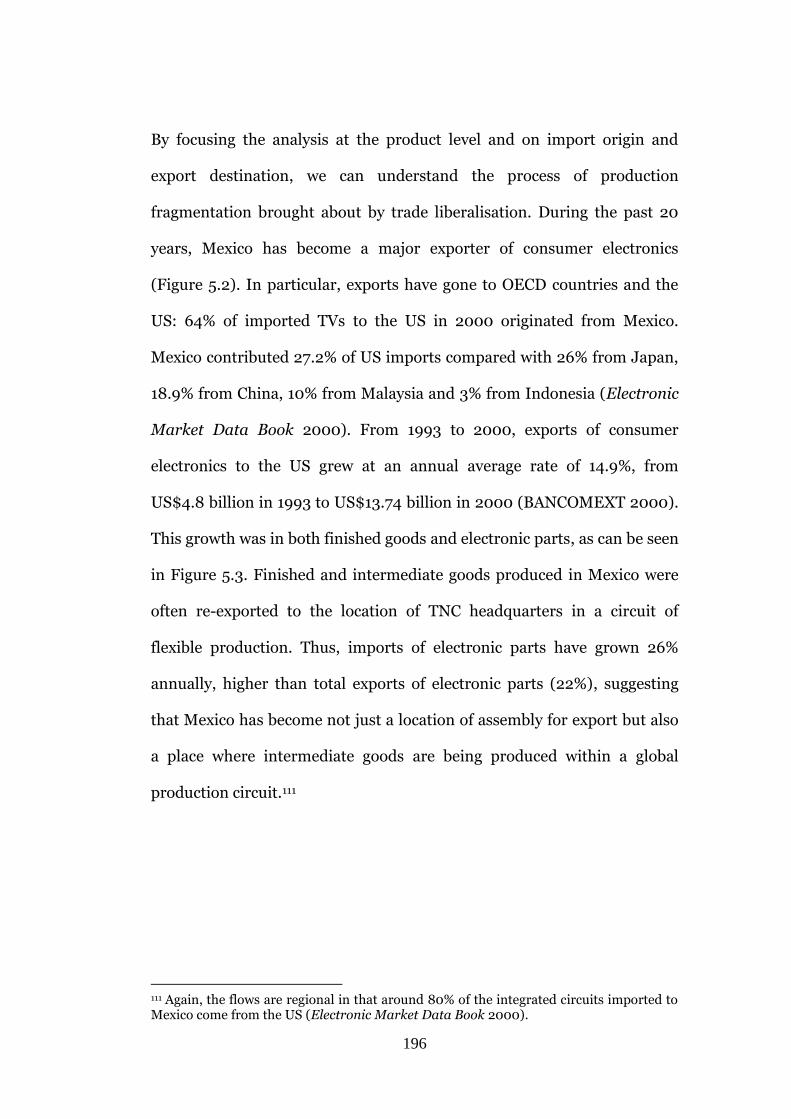
196
By focusing the analysis at the product level and on import origin and
export destination, we can understand the process of production
fragmentation brought about by trade liberalisation. During the past 20
years, Mexico has become a major exporter of consumer electronics
(Figure 5.2). In particular, exports have gone to OECD countries and the
US: 64% of imported TVs to the US in 2000 originated from Mexico.
Mexico contributed 27.2% of US imports compared with 26% from Japan,
18.9% from China, 10% from Malaysia and 3% from Indonesia (Electronic
Market Data Book 2000). From 1993 to 2000, exports of consumer
electronics to the US grew at an annual average rate of 14.9%, from
US$4.8 billion in 1993 to US$13.74 billion in 2000 (BANCOMEXT 2000).
This growth was in both finished goods and electronic parts, as can be seen
in Figure 5.3. Finished and intermediate goods produced in Mexico were
often re-exported to the location of TNC headquarters in a circuit of
flexible production. Thus, imports of electronic parts have grown 26%
annually, higher than total exports of electronic parts (22%), suggesting
that Mexico has become not just a location of assembly for export but also
a place where intermediate goods are being produced within a global
production circuit.111
111 Again, the flows are regional in that around 80% of the integrated circuits imported to Mexico come from the US (Electronic Market Data Book 2000).
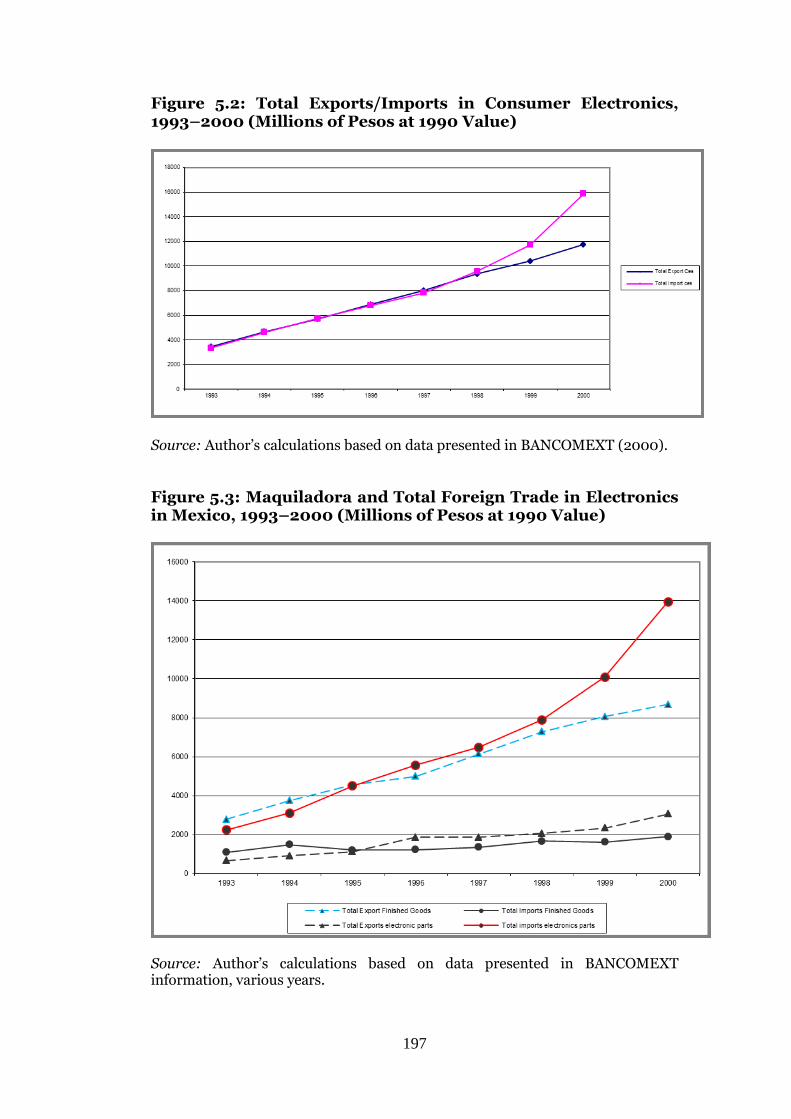
197
Figure 5.2: Total Exports/Imports in Consumer Electronics, 1993–2000 (Millions of Pesos at 1990 Value)
Source: Author’s calculations based on data presented in BANCOMEXT (2000).
Figure 5.3: Maquiladora and Total Foreign Trade in Electronics in Mexico, 1993–2000 (Millions of Pesos at 1990 Value)
Source: Author’s calculations based on data presented in BANCOMEXT information, various years.
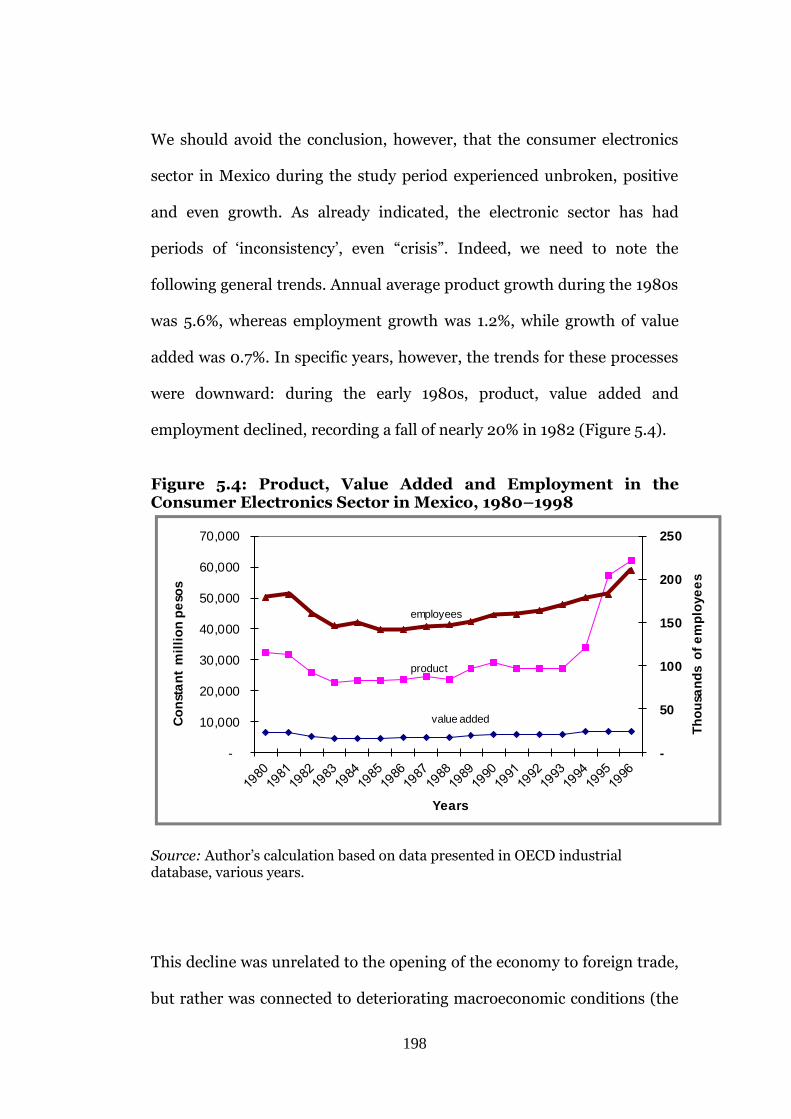
198
We should avoid the conclusion, however, that the consumer electronics
sector in Mexico during the study period experienced unbroken, positive
and even growth. As already indicated, the electronic sector has had
periods of ‘inconsistency’, even “crisis”. Indeed, we need to note the
following general trends. Annual average product growth during the 1980s
was 5.6%, whereas employment growth was 1.2%, while growth of value
added was 0.7%. In specific years, however, the trends for these processes
were downward: during the early 1980s, product, value added and
employment declined, recording a fall of nearly 20% in 1982 (Figure 5.4).
Figure 5.4: Product, Value Added and Employment in the Consumer Electronics Sector in Mexico, 1980–1998
-
50
100
150
200
250
-
10,000
20,000
30,000
40,000
50,000
60,000
70,000
Th
ou
san
ds
of
em
plo
ye
es
Co
nst
an
t m
illi
on
pe
sos
Years
employees
product
value added
Source: Author’s calculation based on data presented in OECD industrial database, various years.
This decline was unrelated to the opening of the economy to foreign trade,
but rather was connected to deteriorating macroeconomic conditions (the
199
debt and oil crises of the 1970s and 1980s) and a more general crisis of the
ISI model. The sector’s performance moved up and down between 1984
and 1988 and was at almost 15% in 1989.112 While still showing some
volatility, the sector posted positive growth rates between 1990 and 2000,
especially in employment and output, and in 1995 the growth rate for
product value was 69.8%, boosted by the devaluation of the peso.
If we interpret these data we might note that value added has remained far
more stable than the general increase in product (value of production).
The most likely explanations are, on the one hand, the lack of a vertically
integrated industry, and on the other, the maquiladora mode of production
that provides producers with incentives to keep the Mexican value-added
component as low as possible as it is only the value added in Mexico that is
liable to taxation at the moment of re-export. Hence in most years the
value of total imports is almost equal to that of total exports, and since
1998 imports have surpassed exports, creating the first trade deficit in
consumer electronics.113 This shift might partly be explained by a reform of
maquiladora regulations that allows companies to sell part of their
production to the national market.114
112 Author’s calculations based upon data presented in economic censuses (INEGI various years). 113 Author’s calculations based on data presented in BANCOMEXT 2000. 114 Two notes of caution are required about the quality of data on the maquiladoras. First, with so many reforms affecting the sector – for example, allowing companies beyond the border industrial zone to enjoy the benefits of the Maquiladora Programme – it is difficult to measure change over time as geographical boundaries have expanded and existing plants have re-registered as maquiladoras. Guadalajara has become the hottest spot in Mexico for electronics manufacturing, with companies possibly attracted by the infrastructure, a qualified workforce and a customer base (CANACINTRA 2000). Second, companies have reorganised to capture the various federal benefits on offer. One manager interviewed confirmed that his plant of 2,000 employees was working under four different legal names in order to draw down different incentives (Couttolenc 2000). He confirmed that this strategy generated duplications in economic census surveys.
200
THE CONSUMER ELECTRONICS SECTOR AND MEXICO CITY’S INDUSTRIAL
DE-CONCENTRATION
During the 1980s, TNCs that already had a presence in Mexico began a
restructuring process to improve their existing production facilities and
build new ones, a situation that led to the de-concentration of the
consumer electronics industry. Leading companies including Panasonic,
Sony and Philips expanded operations and adjusted to the new economic
environment. At the same time, new TNCs began to arrive in Mexico. In
order to assess the consumer electronics market and how companies
reacted to the changing economic environment, I analysed the sector in
three different ways. First, regional concentration at the beginning and
then at the end of the 20-year research time span were explored. Second, I
looked at location patterns for the top 100 companies in the sector
according to SIEM (SECOFI 2000) to see if they were related to trade
liberalisation. Finally, I examined specific companies at the top of the
hierarchy with the aim of identifying the reaction to the new economic
environment and drew conclusions from these three different perspectives.
Looking at regional concentration, from 1980 to 1985 the consumer
electronics sector went from being concentrated in 11 states to having a
presence in 15 in 1993, and in 23 by 1998. 115 In 1980, 91.5% of the
assembly of consumer electronics products (ISIC 383204) was
concentrated in Mexico City and the State of Mexico, while Tamaulipas
and Chihuahua, both border states, ranked first and second in terms of
electronic parts manufacturing concentration (ISIC 383206). There were
115 Author’s calculations based on SIEM (SECOFI 2000).
201
no assembly plants at that time in any of the border states apart from
Tamaulipas, although this state had only minimal participation in
assembly and parts manufacturing (a situation that would change
dramatically), suggesting that its position was the result of the integration
of the consumer electronics parts industry with its US counterpart.
In employment terms, Mexico City, the State of Mexico, Tamaulipas and
Chihuahua accounted for 79.5% of total employment in 1980.116 By the end
of the 1990s, by contrast, 77.6% of total employment in electronic parts
production (ISIC 383206) was concentrated in the border states. This
situation meant that by 1985, Mexico City had fallen in the employment
concentration ranking within the sector from first to fourth place.117 This
trend continued between 1985 and 1993, with Baja California and Nuevo
León recording the highest growth rates as Mexico City and the State of
Mexico followed a downward path in consumer electronics employment.
By 1993, the supremacy of the border states in consumer electronics
employment terms was becoming clear. Chihuahua, Baja California,
Tamaulipas and Sonora accounted for 76.5% of total employment, with
Mexico City in fifth place registering a modest 6.9% of national
employment and the State of Mexico ranking sixth with 4.7%.
In terms of both company location and employment, therefore, the
relocation of the consumer electronics industry started long before the 116 Figures in this paragraph refer to author calculation based upon data presented in economic censuses (INEGI various years). 117 According to Garza (1980), in the early 1970s consumer electronics manufacturing was the third-ranked industry in terms of output in Mexico City with 6% of total DF output, only surpassed by chemical product manufacturing (15.1%) and the automotive industry (7.6%).
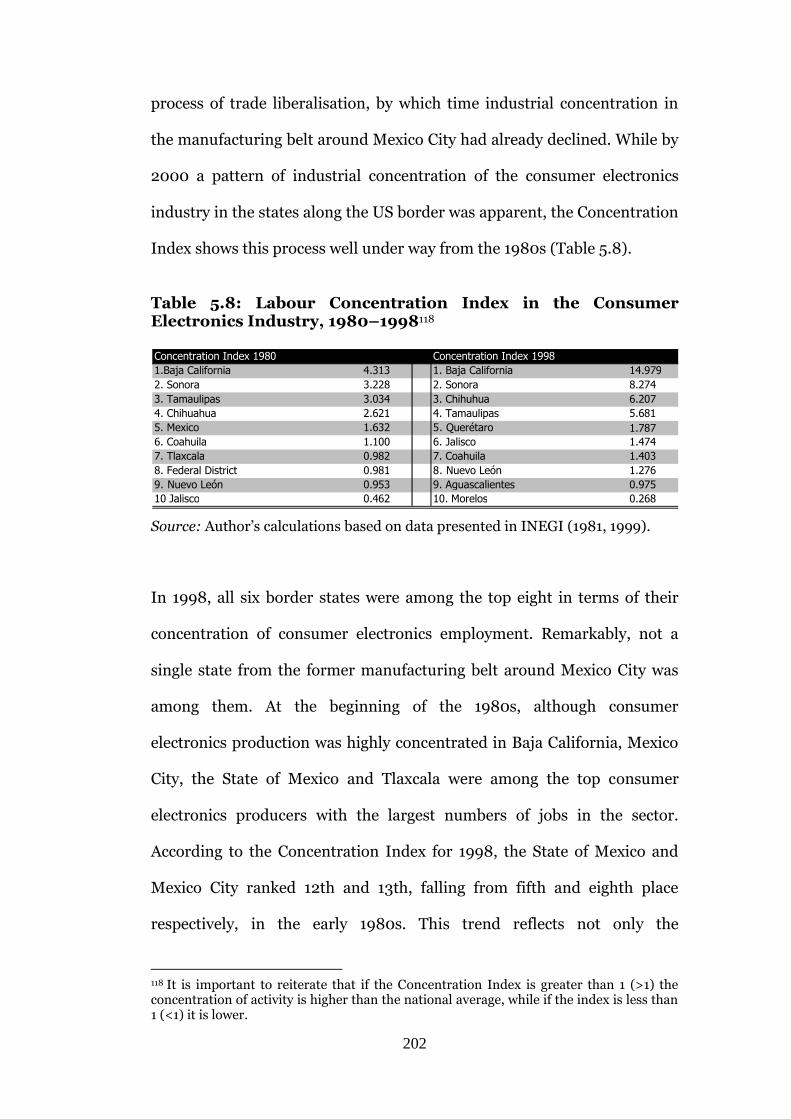
202
process of trade liberalisation, by which time industrial concentration in
the manufacturing belt around Mexico City had already declined. While by
2000 a pattern of industrial concentration of the consumer electronics
industry in the states along the US border was apparent, the Concentration
Index shows this process well under way from the 1980s (Table 5.8).
Table 5.8: Labour Concentration Index in the Consumer Electronics Industry, 1980–1998118
Source: Author’s calculations based on data presented in INEGI (1981, 1999).
In 1998, all six border states were among the top eight in terms of their
concentration of consumer electronics employment. Remarkably, not a
single state from the former manufacturing belt around Mexico City was
among them. At the beginning of the 1980s, although consumer
electronics production was highly concentrated in Baja California, Mexico
City, the State of Mexico and Tlaxcala were among the top consumer
electronics producers with the largest numbers of jobs in the sector.
According to the Concentration Index for 1998, the State of Mexico and
Mexico City ranked 12th and 13th, falling from fifth and eighth place
respectively, in the early 1980s. This trend reflects not only the
118 It is important to reiterate that if the Concentration Index is greater than 1 (>1) the concentration of activity is higher than the national average, while if the index is less than 1 (<1) it is lower.
Concentration Index 1980 Concentration Index 1998 1.Baja California 4.313 1. Baja California 14.979 2. Sonora 3.228 2. Sonora 8.274 3. Tamaulipas 3.034 3. Chihuhua 6.207 4. Chihuahua 2.621 4. Tamaulipas 5.681 5. Mexico 1.632 5 . Querétaro 1.787 6. Coahuila 1.100 6. Jalisco 1.474 7. Tlaxcala 0.982 7. Coahuila 1.403 8. Federal District 0.981 8 . Nuevo León 1.276 9 . Nuevo León 0.953 9. Aguascalientes 0.975 10 Jalisco 0.462 10. Morelos 0.268
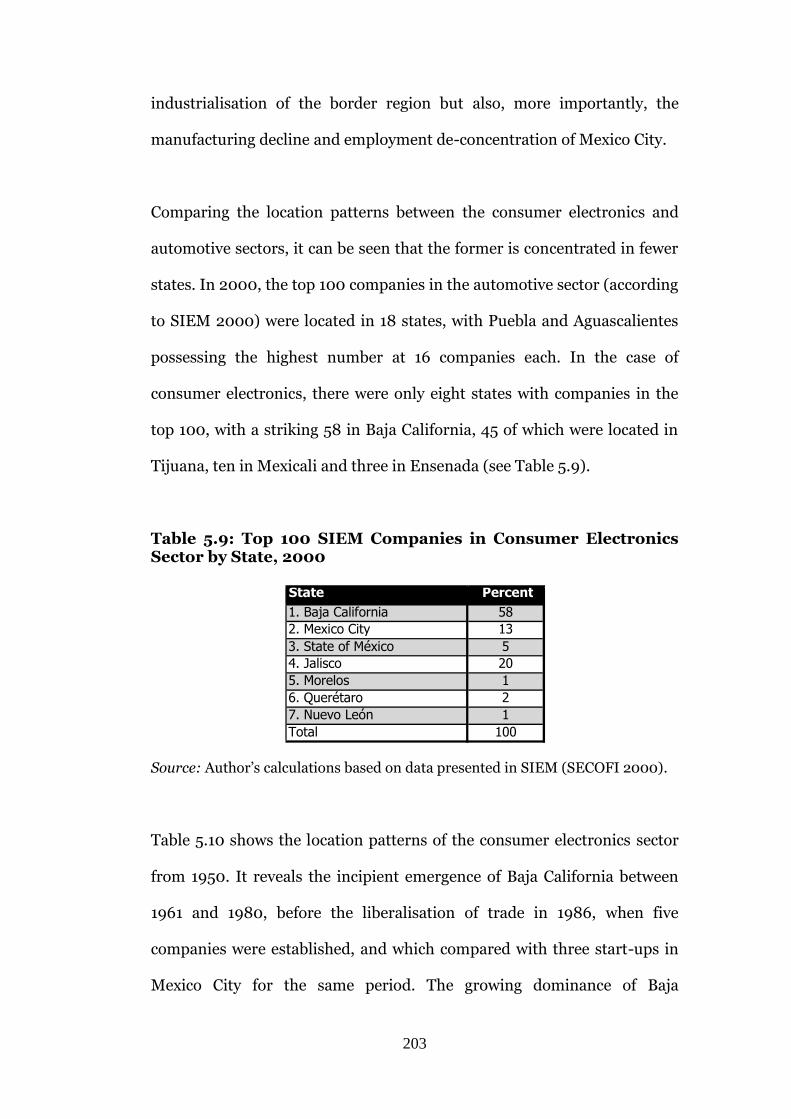
203
industrialisation of the border region but also, more importantly, the
manufacturing decline and employment de-concentration of Mexico City.
Comparing the location patterns between the consumer electronics and
automotive sectors, it can be seen that the former is concentrated in fewer
states. In 2000, the top 100 companies in the automotive sector (according
to SIEM 2000) were located in 18 states, with Puebla and Aguascalientes
possessing the highest number at 16 companies each. In the case of
consumer electronics, there were only eight states with companies in the
top 100, with a striking 58 in Baja California, 45 of which were located in
Tijuana, ten in Mexicali and three in Ensenada (see Table 5.9).
Table 5.9: Top 100 SIEM Companies in Consumer Electronics Sector by State, 2000
Source: Author’s calculations based on data presented in SIEM (SECOFI 2000).
Table 5.10 shows the location patterns of the consumer electronics sector
from 1950. It reveals the incipient emergence of Baja California between
1961 and 1980, before the liberalisation of trade in 1986, when five
companies were established, and which compared with three start-ups in
Mexico City for the same period. The growing dominance of Baja
State Percent
1. Baja California 58 2. Mexico City 13 3 . State of México 5 4. Jalisco 20 5. Morelos 1 6 . Querétaro 2 7. Nuevo León 1 Total 100
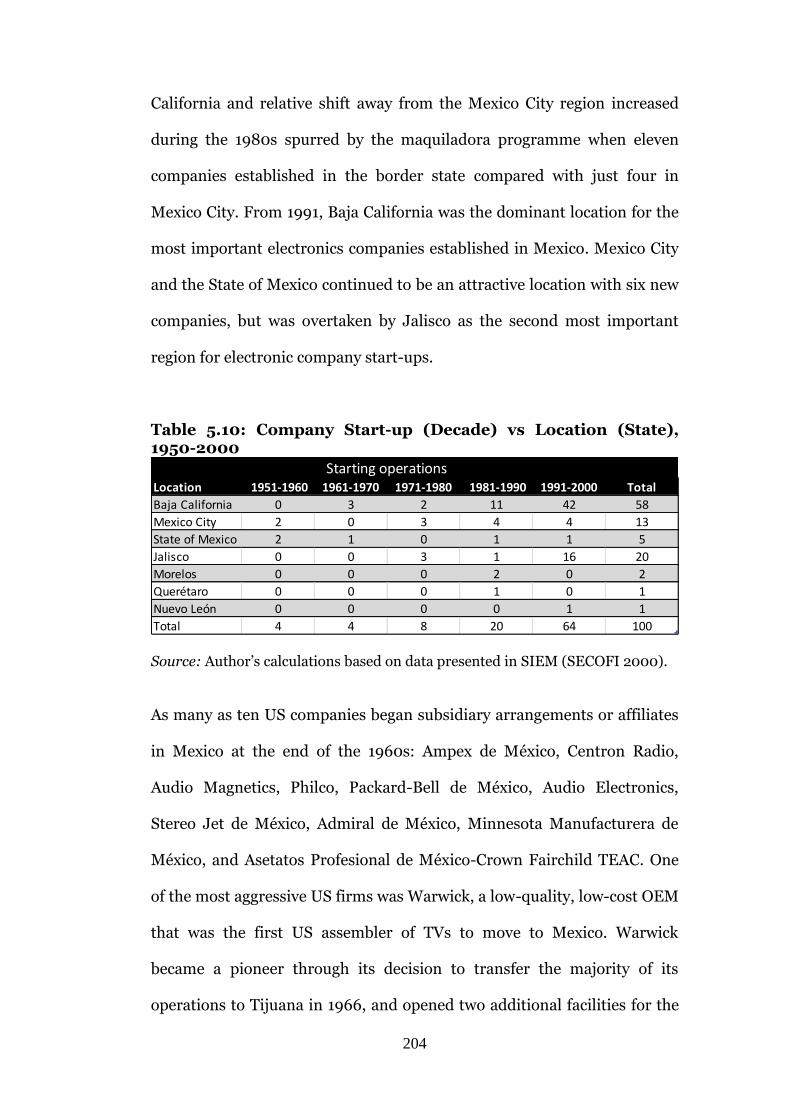
204
California and relative shift away from the Mexico City region increased
during the 1980s spurred by the maquiladora programme when eleven
companies established in the border state compared with just four in
Mexico City. From 1991, Baja California was the dominant location for the
most important electronics companies established in Mexico. Mexico City
and the State of Mexico continued to be an attractive location with six new
companies, but was overtaken by Jalisco as the second most important
region for electronic company start-ups.
Table 5.10: Company Start-up (Decade) vs Location (State), 1950-2000
Location 1951-1960 1961-1970 1971-1980 1981-1990 1991-2000 Total
Baja California 0 3 2 11 42 58
Mexico City 2 0 3 4 4 13
State of Mexico 2 1 0 1 1 5
Jalisco 0 0 3 1 16 20
Morelos 0 0 0 2 0 2
Querétaro 0 0 0 1 0 1
Nuevo León 0 0 0 0 1 1
Total 4 4 8 20 64 100
Starting operations
Source: Author’s calculations based on data presented in SIEM (SECOFI 2000).
As many as ten US companies began subsidiary arrangements or affiliates
in Mexico at the end of the 1960s: Ampex de México, Centron Radio,
Audio Magnetics, Philco, Packard-Bell de México, Audio Electronics,
Stereo Jet de México, Admiral de México, Minnesota Manufacturera de
México, and Asetatos Profesional de México-Crown Fairchild TEAC. One
of the most aggressive US firms was Warwick, a low-quality, low-cost OEM
that was the first US assembler of TVs to move to Mexico. Warwick
became a pioneer through its decision to transfer the majority of its
operations to Tijuana in 1966, and opened two additional facilities for the
205
assembly and production of components in Tijuana in 1968 and 1974,
holding the position of largest electronics assembler in Mexico until the
mid-1970s. Telectronics started operations in 1969 in Matamoros. In the
early 1970s, Nogales housed plants owned by Magnavox and General
Electric, and in 1975, 17 of the 37 maquiladoras in Nogales manufactured
electronics components. Of these, eight had parent corporations or plants
in Arizona, California or Texas. Also in 1975, Zenith moved the greater part
of its assembly operations from the US to Matamoros, Tamaulipas. In
1992, Zenith closed its US plants and relied on its factories in Mexico, a
move that practically represented the end of domestic production by US-
owned TNCs.119
In the mid-1970s, however, maquiladora investment shifted from Nogales
to Tijuana, and subsequently to Ciudad Juárez and Reynosa. An important
part of this shift was the decision of RCA to open in Ciudad Juárez in the
late 1970s, which consolidated an incipient electronics cluster in the city
(Sklair 1993). But unlike the earlier investments in Tijuana and Nogales,
which were mainly by smaller independent parts suppliers, it was the
leading US consumer electronics firms that headed for Ciudad Juárez and
Reynosa.120
From the 1980s, however, South-East Asian firms became more prominent
– by the end of 1994, South Korean companies had pumped US$650
million and the Japanese US$400 million into both Tijuana and Ciudad
119 Author’s analysis of information presented in Electronic Forecast, various years; Reed Television Digest, various years; European Electronics Markets Forecast, various years. 120 Ibidem.
206
Juárez, and total FDI from South-East Asia had reached US$1 billion
(UNCTAD 1998). Companies such as Toshiba (the first Japanese consumer
electronics company to arrive in Mexico) and Samsung located first in
Mexico City, then moved to the border. Toshiba started operations in 1963
importing consumer electronics products and in 1968 built a
semiconductor plant in Cuautitlán Izcali, State of Mexico. It was not until
1986, relatively late compared with the sector leaders, that it opened a
plant in Ciudad Juárez under the Maquiladora Programme, producing TV
sets, video recorders and parts for export to the US. The plant became
vertically integrated with other Toshiba production facilities in the US, in
particular with Toshiba’s Texas plant. Samsung’s Mexico City plant was
opened in 1988 and in the same year the company began a plant registered
as a maquiladora in Tijuana.121
In 1970, according to Bruce Weber (1990, p.21), labour costs were the
main reason for US companies to locate in Mexican border states. Factory
workers were paid on average between 300 and 400 pesos a week
(US$24–US$32) including all fringe benefits, about one-fifth the rate paid
under union contract in the US. The economic factors evolved over time; in
1997, the managing director of Sanyo (Mexico), Daisuke Kutsunugi, was
motivated by the fact that production costs in Mexico were half those
found in other locations in the 1980s. Moreover, he considered then that
proximity provided supply-line advantages. Consumer electronics TNCs no
longer had to wait 22 to 28 days for shipping of products from Asia; these
were “now only eight hours by road from the US market” (Electronics
121 Based on company information from the CANIETE/CANIECE archives.
207
Times 1999, p. 1398). Managers at Samsung Electronics in Mexico claimed
that the new production plant set up in Ciudad Juárez in 1995 cut shipping
time to the US market from four days by plane or eight days by ship from
plants in the Philippines, Malaysia and Taiwan to as little as two days
(ibidem).
Most of the Tijuana plants produced electronics components and parts
that were shipped directly to final goods assemblers in the US in line with
the trade liberalisation hypothesis; however, all began under the
liberalisation kick-started by the maquiladora regulation in the 1970s and
not in the 1990s as Krugman’s approach suggests.122
The majority of companies started operations during the 1990s, suggesting
a completely new industry with no relationship to the previous industry
located in the central part of Mexico. A company is less likely to appear in
the top 100 the earlier it was started: 64% began operations in the 1990s,
20% in the 1980s, and the remaining 16% in the 1950s, 1960s or 1970s as
discussed earlier in relation to data presented in Table 5.10. The 1980s and
1990s constituted the period when the highest number of companies in the
consumer electronics sector started operations. This observation can be
interpreted in different ways. First, new global companies in this sector
flourished in the new economic free trade environment. Second, only a
small group (16%) of the older companies were able to endure the Mexican
122 By 1973 there were already over 100 electronics maquiladora operational in Baja California and Sonora (Mexican American Review 1974).
208
economic crisis and the liberalisation process and adjust their operations
to suit the new economic environment.
When looking at the arrival trend of the top global companies in the sector
this might seem contradictory to the previous data related to the top 100
companies, as out of 34 top global companies, 18 firms were established in
in Mexico before the 1980s and only 15 firms were established during the
1980s-1990s plus one in the 2000 (see Table 5.11). The first eleven
companies to be established in Mexico all set up in Mexico City, before
Motorola decided to establish an additional plant in Sonora in 1966.
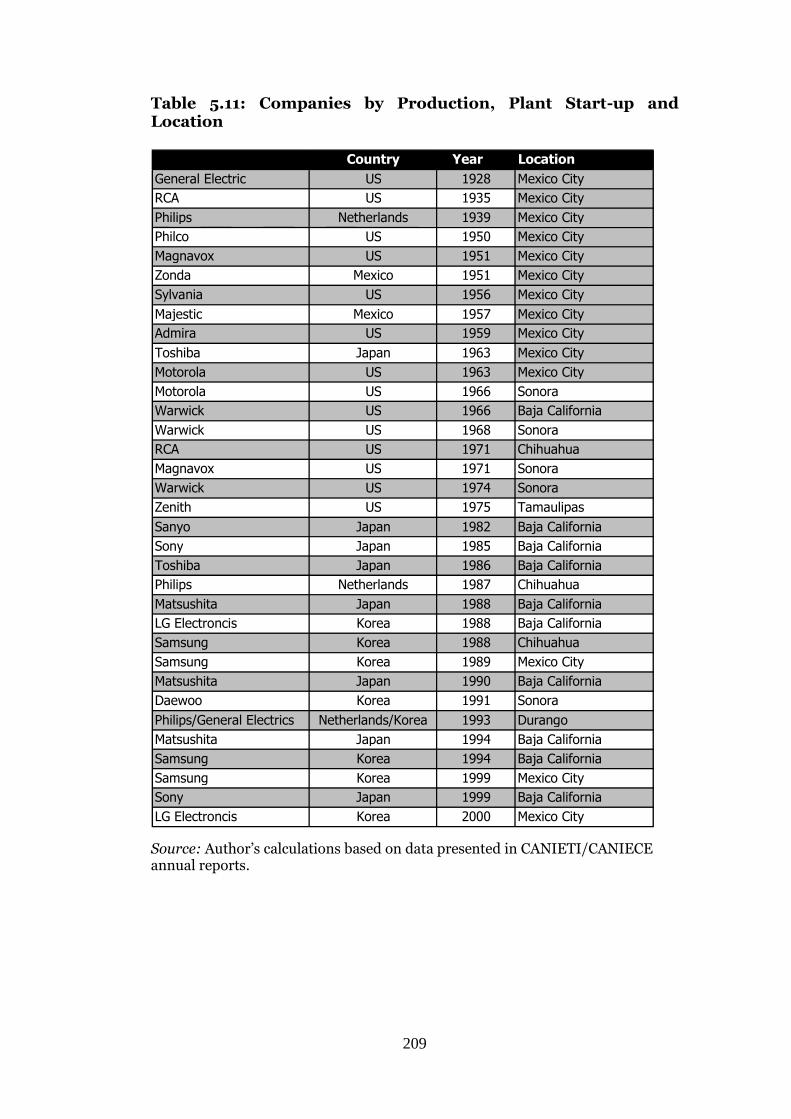
209
Table 5.11: Companies by Production, Plant Start-up and Location
Source: Author’s calculations based on data presented in CANIETI/CANIECE annual reports.
Company Country Year Location
General Electric US 1928 Mexico City
RCA US 1935 Mexico City
Philips Netherlands 1939 Mexico City
Philco US 1950 Mexico City
Magnavox US 1951 Mexico City
Zonda Mexico 1951 Mexico City
Sylvania US 1956 Mexico City
Majestic Mexico 1957 Mexico City
Admira US 1959 Mexico City
Toshiba Japan 1963 Mexico City
Motorola US 1963 Mexico City
Motorola US 1966 Sonora
Warwick US 1966 Baja California
Warwick US 1968 Sonora
RCA US 1971 Chihuahua
Magnavox US 1971 Sonora
Warwick US 1974 Sonora
Zenith US 1975 Tamaulipas
Sanyo Japan 1982 Baja California
Sony Japan 1985 Baja California
Toshiba Japan 1986 Baja California
Philips Netherlands 1987 Chihuahua
Matsushita Japan 1988 Baja California
LG Electroncis Korea 1988 Baja California
Samsung Korea 1988 Chihuahua
Samsung Korea 1989 Mexico City
Matsushita Japan 1990 Baja California
Daewoo Korea 1991 Sonora
Philips/General Electrics Netherlands/Korea 1993 Durango
Matsushita Japan 1994 Baja California
Samsung Korea 1994 Baja California
Samsung Korea 1999 Mexico City
Sony Japan 1999 Baja California
LG Electroncis Korea 2000 Mexico City
210
When comparing those companies located in Mexico City that started
operations during the 1950s with those founded in the 1990s, there is a
shift from nationally owned companies to TNCs.123 However, this change
of ownership composition and scale of operations does not mean an
equally radical shift toward export orientation. Typical of companies set up
in the 1950s are Manufacturera de Sinfonolas, which made coin-operated
jukeboxes, and Compañía General Electronic, which made electronic parts.
Both were nationally oriented and not technologically innovative.
By contrast, in the 1990s a set of globally oriented TNCs including
Samsung Electronics de México, Audionick Compañía and Manufacturera
Wilka arrived. All were started with foreign capital and import products,
but at the time had no export activity. Looking at the top 100 companies
located in Mexico City from the 1950s and 1990s, it is possible to observe
that 12 of the 13 had no export activity.124 At the opposite end of the scale,
in Baja California only six out of 58 companies had no export activity.125
It is worth noting that according to the CANIECE archives, as the result of
M&As as company production strategy, manufacturing plants were either
closed or relocated. This was the case for Warwick’s plants – as a result of
123 Again, some caution is required as seven of the top ten companies over the 1950s and 1960s were non-Mexican. Companies starting up at this time included Philco (1950), Magnavox (1951), Telefunken (1951), Sylvania (1956), Admiral (1959) and Stromberg Carlson (1967), all with production facilities in Mexico City. 124 The exception was Hilma, founded in 1986, which produces microphones for the national and export markets. 125 Hoyu Taiwa de México, Jiko Mexicana, Olympia de México, Aromat Mexicana Electrónica, Vanguad Electro Opticas and Superior Inchang de México. In all cases these are companies operating in the parts sector, so are most likely to be outsourcing for bigger local export companies.
211
the Sanyo takeover, all Warwick operating plants in Mexico were closed.
Warwick was a US company with plants in Tijuana, Mexicali and Mexico
City, producing TV sets for the US market. In 1993 Samsung announced an
aggressive investment programme in Mexico, opening a new plant in
Tijuana in 1994 and another in 1997 before opening new facilities in
Mexico City and branches in Guadalajara, Monterrey and Mérida in
2000.126
Most newly arrived companies in the 1980s, and notably Japanese
companies, went straight to the border, especially Baja California,
attracted by the incentives offered under the Maquiladora Programme
(CANIECE 1981). In 1982 Sanyo launched operations in Tijuana, at a plant
that was integrated with Sanyo plants on the US side of the border. Since
then Sanyo has established six divisions with nine production plants
employing more than 5,000 people (Sanyo 2001). Similarly, Sony
established operations in Mexico as a direct result of internal production
and operations restructuring. Sony transferred its production plant from
San Diego to four plants set up in Tijuana in 1985 (Sony 2000).127 In 1996
Sony opened a plant in Mexicali, investing more than US$20 million and
hiring 2,000 employees to manufacture TV sets and components. That
same year a new division of the Sony corporation launched operations in
Tijuana. In an unusual southwards move, Sony opened plants in
126 The investment in new plant in Mexico has probably supported the development of high-skilled operations such as R&D in the southern US. Sony, Matsushita and JVC have engineering and support bases in southern California where they develop component production techniques and innovations that vertically integrate with subsidiaries and production facilities in Mexico (Harvey et al. 2001). 127 Sony products manufactured in Tijuana are mainly sold in the US, Asia, Mexico, Chile and Panama.
212
Guadalajara and Mexico City in 2000; this actually contradicts Krugman’s
argument, particularly due to the fact that Jalisco developed a bold
electronics cluster, the top companies arriving over the 1990s.128
De-concentration was also fuelled by the increase in M&As mentioned
earlier in this chapter. In 1987, for example, Thomson acquired three
companies with long traditions of manufacturing in Mexico: General
Electric (in Mexico since 1948), RCA (1935) and Telefunken (1951). With
takeover these companies disappeared from the Mexican scene as
Thomson took a strategic decision not to extend its Mexico production
base, reading that the Mexican economy in 1987–88 was still in a crisis
situation (Zampetti et al. 1994).129 A similar situation can be illustrated by
the case of Philips, a company that arrived in Mexico in 1939 when it
began importing products from Europe, formally starting production in
1945 as Philips Mexicana, S.A. In 1952 Philips opened a distribution centre
in Monterrey, in 1957 production facilities were opened in Mexico City and
in 1958 a new plant was opened in Monterrey. In 1974 Philips purchased
Magnavox, in 1981 it took over Sylvania and in 1984 it acquired Philco, all
three companies with production facilities in Mexico City. According to
interviews with Philips officials, the acquisitions meant that facilities were
closed (Magnavox’s plant in Nogales was shut) or downgraded to
warehouses and distribution centres, with a consequent high number of
redundancies (Hidalgo 2002). According to company information, after
128 Author’s calculation based on data presented in CANIETI annual reports, various years. 129 According to Zampetti, this was a rather unexpected decision by Thompson. In Zampetti’s view this was a reading that the Mexican economy in 1987–88 was still in a crisis situation (Zampetti et al. 1994).
213
border controls were eased in 1987, Philips Mexicana reorganised its
industrial strategies to take advantage of the Maquiladora Programme.
Specifically, Philips now sought to integrate the Mexican plants with its US
plants (Hidalgo 2002). It moved to Tijuana and Juárez and increased
operations at its Monterrey plant, leaving non-electronic production
(domestic appliances manufacturing) to its Mexico City divisions. Philips
also entered into OEM agreements with Mexican companies producing for
the US market.130
The exceptions to this process indicate a stay of execution, but not for long.
In 1972, Matsushita acquired Motorola’s consumer electronics division,
making it a global player (Matsushita 2000). Motorola had started
distribution operations for consumer electronics products in 1960 and in
1963 decided to begin manufacturing operations, locating both the
distribution and manufacturing plant in Mexico City. In 1966 it registered
a plant under the Maquiladora Programme in Nogales and in 1969 it
started a semiconductor manufacturing plant in Zapopan, Jalisco
(subsequently sold to Texas Pacific in 1999). The Matsushita takeover saw
Motorola exit the consumer electronics sector. Matsushita operated
Motorola’s former OEM plants in Mexico City as part of its arrival strategy,
then opened a new plant in Tijuana in 1976; a further three assembly
plants began operations in the city in 1988, 1990 and 1994.131
130 Philips’s acquisition of Magnavox, Sylvania and Westinghouse (in 1983) also made it a a powerful player in the US economy. 131 In 1997 Matsushita started audio exports to Latin America and in 1998 it announced the assembly of its one millionth TV set.
214
Post-NAFTA, location and de-concentration seems to be motivated less by
production concerns and more by opportunities for international trade
and investment flows. The geography of production has been reappraised,
with a more diversified pattern and an orientation away from the US
market alone. As already noted, after NAFTA a number of companies that
had located in Mexico began to export to Latin America, and even to
South-East Asia. The orientation to more global markets had made
locations away from the border more attractive. In 1988, for example, LG
Electronics entered an agreement with a local Mexican assembly partner in
Mexicali to distribute imported products. In 1994 LG set up offices in
Mexico City in order to control marketing, sales and distribution strategies
locally. In 1995 LG acquired the US TV manufacturer Zenith and its
assembly facilities in Reynosa, with 17,000 employees; this was followed
by the opening of regional offices in Guadalajara, Monterrey and
Mérida. 132 In 2000 LG started operations in Cuautitlán, 10 km from
Mexico City. According to company information, this move back toward
Mexico City was intended to achieve higher standards for the merchandise
brought in from South Korea and other production sites around the world.
LG also regarded Mexico City as a stronger base from which to develop the
Mexican market (Spencer 2000).
132 In 1998 Goldstar changed its global brand and name to become Lucky-Goldstar or LG. LG now assembles all of its worldwide TV sets in Mexico, with a yearly production of three million, and has even started producing parts to supply other Asian TV manufacturers located in Mexico.
215
CONCLUSION
We have seen that consumer electronics production in Mexico began
during the 1930s and was boosted significantly both in terms of output and
new investment in the 1960s, when an important set of foreign firms
arrived. During the following decades, industrial regional organisation was
modified as a result of a broader business context associated with global
business practices including innovation, M&As and production
fragmentations, more than trade liberalisation alone. In the border region
by the beginning of the 1990s, under a new economic environment,
clusters of highly efficient, high-quality Japanese producers occupied a
space formerly taken by relatively inefficient low-quality US companies, a
movement that had its origins before the liberalisation of trade but that
also highlights the effects of a partial trade opening brought about by the
maquiladora regulation. Mexico, and especially the border region, became
a key location for global consumer electronics firms.
In spatial terms, the transformation pattern is akin to a shift from a
monocentric to a polycentric clustering of economic activities, determined
in most cases by the market orientation strategies of specific companies
and their long-term investment decisions, fostered by a combination of
factors: geography of production, trade regulation, access to markets, and
price differentials. In this regard, one of the main factors that could take
credit for such a transformation of the economic environment in terms of
market orientation and investment decisions was the Maquiladora
Programme. Many of the companies that first located in Mexico City
remained there, while those interested in starting operations under the
216
Maquiladora Programme opened extra plants in northern Mexico in a
move that Krugman characterises as being made in order to gain access to
markets, although in this case access to suppliers seems to be as relevant.
The company histories show that it is not the case that Mexico City
facilities were closed down and new ones established elsewhere; rather,
Mexico City closures were a combination of economic crisis and global
restructuring of the industry, mainly through M&As, which provoked
significant de-industrialisation directly and through cluster effects on
suppliers. To illustrate the importance of these explanations, the de-
industrialisation of the consumer electronics cluster in Mexico City was
repeated by companies along the border in Nogales and Reynosa as the
result of global M&As: global factors affect specific locations. Again,
however, we should note that de-concentration through M&A
restructuring took place before the opening-up of the economy and the
dismantling of trade protection barriers. The de-concentration of
consumer electronics away from Mexico City also appears to be unrelated
to federal decentralisation programmes.
Although the consumer electronics and automotive sectors were selected
because of their rankings in the Globality Index, one can now see a
contrast in terms of integration into the Mexican economy. These sectors
exemplify two different forces brought about by globalisation that were
discussed in Chapter Three; on the one hand, the fragmentation of
productive processes driven by standards of technological innovation and
the resultant build-up of global production circuits (usually referred to in
the literature as “centripetal forces”), and on the other, the “centrifugal
217
forces” that reinforce location concentration patterns. These forces run in
parallel with those claims made in the NIDL and globalisation literature,
particularly in relation to the claim that high-value-added activities are
kept in developed countries and less value-added, highly labour-intensive
activities are sent to less developed countries. The broad picture of
consumer electronics sector transformation challenges the ideas set out by
Krugman. The electronics sector exemplifies how under the broader
framework of a free trade regime, global processes (i.e., M&As,
technological innovation, production fragmentation) can lead to the
transformation of specific locations, regardless of the intentions of local
players. Regarding regional restructuring processes, this sector analysis
has made clear that restructuring in the central part of the country, and
particularly the de-industrialisation of Mexico City, is not related to the
market (demand) and transport cost claims made by Krugman and Livas.
Rather than liberalisation of trade, and the access to markets that sparks a
“migration to the north”, the relocation of the consumer electronics
industry in Mexico is mostly explained by processes taking place at the
global level.
218
Chapter Six: The Transformation of Mexico City
OVERVIEW
This chapter focuses on the economic restructuring of Mexico City. For
over a century Mexico City concentrated the country’s wealth and income,
manufacturing base and political power. As such it was an indicator of
national fortunes, through crisis and opulence, growth and recession. In a
period of less than 20 years, however, the dominance of Mexico City has
been threatened. Entire industrial sectors have moved or been dismantled.
In part this change has come about as a consequence of federal
government policy which has promoted industrial decentralisation, but as
this thesis has explored, the shift has been associated to varying degrees
with trade liberalisation and globalisation. Considering the effect of these
processes on Mexico City is crucial to understanding liberalisation and
globalisation, and their effects.
This chapter does three things. First, it presents material from the
automotive and consumer electronics case studies to explore the
association between manufacturing decline in Mexico City and industrial
location dynamics that point toward the border states and the central part
of Mexico as the preferred locations in the post-trade liberalisation period.
Second, the chapter develops this analysis by looking more closely at
Mexico City’s economy over the post-trade liberalisation period in order to
discuss how the deep transformation in the city’s economy has led to a
concentration of certain economic activities, notably in the financial
219
sector. Finally, the chapter explores the social effects of transformation
and presents empirical information to assess how residents who have lived
through the “economic transition” perceive the consequences in terms of
social cohesion, social polarisation and politics. Here I use primary data
from questionnaires given to a group selected by a probabilistic sample
that identified people over 40 years old, a population which entered the
workforce just prior to Mexico’s neo-liberalisation and has lived through
economic restructuring over the time frame of this thesis. Fieldwork
interviews were conducted on 5–30 May 2000.133
MANUFACTURING DECLINE IN MEXICO CITY
The two previous chapters have looked at possible trade liberalisation or
globalisation effects in the automotive and consumer electronics sectors.
The units of analysis were the sector and the company. Here, I am
interested in considering the impact of the location decisions of companies
in these two sectors on Mexico City. These decisions take place in the
context of considerable growth for both sectors, at rates higher than for
manufacturing in general nationally. In terms of employment, for example,
the automotive sector grew by 495.7%, an annual growth rate of 9.3%, and
the consumer electronics sector by 56.1%, an annual growth rate of 2.4%,
between 1980 and 2000.134
The first observation is that the automotive and consumer electronics
sectors follow different growth and localisation trends. By 2000 the
133 The questionnaire is presented in Appendix 4. 134 Author’s calculations from data presented in economic censuses (INEGI various years).
220
consumer electronics sector had almost disappeared from the central
region and showed a high level of concentration in the border states. The
presence of the consumer electronics industry in the border predates trade
liberalisation. The automotive sector remained an important sector in
central Mexico, but was less important in Mexico City per se. Data for the
automotive sector show that it followed a pattern similar to the
manufacturing sector generally: a relatively important decline in Mexico
City total employment terms, with a strong remaining presence within the
metropolitan area municipalities (the wider MAMC). In 1980 the MAMC
accounted for 59.8% of total national automotive employment, with 50.9%
of total national employment concentrated in just six municipalities:
Azcapotzalco (12.8%), Miguel Hidalgo (8.3%) and Gustavo A. Madero (6%)
in the DF and Tlalnepantla (10%), Naucalpan (7.9%) and Cuautitlán
(5.9%) in the State of Mexico (see Table 6.1).135 These six municipalities
formed an industrial cluster. At the national level by 2000, jobs in the
automotive sector had increased by 495.7% (in absolute numbers from
72,661 to 432,836), with high growth in Aguascalientes and Coahuila and
positive but lower rates of growth in states with an existing automotive
presence.136 Mexico City plus metropolitan municipalities of the State of
Mexico had 36,764 employees and represented 8.4% of national
automotive employment in 2000, a decline of 15.6% from 1980 and a
significant relative decline as a share of all employment in the larger
automotive sector. Importantly, this decline was not the same between the
135 Azcapotzalco alone had 9,274 workers directly employed in the automotive sector in 1980, the highest-ranking single location nationally for employment in the sector. 136 Author’s calculations from data presented in economic censuses (INEGI various years).
221
DF and metropolitan municipalities of the State of Mexico: automotive
employment in the DF declined 45.7% (from 25,207 to 13,696) over the
period, and the “rest” of the MAMC grew 26.7% (from 18,212 to 23,068).137
As measured by employment, the automotive sector decentralised from
Mexico City, partly by establishing capacity in the State of Mexico (see
Table 6.1). This redistribution was not sufficient to compensate for the
decline of employment in the DF. Rather, the nearly five-fold increase in
employment is the result of relocation and increased capacity in plant
outside the MAMC, including in the states Puebla, Morelos and Hidalgo,
and the North.
137 ‘Rest’ refers to the MAMC minus the DF, ie. the metropolitan muncicipalities of the State of Mexico.
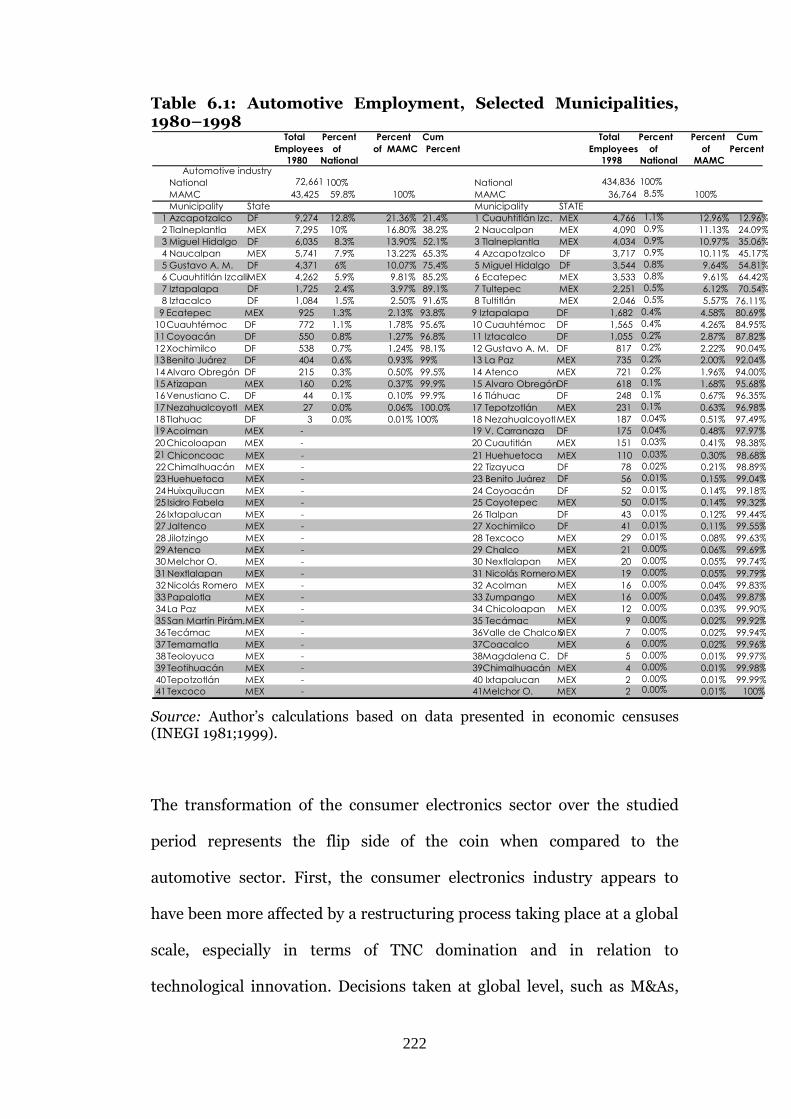
222
Table 6.1: Automotive Employment, Selected Municipalities, 1980–1998
Source: Author’s calculations based on data presented in economic censuses (INEGI 1981;1999).
The transformation of the consumer electronics sector over the studied
period represents the flip side of the coin when compared to the
automotive sector. First, the consumer electronics industry appears to
have been more affected by a restructuring process taking place at a global
scale, especially in terms of TNC domination and in relation to
technological innovation. Decisions taken at global level, such as M&As,
Total Employees
1980
Percent of
National
Percent of MAMC
Cum Percent
Total Employees
1998
Percent of
National
Percent of
MAMC
Cum Percent
Automotive industry National 72,661 100% National 434,836 100% MAMC 43,425
59.8% 100% MAMC 36,764 8.5% 100%
Municipality State Municipality STATE 1 Azcapotzalco DF 9,274
12.8% 21.36% 21.4% 1 Cuauhtitlán Izc. MEX 4,766 1.1% 12.96% 12.96%
2 Tlalneplantla MEX 7,295 10% 16.80% 38.2% 2 Naucalpan MEX 4,090
0.9% 11.13% 24.09% 3 Miguel Hidalgo DF 6,035
8.3% 13.90% 52.1% 3 Tlalneplantla MEX 4,034 0.9% 10.97% 35.06%
4 Naucalpan MEX 5,741 7.9% 13.22% 65.3% 4 Azcapotzalco DF 3,717
0.9% 10.11% 45.17% 5 Gustavo A. M. DF 4,371
6% 10.07% 75.4% 5 Miguel Hidalgo DF 3,544 0.8% 9.64% 54.81%
6 Cuauhtitlán Izcalli MEX 4,262 5.9% 9.81% 85.2% 6 Ecatepec MEX 3,533
0.8% 9.61% 64.42% 7 Iztapalapa DF 1,725
2.4% 3.97% 89.1% 7 Tultepec MEX 2,251 0.5% 6.12% 70.54%
8 Iztacalco DF 1,084 1.5% 2.50% 91.6% 8 Tultitlán MEX 2,046
0.5% 5.57% 76.11% 9 Ecatepec MEX 925
1.3% 2.13% 93.8% 9 Iztapalapa DF 1,682 0.4% 4.58% 80.69%
10 Cuauhtémoc DF 772 1.1% 1.78% 95.6% 10 Cuauhtémoc DF 1,565
0.4% 4.26% 84.95% 11 Coyoacán DF 550
0.8% 1.27% 96.8% 11 Iztacalco DF 1,055 0.2% 2.87% 87.82%
12 Xochimilco DF 538 0.7% 1.24% 98.1% 12 Gustavo A. M. DF 817
0.2% 2.22% 90.04% 13 Benito Juárez DF 404
0.6% 0.93% 99% 13 La Paz MEX 735 0.2% 2.00% 92.04%
14 Alvaro Obregón DF 215 0.3% 0.50% 99.5% 14 Atenco MEX 721
0.2% 1.96% 94.00% 15 Atizapan MEX 160
0.2% 0.37% 99.9% 15 Alvaro Obregón DF 618 0.1% 1.68% 95.68%
16 Venustiano C. DF 44 0.1% 0.10% 99.9% 16 Tláhuac DF 248
0.1% 0.67% 96.35% 17 Nezahualcoyotl MEX 27
0.0% 0.06% 100.0% 17 Tepotzotlán MEX 231 0.1% 0.63% 96.98%
18 Tlahuac DF 3 0.0% 0.01% 100% 18 Nezahualcoyotl MEX 187
0.04% 0.51% 97.49% 19 Acolman MEX -
19 V. Carranaza DF 175 0.04% 0.48% 97.97%
20 Chicoloapan MEX - 20 Cuautitlán MEX 151
0.03% 0.41% 98.38% 21 Chiconcoac MEX -
21 Huehuetoca MEX 110 0.03% 0.30% 98.68%
22 Chimalhuacán MEX - 22 Tizayuca DF 78
0.02% 0.21% 98.89% 23 Huehuetoca MEX -
23 Benito Juárez DF 56 0.01% 0.15% 99.04%
24 Huixquilucan MEX - 24 Coyoacán DF 52
0.01% 0.14% 99.18% 25 Isidro Fabela MEX -
25 Coyotepec MEX 50 0.01% 0.14% 99.32%
26 Ixtapalucan MEX - 26 Tlalpan DF 43
0.01% 0.12% 99.44% 27 Jaltenco MEX -
27 Xochimilco DF 41 0.01% 0.11% 99.55%
28 Jilotzingo MEX - 28 Texcoco MEX 29
0.01% 0.08% 99.63% 29 Atenco MEX -
29 Chalco MEX 21 0.00% 0.06% 99.69%
30 Melchor O. MEX - 30 Nextlalapan MEX 20
0.00% 0.05% 99.74% 31 Nextlalapan MEX -
31 Nicolás Romero MEX 19 0.00% 0.05% 99.79%
32 Nicolás Romero MEX - 32 Acolman MEX 16
0.00% 0.04% 99.83% 33 Papalotla MEX -
33 Zumpango MEX 16 0.00% 0.04% 99.87%
34 La Paz MEX - 34 Chicoloapan MEX 12
0.00% 0.03% 99.90% 35 San Martín Pirám. MEX -
35 Tecámac MEX 9 0.00% 0.02% 99.92%
36 Tecámac MEX - 36Valle de Chalco S MEX 7
0.00% 0.02% 99.94% 37 Temamatla MEX -
37Coacalco MEX 6 0.00% 0.02% 99.96%
38 Teoloyuca MEX - 38Magdalena C. DF 5
0.00% 0.01% 99.97% 39 Teotihuacán MEX -
39Chimalhuacán MEX 4 0.00% 0.01% 99.98%
40 Tepotzotlán MEX - 40 Ixtapalucan MEX 2
0.00% 0.01% 99.99% 41 Texcoco MEX -
41Melchor O. MEX 2 0.00% 0.01% 100%
223
have had almost immediate effects in terms of production and business
organisation at specific locations. As was shown in Chapter Five, at the
beginning of the 1980s the consumer electronics industry was strongly
concentrated in the central part of Mexico: the MAMC accounted for
40.3% of consumer electronics jobs, with the DF being the location for
28.6% (25,058) of employees and the state of Mexico 26.4% (23,109) of
employees. However, and as distinct from the automotive industry, a
significant proportion of jobs (34,140 representing the 39.1%) in consumer
electronics were already located in border states.
Prior to the 1980s but increasingly so afterwards, consumer electronics
production was organised into a two-tier system: one oriented to the
national market, located in the central part of the country, notably in
Mexico City; and the other export-oriented, operating under the
Maquiladora Programme. This arrangement suggests a different set of
operational circumstances to those envisaged by Krugman but confirms
nevertheless the principle of trade barriers and access to markets as a force
of attraction for export companies. The rapid decline of the consumer
electronics industry in the central part of the country, where most
companies were producing for the national market, illustrates what
happens to a nationally oriented industry when trade liberalisation
introduces competition and global business practices in a short time to a
hitherto protected and inefficient industry (see Table 6.2).
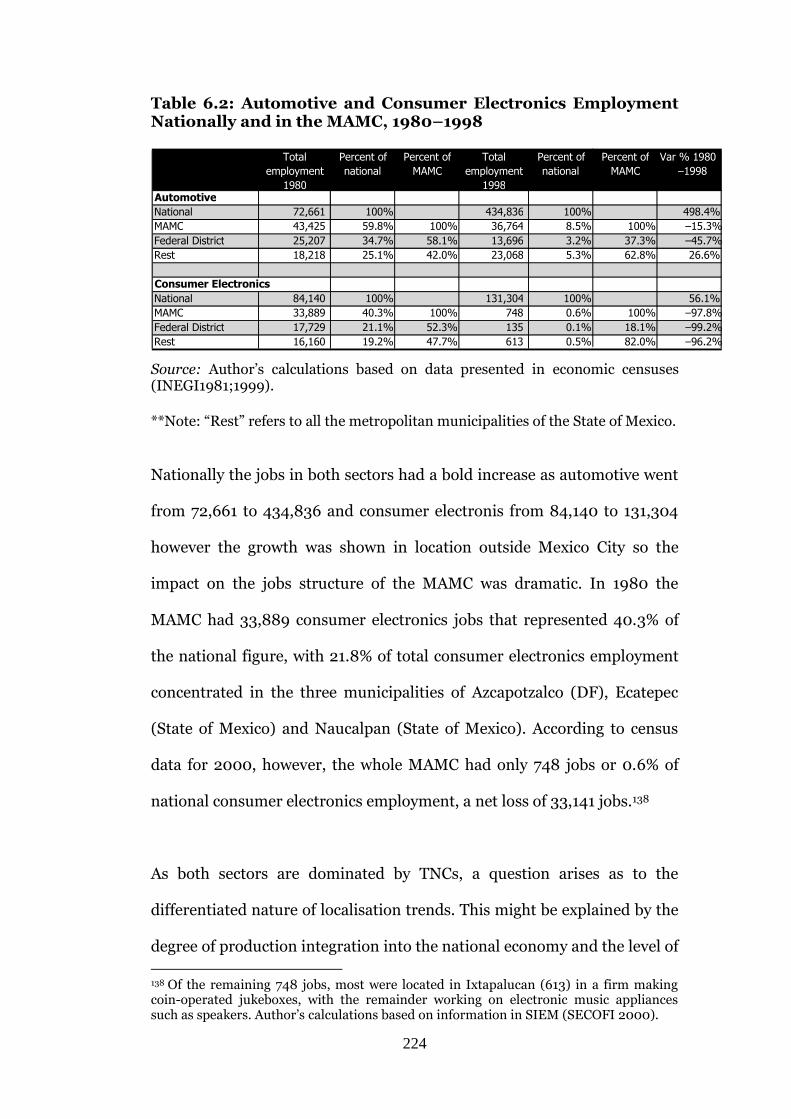
224
Table 6.2: Automotive and Consumer Electronics Employment Nationally and in the MAMC, 1980–1998
Source: Author’s calculations based on data presented in economic censuses (INEGI1981;1999).
**Note: “Rest” refers to all the metropolitan municipalities of the State of Mexico.
Nationally the jobs in both sectors had a bold increase as automotive went
from 72,661 to 434,836 and consumer electronis from 84,140 to 131,304
however the growth was shown in location outside Mexico City so the
impact on the jobs structure of the MAMC was dramatic. In 1980 the
MAMC had 33,889 consumer electronics jobs that represented 40.3% of
the national figure, with 21.8% of total consumer electronics employment
concentrated in the three municipalities of Azcapotzalco (DF), Ecatepec
(State of Mexico) and Naucalpan (State of Mexico). According to census
data for 2000, however, the whole MAMC had only 748 jobs or 0.6% of
national consumer electronics employment, a net loss of 33,141 jobs.138
As both sectors are dominated by TNCs, a question arises as to the
differentiated nature of localisation trends. This might be explained by the
degree of production integration into the national economy and the level of
138 Of the remaining 748 jobs, most were located in Ixtapalucan (613) in a firm making coin-operated jukeboxes, with the remainder working on electronic music appliances such as speakers. Author’s calculations based on information in SIEM (SECOFI 2000).
Total employment
1980
Percent of national
Percent of MAMC
Total employment
1998
Percent of national
Percent of MAMC
Var % 1980 –1998
Automotive National 72,661 100% 434,836 100% 498.4% MAMC 43,425 59.8% 100% 36,764 8.5% 100% –15.3% Federal District 25,207 34.7% 58.1% 13,696 3.2% 37.3% –45.7% Rest 18,218 25.1% 42.0% 23,068 5.3% 62.8% 26.6%
Consumer Electronics National 84,140 100% 131,304 100% 56.1% MAMC 33,889 40.3% 100% 748 0.6% 100% –97.8% Federal District 17,729 21.1% 52.3% 135 0.1% 18.1% –99.2% Rest 16,160 19.2% 47.7% 613 0.5% 82.0% –96.2%
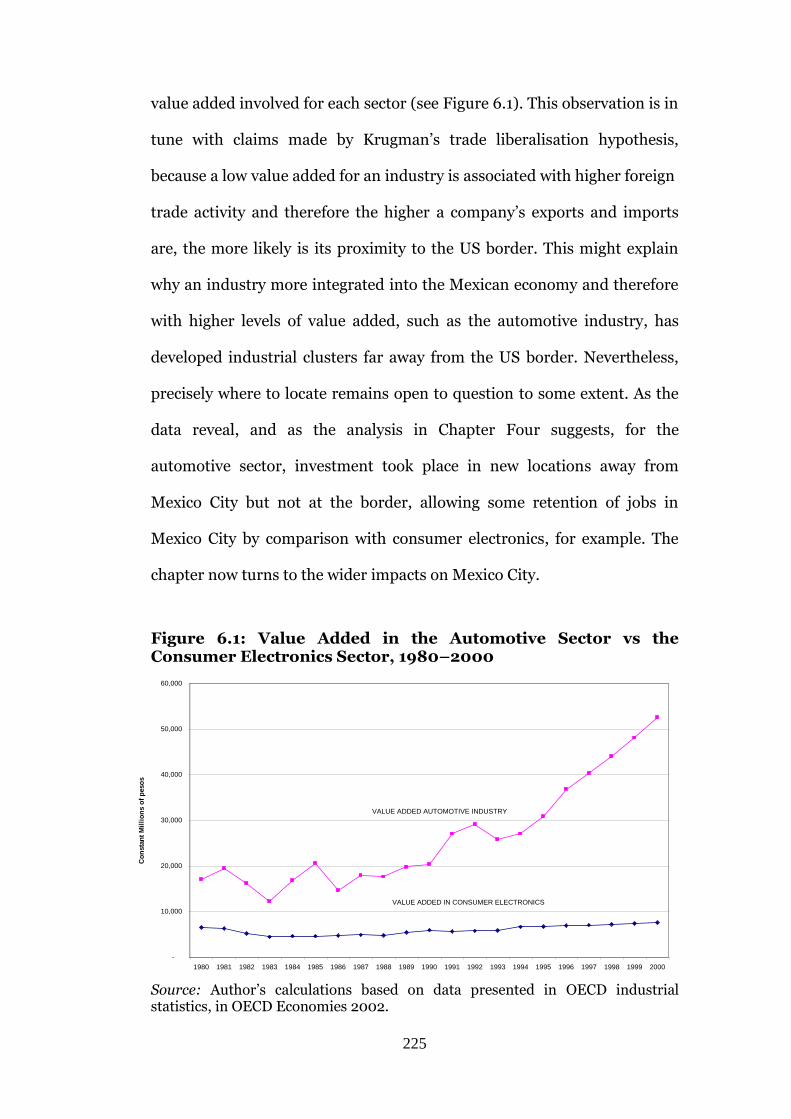
225
value added involved for each sector (see Figure 6.1). This observation is in
tune with claims made by Krugman’s trade liberalisation hypothesis,
because a low value added for an industry is associated with higher foreign
trade activity and therefore the higher a company’s exports and imports
are, the more likely is its proximity to the US border. This might explain
why an industry more integrated into the Mexican economy and therefore
with higher levels of value added, such as the automotive industry, has
developed industrial clusters far away from the US border. Nevertheless,
precisely where to locate remains open to question to some extent. As the
data reveal, and as the analysis in Chapter Four suggests, for the
automotive sector, investment took place in new locations away from
Mexico City but not at the border, allowing some retention of jobs in
Mexico City by comparison with consumer electronics, for example. The
chapter now turns to the wider impacts on Mexico City.
Figure 6.1: Value Added in the Automotive Sector vs the Consumer Electronics Sector, 1980–2000
Source: Author’s calculations based on data presented in OECD industrial statistics, in OECD Economies 2002.
-
10,000
20,000
30,000
40,000
50,000
60,000
1980 1981 1982 1983 1984 1985 1986 1987 1988 1989 1990 1991 1992 1993 1994 1995 1996 1997 1998 1999 2000
Co
nsta
nt
Mil
lio
ns o
f p
eso
s
VALUE ADDED AUTOMOTIVE INDUSTRY
VALUE ADDED IN CONSUMER ELECTRONICS
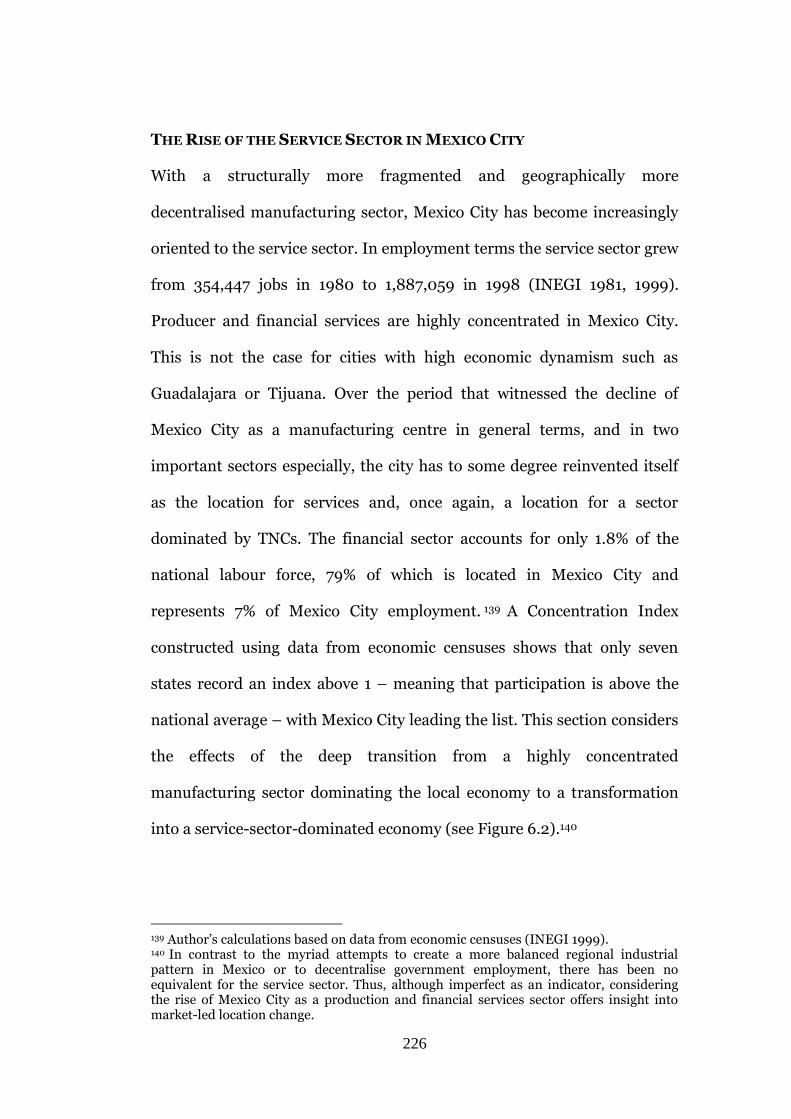
226
THE RISE OF THE SERVICE SECTOR IN MEXICO CITY With a structurally more fragmented and geographically more
decentralised manufacturing sector, Mexico City has become increasingly
oriented to the service sector. In employment terms the service sector grew
from 354,447 jobs in 1980 to 1,887,059 in 1998 (INEGI 1981, 1999).
Producer and financial services are highly concentrated in Mexico City.
This is not the case for cities with high economic dynamism such as
Guadalajara or Tijuana. Over the period that witnessed the decline of
Mexico City as a manufacturing centre in general terms, and in two
important sectors especially, the city has to some degree reinvented itself
as the location for services and, once again, a location for a sector
dominated by TNCs. The financial sector accounts for only 1.8% of the
national labour force, 79% of which is located in Mexico City and
represents 7% of Mexico City employment. 139 A Concentration Index
constructed using data from economic censuses shows that only seven
states record an index above 1 – meaning that participation is above the
national average – with Mexico City leading the list. This section considers
the effects of the deep transition from a highly concentrated
manufacturing sector dominating the local economy to a transformation
into a service-sector-dominated economy (see Figure 6.2).140
139 Author’s calculations based on data from economic censuses (INEGI 1999). 140 In contrast to the myriad attempts to create a more balanced regional industrial pattern in Mexico or to decentralise government employment, there has been no equivalent for the service sector. Thus, although imperfect as an indicator, considering the rise of Mexico City as a production and financial services sector offers insight into market-led location change.
227
Figure 6.2: Manufacturing Sector vs Service Sector as Percentage of Total Employment, Mexico City, 1970–1998
0%
10%
20%
30%
40%
50%
60%
70%
80%
90%
1970 1975 1980 1985 1988 1993 1998
MANUFACTURING
SERVICES
Source: Author’s elaboration based on data presented in economic censuses (INEGI various years).
One explanation for the concentration of the service sector in Mexico City
is, according to Sassen’s global cities hypothesis, the availability and
concentration of financial institutions, which generates a circular
causation effect with large corporations. Interviews that I conducted with
representatives of McKinsey, Bank of America, Edelman and Merrill Lynch
based in Mexico City support and elaborate on this analysis (Camargo
2001; Casas 2001; Rivera 2001; Acosta 2001). They suggest that Mexico
City combines a high level of business infrastructure arising from the stock
market, the banking system, telecommunications, the international
airport, international schools, and business clubs such as the Club de
Industriales (Industrialists’ Club) and Club de Banqueros (Bankers’ Club).
If we consider just one of these, the stock market, we can appreciate the
228
degree of historical contingency in terms of institutional infrastructure
that is required for transformation to take place.
The Bolsa Mexicana de Valores (Mexican Stock Exchange) initiated
operations in 1908, replacing the Bolsa Mercantil de México established in
1886. In 1933 a more modern stock market began with the promulgation
of the Mexican Stock Market Law (Ley Reglamentaria de Bolsas de
Valores), and the Bolsa de Valores de México S.A. started operating under
the supervision of the also newly created National Commission of Stocks
(BMV 2002). In 1975 the Federal Congress approved a reform that led to
the consolidation of the stock market, changing its name to Bolsa
Mexicana de Valores (Mexican Stock Market), and which involved the
merger of the stock markets operating in Guadalajara and Monterrey. In
1986, a further reform made government bonds, and particularly those
known as CETES (Certificados de la Tesorería), the dominant financial
vehicle on the market and authorised the participation of foreign-owned
companies. These reforms contributed to the maturity of the Mexican
financial market during the 1990s and its connectivity to the global system
(Burki and Edwards 1996). Yet a report by the World Bank indicated how
far the Mexican securities market had to go even in the mid-1990s, and
afforded tacit support for the privatisation of financial groups begun by
Carlos Salinas that opened the sector to further foreign involvement:
Mexico’s securities market is still relatively small and has not yet developed into a sufficiently important mechanism to finance industrial firms. Comparatively few and mostly well-established large companies are listed. However, due to a series of reforms taken by the government over the past few years, and sharp increases in share prices, the market has grown rapidly, with the total value of shares
229
traded reaching Mex$94,000 million in 1979… (World Bank 1997, p. 17)
By 2000, of 29 investment banks operating in Mexico, 16 had a majority of
Mexican capital and 13 a majority of foreign capital (BMV 2002). A set of
virtuous circumstances came together, therefore, with diversified
providers of financial services in retail banking services, insurance and
brokerage services, factoring and leasing services, asset and pension
management, investment banking and financial advisory services growing
rapidly during the 1990s (Expansión 1997). They seem to have done so,
according to the BMV, because of the ability to float on the stock market.
In 2000, most of the 172 companies with ‘floated’ stocks were Mexican
companies, but 80 of those dealing in commercial paper (debt), including
companies such as Ford and Banco Bilbao Vizcaya, were TNCs (BMV
2000).
TNC HEADQUARTERS AND THE FINANCIAL SECTOR IN MEXICO CITY
Although the picture is more complex than one purely of de-
industrialisation and the rise of the service sector as the main
transformation of economic activities in Mexico City, there is evidence that
Mexico’s and Mexico City’s economies have become more globalised in
regard to business practices in the past 20 years. This is the case for the
presence of TNC headquarters, a frequently used measure to assess the
importance of a city in terms of global economic activity (see Chapter Two,
as well as Taylor 1997; Sassen 1991). Analyses tend to calculate and
compare TNC headquarters across cities from an international perspective
230
and not relative to national contexts, and nor do they consider the reasons
to locate in a particular city. This raises a question as to the extent to which
globality and the location of TNCs in particular are linked to the financial
sector as an important factor of attraction.
Taylor, for example, considers Mexico City to be part of a global network of
cities interconnected in terms of financial and other advanced services,
and ranks Mexico City in his intermediate category of “beta world cities”
(Taylor 1997). This category includes Zurich, Toronto, Madrid, Chicago,
Taipei, Johannesburg and Moscow, in terms of provision of global services
such as marketing, law, accountancy and banking/finance. Taylor’s list is
made up of the total number of global producer service offices, with
companies broken down by cities; for Mexico City the sample includes the
following sectors: accountancy (5), advertising (11), banking/finance (14)
and law (16). Mexico City ranks 18th out of 53 cities included in the study
and higher than all other Latin American cities, including Sao Paulo,
Buenos Aires, Santiago and Caracas, and some US cities usually
considered to be regional global centres such as Miami (ranked 33rd) and
Dallas (42nd). Disaggregating the data and looking at the rankings per
activity, Mexico City ranks better for finance, where it jumps to 13th place.
As explained in Chapter Three, the experience of ISI or the “closed
economy” was ambiguous in that the Mexican economy was for the
majority of the 20th century open but protected. By contrast, for the
period 1980–2000 deregulation was coupled with higher levels of
openness and the dismantling of protectionist barriers. I had expected
231
therefore that a small number of TNCs would have arrived in Mexico
during the 1980s, their location decisions triggered by the dismantling of
the protectionist system. The data, however, suggest that this assumption
was erroneous. During the early phase of so-called “opening”, Mexico City
was shown to be a preferred location for TNCs compared to the rest of the
country. Using the Expansión database (used to develop the Globality
Index in Chapter Three) it was decided to explore the concentration of
TNCs further, at least between 1980 and 2000. The data confirm a pattern
of limited variation over the period. In 1982, 287 of the Expansión Top
500 Companies were headquartered in Mexico City, a number that
changed only slightly in the next decade. By 2000, Mexico City hosted 213
of the Top 500. So, while one might expect an increase in the number of
TNCs headquartered in Mexico City as a result of globalisation, the data
suggest otherwise. Rather, during ISI, TNCs were attracted by the
expanding national market and needed to be located in Mexico City,
whereas with market deregulation, privatisation and the restructuring of
some industries, TNCs began to leave Mexico City or new members of the
Top 500 decided against locating there. The reverse of this pattern can be
seen in Nuevo León, or more specifically Monterrey – in 2000 the number
of Top 500 Companies in the state of Nuevo León increased to 66 from 12
in 1980.141
Looking more closely at the data on headquarter locations for Top 500
firms it is possible to distinguish between foreign-owned and nationally
141 Government officials at the city level especially worked hard to ‘accommodate’ TNCs in ‘world class’ business parks, notably Santa Fe, which required passing public authority to private organisations for planning and management (Camacho Solís interview 1999).
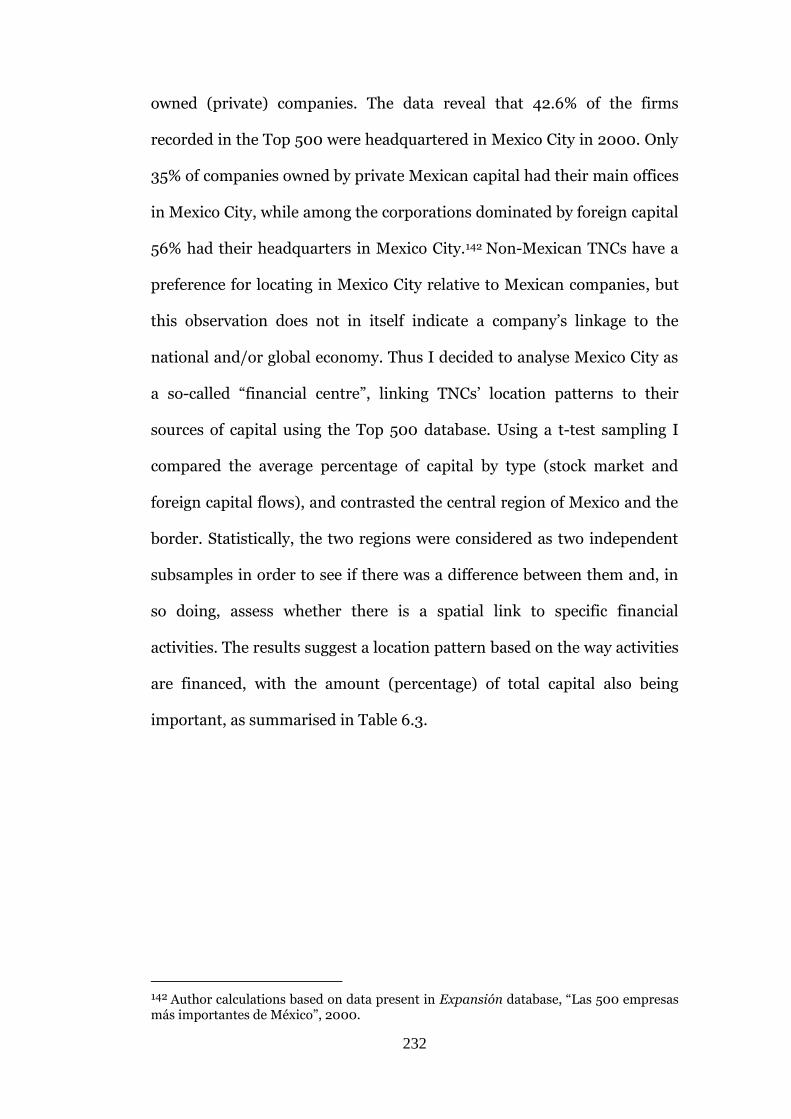
232
owned (private) companies. The data reveal that 42.6% of the firms
recorded in the Top 500 were headquartered in Mexico City in 2000. Only
35% of companies owned by private Mexican capital had their main offices
in Mexico City, while among the corporations dominated by foreign capital
56% had their headquarters in Mexico City.142 Non-Mexican TNCs have a
preference for locating in Mexico City relative to Mexican companies, but
this observation does not in itself indicate a company’s linkage to the
national and/or global economy. Thus I decided to analyse Mexico City as
a so-called “financial centre”, linking TNCs’ location patterns to their
sources of capital using the Top 500 database. Using a t-test sampling I
compared the average percentage of capital by type (stock market and
foreign capital flows), and contrasted the central region of Mexico and the
border. Statistically, the two regions were considered as two independent
subsamples in order to see if there was a difference between them and, in
so doing, assess whether there is a spatial link to specific financial
activities. The results suggest a location pattern based on the way activities
are financed, with the amount (percentage) of total capital also being
important, as summarised in Table 6.3.
142 Author calculations based on data present in Expansión database, “Las 500 empresas más importantes de México”, 2000.
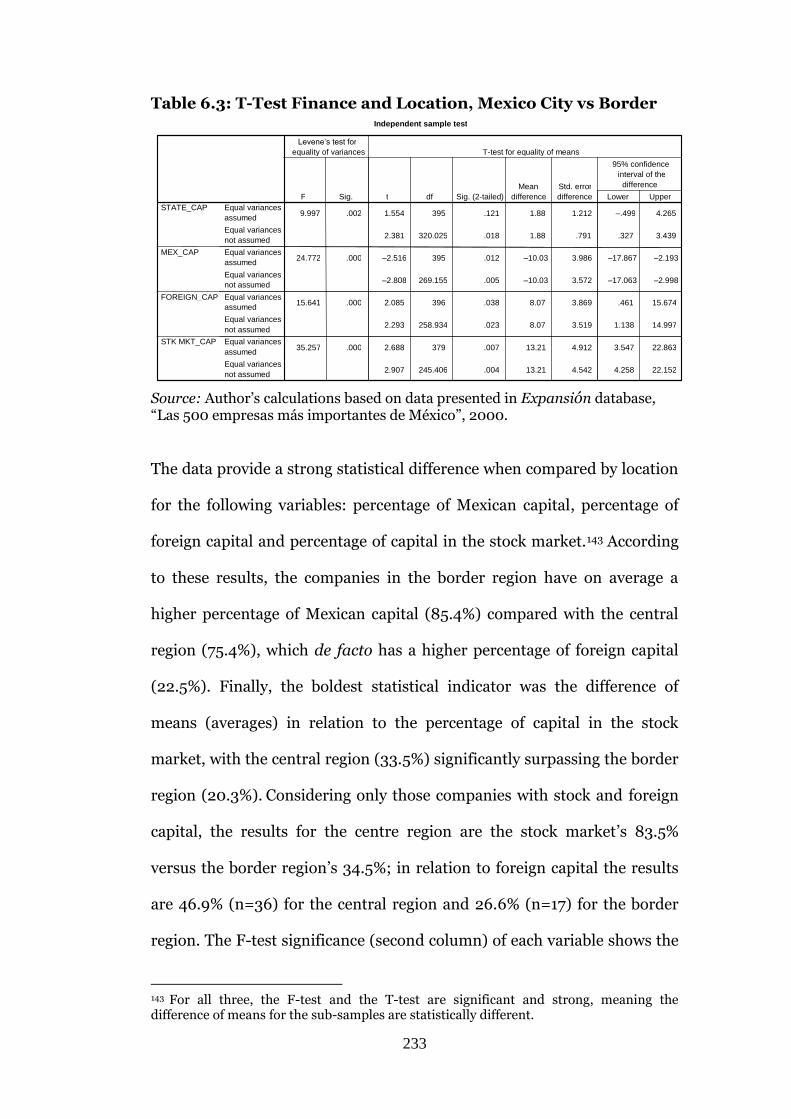
233
Table 6.3: T-Test Finance and Location, Mexico City vs Border
Source: Author’s calculations based on data presented in Expansión database, “Las 500 empresas más importantes de México”, 2000.
The data provide a strong statistical difference when compared by location
for the following variables: percentage of Mexican capital, percentage of
foreign capital and percentage of capital in the stock market.143 According
to these results, the companies in the border region have on average a
higher percentage of Mexican capital (85.4%) compared with the central
region (75.4%), which de facto has a higher percentage of foreign capital
(22.5%). Finally, the boldest statistical indicator was the difference of
means (averages) in relation to the percentage of capital in the stock
market, with the central region (33.5%) significantly surpassing the border
region (20.3%). Considering only those companies with stock and foreign
capital, the results for the centre region are the stock market’s 83.5%
versus the border region’s 34.5%; in relation to foreign capital the results
are 46.9% (n=36) for the central region and 26.6% (n=17) for the border
region. The F-test significance (second column) of each variable shows the
143 For all three, the F-test and the T-test are significant and strong, meaning the difference of means for the sub-samples are statistically different.
Independent sample test
9.997 .002 1.554 395 .121 1.88 1.212 –.499 4.265
2.381 320.025 .018 1.88 .791 .327 3.439
24.772 .000 –2.516 395 .012 –10.03 3.986 –17.867 –2.193
–2.808 269.155 .005 –10.03 3.572 –17.063 –2.998
15.641 .000 2.085 396 .038 8.07 3.869 .461 15.674
2.293 258.934 .023 8.07 3.519 1.138 14.997
35.257 .000 2.688 379 .007 13.21 4.912 3.547 22.863
2.907 245.406 .004 13.21 4.542 4.258 22.152
Equal variances assumed Equal variances not assumed Equal variances assumed Equal variances not assumed Equal variances assumed Equal variances not assumed Equal variances assumed Equal variances not assumed
STATE_CAP
MEX_CAP
FOREIGN_CAP
STK MKT_CAP
F Sig.
Levene’s test for equality of variances
t df Sig. (2-tailed) Mean
difference Std. error difference Lower Upper
95% confidence interval of the
difference
T-test for equality of means
234
highest level of association (F=35.257 significance=.0000) for a company
to have the highest level of stock market capital as a percentage of total
capital, and be located in Mexico City.
Among those companies with the highest level of FDI are the automotive
assembly companies, with up to 100% total foreign capital
(DaimlerChrysler, General Motors, and Ford), the computer electronics
sector (Hewlett Packard and Olivetti), the consumer electronics sector
(Daewoo Electronics) and chemicals (Ciba Especialidades Químicas). In
relation to those companies located in the central part of the country with
the highest percentage of capital in the stock market, the Mexican
industrial groups Carso, Desc Televisa and Gigante stand out. It is worth
mentioning that this test was not statistically significant when looking for
location patterns for other variables such as international financial activity
(international liabilities), size of company (total employment) and start-up
year, and all are non-statistically significant when compared by location.144
The analysis of the characteristics and profiles of companies locating in
Mexico City confirms the ideas developed by Sassen in relation to the rise
of Mexico City as an important production node for the provision of
financial and producer services, suggesting a broader set of economic
144 The only set of variables confirmed to be significant (as would be expected) was the difference in means between exports and imports, as those companies registered in border states have on average 48% and 53% of total sales dedicated to imports and exports respectively, compared with 13% and 12% for companies in the Mexico City region. This does not mean that companies located in the border region have higher international trade activity, but rather that their main market orientation is towards the US market, as compared with those located in the central part of the country, whose main market orientation is domestic.
235
interactions taking place in the city associated with the restructuring of the
local economy.
ECONOMIC RESTRUCTURING AND SOCIAL POLARISATION IN MEXICO
CITY
As capital, financial or industrial, moves around Mexico or does not, there
will be impacts on resident populations, as workers or their dependents.
Whether as a result of trade liberalisation or wider globalisation processes,
the hypotheses that drive the research for this thesis as a whole, it is
important to consider what impacts changes to manufacturing structure
and the rise of financial services have had on social polarisation in Mexico
City. It is a widely held view in Mexico that polarisation worsened (from
already high levels) from the early 1980s to 2000, a view that is applied
irrespective of whether the scales are national or international (Aguilar
1997; Dussel Peters 1996; Parnreiter 2001). Panuco, who conducted an
analysis of income inequality in Mexico over this period, concluded that:
…the study of inequality has revealed that inequality between urban and rural areas increased, since the difference in development between both areas had widened. It was also observed that the increase in inequality at the national level was more an urban phenomenon than a rural one, since inequality in urban areas increased considerably, whereas inequality in rural areas remained more or less at the same level between 1984 and 1996… (Panuco 1999, p. 188)
Panuco’s argument notes enhanced inequality over the period of trade
liberalisation but contradicts Sassen by alerting us to a potential source of
income inequality in metropolitan regions, as a “trickle-down effect” seems
to lead to a more equal distribution within urban developed regions but a
more unequal one between urban and rural areas.
236
There are few controlled data sets to back up these views, and this
prompted me to conduct a quantitative analysis on “income distribution”
using data from INEGI income expenditure surveys for 1983, 1989, 1992,
1996 and 1998. In order to analyse the changes that occurred in income
distribution in Mexico City between 1983 and 1998 (the only surveys
available to conduct a comparison of the analysis period), this section will
look at inequality changes over time, using shares of total income and
average income for each decile of income distribution and using the Lorenz
curve to show distribution over time.
Before looking at Mexico City in detail it is important to consider the
national context between 1983 and 1998, which shows more or less
constant shares by decile (Table 6.4). There is a trend to polarisation at the
end of the period, with the richest tenth decile and the poorest first decile
showing growth and the remaining eight deciles showing a decrease in
income share. The Gini coefficient does show sensitivity to these changes
and increased from 0.45 to 0.5, meaning an increase in income
inequality.145
145 The Gini coefficient varies from 0 when income is completely equally distributed to a value of 1 when one person has all the income. An aggregate inequality measure such as the Gini oefficient can tell us how overall income inequality has changed, but does not show where in the income distribution the changes have been occurring.
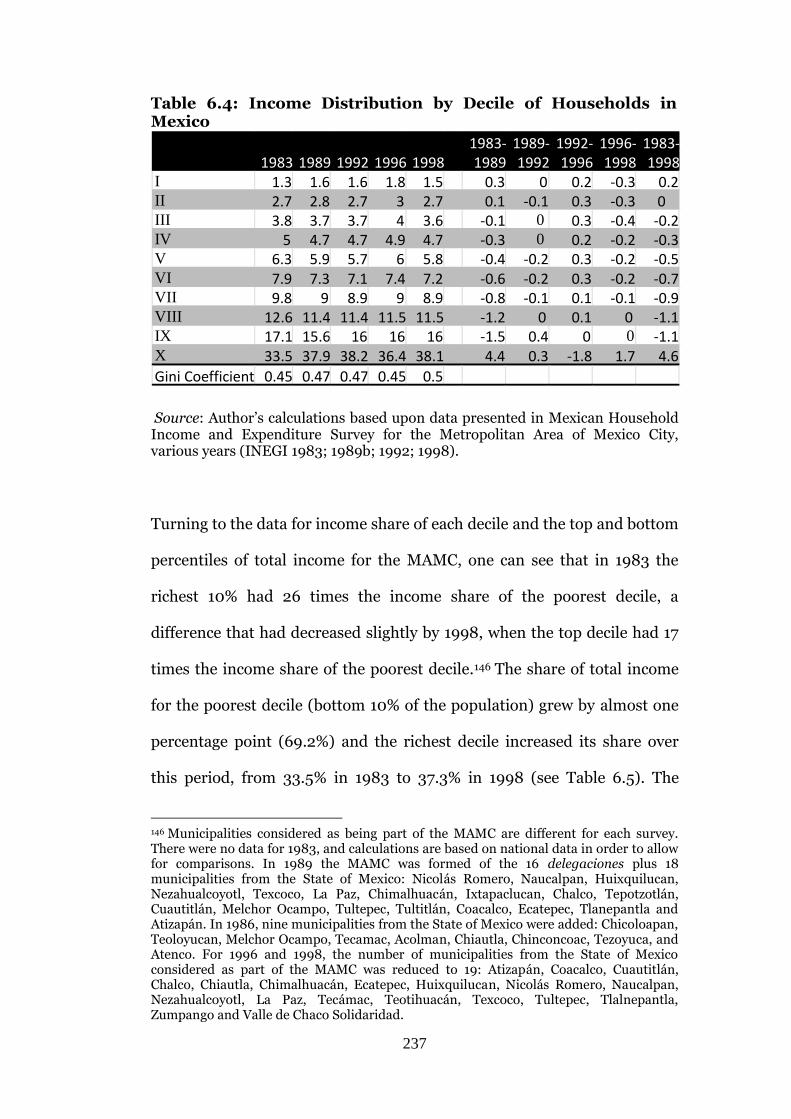
237
Table 6.4: Income Distribution by Decile of Households in Mexico
Source: Author’s calculations based upon data presented in Mexican Household Income and Expenditure Survey for the Metropolitan Area of Mexico City, various years (INEGI 1983; 1989b; 1992; 1998).
Turning to the data for income share of each decile and the top and bottom
percentiles of total income for the MAMC, one can see that in 1983 the
richest 10% had 26 times the income share of the poorest decile, a
difference that had decreased slightly by 1998, when the top decile had 17
times the income share of the poorest decile.146 The share of total income
for the poorest decile (bottom 10% of the population) grew by almost one
percentage point (69.2%) and the richest decile increased its share over
this period, from 33.5% in 1983 to 37.3% in 1998 (see Table 6.5). The
146 Municipalities considered as being part of the MAMC are different for each survey. There were no data for 1983, and calculations are based on national data in order to allow for comparisons. In 1989 the MAMC was formed of the 16 delegaciones plus 18 municipalities from the State of Mexico: Nicolás Romero, Naucalpan, Huixquilucan, Nezahualcoyotl, Texcoco, La Paz, Chimalhuacán, Ixtapaclucan, Chalco, Tepotzotlán, Cuautitlán, Melchor Ocampo, Tultepec, Tultitlán, Coacalco, Ecatepec, Tlanepantla and Atizapán. In 1986, nine municipalities from the State of Mexico were added: Chicoloapan, Teoloyucan, Melchor Ocampo, Tecamac, Acolman, Chiautla, Chinconcoac, Tezoyuca, and Atenco. For 1996 and 1998, the number of municipalities from the State of Mexico considered as part of the MAMC was reduced to 19: Atizapán, Coacalco, Cuautitlán, Chalco, Chiautla, Chimalhuacán, Ecatepec, Huixquilucan, Nicolás Romero, Naucalpan, Nezahualcoyotl, La Paz, Tecámac, Teotihuacán, Texcoco, Tultepec, Tlalnepantla, Zumpango and Valle de Chaco Solidaridad.
1983- 1989- 1992- 1996- 1983- 1983 1989 1992 1996 1998 1989 1992 1996 1998 1998
I 1.3 1.6 1.6 1.8 1.5 0.3 0 0.2 -0.3 0.2
II 2.7 2.8 2.7 3 2.7 0.1 -0.1 0.3 -0.3 0
III 3.8 3.7 3.7 4 3.6 -0.1 0 0.3 -0.4 -0.2
IV 5 4.7 4.7 4.9 4.7 -0.3 0 0.2 -0.2 -0.3
V 6.3 5.9 5.7 6 5.8 -0.4 -0.2 0.3 -0.2 -0.5
VI 7.9 7.3 7.1 7.4 7.2 -0.6 -0.2 0.3 -0.2 -0.7
VII 9.8 9 8.9 9 8.9 -0.8 -0.1 0.1 -0.1 -0.9
VIII 12.6 11.4 11.4 11.5 11.5 -1.2 0 0.1 0 -1.1
IX 17.1 15.6 16 16 16 -1.5 0.4 0 0 -1.1
X 33.5 37.9 38.2 36.4 38.1 4.4 0.3 -1.8 1.7 4.6
Gini Coefficient 0.45 0.47 0.47 0.45 0.5
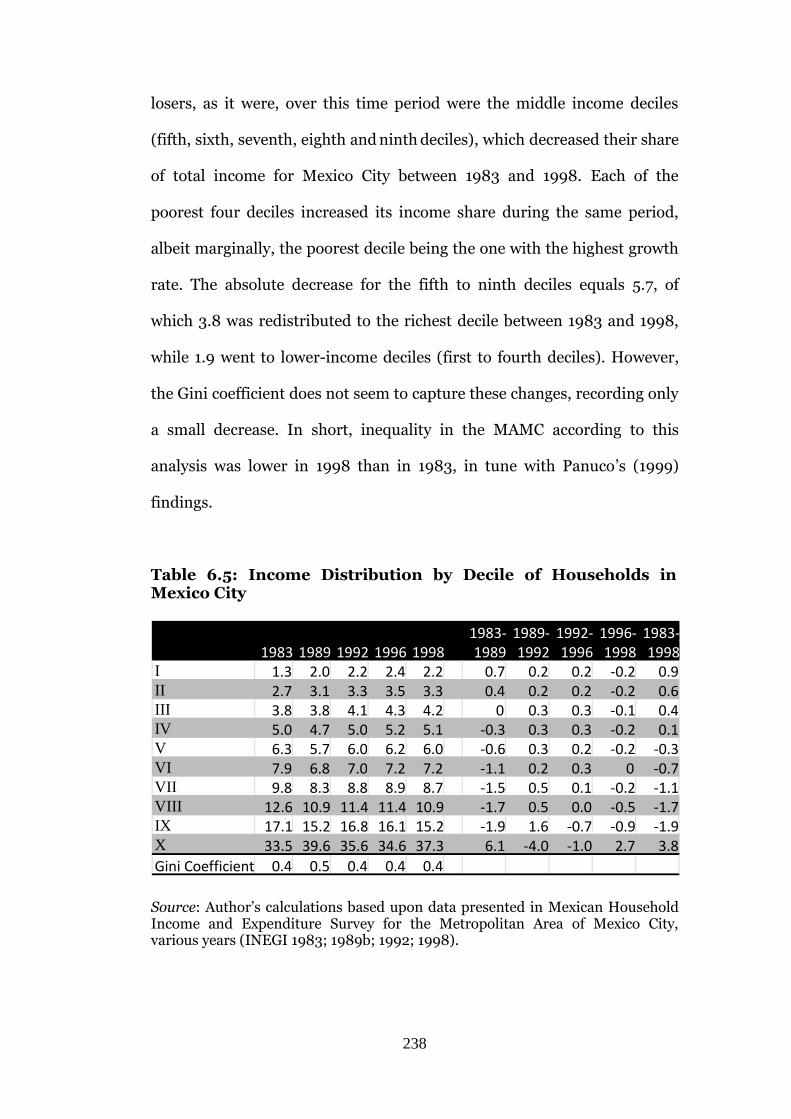
238
losers, as it were, over this time period were the middle income deciles
(fifth, sixth, seventh, eighth and ninth deciles), which decreased their share
of total income for Mexico City between 1983 and 1998. Each of the
poorest four deciles increased its income share during the same period,
albeit marginally, the poorest decile being the one with the highest growth
rate. The absolute decrease for the fifth to ninth deciles equals 5.7, of
which 3.8 was redistributed to the richest decile between 1983 and 1998,
while 1.9 went to lower-income deciles (first to fourth deciles). However,
the Gini coefficient does not seem to capture these changes, recording only
a small decrease. In short, inequality in the MAMC according to this
analysis was lower in 1998 than in 1983, in tune with Panuco’s (1999)
findings.
Table 6.5: Income Distribution by Decile of Households in Mexico City
Source: Author’s calculations based upon data presented in Mexican Household Income and Expenditure Survey for the Metropolitan Area of Mexico City, various years (INEGI 1983; 1989b; 1992; 1998).
1983- 1989- 1992- 1996- 1983- 1983 1989 1992 1996 1998 1989 1992 1996 1998 1998
I 1.3 2.0 2.2 2.4 2.2 0.7 0.2 0.2 -0.2 0.9
II 2.7 3.1 3.3 3.5 3.3 0.4 0.2 0.2 -0.2 0.6
III 3.8 3.8 4.1 4.3 4.2 0 0.3 0.3 -0.1 0.4
IV 5.0 4.7 5.0 5.2 5.1 -0.3 0.3 0.3 -0.2 0.1
V 6.3 5.7 6.0 6.2 6.0 -0.6 0.3 0.2 -0.2 -0.3
VI 7.9 6.8 7.0 7.2 7.2 -1.1 0.2 0.3 0 -0.7
VII 9.8 8.3 8.8 8.9 8.7 -1.5 0.5 0.1 -0.2 -1.1
VIII 12.6 10.9 11.4 11.4 10.9 -1.7 0.5 0.0 -0.5 -1.7
IX 17.1 15.2 16.8 16.1 15.2 -1.9 1.6 -0.7 -0.9 -1.9
X 33.5 39.6 35.6 34.6 37.3 6.1 -4.0 -1.0 2.7 3.8
Gini Coefficient 0.4 0.5 0.4 0.4 0.4
239
Comparing income distribution trends between Mexico (nationally) and
Mexico City we can see that for both there has been a degree of
polarisation. However, at the national level the redistribution from the
middle to the top and bottom deciles is more dramatic, a trend that we
might expect for Mexico City following Sassen’s polarisation argument. Yet
Figure 6.3 shows that the Lorenz curves for 1989 and 1998 cross the line
for 1983 between the fifth and seventh decile. According to Figure 6.3, the
poorest deciles - one to six - were better off in 1989 and 1998 in relation to
1983, suggesting an improvement in income inequality over the period as
the lines for these two years are closer to the 45-degree line. However, this
marginal improvement was undermined by the increased share of income
to the richest deciles – eight to ten - in 1989 and 1998: the curves move
away from the 45-degree line compared with 1983. The Gini coefficient,
therefore, indicates an increased polarisation over the period but with the
important caveat that a shift to increased income equality for poorer
income-earners over the period measured was not replicated for higher-
earners, who commanded increased shares of income in 1989 and 1998
than they had in 1983.
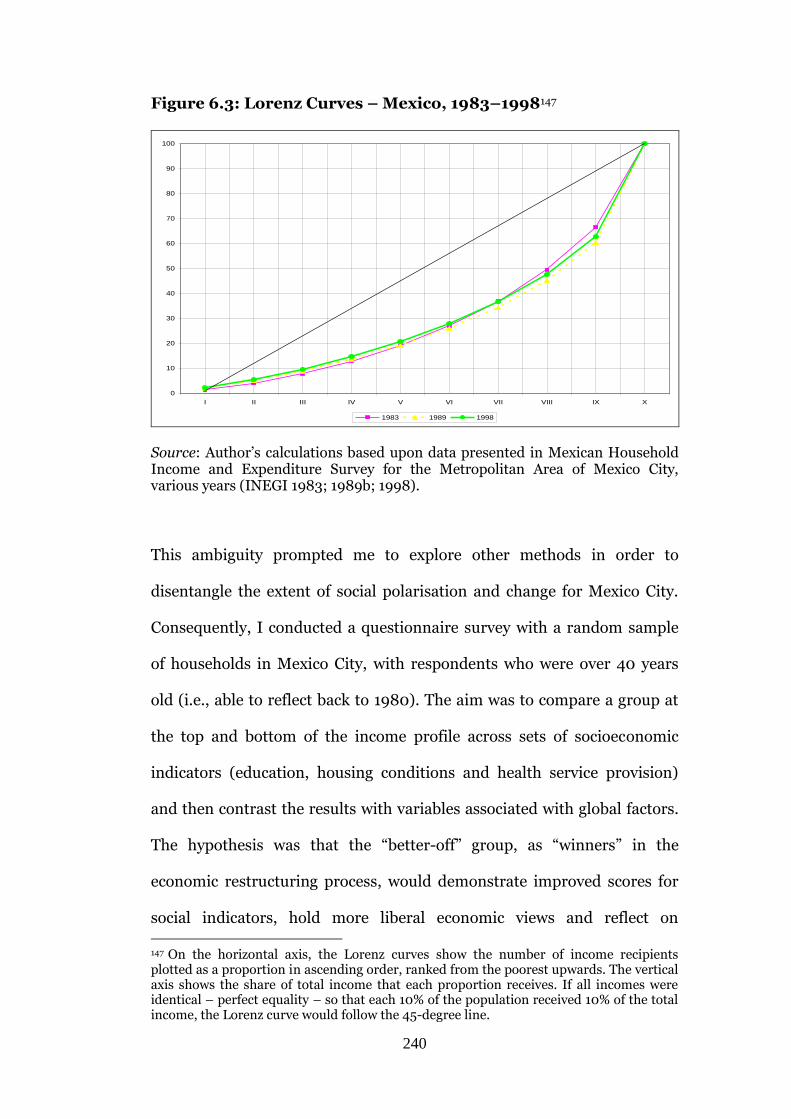
240
Figure 6.3: Lorenz Curves – Mexico, 1983–1998147
0
10
20
30
40
50
60
70
80
90
100
I II III IV V VI VII VIII IX X
1983 1989 1998
Source: Author’s calculations based upon data presented in Mexican Household Income and Expenditure Survey for the Metropolitan Area of Mexico City, various years (INEGI 1983; 1989b; 1998).
This ambiguity prompted me to explore other methods in order to
disentangle the extent of social polarisation and change for Mexico City.
Consequently, I conducted a questionnaire survey with a random sample
of households in Mexico City, with respondents who were over 40 years
old (i.e., able to reflect back to 1980). The aim was to compare a group at
the top and bottom of the income profile across sets of socioeconomic
indicators (education, housing conditions and health service provision)
and then contrast the results with variables associated with global factors.
The hypothesis was that the “better-off” group, as “winners” in the
economic restructuring process, would demonstrate improved scores for
social indicators, hold more liberal economic views and reflect on
147 On the horizontal axis, the Lorenz curves show the number of income recipients plotted as a proportion in ascending order, ranked from the poorest upwards. The vertical axis shows the share of total income that each proportion receives. If all incomes were identical – perfect equality – so that each 10% of the population received 10% of the total income, the Lorenz curve would follow the 45-degree line.
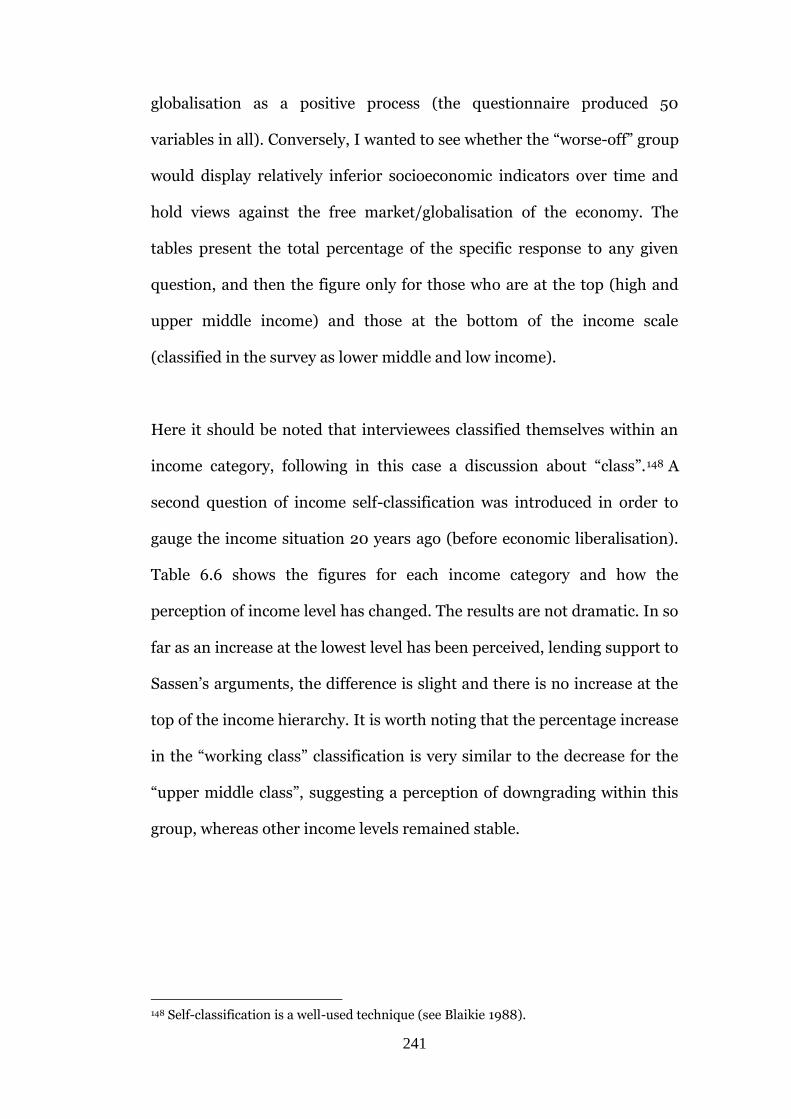
241
globalisation as a positive process (the questionnaire produced 50
variables in all). Conversely, I wanted to see whether the “worse-off” group
would display relatively inferior socioeconomic indicators over time and
hold views against the free market/globalisation of the economy. The
tables present the total percentage of the specific response to any given
question, and then the figure only for those who are at the top (high and
upper middle income) and those at the bottom of the income scale
(classified in the survey as lower middle and low income).
Here it should be noted that interviewees classified themselves within an
income category, following in this case a discussion about “class”.148 A
second question of income self-classification was introduced in order to
gauge the income situation 20 years ago (before economic liberalisation).
Table 6.6 shows the figures for each income category and how the
perception of income level has changed. The results are not dramatic. In so
far as an increase at the lowest level has been perceived, lending support to
Sassen’s arguments, the difference is slight and there is no increase at the
top of the income hierarchy. It is worth noting that the percentage increase
in the “working class” classification is very similar to the decrease for the
“upper middle class”, suggesting a perception of downgrading within this
group, whereas other income levels remained stable.
148 Self-classification is a well-used technique (see Blaikie 1988).
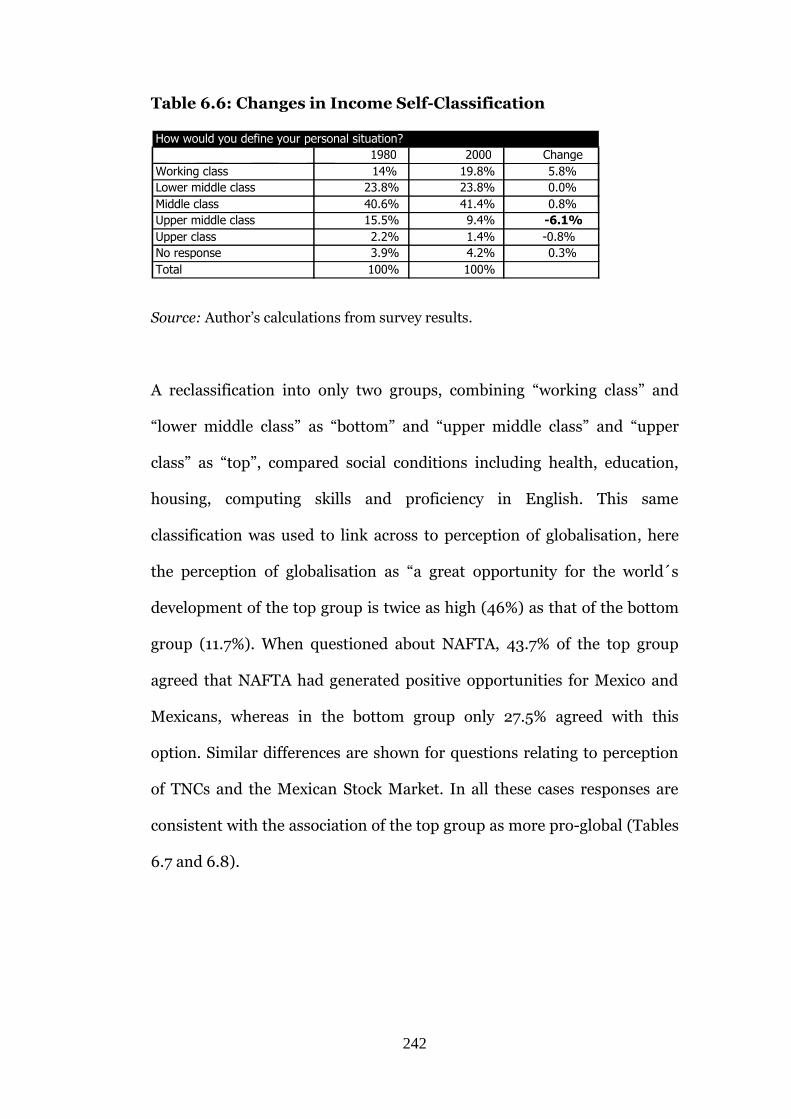
242
Table 6.6: Changes in Income Self-Classification
Source: Author’s calculations from survey results.
A reclassification into only two groups, combining “working class” and
“lower middle class” as “bottom” and “upper middle class” and “upper
class” as “top”, compared social conditions including health, education,
housing, computing skills and proficiency in English. This same
classification was used to link across to perception of globalisation, here
the perception of globalisation as “a great opportunity for the world´s
development of the top group is twice as high (46%) as that of the bottom
group (11.7%). When questioned about NAFTA, 43.7% of the top group
agreed that NAFTA had generated positive opportunities for Mexico and
Mexicans, whereas in the bottom group only 27.5% agreed with this
option. Similar differences are shown for questions relating to perception
of TNCs and the Mexican Stock Market. In all these cases responses are
consistent with the association of the top group as more pro-global (Tables
6.7 and 6.8).
How would you define your personal situation? 1980 2000 Change
Working class 14% 19.8% 5.8% Lower middle class 23.8% 23.8% 0.0% Middle class 40.6% 41.4% 0.8% Upper middle class 15.5% 9.4% -6.1% Upper class 2.2% 1.4% -0.8% No response 3.9% 4.2% 0.3% Total 100% 100%
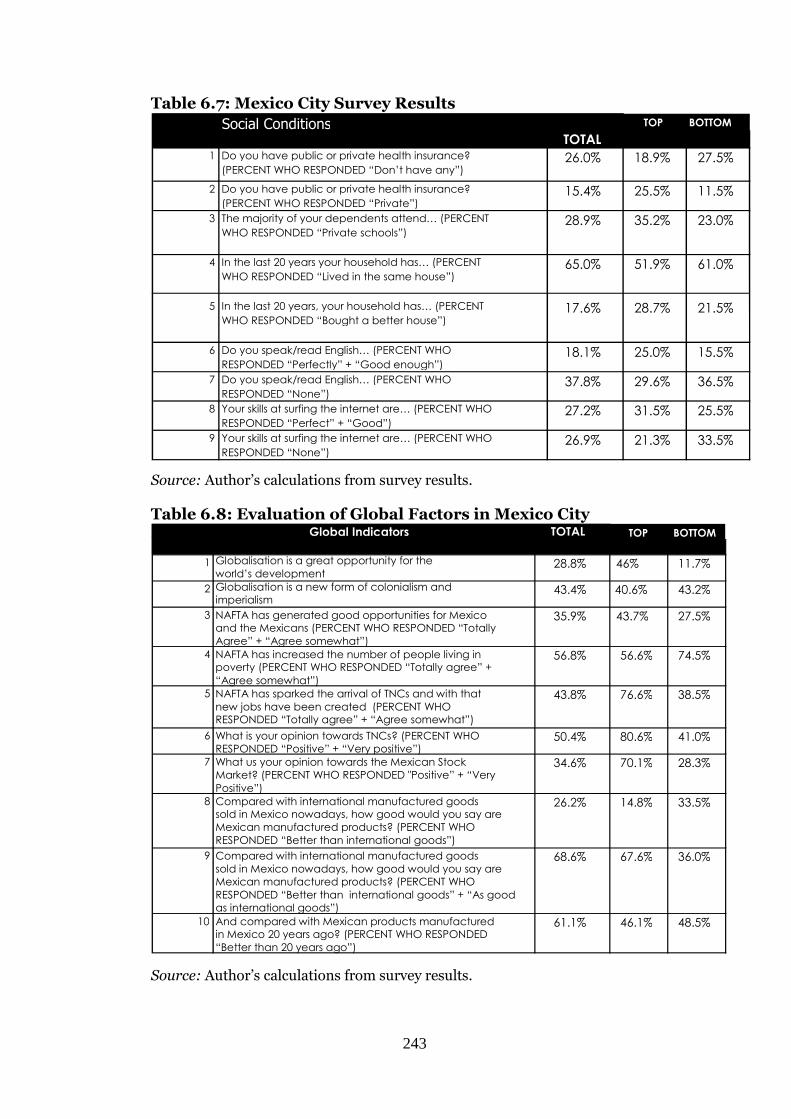
243
Table 6.7: Mexico City Survey Results
Source: Author’s calculations from survey results.
Table 6.8: Evaluation of Global Factors in Mexico City
Source: Author’s calculations from survey results.
Social Conditions TOP BOTTOM TOTAL
1 Do you have public or private health insurance? (PERCENT WHO RESPONDED “Don’t have any”)
26.0% 18.9% 27.5%
2 Do you have public or private health insurance? (PERCENT WHO RESPONDED “Private”)
15.4% 25.5% 11.5%
3 The majority of your dependents attend… (PERCENT WHO RESPONDED “Private schools”)
28.9% 35.2% 23.0%
4 In the last 20 years your household has… (PERCENT WHO RESPONDED “Lived in the same house”)
65.0% 51.9% 61.0%
5 In the last 20 years, your household has… (PERCENT WHO RESPONDED “Bought a better house”)
17.6% 28.7% 21.5%
6 Do you speak/read English… (PERCENT WHO RESPONDED “Perfectly” + “Good enough”)
18.1% 25.0% 15.5%
7 Do you speak/read English… (PERCENT WHO RESPONDED “None”)
37.8% 29.6% 36.5%
8 Your skills at surfing the internet are… (PERCENT WHO RESPONDED “Perfect” + “Good”)
27.2% 31.5% 25.5%
9 Your skills at surfing the internet are… (PERCENT WHO RESPONDED “None”)
26.9% 21.3% 33.5%
TOP BOTTOM TOTAL
1 Globalisation is a great opportunity for the
world’s development 28.8% 46% 11.7%
2 Globalisation is a new form of colonialism and imperialism
43.4% 40.6% 43.2%
3 NAFTA has generated good opportunities for Mexico and the Mexicans (PERCENT WHO RESPONDED “Totally Agree” + “Agree somewhat”)
35.9% 43.7% 27.5%
4 NAFTA has increased the number of people living in poverty (PERCENT WHO RESPONDED “Totally agree” + “Agree somewhat”)
56.8% 56.6% 74.5%
5 NAFTA has sparked the arrival of TNCs and with that new jobs have been created (PERCENT WHO RESPONDED “Totally agree” + “Agree somewhat”)
43.8% 76.6% 38.5%
6 What is your opinion towards TNCs? (PERCENT WHO RESPONDED “Positive” + “Very positive”)
50.4% 80.6% 41.0%
7 What us your opinion towards the Mexican Stock Market? (PERCENT WHO RESPONDED "Positive” + “Very Positive”)
34.6% 70.1% 28.3%
8 Compared with international manufactured goods sold in Mexico nowadays, how good would you say are Mexican manufactured products? (PERCENT WHO RESPONDED “Better than international goods”)
26.2% 14.8% 33.5%
9 Compared with international manufactured goods sold in Mexico nowadays, how good would you say are Mexican manufactured products? (PERCENT WHO RESPONDED “Better than international goods” + “As good as international goods”)
68.6% 67.6% 36.0%
10 And compared with Mexican products manufactured in Mexico 20 years ago? (PERCENT WHO RESPONDED “Better than 20 years ago”)
61.1% 46.1% 48.5%
Global Indicators
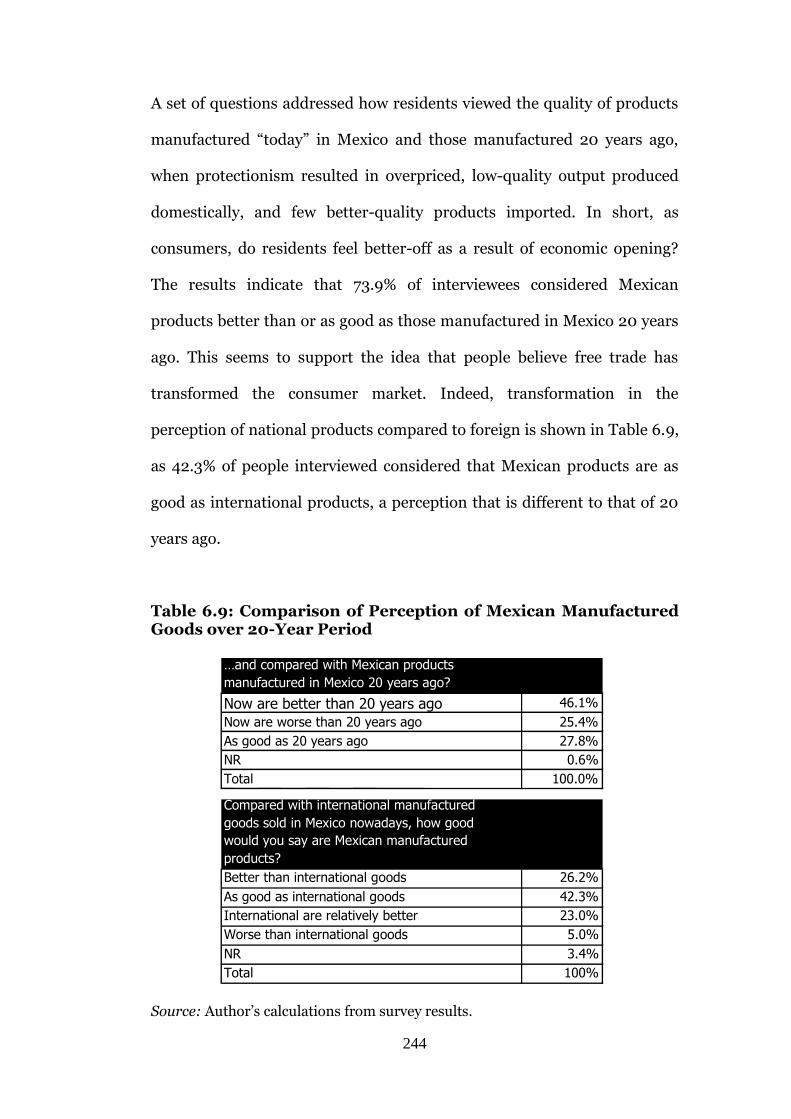
244
A set of questions addressed how residents viewed the quality of products
manufactured “today” in Mexico and those manufactured 20 years ago,
when protectionism resulted in overpriced, low-quality output produced
domestically, and few better-quality products imported. In short, as
consumers, do residents feel better-off as a result of economic opening?
The results indicate that 73.9% of interviewees considered Mexican
products better than or as good as those manufactured in Mexico 20 years
ago. This seems to support the idea that people believe free trade has
transformed the consumer market. Indeed, transformation in the
perception of national products compared to foreign is shown in Table 6.9,
as 42.3% of people interviewed considered that Mexican products are as
good as international products, a perception that is different to that of 20
years ago.
Table 6.9: Comparison of Perception of Mexican Manufactured Goods over 20-Year Period
Source: Author’s calculations from survey results.
…and compared with Mexican products
manufactured in Mexico 20 years ago?
Now are better than 20 years ago 46.1%
Now are worse than 20 years ago 25.4%
As good as 20 years ago 27.8%
NR 0.6%
Total 100.0%
Compared with international manufactured
goods sold in Mexico nowadays, how good
would you say are Mexican manufactured
products?
Better than international goods 26.2%
As good as international goods 42.3%
International are relatively better 23.0%
Worse than international goods 5.0%
NR 3.4%
Total 100%
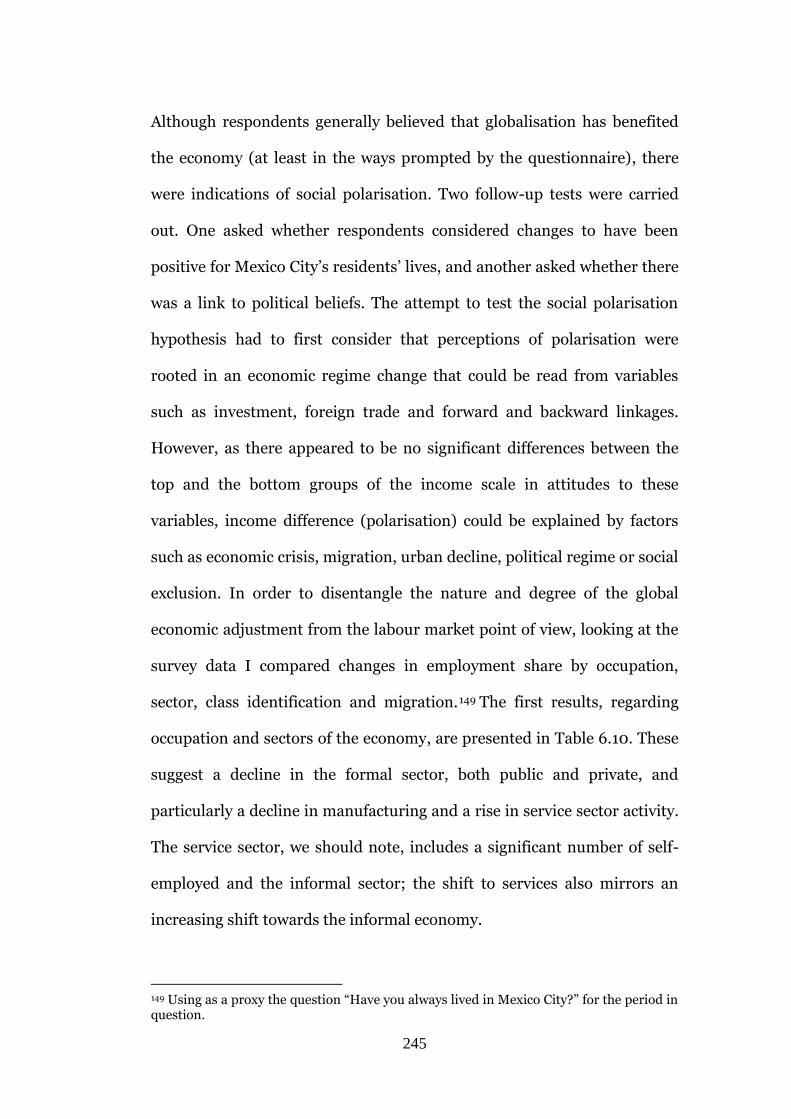
245
Although respondents generally believed that globalisation has benefited
the economy (at least in the ways prompted by the questionnaire), there
were indications of social polarisation. Two follow-up tests were carried
out. One asked whether respondents considered changes to have been
positive for Mexico City’s residents’ lives, and another asked whether there
was a link to political beliefs. The attempt to test the social polarisation
hypothesis had to first consider that perceptions of polarisation were
rooted in an economic regime change that could be read from variables
such as investment, foreign trade and forward and backward linkages.
However, as there appeared to be no significant differences between the
top and the bottom groups of the income scale in attitudes to these
variables, income difference (polarisation) could be explained by factors
such as economic crisis, migration, urban decline, political regime or social
exclusion. In order to disentangle the nature and degree of the global
economic adjustment from the labour market point of view, looking at the
survey data I compared changes in employment share by occupation,
sector, class identification and migration.149 The first results, regarding
occupation and sectors of the economy, are presented in Table 6.10. These
suggest a decline in the formal sector, both public and private, and
particularly a decline in manufacturing and a rise in service sector activity.
The service sector, we should note, includes a significant number of self-
employed and the informal sector; the shift to services also mirrors an
increasing shift towards the informal economy.
149 Using as a proxy the question “Have you always lived in Mexico City?” for the period in question.
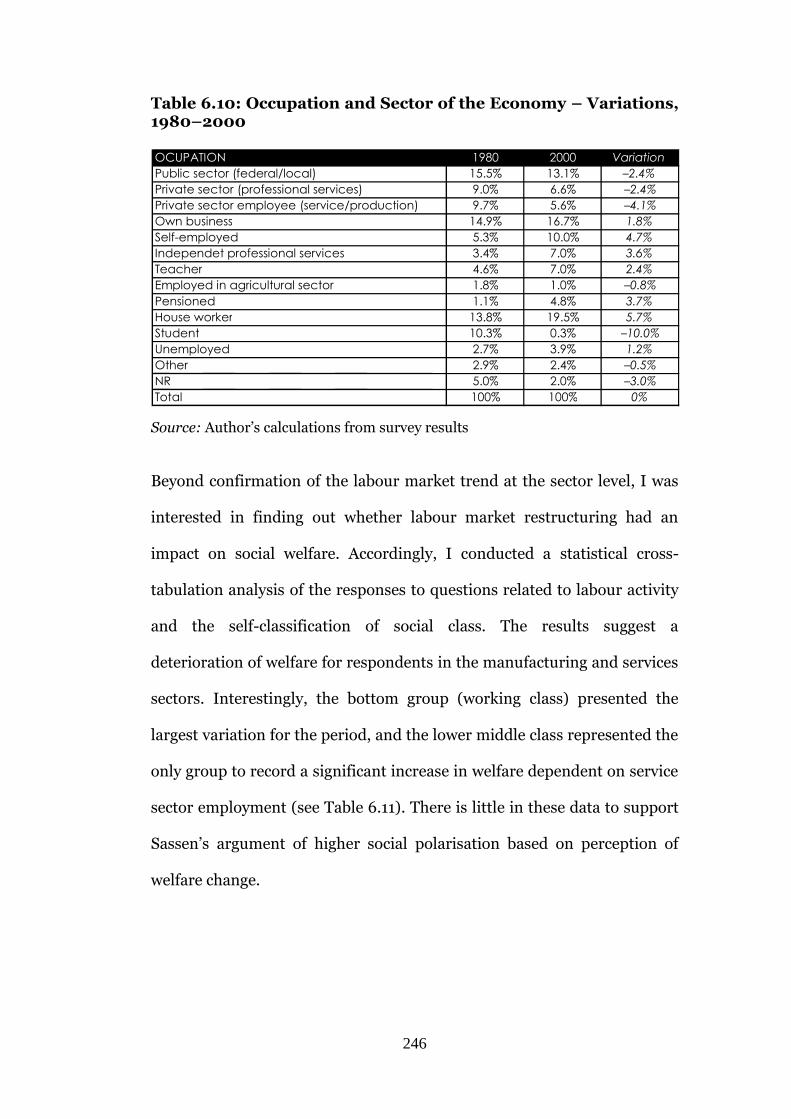
246
Table 6.10: Occupation and Sector of the Economy – Variations, 1980–2000
Source: Author’s calculations from survey results
Beyond confirmation of the labour market trend at the sector level, I was
interested in finding out whether labour market restructuring had an
impact on social welfare. Accordingly, I conducted a statistical cross-
tabulation analysis of the responses to questions related to labour activity
and the self-classification of social class. The results suggest a
deterioration of welfare for respondents in the manufacturing and services
sectors. Interestingly, the bottom group (working class) presented the
largest variation for the period, and the lower middle class represented the
only group to record a significant increase in welfare dependent on service
sector employment (see Table 6.11). There is little in these data to support
Sassen’s argument of higher social polarisation based on perception of
welfare change.
OCUPATION 1980 2000 Variation Public sector (federal/local) 15.5% 13.1% –2.4% Private sector (professional services) 9.0% 6.6% –2.4% Private sector employee (service/production) 9.7% 5.6% –4.1% Own business 14.9% 16.7% 1.8% Self-employed 5.3% 10.0% 4.7% Independet professional services 3.4% 7.0% 3.6% Teacher 4.6% 7.0% 2.4% Employed in agricultural sector 1.8% 1.0% –0.8% Pensioned 1.1% 4.8% 3.7% House worker 13.8% 19.5% 5.7% Student 10.3% 0.3% –10.0% Unemployed 2.7% 3.9% 1.2% Other 2.9% 2.4% –0.5% NR 5.0% 2.0% –3.0% Total 100% 100% 0%
247
Table 6.11: Cross-Tabulation Analysis: Manufacturing and Service Sector vs Social Class, 1980–2000
Source: Author’s calculations from survey results.
The survey does indicate, however, a degree of “lumpiness” in employment
between the manufacturing and service sectors over the period (Table
6.12). In 2000, 96.4% of employees in the manufacturing sector reported
working in the same sector in the 1980s, whereas only 3.6% came from the
service sector. For those in the service sector in 2000, 78.6% of people
were in the same sector in the 1980s, while 21.4% had changed job from
the manufacturing sector. Despite an overall shift to service sector
employment and a decline in manufacturing, for the respondents to the
survey a striking feature is the high number of people remaining employed
in the same sector over the period, a figure of 83% for manufacturing and
95.3% for the service sector. Furthermore – and contrary to Sassen and
Massey, who suggest that social polarisation is down to changes at the
lower end of the labour scale, especially as a consequence of a strong
decline in manufacturing jobs leading to a shift to the informal service
sector – survey data on inter-sectoral migration point towards changes in
employment unrelated to social class mobility.
Working class
Lower middle class
Middle class Upper middle class
Upper class NR Total
Manufacturing 1980 14.2% 27.7% 41.9% 11.9% 2.3% 1.9% 100% Manufacturing 2000 20.2% 22.8% 39.5% 10.7% 2.2% 4.7% 100% Variation 6.0% –4.9% –2.4% –1.2% –0.1% 2.8% 0%
Services 1980 11.8% 22.2% 43.8% 19.6% 1.3% 1.3% 100% Services 2000 16.8% 24.3% 42.9% 12.8% 1.3% 1.8% 100% Variation 5.0% 2.1% –0.9% –6.8% 0.0% 0.5% 0%
Manufacturing and services sector vs social class
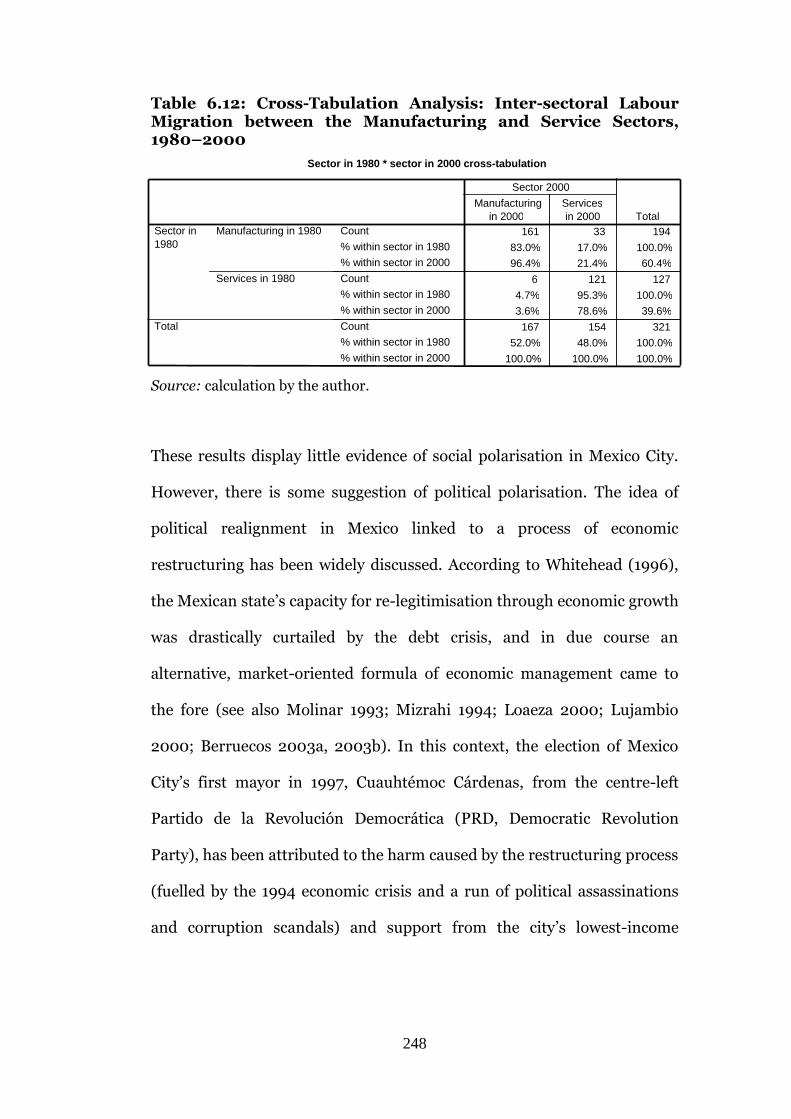
248
Table 6.12: Cross-Tabulation Analysis: Inter-sectoral Labour Migration between the Manufacturing and Service Sectors, 1980–2000
Source: calculation by the author.
These results display little evidence of social polarisation in Mexico City.
However, there is some suggestion of political polarisation. The idea of
political realignment in Mexico linked to a process of economic
restructuring has been widely discussed. According to Whitehead (1996),
the Mexican state’s capacity for re-legitimisation through economic growth
was drastically curtailed by the debt crisis, and in due course an
alternative, market-oriented formula of economic management came to
the fore (see also Molinar 1993; Mizrahi 1994; Loaeza 2000; Lujambio
2000; Berruecos 2003a, 2003b). In this context, the election of Mexico
City’s first mayor in 1997, Cuauhtémoc Cárdenas, from the centre-left
Partido de la Revolución Democrática (PRD, Democratic Revolution
Party), has been attributed to the harm caused by the restructuring process
(fuelled by the 1994 economic crisis and a run of political assassinations
and corruption scandals) and support from the city’s lowest-income
Sector in 1980 * sector in 2000 cross-tabulation
161 33 194 83.0% 17.0% 100.0% 96.4% 21.4% 60.4%
6 121 127 4.7% 95.3% 100.0% 3.6% 78.6% 39.6%
167 154 321 52.0% 48.0% 100.0%
100.0% 100.0% 100.0%
Count % within sector in 1980 % within sector in 2000 Count % within sector in 1980 % within sector in 2000 Count % within sector in 1980 % within sector in 2000
Manufacturing in 1980
Services in 1980
Sector in 1980
Total
Manufacturing in 2000
Services in 2000
Sector 2000
Total
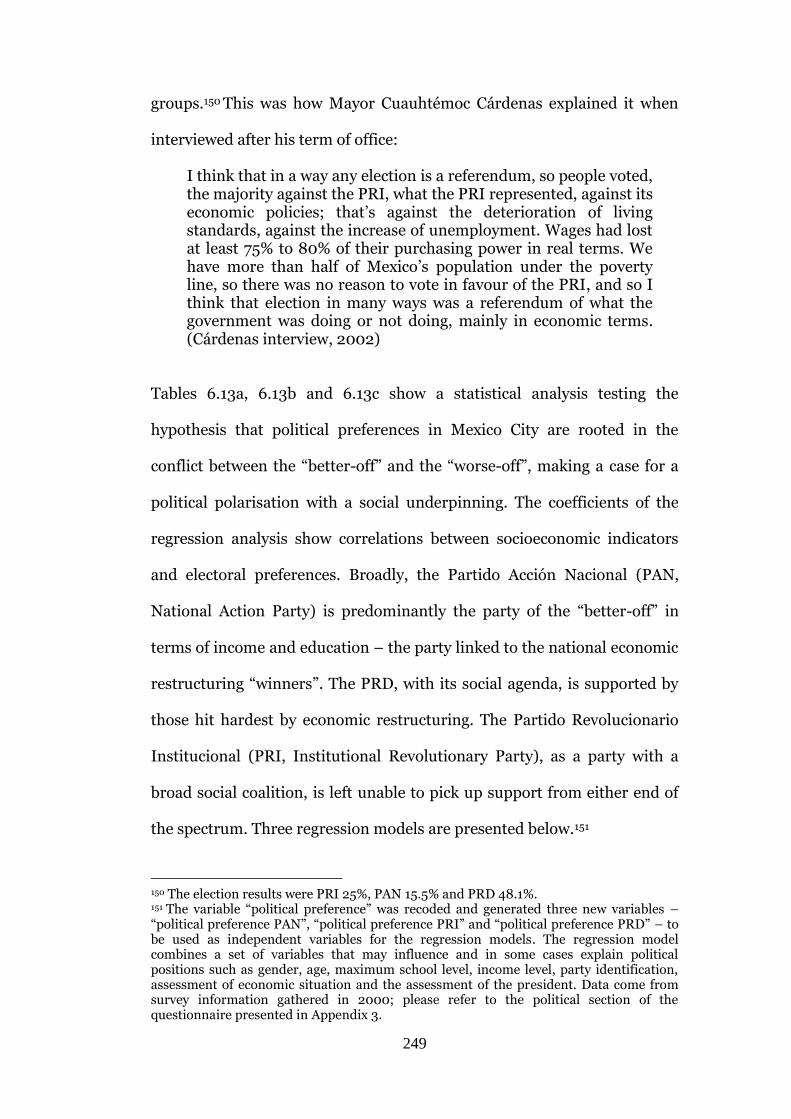
249
groups.150 This was how Mayor Cuauhtémoc Cárdenas explained it when
interviewed after his term of office:
I think that in a way any election is a referendum, so people voted, the majority against the PRI, what the PRI represented, against its economic policies; that’s against the deterioration of living standards, against the increase of unemployment. Wages had lost at least 75% to 80% of their purchasing power in real terms. We have more than half of Mexico’s population under the poverty line, so there was no reason to vote in favour of the PRI, and so I think that election in many ways was a referendum of what the government was doing or not doing, mainly in economic terms. (Cárdenas interview, 2002)
Tables 6.13a, 6.13b and 6.13c show a statistical analysis testing the
hypothesis that political preferences in Mexico City are rooted in the
conflict between the “better-off” and the “worse-off”, making a case for a
political polarisation with a social underpinning. The coefficients of the
regression analysis show correlations between socioeconomic indicators
and electoral preferences. Broadly, the Partido Acción Nacional (PAN,
National Action Party) is predominantly the party of the “better-off” in
terms of income and education – the party linked to the national economic
restructuring “winners”. The PRD, with its social agenda, is supported by
those hit hardest by economic restructuring. The Partido Revolucionario
Institucional (PRI, Institutional Revolutionary Party), as a party with a
broad social coalition, is left unable to pick up support from either end of
the spectrum. Three regression models are presented below.151
150 The election results were PRI 25%, PAN 15.5% and PRD 48.1%. 151 The variable “political preference” was recoded and generated three new variables – “political preference PAN”, “political preference PRI” and “political preference PRD” – to be used as independent variables for the regression models. The regression model combines a set of variables that may influence and in some cases explain political positions such as gender, age, maximum school level, income level, party identification, assessment of economic situation and the assessment of the president. Data come from survey information gathered in 2000; please refer to the political section of the questionnaire presented in Appendix 3.
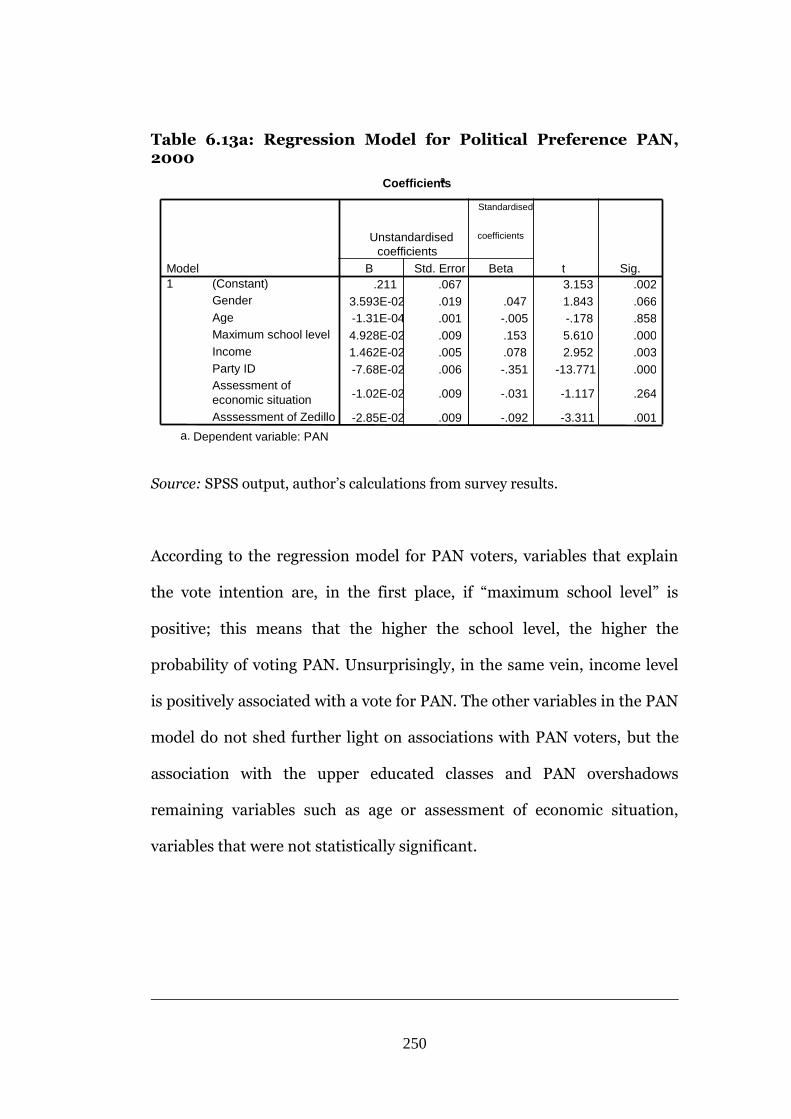
250
Table 6.13a: Regression Model for Political Preference PAN, 2000
Source: SPSS output, author’s calculations from survey results.
According to the regression model for PAN voters, variables that explain
the vote intention are, in the first place, if “maximum school level” is
positive; this means that the higher the school level, the higher the
probability of voting PAN. Unsurprisingly, in the same vein, income level
is positively associated with a vote for PAN. The other variables in the PAN
model do not shed further light on associations with PAN voters, but the
association with the upper educated classes and PAN overshadows
remaining variables such as age or assessment of economic situation,
variables that were not statistically significant.
Coefficients a
.211 .067 3.153 .002 3.593E-02 .019 .047 1.843 .066 -1.31E-04
04
.001 -.005 -.178 .858 4.928E-02 .009 .153 5.610 .000 1.462E-02 .005 .078 2.952 .003 -7.68E-02 .006 -.351 -13.771 .000
-1.02E-02 .009 -.031 -1.117 .264
-2.85E-02 .009 -.092 -3.311 .001
(Constant) Gender Age Maximum school level Income Party ID Assessment of economic situation Asssessment of Zedillo
Model 1
B Std. Error
Unstandardised coefficients
Beta
Standardised
coefficients
t Sig.
Dependent variable: PAN a.
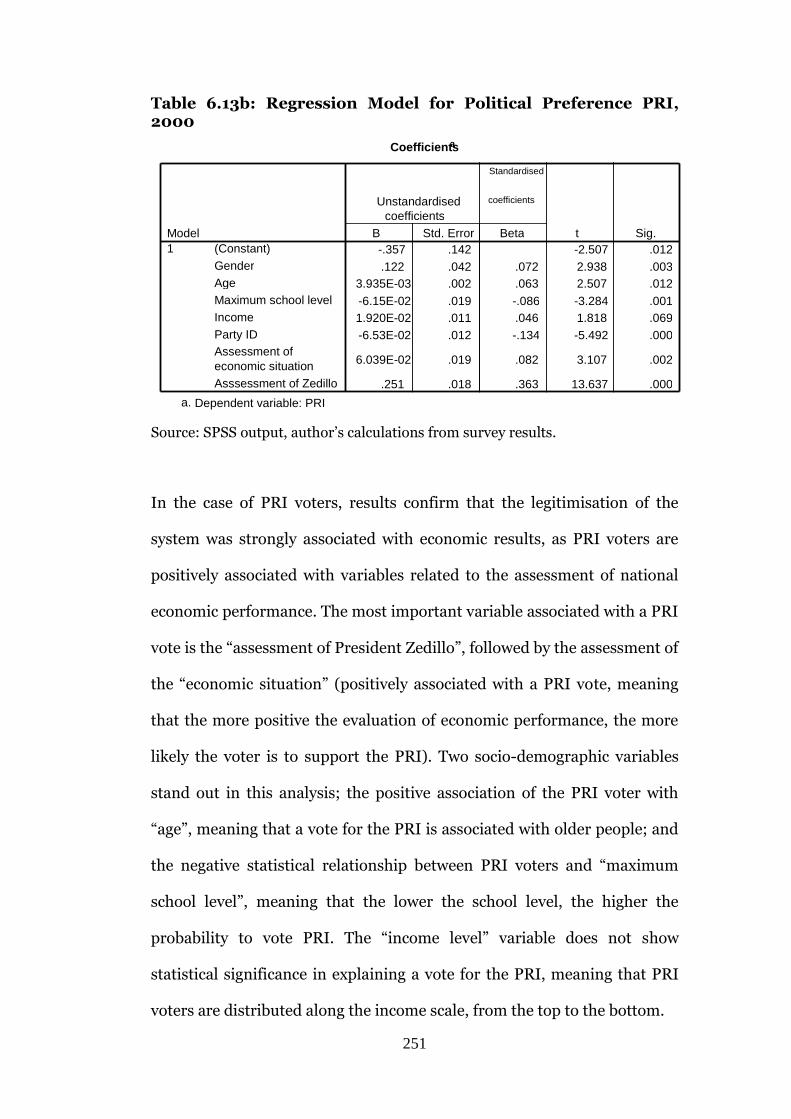
251
Table 6.13b: Regression Model for Political Preference PRI, 2000
Source: SPSS output, author’s calculations from survey results.
In the case of PRI voters, results confirm that the legitimisation of the
system was strongly associated with economic results, as PRI voters are
positively associated with variables related to the assessment of national
economic performance. The most important variable associated with a PRI
vote is the “assessment of President Zedillo”, followed by the assessment of
the “economic situation” (positively associated with a PRI vote, meaning
that the more positive the evaluation of economic performance, the more
likely the voter is to support the PRI). Two socio-demographic variables
stand out in this analysis; the positive association of the PRI voter with
“age”, meaning that a vote for the PRI is associated with older people; and
the negative statistical relationship between PRI voters and “maximum
school level”, meaning that the lower the school level, the higher the
probability to vote PRI. The “income level” variable does not show
statistical significance in explaining a vote for the PRI, meaning that PRI
voters are distributed along the income scale, from the top to the bottom.
Coefficients a
-.357 .142 -2.507 .012 .122 .042 .072 2.938 .003
3.935E-03 .002 .063 2.507 .012 -6.15E-02 .019 -.086 -3.284 .001 1.920E-02 .011 .046 1.818 .069 -6.53E-02 .012 -.134 -5.492 .000
6.039E-02 .019 .082 3.107 .002
.251 .018 .363 13.637 .000
(Constant) Gender Age Maximum school level Income Party ID Assessment of economic situation Asssessment of Zedillo
Model 1
B Std. Error
Unstandardised coefficients
Beta
Standardised
coefficients
t Sig.
Dependent variable: PRI a.
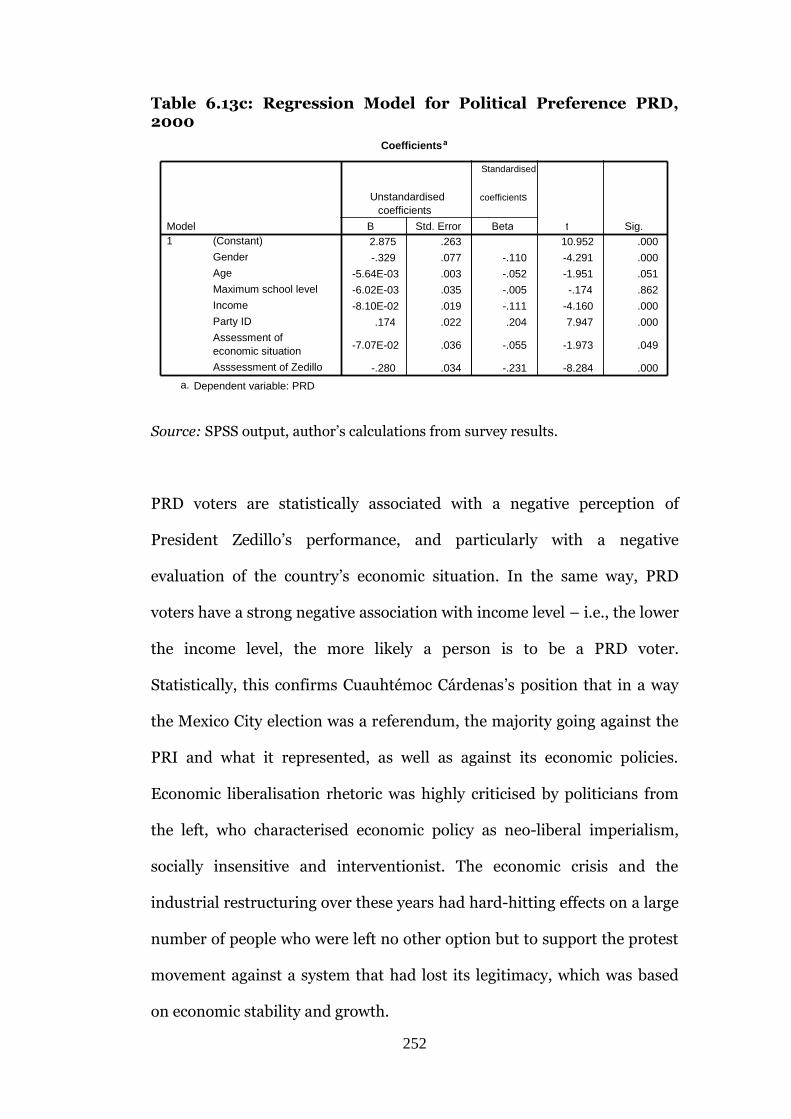
252
Table 6.13c: Regression Model for Political Preference PRD, 2000
Source: SPSS output, author’s calculations from survey results.
PRD voters are statistically associated with a negative perception of
President Zedillo’s performance, and particularly with a negative
evaluation of the country’s economic situation. In the same way, PRD
voters have a strong negative association with income level – i.e., the lower
the income level, the more likely a person is to be a PRD voter.
Statistically, this confirms Cuauhtémoc Cárdenas’s position that in a way
the Mexico City election was a referendum, the majority going against the
PRI and what it represented, as well as against its economic policies.
Economic liberalisation rhetoric was highly criticised by politicians from
the left, who characterised economic policy as neo-liberal imperialism,
socially insensitive and interventionist. The economic crisis and the
industrial restructuring over these years had hard-hitting effects on a large
number of people who were left no other option but to support the protest
movement against a system that had lost its legitimacy, which was based
on economic stability and growth.
Coefficients a
2.875 .263 10.952 .000 -.329 .077 -.110 -4.291 .000
-5.64E-03 .003 -.052 -1.951 .051 -6.02E-03 .035 -.005 -.174 .862 -8.10E-02 .019 -.111 -4.160 .000
.174 .022 .204 7.947 .000
-7.07E-02 .036 -.055 -1.973 .049
-.280 .034 -.231 -8.284 .000
(Constant) Gender Age Maximum school level Income Party ID Assessment of economic situation Asssessment of Zedillo
Model 1
B Std. Error
Unstandardised coefficients
Beta
Standardised
coefficients
t Sig.
Dependent variable: PRD a.
253
CONCLUSION
The decline of manufacturing in Mexico City DF compared to “the rest” of
the MAMC suggests the emergence of two different economies within a
functional economic area. But when broken down to the municipal level
and for specific sectors (automotive and consumer electronics), the trends
are less clear. Mexico City retains a significant manufacturing base, albeit
much less so than in 1980, and in 2000 still held the national lead in
absolute and relative terms of output and employment. Mexico City
continued to rank in 2000 as the top location for manufacturing and,
although this is not discussed here, remains a key location for specialised
sectors such as printing, auto parts, chemicals, and food and beverages,
some of which have a strong global orientation. When considering the
period 1980–2000 and the broad trend towards de-industrialisation or
decentralisation, we need to be cautious and consider the performance of
subsectors of manufacturing and the local specificities of space.
But Mexico City is no longer the economic engine of the national economy.
The collapse of the consumer electronics industry in the central part of the
country, a process supported by Mexico’s leading business players,
probably constitutes the best example of what has happened to a single
economic activity. Consumer electronics in Mexico City has suffered from
M&As, the implementation of post-Fordist production and a shift to trade
market orientation.
254
Nonetheless, Mexico City had developed a new influential role as a
consequence of its transformation into a global hub of finance and
producer services. In this new economic regime, the service sector in
general, and “producer services” in particular, are increasingly important
in putting together the parts to enable “global” production to take place.
Sassen’s ideas provided an important guide for my analysis, though trends
in Mexico City suggest that the global city hypothesis is sometimes
overrated, such as in the relevance given to TNCs in production circuits
over the simply economic logic of supply and demand under a new post-
Fordist production regime. Under this new regime, products and
production circuits under a free market system show complex
multidirectional intra-industry and inter-industry dynamics, sometimes
dependent upon a particular city (Mexico City perhaps) but at others times
dependent upon its own location networks.
However, according to my results, the so-called “command functions” are
not uniform across sectors, and this agency is rooted in the nature of each
economic activity and even in the particular production circuits. This
explains why Mexico City hosts economic agents performing “command
functions” in, for example, the automotive sector, but not for the consumer
electronics sector, where Tijuana, Mexicali and Guadalajara have more
influence. In this sense, Krugman and Livas’s “migration to the north”
hypothesis is too simple a representation of a more complex process
rooted in a shift of economic regime. Relocation patterns, fragmentation
and relocation of production seem to be rooted in a strong specialisation
255
pattern driven by a combination of global and local factors that explain de-
concentration of activity out of Mexico City.
The factors present in global city literature can shed some light on the
analysis: for example, identifying TNCs and financial services as the most
distinctive agents of economic change (for better or for worse). This is
where the polarisation argument becomes relevant. The data show that a
small group has received a large share of the “gains” and that there is a
very big group for whom neither economic liberalisation nor globalisation
has brought about an improvement in social conditions. Results suggest
that despite evidence of increasing accumulation of income at the top of
the income scale, there have also been gains in middle-income groups that
overall suggest that income inequality remained more or less constant over
the period 1980–2000. Mexico City thus challenges the polarisation
argument associated with the global city hypothesis.
256
Chapter Seven: Conclusions: The Effects of Centrality in a Global Economy
OVERVIEW
At the outset of this thesis, a set of research questions about the
relationship between Mexico City and economic liberalisation and
globalisation was posed. The thesis aimed to examine economic
decentralisation characterised by the decline of manufacturing in Mexico
City, and to consider how far this process could be attributed to trade
liberalisation and/or globalisation. Two hypotheses were formed. First,
Mexico’s economic and spatial restructuring were a consequence of
economic change driven by trade liberalisation. Specifically, this
hypothesis followed the ideas of Paul Krugman, who argued that opening
the economy and reducing transport costs would trigger circular
cumulative causation and re-agglomeration in northern Mexico, and
economic decentralisation. The second and alternative hypothesis argued
that Mexico’s economic and spatial restructuring were not the direct
consequence of liberalisation of trade but a consequence of a broader
economic change associated with the globalisation of the Mexican
economy. This alternative hypothesis considers the nature of the new
geography of production and trade brought about by the global economy,
as a process different in nature and complexity to trade liberalisation as
argued by Krugman.
257
In order to explore both hypotheses the research adopted a deductive
approach combining quantitative and qualitative methods. The
quantitative methods varied from simple descriptive statistics to more
complex parametric tests and multivariate models. An original
contribution of the thesis was the implementation of principal component
analysis, a data reduction technique designed to represent a wide range of
characteristics in a smaller number of dimensions. PCA proved useful to
determine how information from various indicators (variables) can be
combined to measure a firm’s relative “global” status (globality). The result
of PCA was the creation of a single Globality Index which assigns a specific
value or score to firms representing the company’s global status in relation
to all the other companies in the sample, allowing for comparisons
between companies and comparisons for the same companies over
different periods of time. The aim of the PCA was to produce empirical
evidence using a strong statistical tool to create parameters, allowing
analysis of individual cases (companies) based on economic orientation
(national vs global) and location.
A different methodological approach was adopted in Chapters Four and
Five, which presented case studies of two important sectors of the Mexican
economy: the automotive and consumer electronics sectors. These two
sectors were selected according to results outlined in Chapter Three, in
which aggregated trends revealed automotive and consumer electronics to
be the most dynamic and the most globally oriented sectors in output and
export terms since the trade liberalisation regime started in the late 1980s
with the accession of Mexico to the GATT. The Globality Index provided
258
scores for companies in both sectors ranked at the top end of the global
list. Both sectors had grounds for being considered candidates for further
research as both were concentrated in the manufacturing belt of Mexico
City before the period of liberalisation and changed their patterns of
localisation and agglomeration thereafter. The automotive sector, although
not exclusively, re-concentrated in the cities of central Mexico and
consumer electronics in cities along the Mexico–US border over the course
of the period studied in the research.
RESEARCH FINDINGS
In order to summarise my principal research findings I have organised this
chapter around three points. First, I explore this thesis’s contribution to
the debate surrounding Krugman’s ideas, which have informed the so-
called new economic geography, and the importance of trade liberalisation
as a single force capable of modifying location patterns and bringing a new
regional industrial balance. Second, I explore the alternative hypothesis –
namely, globalisation as an alternative explanation for manufacturing
decentralisation in Mexico. Third, I consider Mexico City as an example of
local economic transformation over a transitional period from a closed to
open economy, by trade or globalisation, and relate these processes to
original findings on patterns of social inequality and polarisation.
To consider the first of these three points, from the data and analysis
undertaken for this thesis, Krugman’s arguments must be regarded as
speculative at best. Trends in the decentralisation of manufacturing
industry in Mexico did not coincide with the main predictions outlined by
259
Krugman in his work on free trade and agglomerations (1991a, 1993a,
1993b, 1995, 1997, 1998a, 1998b). With Livas, and supported
independently by Hanson (1996b), Krugman referred to changes along the
US–Mexican border as paradigmatic of the impact of opening economies
to trade. Foremost, these scholars argued that economic opening would
lead to geographical restructuring, ending with the de-industrialisation of
the regional centre. This, they claimed, would be replaced by the
industrialisation of the border with the US because of the high transport
costs on the Mexican side that might surpass the gains made using
Mexico’s cheap labour and access to markets. According to Krugman and
Livas:
The rough outline of Mexican economic history supports this view. Recent work by Hanson (1992) and Livas Elizondo (1992) shows that before the beginnings of import substitution Mexico City was far less dominant in Mexico’s economy and manufacturing sector than it was later to become, and that since liberalization began in the 1980s there has been a dramatic shift of manufacturing away from Mexico City, especially to the northern states. (Krugman and Livas 1996, p. 140)
Yet the case studies presented in my research question the claims that
border plants became integrated within US southern state economies, at
least for the period under study.
Rather than being subject to the external economic incentives brought
about by access to new markets and reductions in costs as a consequence
of the removal of trade barriers, I found evidence that company relocation
to the border region predates trade liberalisation, and in many cases dates
back to the 1960s. By looking at the timing of the border industrialisation,
we can see that most of the Tijuana plants producing electronics
260
components and parts – that were shipped directly to final goods
assemblers in the US – started under the “quasi-liberalisation” kick-
started by the maquiladora regulation in the 1960s and not in the 1980s as
Krugman’s approach suggests. For Mexico at least, Krugman
underestimated the importance of the fact that within the closed economy
model the Mexican government had set up institutional procedures such
as the Border Industrialisation Programme and the Maquiladora
Programme to allow some companies to adapt location models within a
restricted foreign trade regulation. We might speculate that at the time
labour costs would have been an important economic incentive for TNCs
(mainly US corporations) to engage in production in Mexico, when labour-
intensive production made labour costs an important share of total
production costs. According to findings presented in Chapter Five, US
electronic companies were using Mexico to manufacture products more
economically and escape the high-labour market in the US.152 The business
model at the time was complex and required various factors to be present
and aligned in order to make businesses viable on the border, taking
advantage of government procurements and regulation. Among the most
obvious of these factors were trade and investment regulation,
international business contacts, access to finance and labour force.
Producers sought locations with access to large markets and to suppliers of
goods and services that they or their workers required. These suppliers
152 This seems in line with Weber’s observation that “low-cost labour competitive with that in Asia and Europe was the key reason for US manufacturers to ‘flood’ Mexico with financial, technical and production personnel to boost their production below the border” (1969, p. 1).
261
were shifting operation slowly out of Mexico City, but the data do not
suggest a dramatic and immediate shift of companies towards the north as
a consequence of liberalisation of trade, neither in the late 1980s nor over
the 1990s. Rather, companies seemed to deepen but not greatly extend the
practice agreed between the federal government and certain companies
from the 1960s, certainly as a result of a “conditional” and sometimes
“exceptional” free trade regime.
An analysis of particular companies using the top 500 companies from the
Expansión database was presented in Chapter Three. This tells the story of
what happened over the transitional period from a company perspective.
The data show that although it is difficult for a company to shift its market
orientation, to engage in export production and ultimately to relocate, a
large number of companies in Mexico survived this transitional period and
underwent change under a different economic regime, some of them
relocating, but the majority remaining in situ. As many as 133 out of a total
of 219 companies exporting to the NAFTA region in 2000 in the Top 500
Companies list started operations before 1985, while 82 were not located
in border states and as many as 30 had subsidiary manufacturing plants in
border states. The data suggest that only 83 companies arrived in Mexico
after the liberalisation reforms, and of these only 29 located in the border
states.
An important finding is that the regionalisation process suggested by
Krugman and Livas (1996) and Hanson (1996a) has not influenced the rise
of economic agglomeration over the US border, or in the northern states of
262
Mexico, but involved a rather more comprehensive integration between
NAFTA economies regardless of sector of the economy or industrial
location patterns. Evidence presented in Chapter Three suggests that
preferential access to Mexican products to the US and Canada under
NAFTA has been a strong economic incentive for non-NAFTA companies
to locate in Mexico and take advantage of export opportunities with the
intention of producing for the US and Canadian markets. This finding is in
line with the argument of Krugman and Livas. However, the research
found that 72 companies which started operations after 1986 were
exporting to the US from locations far from the border.
According to interviews with senior company officials, a concentration of
producers, a good supply of inputs and consumer goods, and the presence
of producer services are among the factors that determine location
decisions. Mexico City has continued to offer these conditions over the
post-liberalisation period, as evidenced by 37 manufacturing companies
arriving in Mexico City. Contrary to Krugman, therefore, access to markets
is only one of the factors determining company location, but it seems not
to be the most powerful determinant of per se location decisions and
economic agglomeration formation.
The relative importance of automotive plants in Morelos and Puebla, about
1,000 km away from the border, and the manufacturing strength of the
State of Mexico discussed in Chapter Four weaken Krugman’s argument.
So, as explored in Chapter Five, does the timing of consumer electronic
cluster set-ups in the border region. It is worth noting that the case of
263
consumer electronics may be misleading as broad trends of decline (in
Mexico City) and rise (in the border) could suggest the confirmation of
Krugman’s ideas. However, a closer analysis reveals that the process of
consumer electronics location is better explained by an interaction of
global factors such as M&As, innovation, transition from labour- to
capital-intensive production, outsourcing and fragmentations, and more
general global factors, than as a simple result of trade liberalisation
policies.
The second point raised here concerns globalisation of the Mexican
economy as an alternative hypothesis of the economic decentralisation.
The case studies indicate that although labour costs per se were a very
important factor in overall production costs over the 1960s and 1970s,
trends towards more capital-intensive production seem unlikely to be a
“single” crucial determinant in company location decisions. For instance,
in Mexico, a tenfold rise in consumer electronics sector output between
1985 and 1998 did not increase employment by an equivalent amount.
Over time, the industrial organisation brought by TNCs created more
complex intra-industry and inter-industry relations and involved a
combination of labour and capital factors. The automotive and consumer
electronics sectors underwent profound economic restructuring with the
intention of engaging in production networks not only to the US and
Canada but also to global and more open markets, leading in some cases to
geographical reorganisation and the rise of national and international
production networks. According to the research findings, however, this
geographical reorganisation is the result of a concatenation of global
264
factors including: new industrial practices such as fragmentation of
production and outsourcing practices; a shift to less labour-intensive/more
capital-intensive production; M&As; and a shift towards export-oriented
production under a free trade regime. All of these factors are associated
with the process of globalisation as described in the literature discussed in
Chapter Three.
From the specific examples of the automotive and consumer electronics
sectors, I conclude that trade liberalisation alone cannot fully explain the
manufacturing decline away from Mexico City, as Krugman and Hanson
argue. Despite the fact, as was noted in Chapter Three, that during the
1970s and 1980s the Mexican federal government launched several de-
centralisation programmes aimed at halting the growth of the
metropolitan area and promoting regional development, most of these
efforts had little or no effect on the decentralisation of industry153. The
transformation within the consumer electronics industry in Mexico as a
result of global processes could not be more dramatic, from a nationally
oriented model to one of the most dynamic production centres in the
world. The consumer electronics industry went from being concentrated in
Mexico City and dominated by US-owned TNCs working with an
integrated production system producing to supply the national consumer
153 In their study of the period 1959–74, Ramos Boyoli and Richter (1976) found that, in effect, public investment had been geared towards more developed states. These findings were corroborated by those of Palacios (1986), who analysed the six-year terms of Echeverría and López Portillo, and Rodríguez (1997), who covered the period 1959–80. The latter research confirmed that the different categories of public investment continued to favour the richer states, as a response to considerations of sectoral efficiency more than to those of regional development. A study by Looney and Frederiksen (1981) concluded that this pattern of public spending was not only to the detriment of regional development but also affected economic efficiency, contradicting the classic dilemma between aggregate economic growth and the reduction of regional inequalities.
265
market, to being concentrated in the border states and controlled by
Japanese and Korean TNCs. According to the findings presented in
Chapter Five, some of the companies’ production plants located in Mexico
City that survived the transformation ended up producing under OEM
agreements. Only a handful of companies remained unchanged (as was the
case for Philips and Toshiba), and a huge number simply closed down,
Mexican and TNCs alike. The new consumer electronics industry was
border-located, fully “globally” export-oriented (in effect only to US and
Canadian markets, as found in Chapter Three), capital-intensive and
dominated by Asian companies, with a high level of innovation and a
fragmented production pattern.
Nonetheless, the single effect of trade liberalisation, as an essential
component of the global economic regime, on spatial reorganisation needs
to be considered. Trade liberalisation introduced fierce competition, but
also opportunities. Most Mexican manufacturers had been producing at a
scale that was inefficient in many cases because of lack of supply, but
others simply as a by-product of the trade barriers. Therefore, companies
that closed down were those that could not upgrade and compete, and
these seem to be the less globalised companies and those in the more
traditional sectors of the economy. Over the 1980s the manufacturing
sector faced its worst decline, where newly introduced competition
coincided with a deep national economic crisis. Interviews with managers
in the manufacturing sector indicated that the option to decentralise as a
method of cost reduction was ruled out as many companies found that
266
being located far away from suppliers and markets was not sustainable in
the long run and decided to remain in Mexico City.
As discussed in Chapter Three, the key point related to industrial location
centres on the global factors present in the Top 500 Companies operating
in Mexico in 2ooo, and their influence on location decisions: M&As, labour
productivity, foreign investment and export activity appear as the most
significant. It was also unexpected to discover that “global characteristics”
were present in a large number of Mexican companies with no significant
differences to top-of-the-list TNCs. In relation to global factors as a cause
of decentralisation the conclusion is that at the time of trade liberalisation,
sectors dominated by TNCs and therefore subject to a process of M&As at a
global level with local consequences for plants in Mexico City, where most
of the industries were located, suffered the consequences of takeovers and
consolidation of production. At the same time a transition from labour- to
capital-intensive production took place which under the new economic
regime favoured companies that could embark on a long-term project of
physical infrastructure development. According to the case studies, as the
result of this transition associated with relocation, the first choices were
those locations with a pre-existing presence of sector companies, or in
other words industrial clusters at an embryonic stage.
However, localisation trends differentiate the two case studies, one in
border states (consumer electronics) and the other in central Mexico. This
distinction might be explained by the degree of production integration into
the national economy and the level of value added involved for each sector,
267
which is related to labour and capital productivity. This observation is in
tune with claims made by Krugman’s trade liberalisation hypothesis,
because a low value added for an industry is associated with higher foreign
trade activity and therefore the higher a company’s exports and imports
are, the more likely is its proximity to the US border. But also, according to
Dicken (1992) this might explain why an industry more integrated into the
Mexican economy and therefore with higher levels of value added, such as
the automotive industry, has developed global production circuits
interconnecting industrial clusters within Mexico and abroad.
Nevertheless, the decision of where to locate remains open to some
question. As the data reveal and the analysis in Chapter Four suggests, for
the automotive sector, investment took place in new locations away from
Mexico City but not at the border, allowing some retention of jobs in
Mexico City in comparison with consumer electronics at least.
The third point to consider is the transformation of Mexico City.
Extrapolating from the main theoretical distinction between free trade and
global production, I conclude that according to the research, the Mexican
economy more closely follows the trends suggested by globalisation
scholars – that globalisation has produced the duality of a dispersed yet
globally integrated organisation of economic activity, where centres are
crucial places as connecting nodes within global production circuits. The
pattern of industrial change in Mexico approximates the argument
forwarded by Sassen (1991) on the role of centrality; the global economy
may have become more decentralised, but it is not decentred.
268
Supporting this idea of a spatial dispersal of production processes and new
strategic role for cities are the findings presented in Chapter Three. The
number of TNCs headquarter located in Mexico City, the number of
companies among the Top 500 sample participating in the Mexican Stock
Market, and the share of foreign capital and export activity of companies
located there suggest the high interaction of these global factors that
makes Mexico City an important global trade and production node. In
Sassen’s words, the focus on trade taking place in cities is such that:
Apart from issues related to capital, labour markets, goods and services are becoming increasingly globally traded in this regard cities around the world are rising as ‘regional centres’ connecting the network of interactions on which the global trade is based ground outwards (Sassen 1991, p. 3).
However, by the end of the 1990s high concentration was seen in some
cities in Mexico – such as Aguascalientes, Puebla and Torreón for the
automotive sector, and Tijuana for the consumer electronics sector – that
may lend credence to this economic process led by economic
specialisation. I found evidence through the Globality Index that
companies at the top end of the global ranking were strongly associated
with Mexico City as the preferred location, suggesting that the rise is
global.
Findings presented in Chapter Three regarding company data analysis of
labour and capital productivity suggest that perhaps the most influential
factor triggering decentralisation was the shift to a new model of industrial
organisation as a whole, according to new global standards, including such
269
practices as outsourcing and capital-intensive production embedded in
global production networks. The new industrial organisation was more
flexible, requiring fewer employees, with those advantages introduced by
the digital telecommunications, as data of specific companies presented in
Chapter Three suggests. Innovation, flexible production and capital-
intensive production, plus pre-existent specialised industrial clusters in
certain cities such as Tijuana for the consumer electronics sectors, fuelled
by takeovers (mostly foreign companies injecting fresh financing in the
middle of an economic crisis), paved the way for a relocation movement in
the most globally oriented sectors of the economy. But many other
companies remained in Mexico City, in most cases companies in nationally
oriented sectors of the economy, with no economic incentives to relocate
as Mexico City never stopped being the most important location for
businesses in Mexico.
The effect of trade and economic integration on national and regional
economic growth is still a matter for considerable debate (Morris 2001;
Rodrik 1999; Sen 1999; Goldsmith and Mander 2001; Stiglitz 2002). The
theories and empirical analyses put forward on the territorial impact of
trade and economic liberalisation range from claims that trade leads to
greater concentration of economic activity and greater polarisation
(Krugman 1993a; Venables 1998; Venables and Limao 1999) to those who
insist that economic liberalisation and increases in trade are likely to
reduce regional disparities (Wood 1994). Strong counter-arguments are
made by those who assert that economic globalisation is organised under
conditions that favour only rich nations (Hirst and Thompson 1996; Gray
270
1998; Goldsmith and Mander 2001; Sen 1999), leaving poor countries
unable to compete against often subsidised goods and products, with
negative social and environmental consequences (Morris 2001; Retallack
2001; Sobhani 2001). The range of the debate indicates that the social
outcomes of economic change are ambiguous. Even with the adoption of
simplified notions of “winners” and “losers” or more globalised vs less
globalised sectors, it remains difficult to discern the consequences of
economic restructuring.
Hence, and finally, Chapter Six looked at Mexico City. It found that the
polarisation of income and therefore social polarisation patterns are not a
by-product of the city’s globalisation. On the contrary, the Gini coefficient
suggests a decline in the polarisation of income, although it is important to
underline that Mexico City’s polarisation remains at an unacceptable level
for any standard of equality and social justice. However, another social
phenomenon is associated with the restructuring process. Political
polarisation, where ideological positions are defined by attitudes towards
the “free market”, shows strong divisions between the sectors of the
population who might be deemed “winners” of globalisation and those
sectors left behind during the restructuring process and unable to get
privileged access to new rules of social access. Nevertheless, it would be
wrong to be complacent, and even if I have argued that at the beginning of
the new millennium Mexico City remained at the core of the national
economy, it no longer performs the role of “engine” so much as that of
coordinator (sufficient to deserve a place in the global network of cities).
This process is unfinished, as evidenced by contemporary moves to reform

271
pensions, the tax system and the energy and oil sectors, and to devolve the
responsibility for poverty – with 40% of the population, according to the
World Bank (2005), beneath the poverty line – to states and cities.
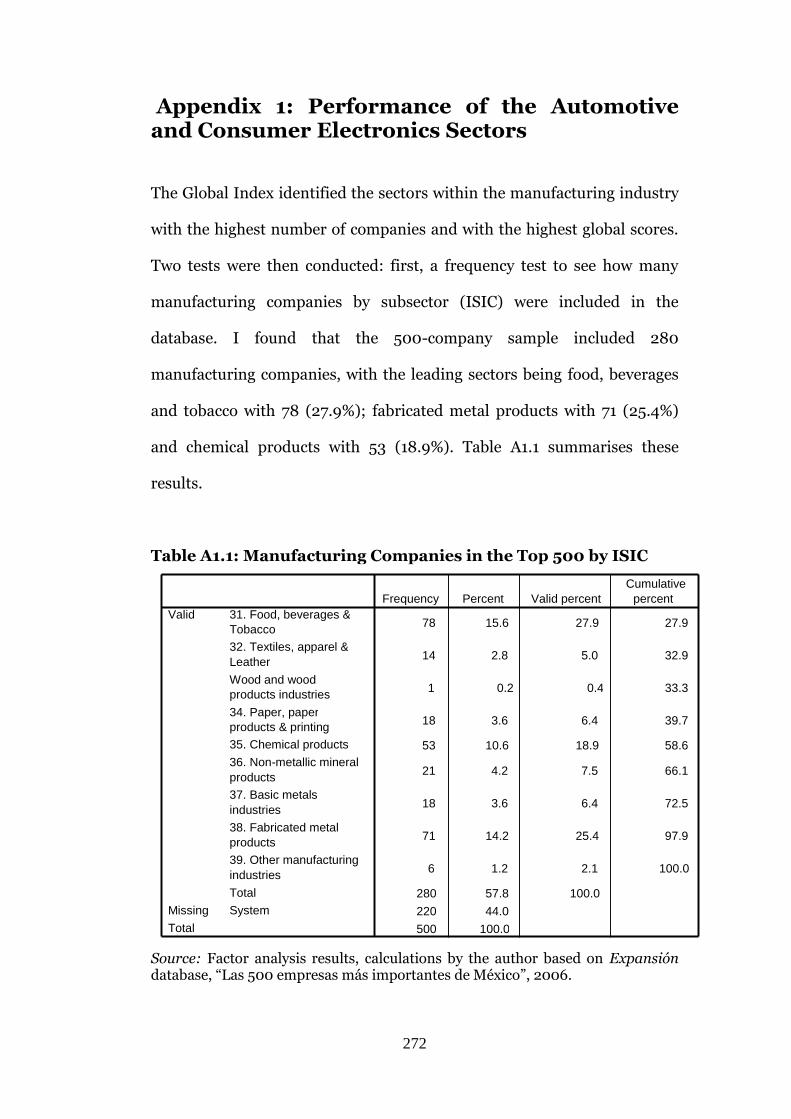
272
Appendix 1: Performance of the Automotive and Consumer Electronics Sectors
The Global Index identified the sectors within the manufacturing industry
with the highest number of companies and with the highest global scores.
Two tests were then conducted: first, a frequency test to see how many
manufacturing companies by subsector (ISIC) were included in the
database. I found that the 500-company sample included 280
manufacturing companies, with the leading sectors being food, beverages
and tobacco with 78 (27.9%); fabricated metal products with 71 (25.4%)
and chemical products with 53 (18.9%). Table A1.1 summarises these
results.
Table A1.1: Manufacturing Companies in the Top 500 by ISIC
Source: Factor analysis results, calculations by the author based on Expansión database, “Las 500 empresas más importantes de México”, 2006.
78 15.6 27.9 27.9
14 2.8 5.0 32.9
1 0.2 0.4 33.3
18 3.6 6.4 39.7
53 10.6 18.9 58.6
21 4.2 7.5 66.1
18 3.6 6.4 72.5
71 14.2 25.4 97.9
6 1.2 2.1 100.0
280 57.8 100.0 220 44.0 500 100.0
31. Food, beverages & Tobacco 32. Textiles, apparel & Leather Wood and wood products industries 34. Paper, paper products & printing 35. Chemical products 36. Non-metallic mineral products 37. Basic metals industries 38. Fabricated metal products 39. Other manufacturing industries Total
Valid
System Missing Total
Frequency Percent Valid percent Cumulative
percent
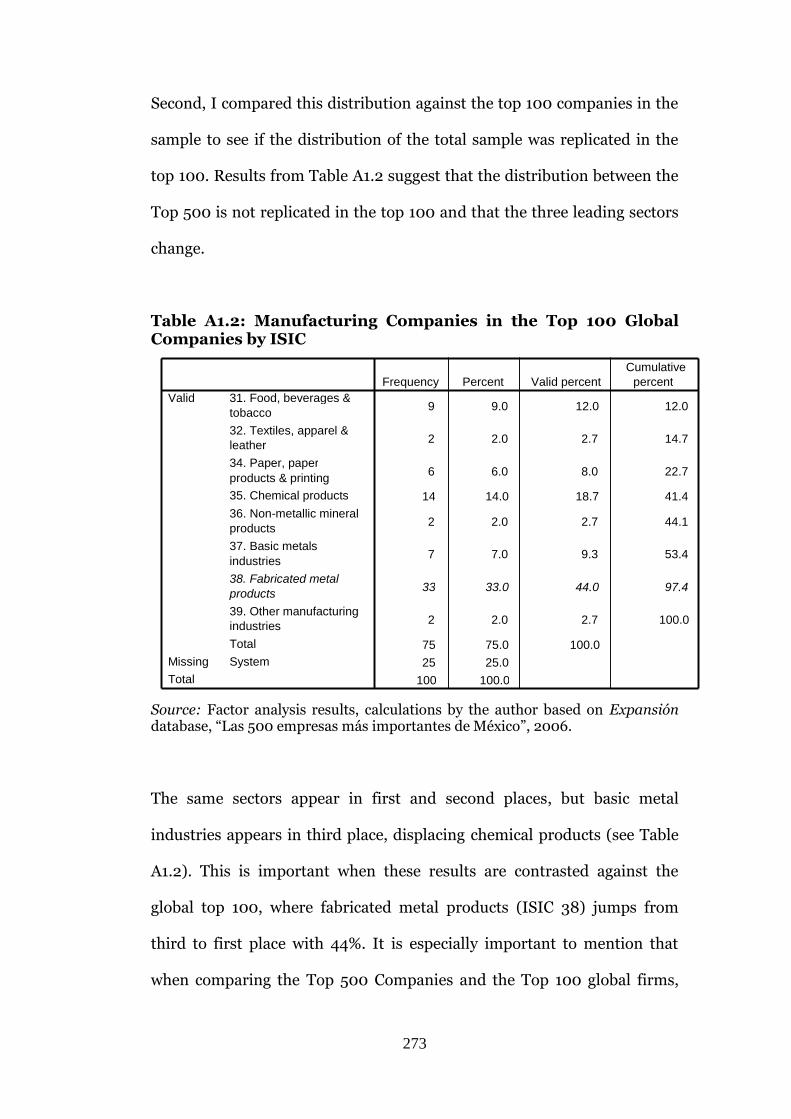
273
Second, I compared this distribution against the top 100 companies in the
sample to see if the distribution of the total sample was replicated in the
top 100. Results from Table A1.2 suggest that the distribution between the
Top 500 is not replicated in the top 100 and that the three leading sectors
change.
Table A1.2: Manufacturing Companies in the Top 100 Global Companies by ISIC
Source: Factor analysis results, calculations by the author based on Expansión database, “Las 500 empresas más importantes de México”, 2006.
The same sectors appear in first and second places, but basic metal
industries appears in third place, displacing chemical products (see Table
A1.2). This is important when these results are contrasted against the
global top 100, where fabricated metal products (ISIC 38) jumps from
third to first place with 44%. It is especially important to mention that
when comparing the Top 500 Companies and the Top 100 global firms,
9 9.0 12.0 12.0
2 2.0 2.7 14.7
6 6.0 8.0 22.7
14 14.0 18.7 41.4
2 2.0 2.7 44.1
7 7.0 9.3 53.4
33 33.0 44.0 97.4
2 2.0 2.7 100.0
75 75.0 100.0 25 25.0
100 100.0
31. Food, beverages & tobacco 32. Textiles, apparel & leather 34. Paper, paper products & printing 35. Chemical products 36. Non-metallic mineral products 37. Basic metals industries 38. Fabricated metal products 39. Other manufacturing industries Total
Valid
System Missing Total
Frequency Percent Valid percent Cumulative
percent
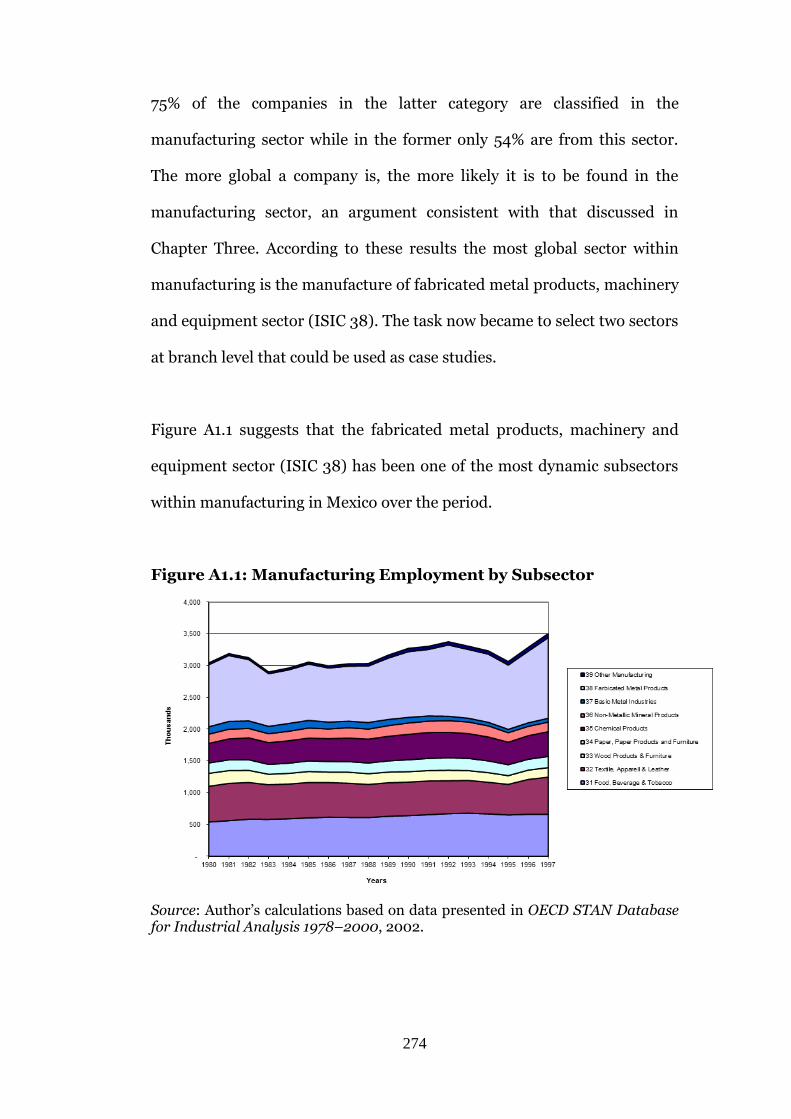
274
75% of the companies in the latter category are classified in the
manufacturing sector while in the former only 54% are from this sector.
The more global a company is, the more likely it is to be found in the
manufacturing sector, an argument consistent with that discussed in
Chapter Three. According to these results the most global sector within
manufacturing is the manufacture of fabricated metal products, machinery
and equipment sector (ISIC 38). The task now became to select two sectors
at branch level that could be used as case studies.
Figure A1.1 suggests that the fabricated metal products, machinery and
equipment sector (ISIC 38) has been one of the most dynamic subsectors
within manufacturing in Mexico over the period.
Figure A1.1: Manufacturing Employment by Subsector
Source: Author’s calculations based on data presented in OECD STAN Database for Industrial Analysis 1978–2000, 2002.
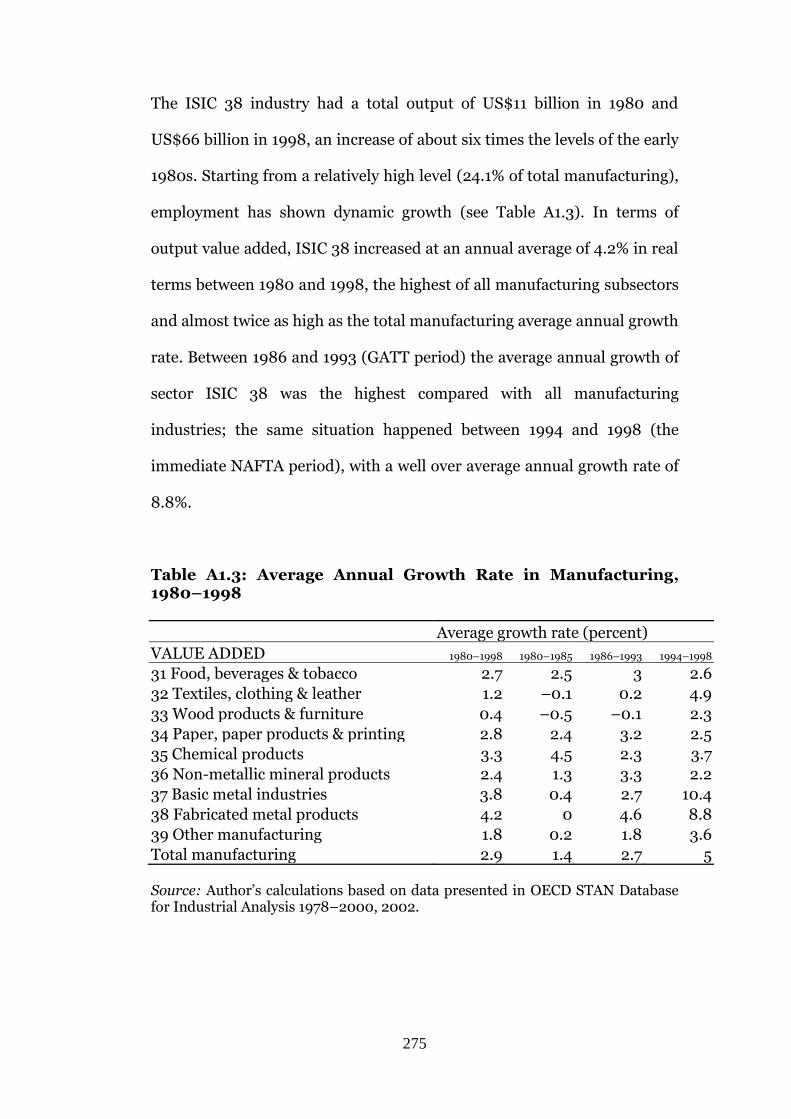
275
The ISIC 38 industry had a total output of US$11 billion in 1980 and
US$66 billion in 1998, an increase of about six times the levels of the early
1980s. Starting from a relatively high level (24.1% of total manufacturing),
employment has shown dynamic growth (see Table A1.3). In terms of
output value added, ISIC 38 increased at an annual average of 4.2% in real
terms between 1980 and 1998, the highest of all manufacturing subsectors
and almost twice as high as the total manufacturing average annual growth
rate. Between 1986 and 1993 (GATT period) the average annual growth of
sector ISIC 38 was the highest compared with all manufacturing
industries; the same situation happened between 1994 and 1998 (the
immediate NAFTA period), with a well over average annual growth rate of
8.8%.
Table A1.3: Average Annual Growth Rate in Manufacturing, 1980–1998
Average growth rate (percent)
VALUE ADDED 1980–1998 1980–1985 1986–1993 1994–1998
31 Food, beverages & tobacco 2.7 2.5 3 2.6
32 Textiles, clothing & leather 1.2 –0.1 0.2 4.9
33 Wood products & furniture 0.4 –0.5 –0.1 2.3
34 Paper, paper products & printing 2.8 2.4 3.2 2.5
35 Chemical products 3.3 4.5 2.3 3.7
36 Non-metallic mineral products 2.4 1.3 3.3 2.2
37 Basic metal industries 3.8 0.4 2.7 10.4
38 Fabricated metal products 4.2 0 4.6 8.8
39 Other manufacturing 1.8 0.2 1.8 3.6
Total manufacturing 2.9 1.4 2.7 5
Source: Author’s calculations based on data presented in OECD STAN Database for Industrial Analysis 1978–2000, 2002.
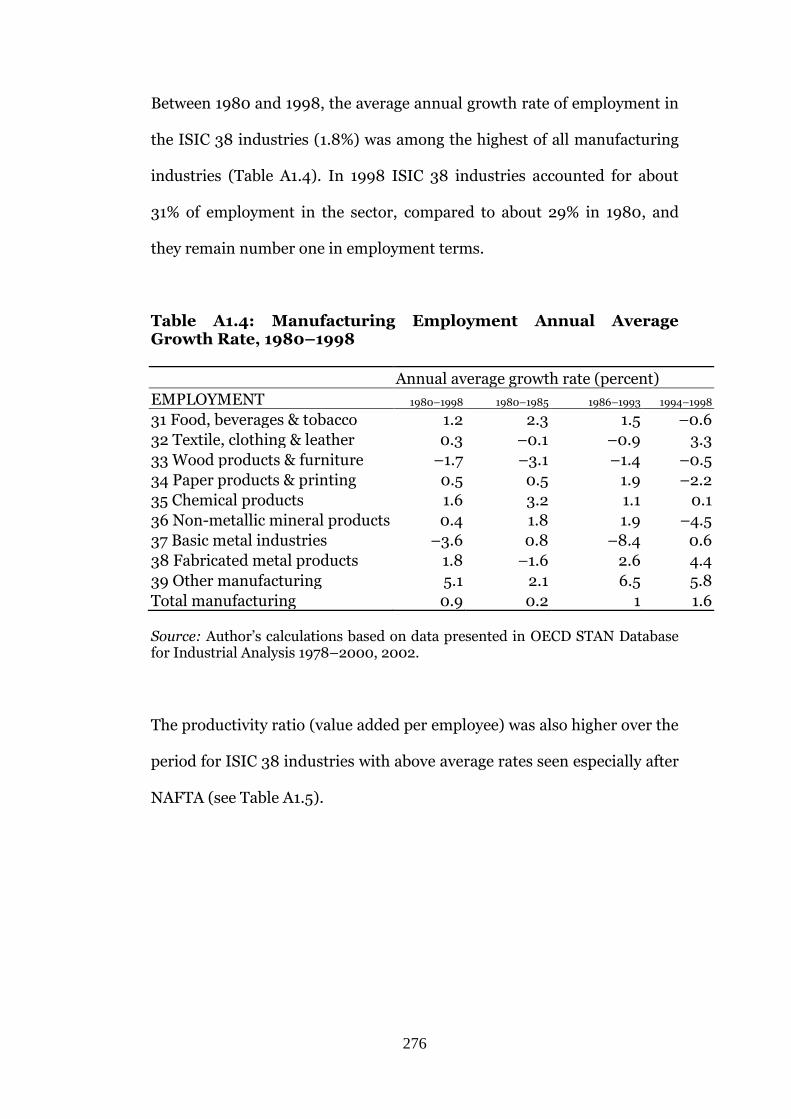
276
Between 1980 and 1998, the average annual growth rate of employment in
the ISIC 38 industries (1.8%) was among the highest of all manufacturing
industries (Table A1.4). In 1998 ISIC 38 industries accounted for about
31% of employment in the sector, compared to about 29% in 1980, and
they remain number one in employment terms.
Table A1.4: Manufacturing Employment Annual Average Growth Rate, 1980–1998
Annual average growth rate (percent)
EMPLOYMENT 1980–1998 1980–1985 1986–1993 1994–1998 31 Food, beverages & tobacco 1.2 2.3 1.5 –0.6
32 Textile, clothing & leather 0.3 –0.1 –0.9 3.3
33 Wood products & furniture –1.7 –3.1 –1.4 –0.5
34 Paper products & printing 0.5 0.5 1.9 –2.2
35 Chemical products 1.6 3.2 1.1 0.1
36 Non-metallic mineral products 0.4 1.8 1.9 –4.5
37 Basic metal industries –3.6 0.8 –8.4 0.6
38 Fabricated metal products 1.8 –1.6 2.6 4.4
39 Other manufacturing 5.1 2.1 6.5 5.8
Total manufacturing 0.9 0.2 1 1.6 Source: Author’s calculations based on data presented in OECD STAN Database for Industrial Analysis 1978–2000, 2002.
The productivity ratio (value added per employee) was also higher over the
period for ISIC 38 industries with above average rates seen especially after
NAFTA (see Table A1.5).
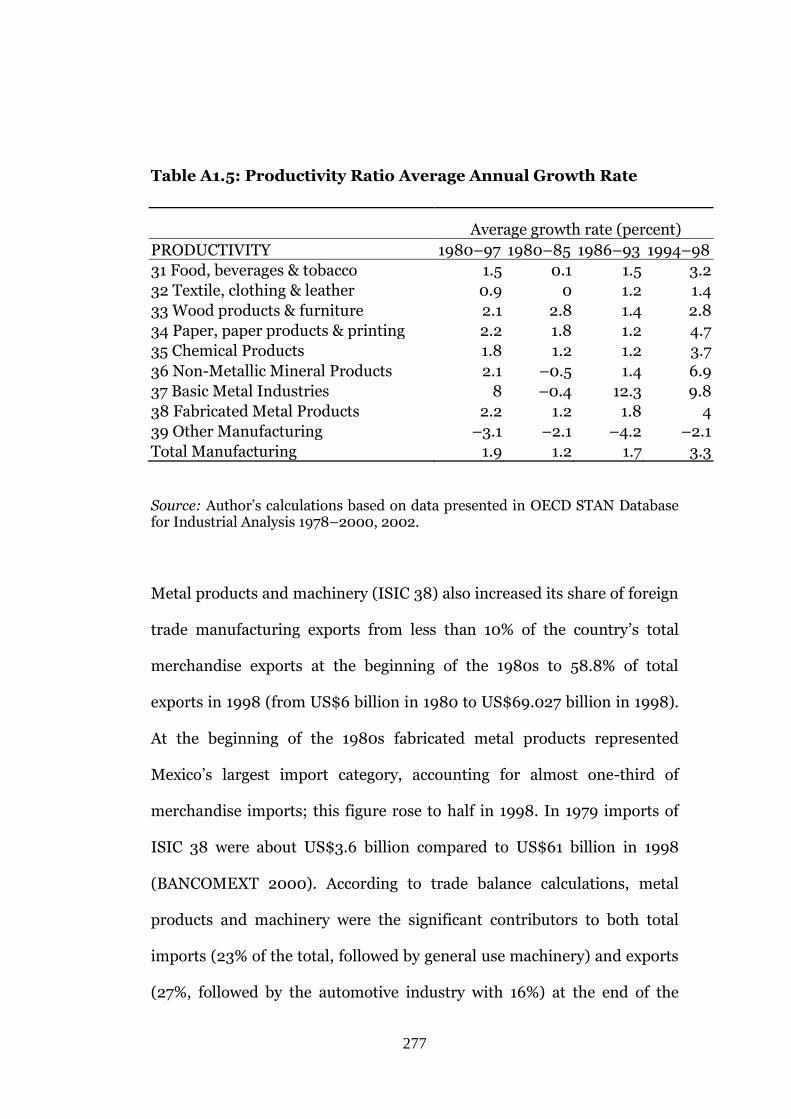
277
Table A1.5: Productivity Ratio Average Annual Growth Rate
Average growth rate (percent)
PRODUCTIVITY 1980–97 1980–85 1986–93 1994–98
31 Food, beverages & tobacco 1.5 0.1 1.5 3.2
32 Textile, clothing & leather 0.9 0 1.2 1.4
33 Wood products & furniture 2.1 2.8 1.4 2.8
34 Paper, paper products & printing 2.2 1.8 1.2 4.7
35 Chemical Products 1.8 1.2 1.2 3.7
36 Non-Metallic Mineral Products 2.1 –0.5 1.4 6.9
37 Basic Metal Industries 8 –0.4 12.3 9.8
38 Fabricated Metal Products 2.2 1.2 1.8 4
39 Other Manufacturing –3.1 –2.1 –4.2 –2.1
Total Manufacturing 1.9 1.2 1.7 3.3
Source: Author’s calculations based on data presented in OECD STAN Database for Industrial Analysis 1978–2000, 2002.
Metal products and machinery (ISIC 38) also increased its share of foreign
trade manufacturing exports from less than 10% of the country’s total
merchandise exports at the beginning of the 1980s to 58.8% of total
exports in 1998 (from US$6 billion in 1980 to US$69.027 billion in 1998).
At the beginning of the 1980s fabricated metal products represented
Mexico’s largest import category, accounting for almost one-third of
merchandise imports; this figure rose to half in 1998. In 1979 imports of
ISIC 38 were about US$3.6 billion compared to US$61 billion in 1998
(BANCOMEXT 2000). According to trade balance calculations, metal
products and machinery were the significant contributors to both total
imports (23% of the total, followed by general use machinery) and exports
(27%, followed by the automotive industry with 16%) at the end of the
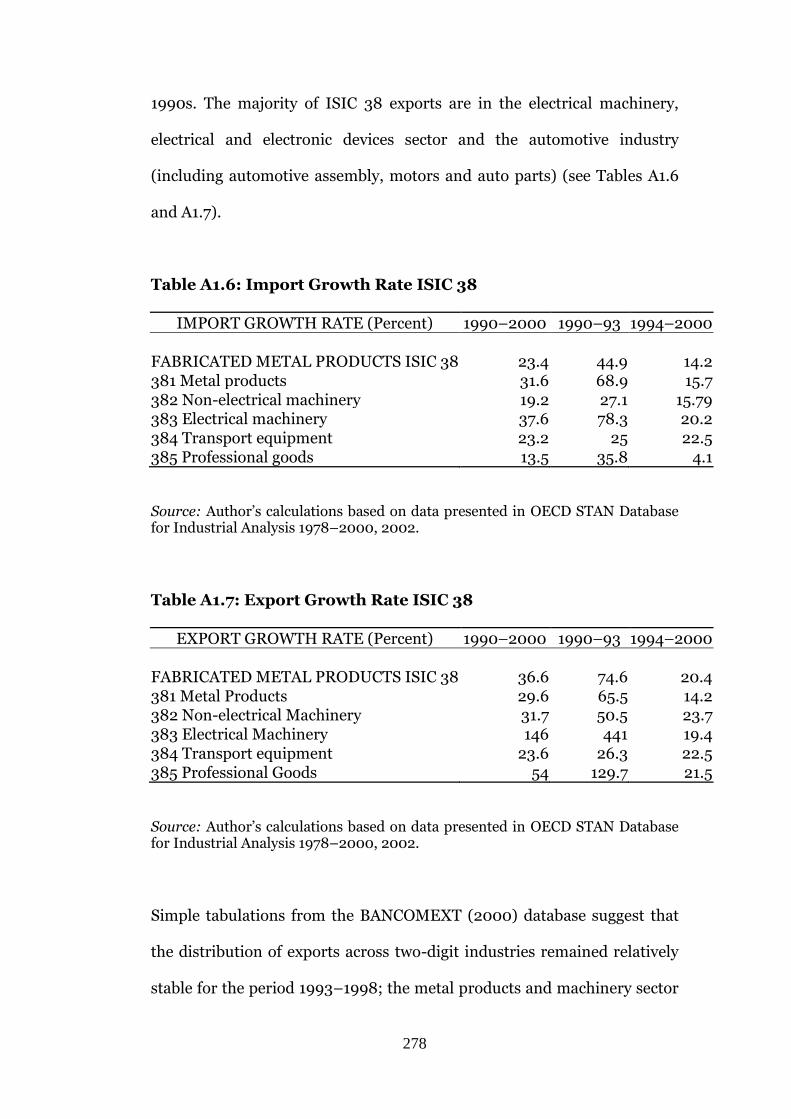
278
1990s. The majority of ISIC 38 exports are in the electrical machinery,
electrical and electronic devices sector and the automotive industry
(including automotive assembly, motors and auto parts) (see Tables A1.6
and A1.7).
Table A1.6: Import Growth Rate ISIC 38
IMPORT GROWTH RATE (Percent) 1990–2000 1990–93 1994–2000 FABRICATED METAL PRODUCTS ISIC 38 23.4 44.9 14.2 381 Metal products 31.6 68.9 15.7 382 Non-electrical machinery 19.2 27.1 15.79 383 Electrical machinery 37.6 78.3 20.2 384 Transport equipment 23.2 25 22.5 385 Professional goods 13.5 35.8 4.1
Source: Author’s calculations based on data presented in OECD STAN Database for Industrial Analysis 1978–2000, 2002.
Table A1.7: Export Growth Rate ISIC 38
EXPORT GROWTH RATE (Percent) 1990–2000 1990–93 1994–2000 FABRICATED METAL PRODUCTS ISIC 38 36.6 74.6 20.4 381 Metal Products 29.6 65.5 14.2 382 Non-electrical Machinery 31.7 50.5 23.7 383 Electrical Machinery 146 441 19.4 384 Transport equipment 23.6 26.3 22.5 385 Professional Goods 54 129.7 21.5
Source: Author’s calculations based on data presented in OECD STAN Database for Industrial Analysis 1978–2000, 2002.
Simple tabulations from the BANCOMEXT (2000) database suggest that
the distribution of exports across two-digit industries remained relatively
stable for the period 1993–1998; the metal products and machinery sector
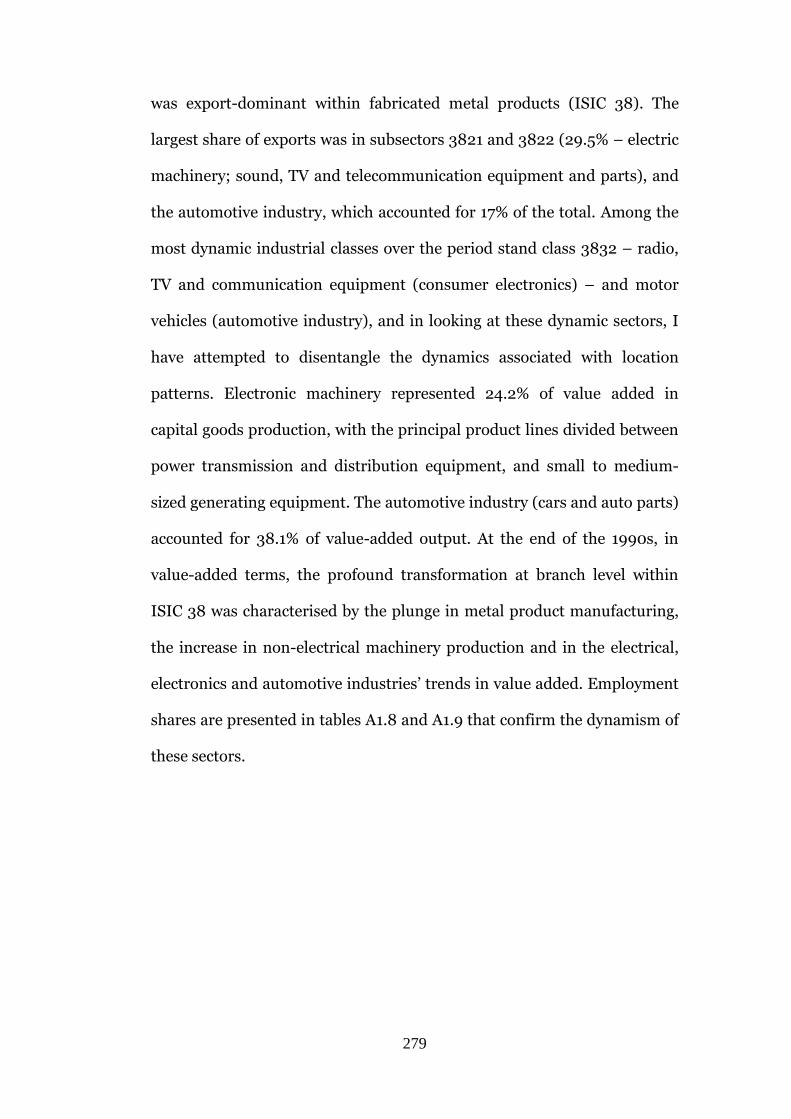
279
was export-dominant within fabricated metal products (ISIC 38). The
largest share of exports was in subsectors 3821 and 3822 (29.5% – electric
machinery; sound, TV and telecommunication equipment and parts), and
the automotive industry, which accounted for 17% of the total. Among the
most dynamic industrial classes over the period stand class 3832 – radio,
TV and communication equipment (consumer electronics) – and motor
vehicles (automotive industry), and in looking at these dynamic sectors, I
have attempted to disentangle the dynamics associated with location
patterns. Electronic machinery represented 24.2% of value added in
capital goods production, with the principal product lines divided between
power transmission and distribution equipment, and small to medium-
sized generating equipment. The automotive industry (cars and auto parts)
accounted for 38.1% of value-added output. At the end of the 1990s, in
value-added terms, the profound transformation at branch level within
ISIC 38 was characterised by the plunge in metal product manufacturing,
the increase in non-electrical machinery production and in the electrical,
electronics and automotive industries’ trends in value added. Employment
shares are presented in tables A1.8 and A1.9 that confirm the dynamism of
these sectors.
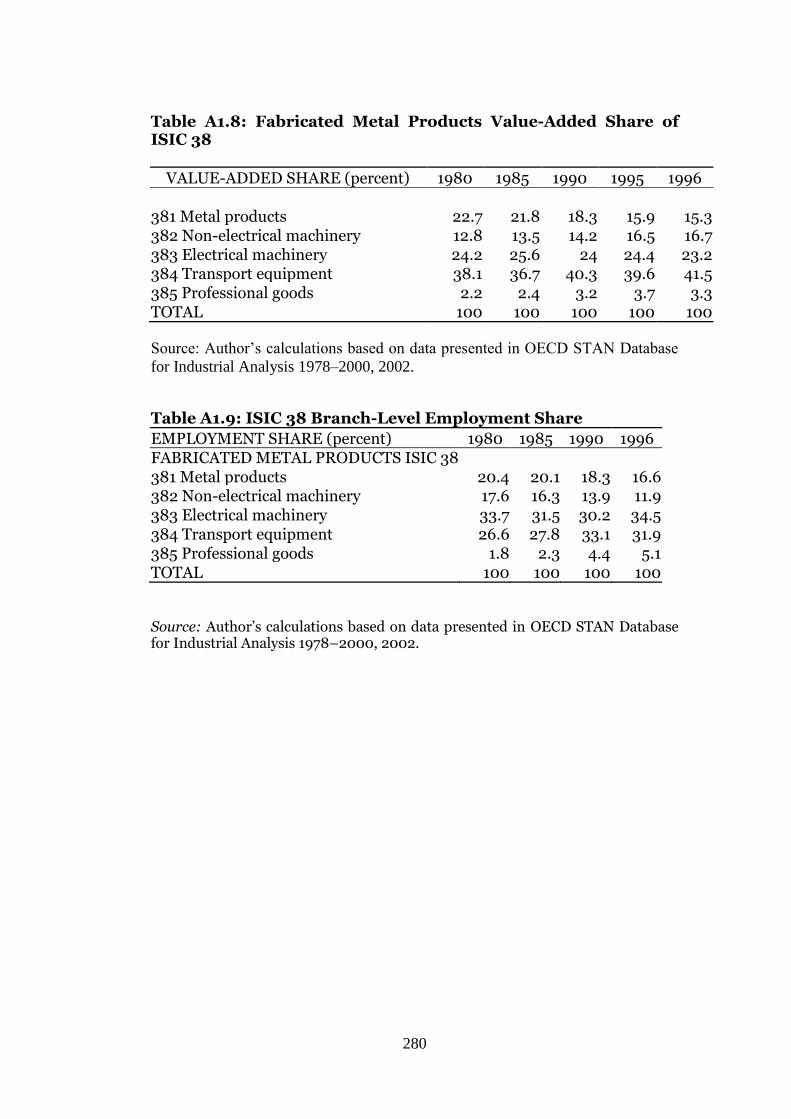
280
Table A1.8: Fabricated Metal Products Value-Added Share of ISIC 38
VALUE-ADDED SHARE (percent) 1980 1985 1990 1995 1996 381 Metal products 22.7 21.8 18.3 15.9 15.3 382 Non-electrical machinery 12.8 13.5 14.2 16.5 16.7 383 Electrical machinery 24.2 25.6 24 24.4 23.2 384 Transport equipment 38.1 36.7 40.3 39.6 41.5 385 Professional goods 2.2 2.4 3.2 3.7 3.3 TOTAL 100 100 100 100 100 Source: Author’s calculations based on data presented in OECD STAN Database
for Industrial Analysis 1978–2000, 2002.
Table A1.9: ISIC 38 Branch-Level Employment Share EMPLOYMENT SHARE (percent) 1980 1985 1990 1996 FABRICATED METAL PRODUCTS ISIC 38 381 Metal products 20.4 20.1 18.3 16.6 382 Non-electrical machinery 17.6 16.3 13.9 11.9 383 Electrical machinery 33.7 31.5 30.2 34.5 384 Transport equipment 26.6 27.8 33.1 31.9 385 Professional goods 1.8 2.3 4.4 5.1 TOTAL 100 100 100 100
Source: Author’s calculations based on data presented in OECD STAN Database for Industrial Analysis 1978–2000, 2002.
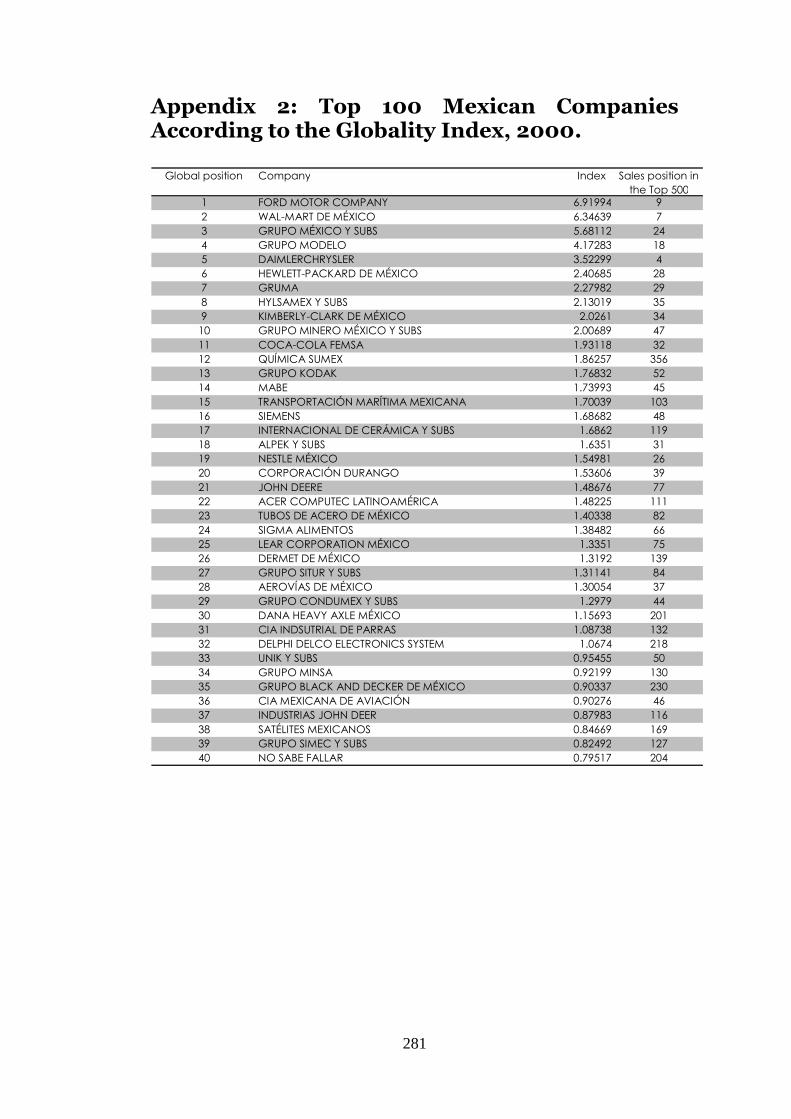
281
Appendix 2: Top 100 Mexican Companies According to the Globality Index, 2000.
Global position Company Index Sales position in the Top 500
1 FORD MOTOR COMPANY 6.91994 9 2 WAL-MART DE MÉXICO 6.34639 7 3 GRUPO MÉXICO Y SUBS 5.68112 24 4 GRUPO MODELO 4.17283 18 5 DAIMLERCHRYSLER 3.52299 4 6 HEWLETT-PACKARD DE MÉXICO 2.40685 28 7 GRUMA 2.27982 29 8 HYLSAMEX Y SUBS 2.13019 35 9 KIMBERLY-CLARK DE MÉXICO 2.0261 34
10 GRUPO MINERO MÉXICO Y SUBS 2.00689 47 11 COCA-COLA FEMSA 1.93118 32 12 QUÍMICA SUMEX 1.86257 356 13 GRUPO KODAK 1.76832 52 14 MABE 1.73993 45 15 TRANSPORTACIÓN MARÍTIMA MEXICANA 1.70039 103 16 SIEMENS 1.68682 48 17 INTERNACIONAL DE CERÁMICA Y SUBS 1.6862 119 18 ALPEK Y SUBS 1.6351 31 19 NESTLE MÉXICO 1.54981 26 20 CORPORACIÓN DURANGO 1.53606 39 21 JOHN DEERE 1.48676 77 22 ACER COMPUTEC LATINOAMÉRICA 1.48225 111 23 TUBOS DE ACERO DE MÉXICO 1.40338 82 24 SIGMA ALIMENTOS 1.38482 66 25 LEAR CORPORATION MÉXICO 1.3351 75 26 DERMET DE MÉXICO 1.3192 139 27 GRUPO SITUR Y SUBS 1.31141 84 28 AEROVÍAS DE MÉXICO 1.30054 37 29 GRUPO CONDUMEX Y SUBS 1.2979 44 30 DANA HEAVY AXLE MÉXICO 1.15693 201 31 CIA INDSUTRIAL DE PARRAS 1.08738 132 32 DELPHI DELCO ELECTRONICS SYSTEM 1.0674 218 33 UNIK Y SUBS 0.95455 50 34 GRUPO MINSA 0.92199 130 35 GRUPO BLACK AND DECKER DE MÉXICO 0.90337 230 36 CIA MEXICANA DE AVIACIÓN 0.90276 46 37 INDUSTRIAS JOHN DEER 0.87983 116 38 SATÉLITES MEXICANOS 0.84669 169 39 GRUPO SIMEC Y SUBS 0.82492 127 40 NO SABE FALLAR 0.79517 204
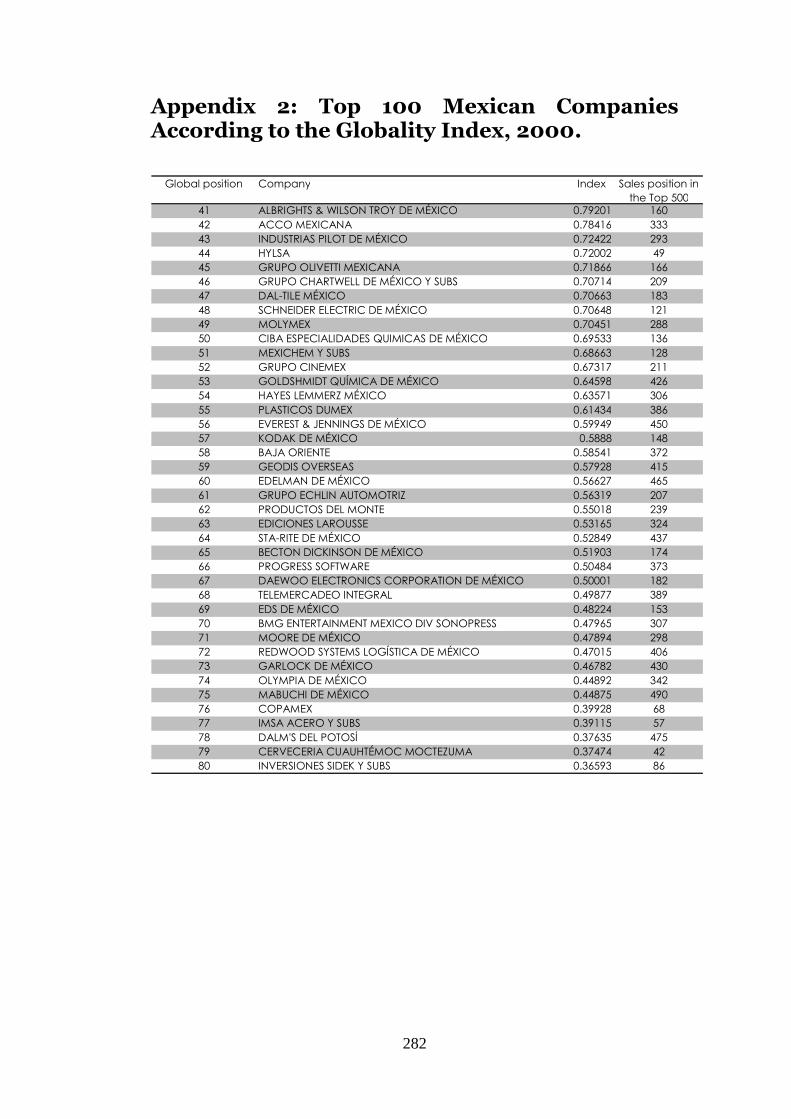
282
Appendix 2: Top 100 Mexican Companies According to the Globality Index, 2000.
Global position Company Index Sales position in the Top 500
41 ALBRIGHTS & WILSON TROY DE MÉXICO 0.79201 160 42 ACCO MEXICANA 0.78416 333 43 INDUSTRIAS PILOT DE MÉXICO 0.72422 293 44 HYLSA 0.72002 49 45 GRUPO OLIVETTI MEXICANA 0.71866 166 46 GRUPO CHARTWELL DE MÉXICO Y SUBS 0.70714 209 47 DAL-TILE MÉXICO 0.70663 183 48 SCHNEIDER ELECTRIC DE MÉXICO 0.70648 121 49 MOLYMEX 0.70451 288 50 CIBA ESPECIALIDADES QUIMICAS DE MÉXICO 0.69533 136 51 MEXICHEM Y SUBS 0.68663 128 52 GRUPO CINEMEX 0.67317 211 53 GOLDSHMIDT QUÍMICA DE MÉXICO 0.64598 426 54 HAYES LEMMERZ MÉXICO 0.63571 306 55 PLASTICOS DUMEX 0.61434 386 56 EVEREST & JENNINGS DE MÉXICO 0.59949 450 57 KODAK DE MÉXICO 0.5888 148 58 BAJA ORIENTE 0.58541 372 59 GEODIS OVERSEAS 0.57928 415 60 EDELMAN DE MÉXICO 0.56627 465 61 GRUPO ECHLIN AUTOMOTRIZ 0.56319 207 62 PRODUCTOS DEL MONTE 0.55018 239 63 EDICIONES LAROUSSE 0.53165 324 64 STA-RITE DE MÉXICO 0.52849 437 65 BECTON DICKINSON DE MÉXICO 0.51903 174 66 PROGRESS SOFTWARE 0.50484 373 67 DAEWOO ELECTRONICS CORPORATION DE MÉXICO 0.50001 182 68 TELEMERCADEO INTEGRAL 0.49877 389 69 EDS DE MÉXICO 0.48224 153 70 BMG ENTERTAINMENT MEXICO DIV SONOPRESS 0.47965 307 71 MOORE DE MÉXICO 0.47894 298 72 REDWOOD SYSTEMS LOGÍSTICA DE MÉXICO 0.47015 406 73 GARLOCK DE MÉXICO 0.46782 430 74 OLYMPIA DE MÉXICO 0.44892 342 75 MABUCHI DE MÉXICO 0.44875 490 76 COPAMEX 0.39928 68 77 IMSA ACERO Y SUBS 0.39115 57 78 DALM'S DEL POTOSÍ 0.37635 475 79 CERVECERIA CUAUHTÉMOC MOCTEZUMA 0.37474 42 80 INVERSIONES SIDEK Y SUBS 0.36593 86
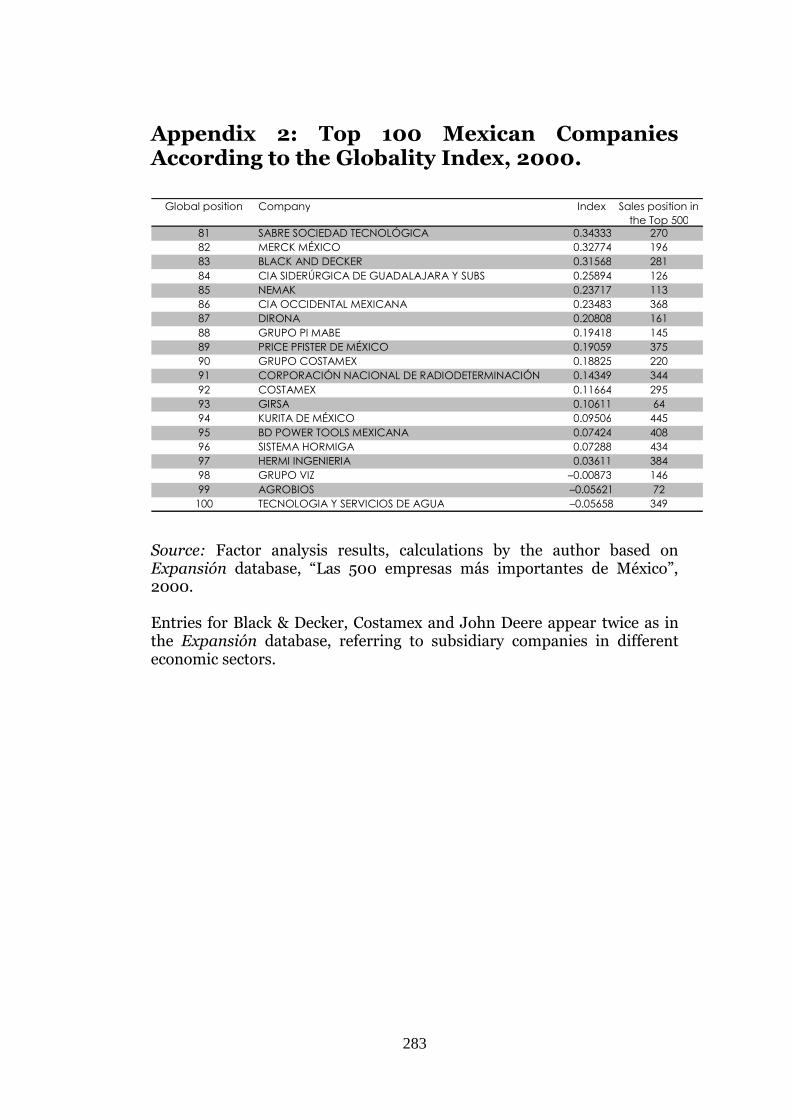
283
Appendix 2: Top 100 Mexican Companies According to the Globality Index, 2000.
Source: Factor analysis results, calculations by the author based on Expansión database, “Las 500 empresas más importantes de México”, 2000. Entries for Black & Decker, Costamex and John Deere appear twice as in the Expansión database, referring to subsidiary companies in different economic sectors.
Global position Company Index Sales position in the Top 500
81 SABRE SOCIEDAD TECNOLÓGICA 0.34333 270 82 MERCK MÉXICO 0.32774 196 83 BLACK AND DECKER 0.31568 281 84 CIA SIDERÚRGICA DE GUADALAJARA Y SUBS 0.25894 126 85 NEMAK 0.23717 113 86 CIA OCCIDENTAL MEXICANA 0.23483 368 87 DIRONA 0.20808 161 88 GRUPO PI MABE 0.19418 145 89 PRICE PFISTER DE MÉXICO 0.19059 375 90 GRUPO COSTAMEX 0.18825 220 91 CORPORACIÓN NACIONAL DE RADIODETERMINACIÓN 0.14349 344 92 COSTAMEX 0.11664 295 93 GIRSA 0.10611 64 94 KURITA DE MÉXICO 0.09506 445 95 BD POWER TOOLS MEXICANA 0.07424 408 96 SISTEMA HORMIGA 0.07288 434 97 HERMI INGENIERIA 0.03611 384 98 GRUPO VIZ –0.00873 146 99 AGROBIOS –0.05621 72
100 TECNOLOGIA Y SERVICIOS DE AGUA –0.05658 349
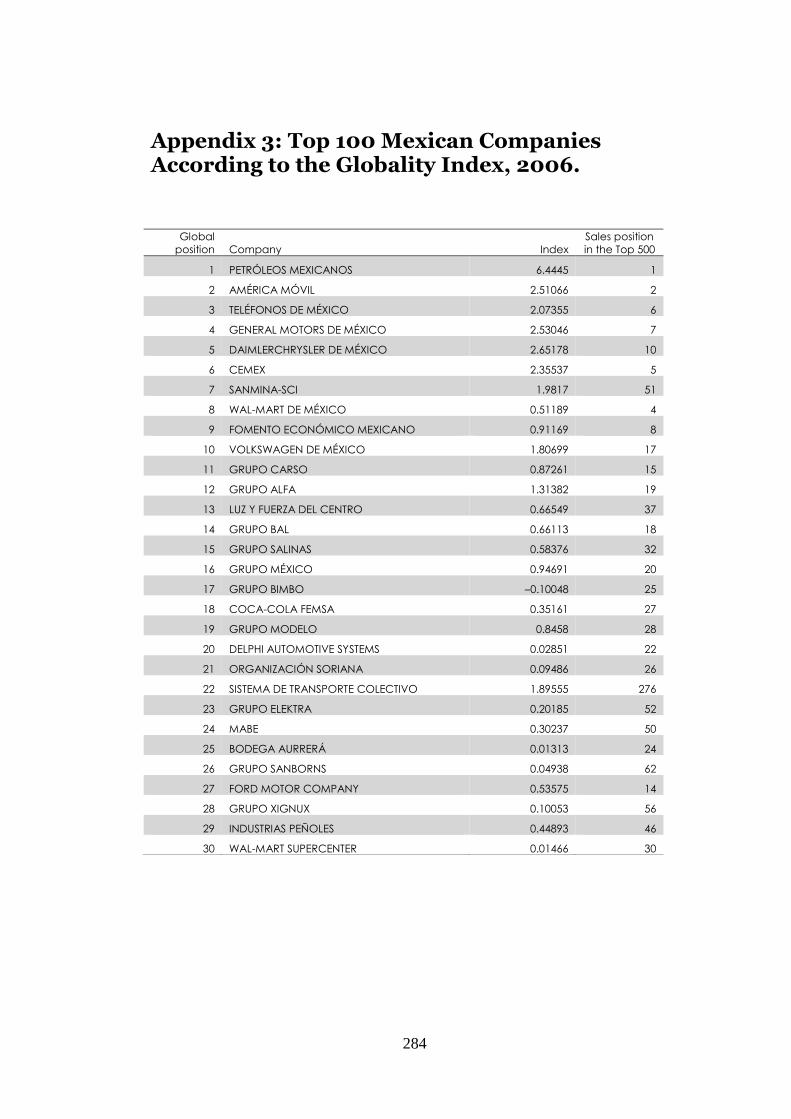
284
Appendix 3: Top 100 Mexican Companies According to the Globality Index, 2006.
Global
position Company Index
Sales position
in the Top 500
1 PETRÓLEOS MEXICANOS 6.4445 1
2 AMÉRICA MÓVIL 2.51066 2
3 TELÉFONOS DE MÉXICO 2.07355 6
4 GENERAL MOTORS DE MÉXICO 2.53046 7
5 DAIMLERCHRYSLER DE MÉXICO 2.65178 10
6 CEMEX 2.35537 5
7 SANMINA-SCI 1.9817 51
8 WAL-MART DE MÉXICO 0.51189 4
9 FOMENTO ECONÓMICO MEXICANO 0.91169 8
10 VOLKSWAGEN DE MÉXICO 1.80699 17
11 GRUPO CARSO 0.87261 15
12 GRUPO ALFA 1.31382 19
13 LUZ Y FUERZA DEL CENTRO 0.66549 37
14 GRUPO BAL 0.66113 18
15 GRUPO SALINAS 0.58376 32
16 GRUPO MÉXICO 0.94691 20
17 GRUPO BIMBO –0.10048 25
18 COCA-COLA FEMSA 0.35161 27
19 GRUPO MODELO 0.8458 28
20 DELPHI AUTOMOTIVE SYSTEMS 0.02851 22
21 ORGANIZACIÓN SORIANA 0.09486 26
22 SISTEMA DE TRANSPORTE COLECTIVO 1.89555 276
23 GRUPO ELEKTRA 0.20185 52
24 MABE 0.30237 50
25 BODEGA AURRERÁ 0.01313 24
26 GRUPO SANBORNS 0.04938 62
27 FORD MOTOR COMPANY 0.53575 14
28 GRUPO XIGNUX 0.10053 56
29 INDUSTRIAS PEÑOLES 0.44893 46
30 WAL-MART SUPERCENTER 0.01466 30
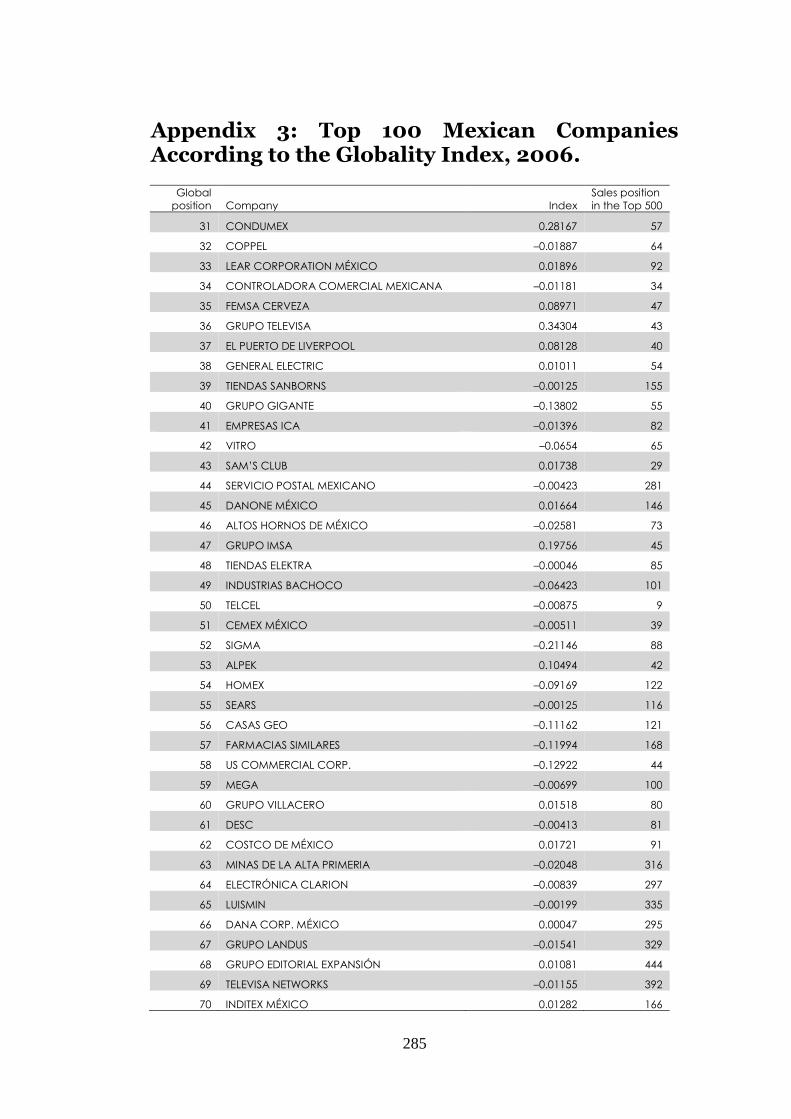
285
Appendix 3: Top 100 Mexican Companies According to the Globality Index, 2006.
Global
position Company Index
Sales position
in the Top 500
31 CONDUMEX 0.28167 57
32 COPPEL –0.01887 64
33 LEAR CORPORATION MÉXICO 0.01896 92
34 CONTROLADORA COMERCIAL MEXICANA –0.01181 34
35 FEMSA CERVEZA 0.08971 47
36 GRUPO TELEVISA 0.34304 43
37 EL PUERTO DE LIVERPOOL 0.08128 40
38 GENERAL ELECTRIC 0.01011 54
39 TIENDAS SANBORNS –0.00125 155
40 GRUPO GIGANTE –0.13802 55
41 EMPRESAS ICA –0.01396 82
42 VITRO –0.0654 65
43 SAM’S CLUB 0.01738 29
44 SERVICIO POSTAL MEXICANO –0.00423 281
45 DANONE MÉXICO 0.01664 146
46 ALTOS HORNOS DE MÉXICO –0.02581 73
47 GRUPO IMSA 0.19756 45
48 TIENDAS ELEKTRA –0.00046 85
49 INDUSTRIAS BACHOCO –0.06423 101
50 TELCEL –0.00875 9
51 CEMEX MÉXICO –0.00511 39
52 SIGMA –0.21146 88
53 ALPEK 0.10494 42
54 HOMEX –0.09169 122
55 SEARS –0.00125 116
56 CASAS GEO –0.11162 121
57 FARMACIAS SIMILARES –0.11994 168
58 US COMMERCIAL CORP. –0.12922 44
59 MEGA –0.00699 100
60 GRUPO VILLACERO 0.01518 80
61 DESC –0.00413 81
62 COSTCO DE MÉXICO 0.01721 91
63 MINAS DE LA ALTA PRIMERIA –0.02048 316
64 ELECTRÓNICA CLARION –0.00839 297
65 LUISMIN –0.00199 335
66 DANA CORP. MÉXICO 0.00047 295
67 GRUPO LANDUS –0.01541 329
68 GRUPO EDITORIAL EXPANSIÓN 0.01081 444
69 TELEVISA NETWORKS –0.01155 392
70 INDITEX MÉXICO 0.01282 166
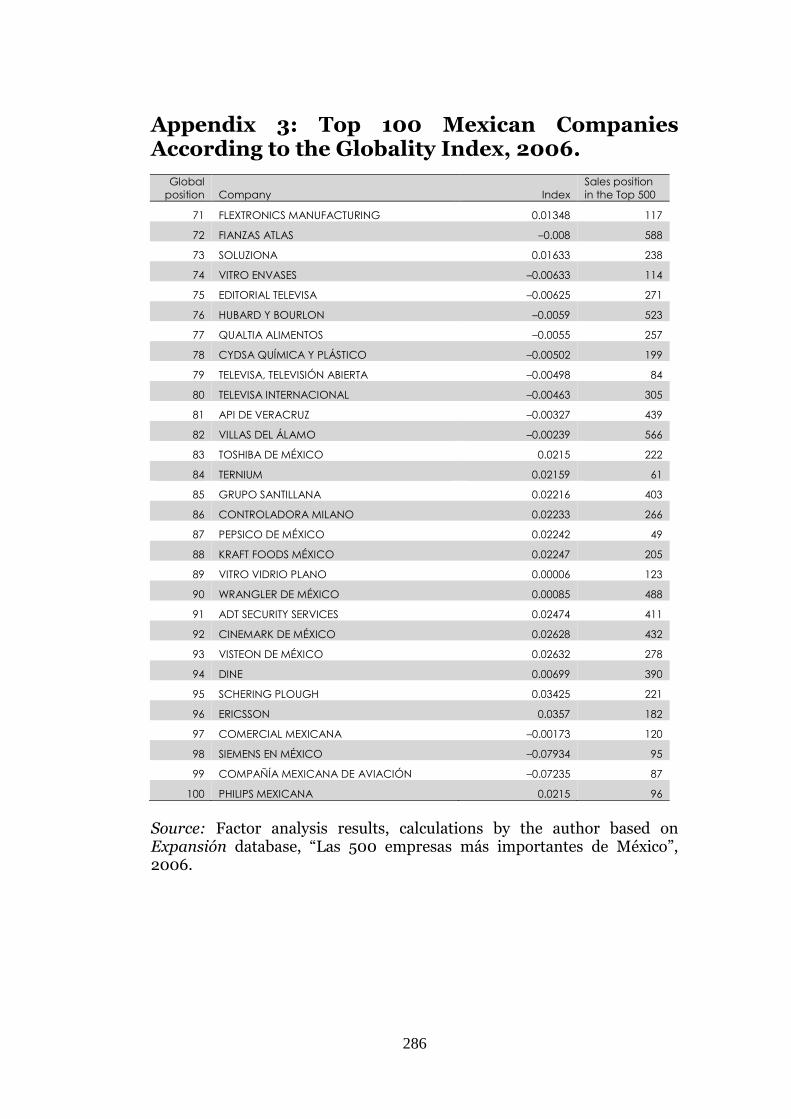
286
Appendix 3: Top 100 Mexican Companies According to the Globality Index, 2006.
Global
position Company Index
Sales position
in the Top 500
71 FLEXTRONICS MANUFACTURING 0.01348 117
72 FIANZAS ATLAS –0.008 588
73 SOLUZIONA 0.01633 238
74 VITRO ENVASES –0.00633 114
75 EDITORIAL TELEVISA –0.00625 271
76 HUBARD Y BOURLON –0.0059 523
77 QUALTIA ALIMENTOS –0.0055 257
78 CYDSA QUÍMICA Y PLÁSTICO –0.00502 199
79 TELEVISA, TELEVISIÓN ABIERTA –0.00498 84
80 TELEVISA INTERNACIONAL –0.00463 305
81 API DE VERACRUZ –0.00327 439
82 VILLAS DEL ÁLAMO –0.00239 566
83 TOSHIBA DE MÉXICO 0.0215 222
84 TERNIUM 0.02159 61
85 GRUPO SANTILLANA 0.02216 403
86 CONTROLADORA MILANO 0.02233 266
87 PEPSICO DE MÉXICO 0.02242 49
88 KRAFT FOODS MÉXICO 0.02247 205
89 VITRO VIDRIO PLANO 0.00006 123
90 WRANGLER DE MÉXICO 0.00085 488
91 ADT SECURITY SERVICES 0.02474 411
92 CINEMARK DE MÉXICO 0.02628 432
93 VISTEON DE MÉXICO 0.02632 278
94 DINE 0.00699 390
95 SCHERING PLOUGH 0.03425 221
96 ERICSSON 0.0357 182
97 COMERCIAL MEXICANA –0.00173 120
98 SIEMENS EN MÉXICO –0.07934 95
99 COMPAÑÍA MEXICANA DE AVIACIÓN –0.07235 87
100 PHILIPS MEXICANA 0.0215 96
Source: Factor analysis results, calculations by the author based on Expansión database, “Las 500 empresas más importantes de México”, 2006.
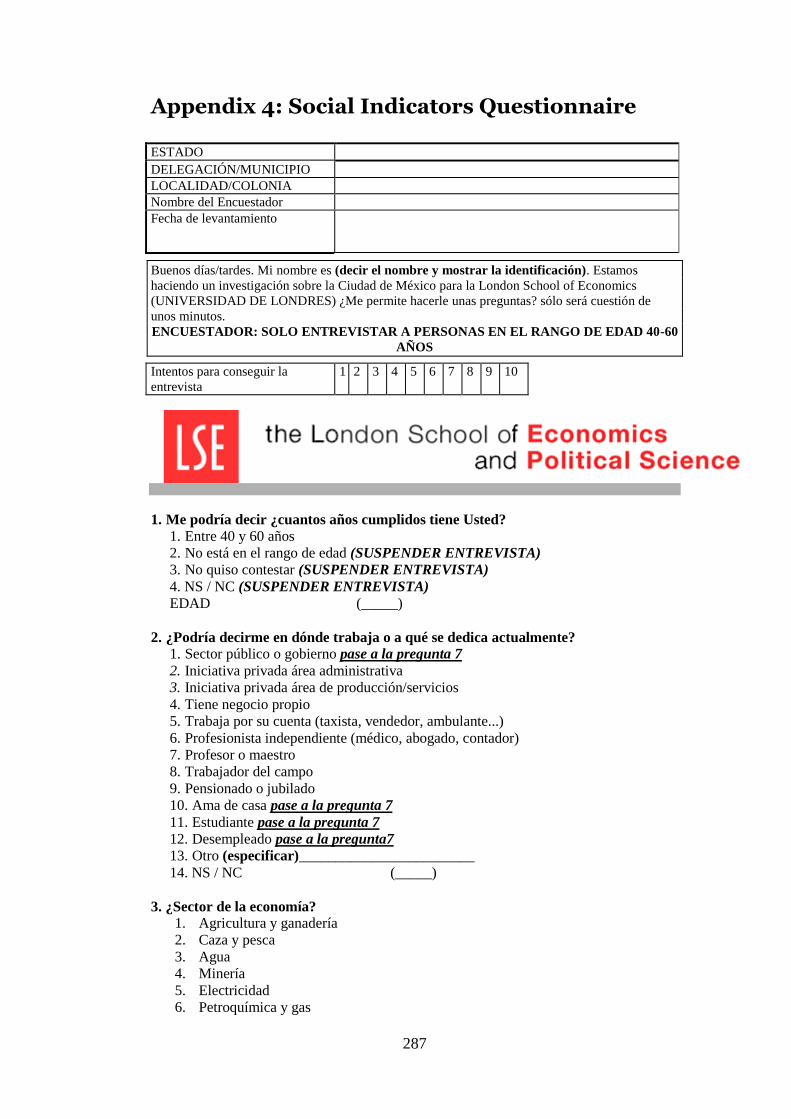
287
Appendix 4: Social Indicators Questionnaire
ESTADO
DELEGACIÓN/MUNICIPIO
LOCALIDAD/COLONIA
Nombre del Encuestador
Fecha de levantamiento
Buenos días/tardes. Mi nombre es (decir el nombre y mostrar la identificación). Estamos
haciendo un investigación sobre la Ciudad de México para la London School of Economics
(UNIVERSIDAD DE LONDRES) ¿Me permite hacerle unas preguntas? sólo será cuestión de
unos minutos.
ENCUESTADOR: SOLO ENTREVISTAR A PERSONAS EN EL RANGO DE EDAD 40-60
AÑOS
Intentos para conseguir la
entrevista
1 2 3 4 5 6 7 8 9 10
1. Me podría decir ¿cuantos años cumplidos tiene Usted?
1. Entre 40 y 60 años
2. No está en el rango de edad (SUSPENDER ENTREVISTA)
3. No quiso contestar (SUSPENDER ENTREVISTA)
4. NS / NC (SUSPENDER ENTREVISTA)
EDAD (_____)
2. ¿Podría decirme en dónde trabaja o a qué se dedica actualmente?
1. Sector público o gobierno pase a la pregunta 7
2. Iniciativa privada área administrativa
3. Iniciativa privada área de producción/servicios
4. Tiene negocio propio
5. Trabaja por su cuenta (taxista, vendedor, ambulante...)
6. Profesionista independiente (médico, abogado, contador)
7. Profesor o maestro
8. Trabajador del campo
9. Pensionado o jubilado
10. Ama de casa pase a la pregunta 7
11. Estudiante pase a la pregunta 7
12. Desempleado pase a la pregunta7
13. Otro (especificar)________________________
14. NS / NC (_____)
3. ¿Sector de la economía?
1. Agricultura y ganadería
2. Caza y pesca
3. Agua
4. Minería
5. Electricidad
6. Petroquímica y gas
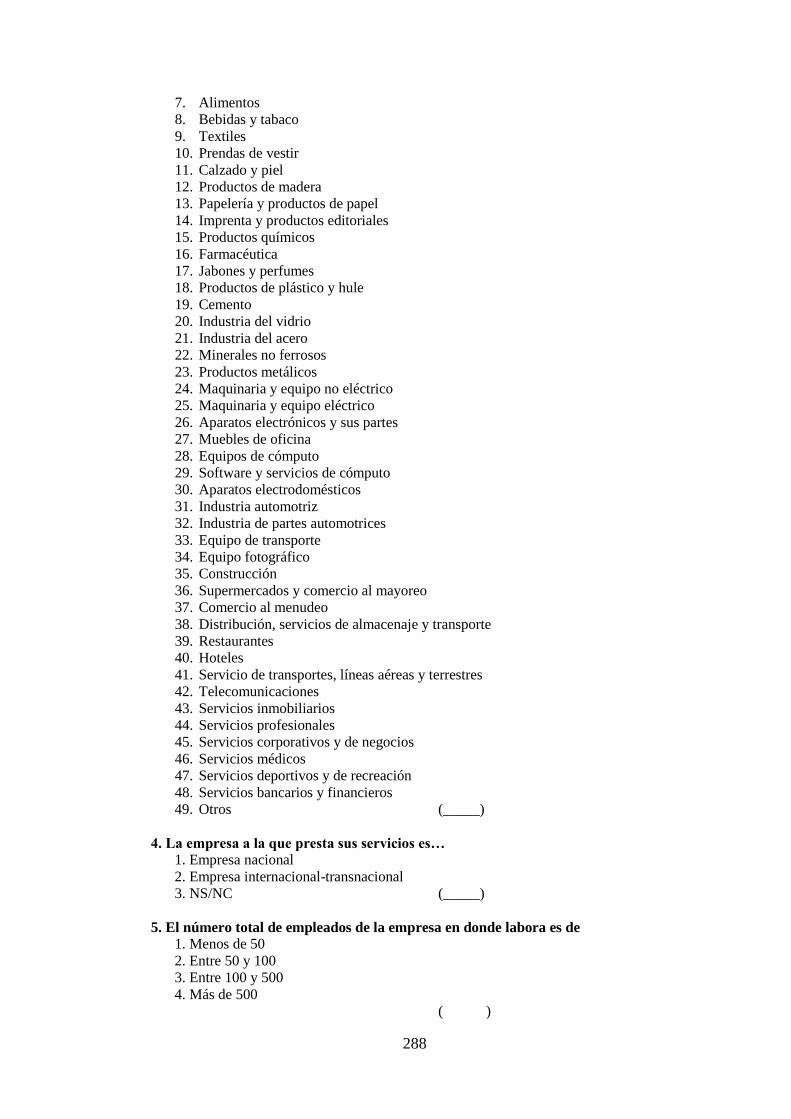
288
7. Alimentos
8. Bebidas y tabaco
9. Textiles
10. Prendas de vestir
11. Calzado y piel
12. Productos de madera
13. Papelería y productos de papel
14. Imprenta y productos editoriales
15. Productos químicos
16. Farmacéutica
17. Jabones y perfumes
18. Productos de plástico y hule
19. Cemento
20. Industria del vidrio
21. Industria del acero
22. Minerales no ferrosos
23. Productos metálicos
24. Maquinaria y equipo no eléctrico
25. Maquinaria y equipo eléctrico
26. Aparatos electrónicos y sus partes
27. Muebles de oficina
28. Equipos de cómputo
29. Software y servicios de cómputo
30. Aparatos electrodomésticos
31. Industria automotriz
32. Industria de partes automotrices
33. Equipo de transporte
34. Equipo fotográfico
35. Construcción
36. Supermercados y comercio al mayoreo
37. Comercio al menudeo
38. Distribución, servicios de almacenaje y transporte
39. Restaurantes
40. Hoteles
41. Servicio de transportes, líneas aéreas y terrestres
42. Telecomunicaciones
43. Servicios inmobiliarios
44. Servicios profesionales
45. Servicios corporativos y de negocios
46. Servicios médicos
47. Servicios deportivos y de recreación
48. Servicios bancarios y financieros
49. Otros (_____)
4. La empresa a la que presta sus servicios es…
1. Empresa nacional
2. Empresa internacional-transnacional
3. NS/NC (_____)
5. El número total de empleados de la empresa en donde labora es de
1. Menos de 50
2. Entre 50 y 100
3. Entre 100 y 500
4. Más de 500
( )

289
6. En términos de su actividad laboral (o la de su empresa) ¿cuál diría Usted que es
la ciudad más importante en México o el extranjero?
______________________________________________
7. ¿Podría decirme en dónde trabajaba en 1982 o a qué se dedicaba entonces?
1. Sector público o gobierno pase a la pregunta 9
2. Iniciativa privada área administrativa
3. Iniciativa privada obrero
4. Tiene negocio propio
5. Trabaja por su cuenta (taxista, vendedor, ambulante...)
6. Profesionista independiente (dentista, médico, abogado.)
7. Profesor o maestro
8. Trabajador del campo
9. Pensionado o jubilado
10. Ama de casa pase a la pregunta 9
11. Estudiante pase a la pregunta 9
12. Desempleado pase a la pregunta 9
13. Otro (especificar)________________________
14. NS / NC (_____)
8. ¿En que sector de la economía (en 1982)? Ver catálogo de pregunta 3
(_____)
9. ¿Hasta qué año estudió Usted?
1. Ninguno
2. Primaria
3. Secundaria / SecundariaTécnica / Técnica SIN Sec.
4. Carrera Técnica CON Secundaria
5. Preparatoria / Bachillerato / Normal
6. Universidad
7. Posgrado
8. NS / NC (_____)
10. En general ¿usted cree que la situación en México va en la dirección correcta o
en la dirección equivocada?
1. Dirección correcta
2. Dirección equivocada
3. NS / NC (_____)
11. Y hablando concretamente de su situación personal ¿En general usted cree que
está mejor ahora que hace 20 años o antes estaba mejor?
1. Sí
2. No
3. En parte sí
4. NS / NC (_____)
12. ¿Durante los últimos 20 años ha estado en el desempleo en búsqueda de trabajo
por más de 6 meses? 1. Si
2. No pase
3. NS / NC (_____)
13. En que año(s) _______________________________
1. NS / NC
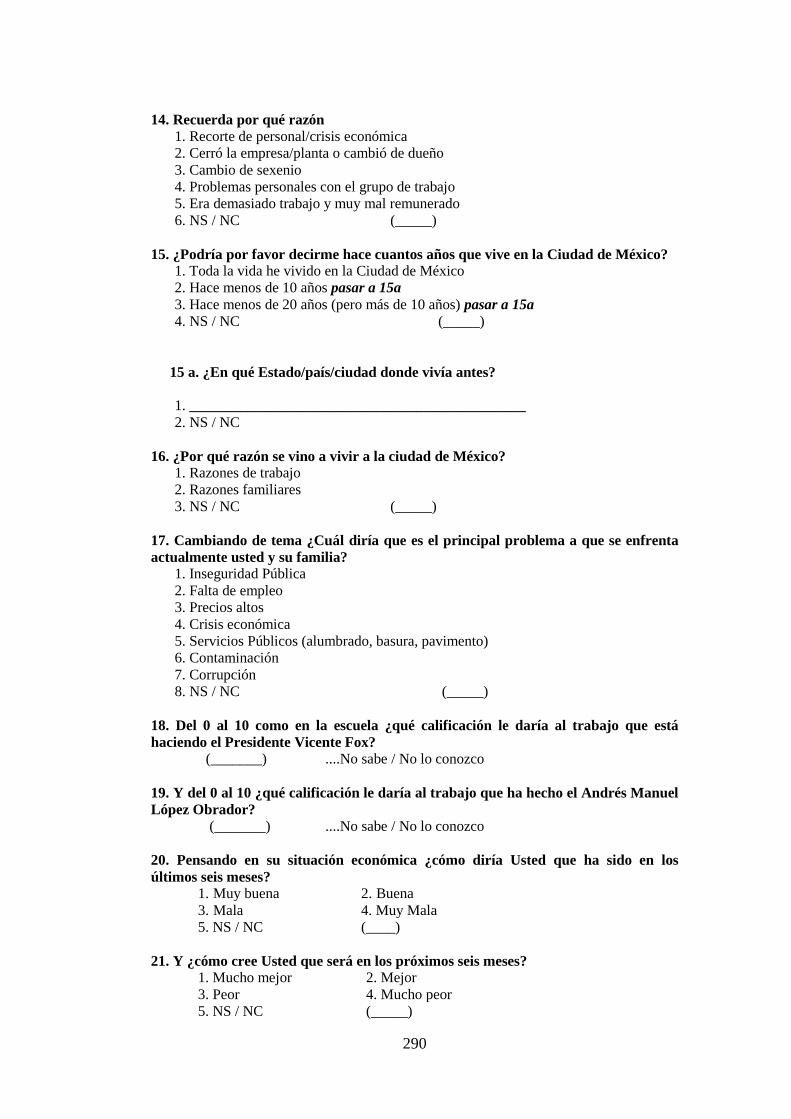
290
14. Recuerda por qué razón
1. Recorte de personal/crisis económica
2. Cerró la empresa/planta o cambió de dueño
3. Cambio de sexenio
4. Problemas personales con el grupo de trabajo
5. Era demasiado trabajo y muy mal remunerado
6. NS / NC (_____)
15. ¿Podría por favor decirme hace cuantos años que vive en la Ciudad de México?
1. Toda la vida he vivido en la Ciudad de México
2. Hace menos de 10 años pasar a 15a
3. Hace menos de 20 años (pero más de 10 años) pasar a 15a
4. NS / NC (_____)
15 a. ¿En qué Estado/país/ciudad donde vivía antes?
1. ______________________________________________
2. NS / NC
16. ¿Por qué razón se vino a vivir a la ciudad de México?
1. Razones de trabajo
2. Razones familiares
3. NS / NC (_____)
17. Cambiando de tema ¿Cuál diría que es el principal problema a que se enfrenta
actualmente usted y su familia?
1. Inseguridad Pública
2. Falta de empleo
3. Precios altos
4. Crisis económica
5. Servicios Públicos (alumbrado, basura, pavimento)
6. Contaminación
7. Corrupción
8. NS / NC (_____)
18. Del 0 al 10 como en la escuela ¿qué calificación le daría al trabajo que está
haciendo el Presidente Vicente Fox?
(_______) ....No sabe / No lo conozco
19. Y del 0 al 10 ¿qué calificación le daría al trabajo que ha hecho el Andrés Manuel
López Obrador?
(_______) ....No sabe / No lo conozco
20. Pensando en su situación económica ¿cómo diría Usted que ha sido en los
últimos seis meses?
1. Muy buena 2. Buena
3. Mala 4. Muy Mala
5. NS / NC (____)
21. Y ¿cómo cree Usted que será en los próximos seis meses?
1. Mucho mejor 2. Mejor
3. Peor 4. Mucho peor
5. NS / NC (_____)
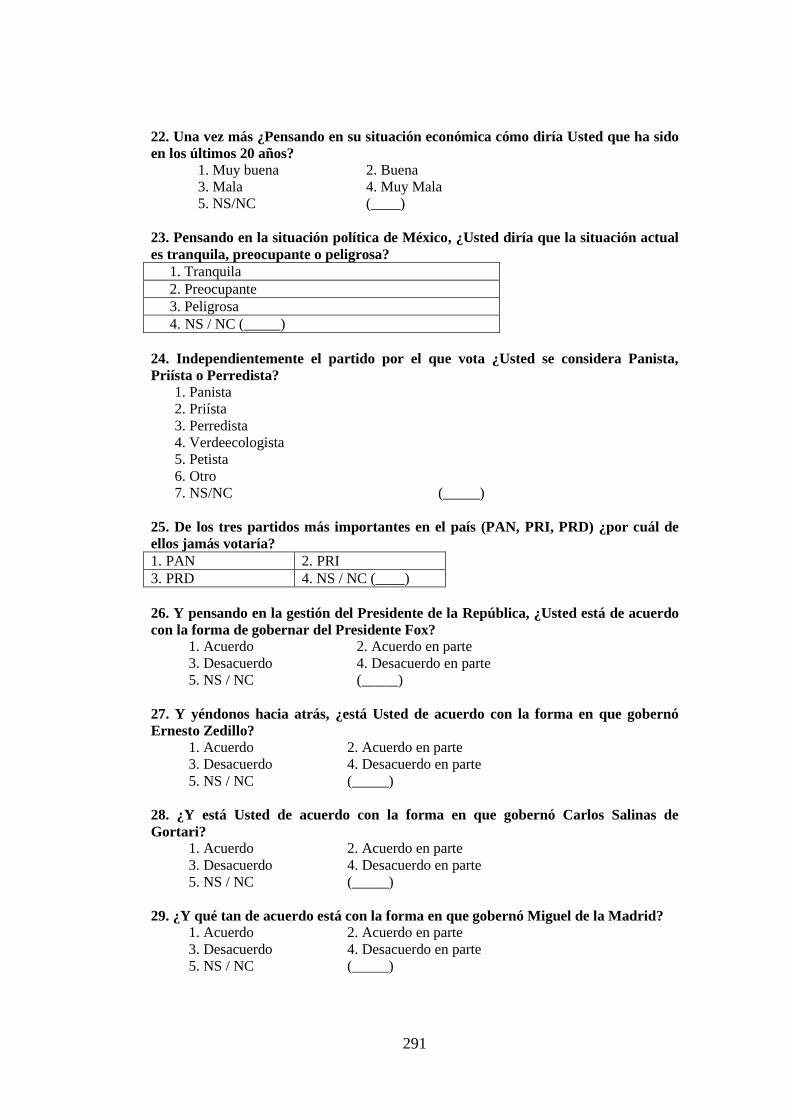
291
22. Una vez más ¿Pensando en su situación económica cómo diría Usted que ha sido
en los últimos 20 años?
1. Muy buena 2. Buena
3. Mala 4. Muy Mala
5. NS/NC (____)
23. Pensando en la situación política de México, ¿Usted diría que la situación actual
es tranquila, preocupante o peligrosa?
1. Tranquila
2. Preocupante
3. Peligrosa
4. NS / NC (_____)
24. Independientemente el partido por el que vota ¿Usted se considera Panista,
Priísta o Perredista?
1. Panista
2. Priísta
3. Perredista
4. Verdeecologista
5. Petista
6. Otro
7. NS/NC (_____)
25. De los tres partidos más importantes en el país (PAN, PRI, PRD) ¿por cuál de
ellos jamás votaría?
1. PAN 2. PRI
3. PRD 4. NS / NC (____)
26. Y pensando en la gestión del Presidente de la República, ¿Usted está de acuerdo
con la forma de gobernar del Presidente Fox?
1. Acuerdo 2. Acuerdo en parte
3. Desacuerdo 4. Desacuerdo en parte
5. NS / NC (_____)
27. Y yéndonos hacia atrás, ¿está Usted de acuerdo con la forma en que gobernó
Ernesto Zedillo?
1. Acuerdo 2. Acuerdo en parte
3. Desacuerdo 4. Desacuerdo en parte
5. NS / NC (_____)
28. ¿Y está Usted de acuerdo con la forma en que gobernó Carlos Salinas de
Gortari? 1. Acuerdo 2. Acuerdo en parte
3. Desacuerdo 4. Desacuerdo en parte
5. NS / NC (_____)
29. ¿Y qué tan de acuerdo está con la forma en que gobernó Miguel de la Madrid?
1. Acuerdo 2. Acuerdo en parte
3. Desacuerdo 4. Desacuerdo en parte
5. NS / NC (_____)
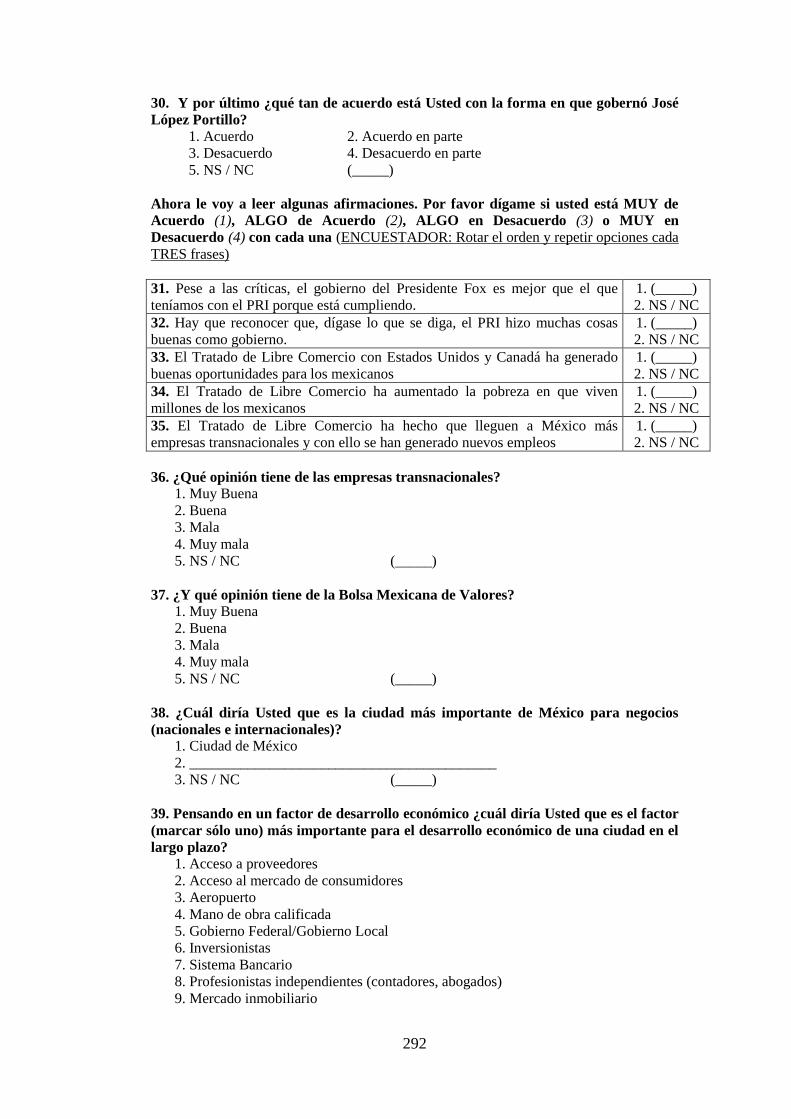
292
30. Y por último ¿qué tan de acuerdo está Usted con la forma en que gobernó José
López Portillo?
1. Acuerdo 2. Acuerdo en parte
3. Desacuerdo 4. Desacuerdo en parte
5. NS / NC (_____)
Ahora le voy a leer algunas afirmaciones. Por favor dígame si usted está MUY de
Acuerdo (1), ALGO de Acuerdo (2), ALGO en Desacuerdo (3) o MUY en
Desacuerdo (4) con cada una (ENCUESTADOR: Rotar el orden y repetir opciones cada
TRES frases)
31. Pese a las críticas, el gobierno del Presidente Fox es mejor que el que
teníamos con el PRI porque está cumpliendo.
1. (_____)
2. NS / NC
32. Hay que reconocer que, dígase lo que se diga, el PRI hizo muchas cosas
buenas como gobierno.
1. (_____)
2. NS / NC
33. El Tratado de Libre Comercio con Estados Unidos y Canadá ha generado
buenas oportunidades para los mexicanos
1. (_____)
2. NS / NC
34. El Tratado de Libre Comercio ha aumentado la pobreza en que viven
millones de los mexicanos
1. (_____)
2. NS / NC
35. El Tratado de Libre Comercio ha hecho que lleguen a México más
empresas transnacionales y con ello se han generado nuevos empleos
1. (_____)
2. NS / NC
36. ¿Qué opinión tiene de las empresas transnacionales?
1. Muy Buena
2. Buena
3. Mala
4. Muy mala
5. NS / NC (_____)
37. ¿Y qué opinión tiene de la Bolsa Mexicana de Valores?
1. Muy Buena
2. Buena
3. Mala
4. Muy mala
5. NS / NC (_____)
38. ¿Cuál diría Usted que es la ciudad más importante de México para negocios
(nacionales e internacionales)?
1. Ciudad de México
2. __________________________________________
3. NS / NC (_____)
39. Pensando en un factor de desarrollo económico ¿cuál diría Usted que es el factor
(marcar sólo uno) más importante para el desarrollo económico de una ciudad en el
largo plazo?
1. Acceso a proveedores
2. Acceso al mercado de consumidores
3. Aeropuerto
4. Mano de obra calificada
5. Gobierno Federal/Gobierno Local
6. Inversionistas
7. Sistema Bancario
8. Profesionistas independientes (contadores, abogados)
9. Mercado inmobiliario
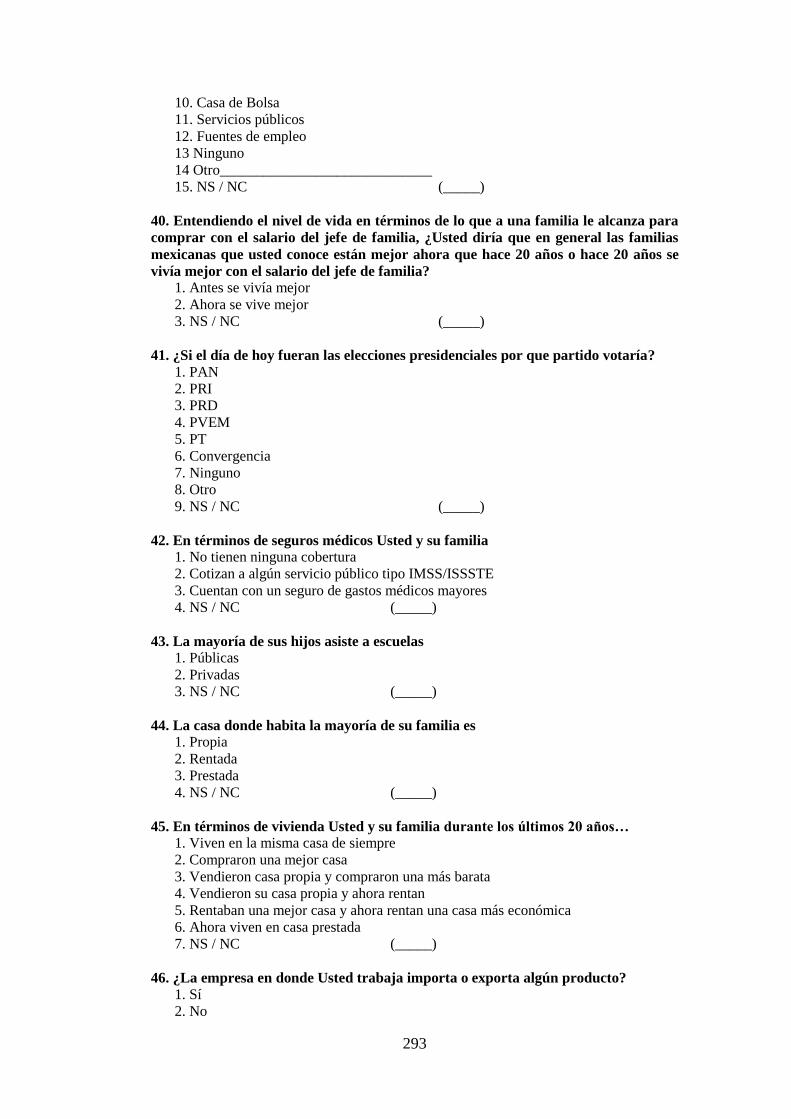
293
10. Casa de Bolsa
11. Servicios públicos
12. Fuentes de empleo
13 Ninguno
14 Otro_____________________________
15. NS / NC (_____)
40. Entendiendo el nivel de vida en términos de lo que a una familia le alcanza para
comprar con el salario del jefe de familia, ¿Usted diría que en general las familias
mexicanas que usted conoce están mejor ahora que hace 20 años o hace 20 años se
vivía mejor con el salario del jefe de familia?
1. Antes se vivía mejor
2. Ahora se vive mejor
3. NS / NC (_____)
41. ¿Si el día de hoy fueran las elecciones presidenciales por que partido votaría?
1. PAN
2. PRI
3. PRD
4. PVEM
5. PT
6. Convergencia
7. Ninguno
8. Otro
9. NS / NC (_____)
42. En términos de seguros médicos Usted y su familia
1. No tienen ninguna cobertura
2. Cotizan a algún servicio público tipo IMSS/ISSSTE
3. Cuentan con un seguro de gastos médicos mayores
4. NS / NC (_____)
43. La mayoría de sus hijos asiste a escuelas
1. Públicas
2. Privadas
3. NS / NC (_____)
44. La casa donde habita la mayoría de su familia es
1. Propia
2. Rentada
3. Prestada
4. NS / NC (_____)
45. En términos de vivienda Usted y su familia durante los últimos 20 años…
1. Viven en la misma casa de siempre
2. Compraron una mejor casa
3. Vendieron casa propia y compraron una más barata
4. Vendieron su casa propia y ahora rentan
5. Rentaban una mejor casa y ahora rentan una casa más económica
6. Ahora viven en casa prestada
7. NS / NC (_____)
46. ¿La empresa en donde Usted trabaja importa o exporta algún producto?
1. Sí
2. No
294
3.NS / NC (_____)
47. En caso de ser así cual país concentra el mayor volumen de intercambios
comerciales
1_______________________________________________
2. NS / NC (_____)
48. Recordará que hace 20 años la inflación era muy alta y había devaluaciones
recurrentes. ¿Cómo cree usted que está la economía de México: está mejor que
antes, peor que antes o igual que antes?
1. Mejor que antes
2. Igual de bien que antes
3. Igual de mal que antes
4. Peor que antes
5. NS / NC (_____)
49. ¿Qué tan bien habla Usted inglés?
1. Perfecto (bilingüe)
2. Bien
3. Regular
4. Mal
5. Nada
6. NS / NC (_____)
50. ¿Que tan bien maneja Usted el Internet?
1. Perfecto
2. Bien
3. Regular
4. Mal
5. Nada
6. NS / NC (_____)
51. Si tuviera que escoger algo que ha cambiado profundamente a nuestro país en
los últimos años qué escogería: ¿el triunfo de Fox, el Tratado de Libre Comercio o el
Internet?
1. El triunfo de Fox
2. El tratado de Libre Comercio
3. El internet
4. NS / NC (_____)
52. ¿Comparados con productos internacionales de venta en México, qué tan buenos
diría Usted que son el día de hoy los productos mexicanos?
1. Muy buenos
2. Buenos
3. Regular
4. Malos
5. NS / NC (_____)
53. ¿Y con respecto al pasado (hace 20 años) Usted cree que los productos mexicanos
de hoy son mejores que los productos mexicanos que se vendían antes o antes eran
mejores?
1. Los productos mexicanos son mejores que los de antes
2. Los productos mexicanos son peores que los de antes
3. Los productos mexicanos eran iguales antes que ahora
295
4. NS / NC (_____)
54. ¿Recuerda cuál era la marca del automóvil familiar de hace 20 años?
1. No recuerda/No tenía
2. ________________________________________________
3. NS / NC (_____)
55. ¿Recuerda la marca del televisor familiar de hace 20 años?
1. No recuerda/No tenía
2. ________________________________________________
3. NS / NC (_____)
56. ¿Me podría decir la marca de su automóvil actual?
1. No tiene auto
2. ____________________________________
NS / NC (_____)
57. ¿Me podría decir la marca de su televisor actual?
1. No tiene televisor
2.____________________________________
NS / NC (_____)
58. ¿Con cual de estas frases está usted más de acuerdo?
1. La globalización económica es una gran oportunidad para el desarrollo económico
de la humanidad
2. La globalización económica es una nueva forma de imperialismo y colonialismo
3. NS / NC (_____)
59. ¿Cómo definiría su situación económica actual?
1. Baja 2. Media Baja
3. Media 4. Media Alta
5. Alta 6. NS / NC (___)
60. ¿Cómo definiría su situación económica hace 20 años?
1.Baja 2.Media Baja
3.Media 4. Media Alta
5. Alto 6. NS / NC (___)
HORA DE TERMINO DE LA ENTREVISTA ____ :________-
FIRMA DEL SUPERVISOR: __________________________
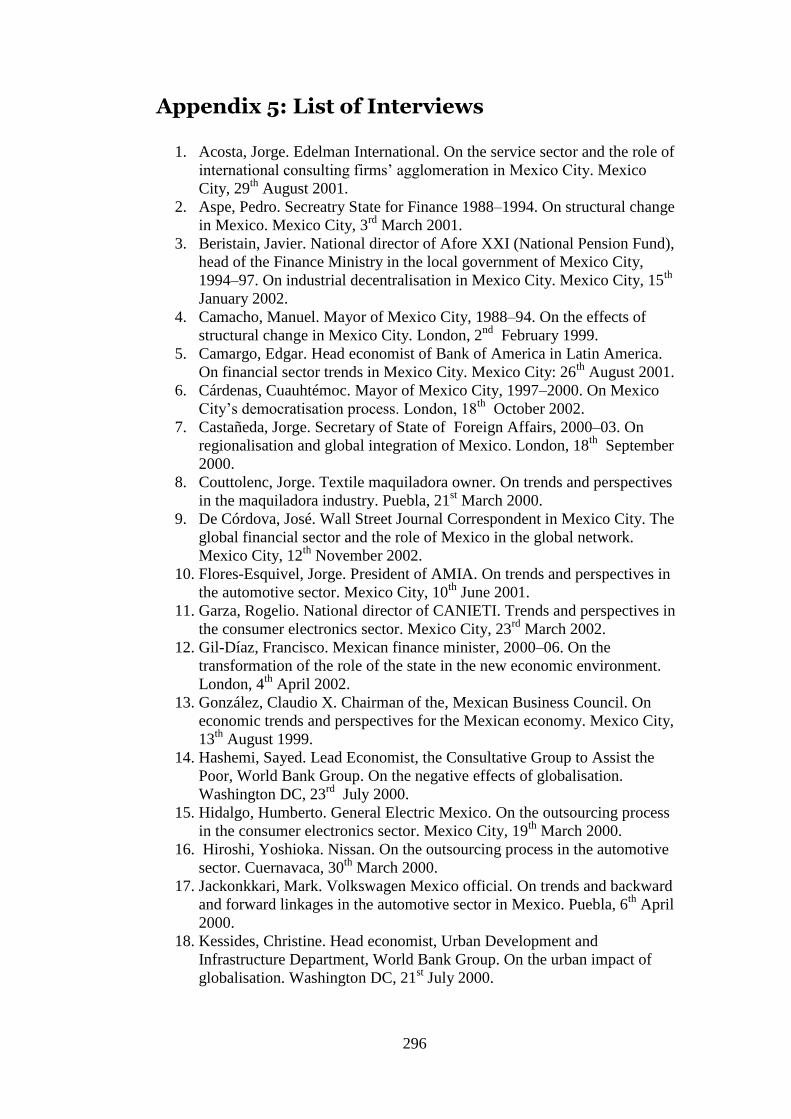
296
Appendix 5: List of Interviews
1. Acosta, Jorge. Edelman International. On the service sector and the role of
international consulting firms’ agglomeration in Mexico City. Mexico
City, 29th
August 2001.
2. Aspe, Pedro. Secreatry State for Finance 1988–1994. On structural change
in Mexico. Mexico City, 3rd
March 2001.
3. Beristain, Javier. National director of Afore XXI (National Pension Fund),
head of the Finance Ministry in the local government of Mexico City,
1994–97. On industrial decentralisation in Mexico City. Mexico City, 15th
January 2002.
4. Camacho, Manuel. Mayor of Mexico City, 1988–94. On the effects of
structural change in Mexico City. London, 2nd
February 1999.
5. Camargo, Edgar. Head economist of Bank of America in Latin America.
On financial sector trends in Mexico City. Mexico City: 26th
August 2001.
6. Cárdenas, Cuauhtémoc. Mayor of Mexico City, 1997–2000. On Mexico
City’s democratisation process. London, 18th
October 2002.
7. Castañeda, Jorge. Secretary of State of Foreign Affairs, 2000–03. On
regionalisation and global integration of Mexico. London, 18th
September
2000.
8. Couttolenc, Jorge. Textile maquiladora owner. On trends and perspectives
in the maquiladora industry. Puebla, 21st March 2000.
9. De Córdova, José. Wall Street Journal Correspondent in Mexico City. The
global financial sector and the role of Mexico in the global network.
Mexico City, 12th
November 2002.
10. Flores-Esquivel, Jorge. President of AMIA. On trends and perspectives in
the automotive sector. Mexico City, 10th
June 2001.
11. Garza, Rogelio. National director of CANIETI. Trends and perspectives in
the consumer electronics sector. Mexico City, 23rd
March 2002.
12. Gil-Díaz, Francisco. Mexican finance minister, 2000–06. On the
transformation of the role of the state in the new economic environment.
London, 4th
April 2002.
13. González, Claudio X. Chairman of the, Mexican Business Council. On
economic trends and perspectives for the Mexican economy. Mexico City,
13th
August 1999.
14. Hashemi, Sayed. Lead Economist, the Consultative Group to Assist the
Poor, World Bank Group. On the negative effects of globalisation.
Washington DC, 23rd
July 2000.
15. Hidalgo, Humberto. General Electric Mexico. On the outsourcing process
in the consumer electronics sector. Mexico City, 19th
March 2000.
16. Hiroshi, Yoshioka. Nissan. On the outsourcing process in the automotive
sector. Cuernavaca, 30th
March 2000.
17. Jackonkkari, Mark. Volkswagen Mexico official. On trends and backward
and forward linkages in the automotive sector in Mexico. Puebla, 6th
April
2000.
18. Kessides, Christine. Head economist, Urban Development and
Infrastructure Department, World Bank Group. On the urban impact of
globalisation. Washington DC, 21st July 2000.
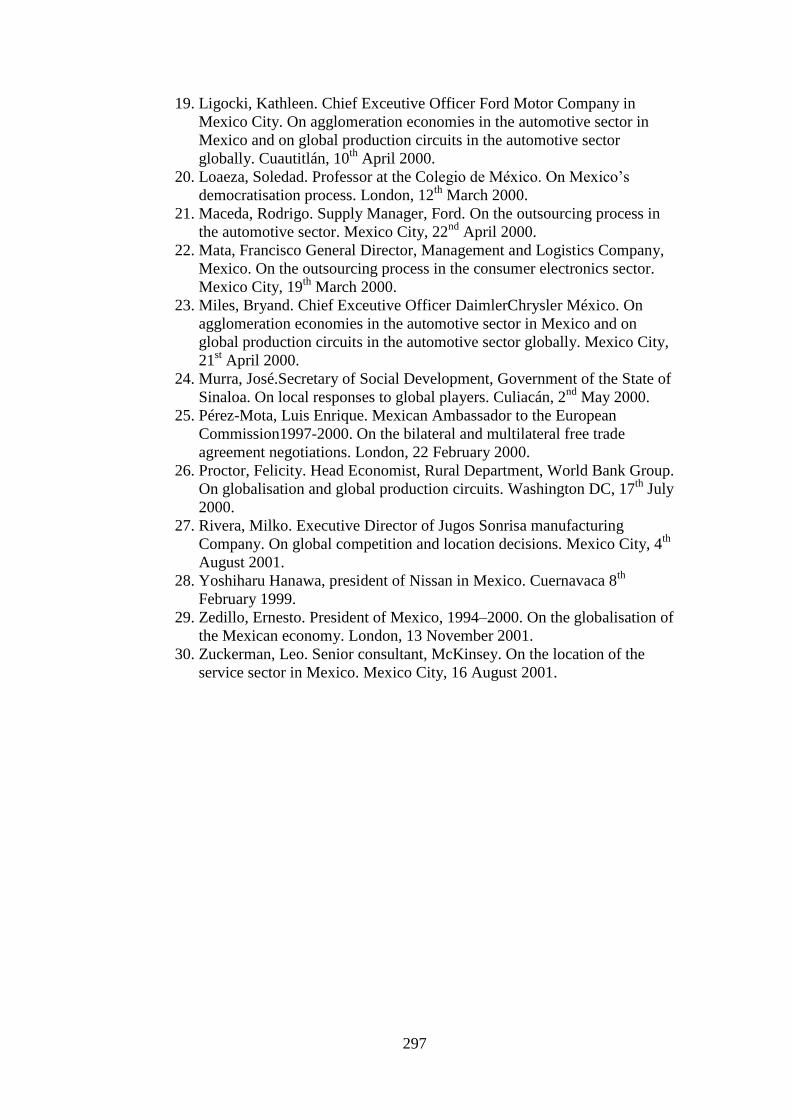
297
19. Ligocki, Kathleen. Chief Exceutive Officer Ford Motor Company in
Mexico City. On agglomeration economies in the automotive sector in
Mexico and on global production circuits in the automotive sector
globally. Cuautitlán, 10th
April 2000.
20. Loaeza, Soledad. Professor at the Colegio de México. On Mexico’s
democratisation process. London, 12th
March 2000.
21. Maceda, Rodrigo. Supply Manager, Ford. On the outsourcing process in
the automotive sector. Mexico City, 22nd
April 2000.
22. Mata, Francisco General Director, Management and Logistics Company,
Mexico. On the outsourcing process in the consumer electronics sector.
Mexico City, 19th
March 2000.
23. Miles, Bryand. Chief Exceutive Officer DaimlerChrysler México. On
agglomeration economies in the automotive sector in Mexico and on
global production circuits in the automotive sector globally. Mexico City,
21st April 2000.
24. Murra, José.Secretary of Social Development, Government of the State of
Sinaloa. On local responses to global players. Culiacán, 2nd
May 2000.
25. Pérez-Mota, Luis Enrique. Mexican Ambassador to the European
Commission1997-2000. On the bilateral and multilateral free trade
agreement negotiations. London, 22 February 2000.
26. Proctor, Felicity. Head Economist, Rural Department, World Bank Group.
On globalisation and global production circuits. Washington DC, 17th
July
2000.
27. Rivera, Milko. Executive Director of Jugos Sonrisa manufacturing
Company. On global competition and location decisions. Mexico City, 4th
August 2001.
28. Yoshiharu Hanawa, president of Nissan in Mexico. Cuernavaca 8th
February 1999.
29. Zedillo, Ernesto. President of Mexico, 1994–2000. On the globalisation of
the Mexican economy. London, 13 November 2001.
30. Zuckerman, Leo. Senior consultant, McKinsey. On the location of the
service sector in Mexico. Mexico City, 16 August 2001.
298
References
Abdel-Rahman H. and M. Fujita (1990). Product variety, Marshallian externalities and city sizes. Journal of Regional Science, 30, pp. 165-183. Aghion, P. and P. Howitt (eds.) (1998). Endogenous Growth Theory. London: McGraw Hill. Aguilar, A. G. (1993). La ciudad de México y las nuevas dimensiones de la reestructuración metropolitan. in L. F. Cabrales, (ed.), Espacio urbano, cambio social y geografía aplicada. Guadalajara: Universidad de Guadalajara. Aguilar, A. G. (1997). The urban labour market in Mexico: global change, informality and social polarization. Urban Geography, 18, 2, pp.106-134. Aguilar, A. G. (1998). Maquiladora myths: location and structural change in Mexico’s export manufacturing industry. Professional Geographer, 50, 3, pp. 315-330. Aguilar, A. G. (1999). Ciudad de México growth and regional dispersal: the expansion of largest cities and new spatial forms. Habitat International, 23, 3, pp. 391-412. Aguilar, A. G. and G. Olvera (1991). El control de la expasión urbana en la ciudad de México: conjeturas de un falso planteamiento. Estudios Demográficos y Urbanos,1, 6, pp.89-115. Aguilar-Barajas, I. (1993). Descentralización industrial y desarrollo regional en México. Ciudad de México: El Colegio de México. Allen J. (1999). Cities of Power and Influence, Settled Formations. In Allen, J., D. Massey, and M. Pryke (eds.). Unsettling Cities. New York: Routledge. AMIA (1990-2000). Boletines. Reporte anual del estado de la industria automotriz en México. Ciudad de México: Asociación Mexicana de la Industria Automotriz. Amin, A. and N. Thrift (1992). Neo-Marshallian nodes in global networks. International Journal of Urban and Regional Research, 16, 4, pp.571-587. Aspe, P. (1993). Economic Transformation: The Mexican Way. Cambridge, MA: MIT Press. Arrow Electronics (2001). Company report. Electronic resource: http://www.arrow.com/about_arrow/innovations.html.
299
Automotive Quarterly Review. Electronic resource: http://www.prlog.org/10001978-automotive-quarterly-review.html. Automotive Times (2002), Business briefing/Automotive 27 March 2002. Times Publishing. Bailey, P. (2005). “Automotive industry trends affecting component suppliers: report for discussion at the Tripartite Meeting on Employment, Social Dialogue, Rights at Work and Industrial Relations in Transport Equipment Manufacturing, Geneva 2005”. International Labour Organization Sectoral Activities Programme. Geneva: International Labour Office. BANAMEX (2000). Automotive industry: Review of Economic Situation. Ciudad de México: Banco Nacional de México. BANCOMEXT (2000). Atlas de Comercio Exterior. Ciudad de México: BANCOMEXT. Banerji, K. and R. B. Sambharya (1998). Effect of network organization on alliance formation: A study of the Japanese automobile ancillary industry. Journal of International Management, 4, 1, pp. 41-57. BANXICO (2000). Evolución de la economía: Panorama general en el Informe Anual. Ciudad de México: Banco Nacional de México. Baum, S. (1999). Social transformation in the Global City: Singapore. Urban Studies, 36, pp. 1095-1117. Beaverstock, J. and P. J. Taylor (1999). A roster of world cities. Cities, 16, 6, pp. 445-472. Beaverstock, J. and P. J. Taylor (2000). A world-city network. Annals of Association of American Geographers, 90, 1, pp.123-134. Beccatini, G. (1992). El distrito industrial Marshalliano como concepto económico. Los distritos industriales y las pequeñas empresas I, 61-79.
Bell (2000). Bell Labs Technical Journal. Ann Arbor, MI: Lucent & Bell.
Bennett, D. and K. Sharpe (1979). Transnational corporations and the political economy of export promotion: the case of the Mexican automobile industry. The International Organization Foundation, 33, pp 177-201. Bennett, D. and K. Sharpe (1985). Transnational corporations versus the state: The political economy of the Mexican auto industry. Princeton, NJ: Princeton University Press. Berger, S. and R. Dore (1996). National Diversity and Global capitalism. London: Routledge.
300
Berruecos, S. (2003a). El nuevo papel del Poder Judicial en México: la Corte Suprema bajo un nuevo federalismo. In Londoño Toro, B. (ed.) Estado de crisis o crisis del Estado. Bogotá: Colección Textos de Jurisprudencia, Centro Editorial Universidad del Rosario. Berruecos, S. (2003b). Electoral justice in Mexico: The role of the Electoral Tribunal under new federalism. Journal of Latin American Studies, 35, 4, pp. 801-827. BIE (2005). Banco de Información Económica, INEGI. Electronic resource: http://www.inegi.org.mx/inegi/contenidos/servicios web/. Bird, G. R. and T. Killick (1995). The Bretton Woods institutions: a Commonwealth perspective. London: Commonwealth Secretariat. Blaikie, N. (1988). Designing social research. London: Polity Press. BMV (2002). Historia de las entidades emisoras de la Bolsa Mexicana de Valores. Ciudad de México: Bolsa Mexicana de Valores. Boddy, M. (1999). Geographical Economics and Urban Competitiveness: A Critique. Urban Studies, 36, 5, pp.811-842. Borja, J. and M. Castells (1997). Local and Global: Management of Cities in the Information Age. London: Earthscan. Botchie, J., M. Batty, E. Blakely, P. Hall and P. Newton (eds.) (1995). Cities in competition: productive and sustainable cities for the 21st century. Melbourne: Longman. Brambila Paz, C. and H. Salazar (1984). Perspectivas de la concentración urbana en México 1950-2000. Estudios Demográficos, 4, 14, pp.12-40. Browder, J.O. and B.J. Godfrey (1999). Competition, Collaboration and the New Industrial Districts: Examining the Institutional Turn in Local Economic Development. Urban Studies, 36, pp. 951-968. Browne, J., D. Dubois, K. Rathmill, S.P. Sethi and E. Stecke (1984). Classification of Flexible Manufacturing Systems. FMS Magazine, 52, (April), pp. 114-117. Burki, S. J. S. and S. Edwards (1996). Latin America after Mexico: Quickening the Pace. World Bank Latin American and Caribbean Studies Viewpoints. Washington DC: World Bank. Burtless, G. T., R. Z. Lawrence, R.E. Litan and R.J. Shapiro (1998). Globaphobia: confronting fears about open trade. Washington DC, Brookings Institution; Progressive Policy Institute; Twentieth Century Fund.
301
Business Week (1970). Mexico: Latins turn North to one of their own, 21, p. 49. Bustamante Lemus, C. (1983). Urban Concentration and Policies for Decentralization in Mexico 1976-1982. Ciudad de México: Instituto de Investigaciones Jurídicas. Buzan, B. and R. Little (2000). International systems in world history: remaking the study of international relations. Oxford: Oxford University Press. Buzan, B., O. Weaver and J. de Wilde (1998). Security: A New Framework for Analysis. Boulder, CO: Lynne Reinner. Cabrero Mendoza, E. (1998). Las políticas decentralizadoras en México (1983-1993). Ciudad de México: Porrúa. Cahners, X. (2001). Electronics Report. Monthly Industry Trends and Highlights. New York: In-Stat Research Group. Calavita, K. (1992). Inside the State. The bracero program, immigration, and the I.N.S. New York: Routledge. Calva, J. L. (1995). Desarrollo regional y urbano: tendencias y alternativas. Guadalajara: Centro Universitario de Ciencias Sociales y Humanidades Universidad de Guadalajara; Instituto de Geografía UNAM, Juan Pablo Editor. Camarena, M. (1981). Las Grandes Rutas del Espacio Social en México. Ciudad de México: Instituto de Investigaciones Jurídicas UNAM. CANIECE (1981). Reporte Anual de la Industrial de la Electrónica y de la Comunicaciones Electricas: Ciudad de México: CANIECE. CANACINTRA (2000). Perspectivas económicas de la industria de la transformación mexicana. Ciudad de México: Canacintra. Carrillo, J. and A. Hualde (1997). Maquiladoras de tercera generación: el caso de Delphi-General Motors. Comercio Exterior, 47, 9, pp.747-757. Castells, M. (1996). The Network Society. London: Blackwell. Christopherson, S. and R. Hovey (1996). Fast money: financial exclusion in the Mexican economic adjustment model. Environmental Planning A, 28, pp. 1157-1177. Cohen, S. S. and J. Zysman (1987). Manufacturing matters: the myth of the post-industrial economy. New York: Basic Books. CONAPO (2000). Situación Demográfica en México. Ciudad de México: Consejo Nacional de Población. Secretaría de Gobernación.
302
CONAPO (2002). Delimitación de las zonas metropolitanas de México. Ciudad de México: Consejo Nacional de Población, Secretaría de Gobernación. Coulomb, R. and M. Schteingart (2006). Entre el Estado y el Mercado: La Vivienda en el México de Hoy. Ciudad de México: UAM. Cooke, T. E. (1988). International mergers and acquisitions. Oxford: Blackwell. Cox, K. (1993). The local and the global in the new urban politics. Society and Space, 11, pp. 433-448. Cox, K. (ed.) (1997). Spaces of Globalization: Reasserting the Power of the Local. Guildford: Guildford Press. Craig, R. B. (1971). The bracero program: interest groups and foreign policy. Austin, TX: University of Texas Press. Crook, C. (1990). Easter European Transitions. London: Social Market Foundation. Daimler Chrysler Annual Financial Reports Various years: Electronic resource:http://www.cms.daimler.com/Projects/c2c/channel/documents/1514516_DAI_Annual_Financial_Report_2000_E.pdf Davenport H.J. (1935). The Economics of Alfred Marshall. Ithaca: Cornell University Press. Darin, D. (1996). The Network Society. Cambridge: Polity Press. Datamonitor (2003). Electronic Equipment & Instruments Industry Profile: Global Market Overview. Datamonitor, (May), pp. 6-18. Datton, D. (1991). Foreign direct investment in the US automotive industry and foreign direct investment in the US. Washington DC: US Department of Commerce. Davis, D.E. (1994). Urban Leviathan: Mexico City in the twentieth century. Philadelphia, PA: Temple University Press. DDF (1996). Definición del Área Metropolitana de la Ciudad del Valle de México. Ciudad de México: Departamento del Distrito Federal. De Groote, X. (1994). The Flexibility of Production Process: A General Framework. Management Science, 40, 7, pp. 933-945. De Maria y Campos, M. (2002). Hacia una comunidad norteamericana: una relación estratégica de México con Canadá. Revista Mexicana de Política Exterior, 66, 4, pp. 101-123.
303
Delbridge, R. (1998). Life on the line in contemporary manufacturing: the workplace experience of lean production and the Japanese model. New York: Oxford University Press. Delgado, J. (1988). El Patrón de la ocupación territorial de la Ciudad de México al año 2000. In E. Preciat (ed.) Estructura territorial de la ciudad de México. Desafíos de la gran metrópoli. Ciudad de México: Plaza y Valdés. Delgado, J. (1991). Reinventar la Ciudad y su Región. Revista Mexicana de Ciencias Políticas y Sociales, XXXVI, 145, pp. 113-145. DeWitt, B. and R. Meyer (1998). Strategy: Process, Content, Context. London: International Thompson Business Press. Dicken, P. (1992). The Global Shift. London: Paul Chapman Publishing. Dietz, J. (1985). From Prebisch to Technological Autonomy. In J. Dietz (ed.) Progress towards development in Latin America: From Prebisch to Technological Autonomy. Boulder, CO: Lynne Rienner. Dimsky, G. (1996). On Krugman’s model of economic geography. Geoforum, 27, pp. 439-452. Dixit, A.K. and J.E. Stiglitz (1977). Monopolistic competition and optimum product diversity. American Economic Review,67, pp. 297-308. Dobell, R and M. Neufeld (1993). Beyond NAFTA: the Western Hemisphere interface Lantzville. Washington DC: Oolichan Books. Dresser, D. (1993). Democracy, Markets, and the Mexican Crisis. Constructing Democracy and Markets: East Asia and Latin America. International Forum for Democratic Studies and Pacific Proceedings. Montreal: Council on International Policy. Drucker, P. (1989). The New Realities in Government and Politics, in Economy and Business, in Society and Worldview. Oxford: Heinemann Professional. Dunning, J.H. (1992). The Global Economy, Domestic Governance, Strategies of Transnational Corporations: Interactions and Implications. Transnational Corporations, 1, 3 pp 7-46. Dussel Peters, E. (1996). Dinámica regional y competitividad industrial. Ciudad de México: UNAM, Fundación Friedrich Ebert & Editorial Jus. Edwards, S. (ed.) (1995a). Reform, Recovery and Growth: Latin America and the Middle East. Chicago, IL: University of Chicago Press.
304
Edwards, S. (ed.) (1995b). Capital Controls, exchange rates and money policy in the world economy. Cambridge: Cambridge University Press. Electronic Market Data Book. Electronic Industries Association. Marketing service department. Various issues. Electronics Times (1999). Moving in on MEXICO. Electronics Times, 22, pp. 1268, 1289. Electronics Times (Various Years). Electronic resource: http://www.husonmedia.com/index.php/media-search/print-item/453-the-electronic-times Emmerij, L. (1992). Globalization, regionalization and world trade. Columbia Journal of World Business, 2, 6, pp. 75-90. Erie, S. P. (2004). Globalizing Latin America: trade, infrastructure, and regional development. Palo Alto, CA: Stanford University Press. Ettlie, J. E. and H. Stoll (1990). Managing the design-manufacturing process. New York: McGraw Hill. Expansión, Revista. Various years. Editorial Grupo Expansión 1966-2007. Since 2005 Time Warner, publishing division, Time Inc. and since 2007 Time Warner- CNN. European Electronic Market Forecast (2000). Annual Report. London: Reed Electronics Research. Fainstein, S. (2001). Inequality in Global City-Regions. In A. J. Scott (ed.) Global city-regions: trends, theory and practice. Oxford: Oxford University Press. Federiksen, P. C. and R. E. Looney (1982). Defense Expenditures and Economic Growth in Development Countries: Some Further Empirical Evidence. Journal of Economics Development, 7(1), 113-125. Feenstra, R. (1998). Integration of Trade and Disintegration of Production in the Global Economy. Journal of Economic Perspectives, 12, 4, pp. 31-50. Fernández Kelly, M. P. (1989). International development and industrial restructuring: the case of garment and electronics industries in Southern California. In W. Tabb (ed.) Instability and Change in the World Economy. New York: Monthly Review Press. Ford Motor Company annual reports, various years. Electronic resource: http://corporate.ford.com/our-company/investors/reports-financial-information/annual-reports?releaseId=1244753689627.
305
Fraser, D. and M. Dickinson (1992). Report on the motor industry’s enthusiasm for the free trade pact. London: Financial Times. Friedmann, J. (1986). The world city hypothesis. Development and Change, 17, 1, pp. 69-83. Friedmann, J. and G. Wolff (1982). World City Formation: an agenda for research. International Journal of Urban and Regional Research, 6, pp. 309-344. Fröber, F., J. Heinrichs, and O. Kreye (eds.) (1980). The new international division of labour: structural unemployment in industrialised countries and industrialisation in developing countries. Cambridge: Cambridge University Press. Fu Chen, L. and Y. Yue Man (1998). Globalization and the World of Large Cities. Tokyo: United Nations University. Fujita, M. (1988). A monopolistic competition model of spatial agglomeration: A differentiated product approach. Regional Science and Urban Economics, 18, pp. 87-124. Fujita, M., P. Krugman and T. Mori (1999). On the evolution of hierarchical urban systems. European Economic Review, 43(2), pp. 209-251. Fujita, M. and J. Thisse (2002). Economics of agglomeration: Cities, industrial location, and regional growth. Cambridge, MA: Cambridge University Press. Fujita M., Krugman, P. and A. J. Venables. (2001). The spatial economy: cities, regions and international trade. Cambridge, MA: MIT Press. Gamboa de Buen, J. (1994). Ciudad de México, una visión. Ciudad de México: Fondo de Cultura Económica. Garza, G. (1980). Industrialización de las principales ciudades en México. Ciudad de México: El Colegio de México. Garza, G. (1986). Ciudad de México: dinámica industrial y perspectivas de dentralización después del terremoto. In B. Torres (ed). Decentralización y democracia en México. Ciudad de México: El Colegio de México. Geddes, P. (1915). Cities in evolution. London: Williams & Norgate. Giddens, A. (1990). The Consequences of Modernity. Cambridge: Polity Press in association with Blackwell. Gilbert, A. (1997). Poverty and social policy in Latin America. Social Policy and Administration, 31, 4, pp. 320-335.
306
Glyn, A. and B. Sutcliffe (1992). Global but leaderless? The new capitalist order. In L. Panich (ed.) New World Order: The Socialist Register. London: Merlin Press. GM 2000. General Motors: Electronic resource http://www.gm.com.mx/corporativo/gm_mexico/presencia_gm_mexico.php Goldsmith, E. and J. Mander (eds.) (2001). The case against the global economy. London: Earthscan. Gordon, I. R. (1988). Evaluating the Effects of Employment Changes on Local Unemployment. Regional Studies, 22, 2, pp. 135-147. Graham, L. (1990). El estado en retirada en el campo económico, in M. Vellinga (ed.) El Cambio en el papel del Estado en América Latina. Ciudad de México: Siglo XXI. Gray, J. (1998). False Dawn: The delusions of global capitalism. London: Granta. Gray, N. (1992). Mexico moves to remedy deficient infrastructure. Business Latin America, 27, pp.74-91. Gregory, G. (1985). Japanese electronics technology: Enterprise and innovation. Essex: The Japan Times Ltd. Guile, B. and H. Brools, (eds.) (1987). Technology and global industry: companies and donations in the world economy. Washington DC: National Academy Press. Gupta, Y. and S. Goyal (1989). Flexibility of manufacturing systems: Concepts and measurement. European Journal of Operational Research, 43, pp. 119-135. Hall, P. (1977). The World Cities. London: Weidenfeld and Nicolson. Hamnett, C. (2002). The potential and prospect of global cities in China. Geoforum, 33, 1, pp. 121-135. Hanson, G. (1996a). Localization Economies, Vertical Organization and Trade. American Economic Review,86, 5, pp.1266-1278.
Hanson, G. (1996b). Economic Integration, intra-industry Trade, and Frontier Regions. European Economic Review, 40, pp. 941-949. Hanson, G. (2005). Market Potential, Increasing Returns And Geographic Concentration. Journal of International Economics, 67, pp. 1-24.
307
Hanson, G. and A. Harrison (1999). Trade Liberalization and Wage Inequality in Mexico. Industrial and Labor Relations Review, 52, 2, pp. 271-288. Harvey, D. (1982). The Limits of Capital. Oxford: Blackwell. Harvey, D. (1990). The Condition of Post-modernity. Oxford: Blackwell. Harvey, C., M. Maclean and T. Hayward (2001). From knowledge dependence to knowledge creation: Industrial growth and the technological advance of the Japanese electronics industry. Journal of Industrial History, 4, 2, pp. 1-23. Hay, C. and D. Marsh (1999). Demystifying globalization. New York: St. Martin’s Press. Held, D. (1999). Global Transformations: politics, economics and culture. Cambridge: Polity Press. Held, D., A. McGrew, D. Goldblatt, and J. Perraton (1999). Global Transformations. Cambridge: Polity Press. Hendry, M. M. (1972). One can do a lot of remembering in South Bend. Automobile Quarterly, 2, 3, pp. 228-275. Hirst, P. and J. Thompson (1999). Globalization in question: the international economy and the possibilities of governance. Cambridge: Polity Press. Hirst, P. and J. Zeitlin, (eds.) (1989). Reversing industrial decline? Industrial structure and policy in Britain and her competitors. New York: Martin Press. Hobday, M. (1999). Innovation in East Asia: Diversity and development. Technovation, 15, 2, pp. 55-63. Holmes, T. (1999). Localization of Industry and Vertical Disintegration. Review of Economics and Statistics, 81, 2, pp. 314-325. Hufbauer, G. and J. Schott (1993). Western hemisphere economic integration. Washingnton DC: Institute for International Economics. Humphrey J. and H. Schmitz (2002). How does insertion in global value chains affect upgrading in industrial clusters? Regional Studies, 36, 9, pp. 1017-1027. ILO (2000). World Labour Report. Geneva: International Labour Organisation. IMF (2000). The balance of payments statistics yearbook. Washington DC: The International Monetary Fund.
308
INEGI (1940). VI Censo general de población y vivienda. Ciudad de México: Instituto Nacional de Estadística Geografía e Informática. INEGI (1950). VII Censo general de población y vivienda. Ciudad de México: Instituto Nacional de Estadística Geografía e Informática. INEGI (1960). VIII Censo general de población y vivienda. Ciudad de México: Instituto Nacional de Estadística Geografía e Informática. INEGI (1970). IX Censo general de población y vivienda. Ciudad de México: Instituto Nacional de Estadística Geografía e Informática. INEGI (1980). X Censo general de población y vivienda. Ciudad de México: Instituto Nacional de Estadística Geografía e Informática. INEGI (1981). Censos Económicos. Ciudad de México: Instituto Nacional de Estadística Geografía e Informática. INEGI (1983). Encuesta Nacional de Ingresos y Gastos de los Hogares. Ciudad de México: Instituto Nacional de Estadística Geografía e Informática. INEGI (1986). Censos Económicos. Ciudad de México: Instituto Nacional de Estadística Geografía e Informática. INEGI (1989a). Censos Económicos. Ciudad de México: Instituto Nacional de Estadística Geografía e Informática. INEGI (1989b). Encuesta Nacional de Ingresos y Gastos de los Hogares. Ciudad de México: Instituto Nacional de Estadística Geografía e Informática. INEGI (1990). XI Censo general de población y vivienda. Ciudad de México: Censos Económico. Ciudad de México: Instituto Nacional de Estadística Geografía e Informática. INEGI (1992). Encuesta Nacional de Ingresos y Gastos de los Hogares. Ciudad de México: Instituto Nacional de Estadística Geografía e Informática. INEGI (1994). Censos Económicos. Ciudad de México: Instituto Nacional de Estadística Geografía e Informática. INEGI (1995). Agenda Estadística de los Estados Unidos Mexicanos. Ciudad de México: Instituto Nacional de Estadística Geografía e Informática. INEGI (1999). Censos Económicos. Ciudad de México: Instituto Nacional de Estadística Geografía e Informática.
309
INEGI (1998). Encuesta Nacional de Ingresos y Gastos de los Hogares. Ciudad de México: Instituto Nacional de Estadística Geografía e Informática. INEGI (2000). XII Censo general de población y vivienda. Ciudad de México: Instituto Nacional de Estadística Geografía e Informática. INEGI (2009). Censos Económicos. Ciudad de México: Censos Económico. Ciudad de México: Instituto Nacional de Estadística Geografía e Informática. Iracheta, A. (1988). Hacia una Política de Planeación Urbana Crítica. Toluca: Universidad Autónoma del Estado de México. Iracheta, A. (2000). Las grandes ciudades en el contexto de la globalización: el caso de la zona metropolitana del Valle de México. Toluca: Universidad Autónoma del Estado de México. Johns, M. (1997). The City of Mexico in the age of Díaz. Austin, TX: University of Texas Press. Johnson, H. (1991). Dispelling the myth of globalization - the case for regionalization. New York: Praeger. Karig, T. (1999). Retos y perspectivas de la presencia de Volkswagen en la industria automotriz Mexicana. Puebla: Volkswagen. Kazis, D. A. (1988). Post-war industrial policy and the electronics industry in Japan. Athens: Centre of Planning and Economic Research. Keisai Koho Centre (2000). Electronic sector report. Tokyo: Keisai Koho Centre. Kim, L. and R. R. Nelson (2000). Technology, learning and innovation: experiences of newly industrializing economies. Cambridge: Cambridge University Press. Knox, P. and J. Agnew (1994). The geography of the world economy: An introduction to economic geography. London and New York: Edward Arnold. Knox, P. and P. J. Taylor, (eds.) (1995). World Cities in a World System. Cambridge: Cambridge University Press. Koechlin, T. (1995). The globalization of investment. Contemporary Economic Policy, 13, 1, pp. 92-100. Kothari, R. (1995). Poverty: human consciousness and the amnesia of development. London: Zed Books.
310
Krugman, P. (1991a). Increasing returns and economic geography. Journal of Political Economy, 99, 3, pp. 483-499. Krugman, P. (1991b). Geography and Trade. Cambridge, MA: MIT Press. Krugman, P. (1991c). Increasing returns and economic geography. Journal of Political Economy, 99, pp. 483-499. Krugman, P. (1993a). On the number and location of cities. European Economic Review, 37, pp. 293-298. Krugman, P. (1993b). First nature, second nature and metropolitan location. Journal of Regional Science, 33, pp. 129-144. Krugman, P. (1995). Development, Geography and Economic Theory. Cambridge, MA: MIT Press. Krugman, P. (1997). Pop Internationalism. Cambridge, MA: MIT Press. Krugman, P. (1998a). Space: the national frontier. Journal of Economic Perspectives, 12, pp. 161-174. Krugman, P. (1998b). What’s new about the new economic geography? Oxford Review of Economic Policy, 14, 2, pp. 7-17. Krugman, P. and R. Livas (1996). Trade Policy and the Third World Metropolis. Journal of Development Economics, 49, pp. 137-150. Lazerson, M. (1988). Organizational growth of small firms: an outcome of markets and hierarchies. American Sociological Review, 53, 3, pp.330-342. Legorreta, J. (1983). El proceso de urbanización de las ciudades petroleras en México. Ciudad de México: Centro de Ecodesarrollo. Ligocki, K. (2001). Interview in Expansión, Año XXXI, (Junio), pp. 223-224. Lipietz, A. (1993). The local and the global: regional individuality or interegionalism? Transactions Institute of British Geographers, 18, pp. 8-18. Lipietz, A. and D. Massey (1987). Mirages and Miracles: The Crises of Global Fordism. London: Verso. Loaeza, S. (2000). Uncertainty in Mexico’s protracted transition: the national action party and its aversion to risk. Democratization, 7, 3, pp. 93-116. Looney, R. and P. Frederiksen (1981). The regional impact of infrastructure investment in Mexico. Regional Studies, 15, 4, pp. 285-296.
311
Luard, E. (1990). The globalization of politics: the changed focus of political action in the modern. London: Macmillan. Lucent, X. (2001). Bell History. Murray Hill, NJ: Bell Electronics. Lujambio, A. (2000). El poder compartido: un ensayo sobre la democratización mexicana. Ciudad de México: Editorial Océano. Lustig, N. (1998). Mexico: The remaking of an economy. Washington DC: The Brookings Institution. Macario, C. (2000). The behavior of manufacturing firms under the new economic model. World Development, 28, 9, pp. 1597-1610. McLuhan, M. and B. Powers (1989). The global village: transformations in world lifeand media in the 21st century. Oxford: Oxford University Press. Mann, M. (1986). The Sources of Social Power. Cambridge: Cambridge University Press. Mann, M. (1997). Has globalization ended the rise and rise of the nation-state? Review of International Political Economy, 4, pp. 472-512. Mansfield, E. (1993). The diffusion of flexible manufacturing systems in Japan, Europe and the United States. Management Science, 39, 2, pp. 149-159. Marcussen, A. (1999). Fuzzy concepts, scanty evidence, policy distance: the case for rigour and policy relevance in critical regional studies. Regional Studies, 33, pp. 869-884. Marshall, A. (1994) Principles of economics: an introductory volume. Basingstoke: Macmillan. [Orig. Published 1920] Martin, P. J. and C.A. Rogers (1994a). Industrial location and public infrastructure. CEPR Discussion paper 909. London: Centre for Economic Policy Research. Martin, P. J. and C.A. Rogers (1994b). Trade effects of regional aid. CEPR Discussion paper 910. London: Centre for Economic Policy Research. Martin, R. and P. Sunley. (1996). Paul Krugman's Geographical Economics and Its Implications for Regional Development Theory: A Critical Assessment. Economic Geography, 72, 3, pp. 259-292. Massey, D. (1983). Industrial restructuring and class restructuring: production decentralisation and local uniqueness. Regional Studies, 17, 2, pp. 73-89.
312
Massey, D. (1995). Spatial Division of Labour. London: Macmillan. Massey, D., P. Quintas, and D. Wield (1992). High-tech fantasies: science parks in society, science, and space. London: Routledge. Mathieson D.J. and G. Schinasi (2001). International capital markets: developments, prospects and key policy issues. Washington DC: International Monetary Fund. Matsushita (Various years). Annual Reports. Electronic resource: http://panasonic.net/ir/annual/2012/pdf/panasonic_ar2012_e.pdf Maxwell, F. (1999). Payment system in global perspective. New York: Routledge. McKinsey Global Institute (1993). Latin American productivity report. Washington DC: McKinsey Global Institute. McLuhan, M. and B. Powers (1989). The Global Village: transformations in world life and media in the XX century. New York: Oxford University Press.
Mexican-American Review (1974). Maquiladoras: The road ahead, Mexican-American Review, November, pp. 4-7.
Milanovic, B. (2005). Global Income Inequality. World Economics, 7, 1, pp 130-155 Mizrahi, Y. (1994). Pressuring the Center: Opposition Governments and Federalism in Mexico. Ciudad de México: Division de Estudios Políticos, Centro de Investigación y Docencia Económicas. Molinar Horcasitas, J. (1993). El tiempo de la legitimidad. Elecciones, autoritarismo y democracia en México. Ciudad de México: Cal y Arena. Monden, Y. (1995). Toyota Production System: An Integrated Approach to Just-In-Time. Andover: Taylor & Francis. Moody, K. (1995). NAFTA and the Corporate Redesign of North America. Latin American Perspectives, 22, 1, pp. 123-148. Morris, D. (2001). Free Trade: The Great Destroyer. In Goldsmith, E. and J. Mander (ed.) The case against the global economy. London: Earthscan. Mortimore, M. (1995). Transforming sitting ducks into flying geese: the Mexican automobile industry. Desarrollo Productivo, 26, pp. 112-139. Mortimore, M. (1999). Corporate Strategies and Regional Integration Schemes Involving Developing Countries: The NAFTA and MERCOSUR Automobile industries. Journal of Science Technology and Development, 16, 2, pp 24-46.
313
Mortimore, M. (2000). Corporative strategies for FDI in the context of Latin America’s new economic model. World Development, 28, 9, pp. 1611-1626. Motorola (2000). Corporate Profile. Illinois: Motorola. Mytelka, L. K. (1990). Strategic partnerships and the world economy: states, firms and international competition. London: Pinter. Nierop, T. (1994). Systems and Regions in Global Politics: An empirical study of Diplomacy, International Organization and 1950-1991 Trade. Chichester: John Wiley. Nuñez, W. (1990). Foreign direct investment and industrial development in Mexico. Paris: Development Centre of the OECD . OECD (1992). Globalisation of industrial activities: four case studies. Paris: OECD. OECD (1994a). Globalisation of industrial activities: a case study of the consumer electronics sector. From knowledge dependence to knowledge creation: Industrial growth and the technological advance of the Japanese electronics industry. Paris: OECD. OECD (1994b). The performance of Foreign Affiliates in OECD Countries. Paris: OECD. OECD (1996a). Globalisation of Industry: Overview and Sector Reports. Paris: OECD. OECD (1996b). Trade, Employment and Labour Standards: A Study of Core Workers’ Rights and International Trade. Paris: OECD. OECD (2001a). New patterns of industrial globalisation : cross-border mergers and acquisitions and strategic alliances. Paris: OECD. OECD (2001b). Indicators of Industrial Activity. Paris: OECD. OECD (2002) STAN Industry STructural ANalysis Database Directorate for Science, Technology and Industry. Paris: OECD. OECD Economies (1999) Measuring Globalisation: The Role of Multinationals in OECD Economies. Paris: OECD. Ohmae, K. (1994). The Borderless World. London: Harper Collins. Ohmae, K. (1995a). The End of the Nation State: the rise of regional economies. London: Harper Collins.
314
Ohmae, K. (1995b). The Evolving Global Economy: making sense of the new world order. Cambridge, MA: Harvard Business Review Book. Ortiz Mena, A. (1980). The World Energy Problem, a responsibility for all. Washington DC: Inter-American Development Bank. Organisation Internationale des Constructeurs d’Áutomobiles. Electronic resource : www.oica.net. Ostry, S. (1990). Government and corporations in a shrinking world: trade and innovation policies in the United States, Europe and Japan. New York: Council on Foreign Relations. Palacios, J. J. (1986). The State and Regional Distribution: The contradictions of the Mexican Economy, 1976-1982. PhD Thesis, Cornell University. Palacios, J. J. (1988). Las inconsistencias de la política regional en México, 1970-1982: el caso de la asignación de la inversión pública federal. Estudios Demográficos y Urbanos, 3(1), 7-37. Panuco Laguette, H. (1999). Economic Policy and the distribution of Income 1984-1992. PhD Thesis, University of London. Parnreitier, C. (2001). Ciudad de Mexico: the making of a global city? In S. Sassen (ed.) Global networks/city links. New York and London: Routledge. Piore, M. J. and C. F. Sabel (1984). The Second Industrial Divide: possibilities for prosperity. New York: Basic Books. Porter, M. E. (1990). The competitive advantage of nations. Basingstoke, Macmillan. Power, A. (2000). Social exclusion and the future of cities. CASE Working Paper 35. Centre for Analysis of Social Exclusion, LSE. Pradilla, E. and C. Castro (1989). Crisis y restructuración económica y territorial. Ciudades, Red Nacional de Investigación Urbana, 1, 1, pp. 23-56. Pryke M., and R. Lee (1995). Place Your Bets: Towards an Understanding of Globalisation, Socio-financial Engineering and Competition within a Financial Centre. Urban Studies, 32, pp. 329-344. Ramos Boyoli, L. M. (1976). La desigualdad en la distribución del ingreso de las entidades federativas en México: Alguna evidencia empírica. Dualismo, 5, pp. 113-130.
315
Ramos Boyoli, L. M. and C. Richter (1976). El desarrollo regional mexicano, el papel de la inversión pública federal. Comercio Exterior, 26, pp.2-16. Raco, M. (1988). Flexible production systems and regional development: the rise of new industrial spaces in North America and western Europe. International Journal of Urban and Regional Research, 12, 2, pp. 171-186. Reed Business Information (1998). European Electronics Markets Forecast. London: Reed International. Reich, R. B. (1991). The Work of Nations: preparing ourselves for 21st-century capitalism. London: Simon & Schuster. Retallack, S. (2001). The environmental cost of economic globalisation. In Goldsmith, E. and J. Mander (ed.) The case against the global economy. London: Earthscan. Rifkin, J. (2001). The age of access: the new culture of hypercapitalism where all of life is a paid-for experience. International Studies Review, 3, 1, pp. 149-152. Rodríguez y Rodríguez, J. (1982). Administración Pública y Derecho Administrativo. Edición Especial en Memoria de Gabino Fraga. Ciudad de México: INAP-RAP. Rodríguez, V. E. (1997). Decentralization in Mexico: from reforma municipal to Solidaridad to nuevo federalismo. Boulder, CO: Westview Press. Rodrik, D. (1999). The new global economy and developing countries: making openness to work. Washington DC: Overseas Development Council. Rogozinski, J. (1998). High Price for Change: privatization in Mexico. Washington DC: Inter-American Development Bank. Romijn, H. and M. Albaladejo (2002). Determinants of innovation capability in small electronics and software firms in southeast England. Research Policy, 31, 7, pp. 1053-1067. Ruigrok, W. R. (1991). Cars and complexes: globalisation versus global localisation strategies in the world of car Industry. Perspective Dossier, 2, pp. 36-91. Sabel, C. F. (1993). Studied Trust: building new forms of cooperation in a volatile economy. Human Relation, 49, 9, pp. 1133-1170. Sachs, J. D. and F. Larrain (1993). Macroeconomics in the global economy. London: Harvester Wheatsheaf.
316
Sakakibara, S., B. Flynn, R. G. Schroeder and W. Morris (1997). The impact of just-in-time manufacturing and its infrastructure on manufacturing performance. Management Science, 43, 9, pp. 1246-1257. Sambharya, R. (1998). Foreign experience of top management temans and international diversification strategies of US multinational corporations. Strategic Management Journal, 17, 9, pp. 739-746. Santín Quiroz, O. (2001). The political economy of Mexico’s financial reform. Aldershot: Ashgate. Sanyo (Various years). Annual Reports. Electronic resource: http://panasonic.net/sanyo/corporate/ir_library/annualreports.html Sassen, S. (1988). The Migration of Capital and Labour. Cambridge: Cambridge University Press. Sassen, S. (1991). The Global City. Princeton, NJ: Princeton University Press. Sassen, S. (1994a). Cities in a World Economy. London: Pine Forge Press. Sassen, S. (1994b). The Urban Complex in a World Economy. International Social Science Journal, 46, pp. 43-62. Sassen, S. (1996). Who’s city is it? Globalisation and formation of new claims. Public Culture, 8, pp. 205-223. Sassen, S. (1999). The role of national states and private agents. Journal of Social Science, 21, pp. 409-416. Sassen, S. (2001). The global city: New York: London: Tokyo. 2nd Edition. Princeton, NJ: Princeton University Press. Schlie, E. and G. Yip (2000). Regional follows global: strategy mixes in the world automotive industry. European Management Journal, 18, 4, pp. 343-354. Scott, A. J. (1988). Metropolis: from the division of labor to urban form. Berkeley, CA: University of California Press. Scott, A. J. (1992a). The role of large producers in industrial districts: A case study of high-tech systems houses in Southern California. Regional Studies, 26, pp. 265-275. Scott, A. J. (1992b). The collective order of flexible production agglomeration: Lessons for local economic development policy and strategic choice. Economic Geography, 68, pp. 219-233.
317
Scott, A. J. (1998). Regions and the world economy: the coming shape of global production, competition, and political order. Oxford: Oxford University Press. Scott, A. J. (2000). Global city-regions: trends, theory, policy. New York: Oxford University Press. Scott, A.J. (2001). Globalization and the Rise of City-regions. European Planning Studies, 9, 7, pp.813-826. SECOFI (1992). Tablas de aranceles promedio por sector industrial 1980-1990. Ciudad de México: Dirección General de Fomento Industrial. SECOFI (1994). Reglas de contenidos de origen en el Tratado de Libre Comercio con Estados Unidos y Canadá. Ciudad de México, Subsecretaría de Negociaciones Comerciales Internacionales. SECOFI. SECOFI (2000). Padrón Empresarial, México DF. Ciudad de México: Sistema de Información Empresarial Mexicana (SIEM), SECOFI. Secretaria de Economía (2001). Comportamiento de la Inversión extranjera directa en México. Ciudad de México: Dirección General de Inversión Extranjera Secretaria de Economía. Secretaria de Economía (2008). Comportamiento de la Inversión extranjera directa en México. Ciudad de México: Dirección General de Inversión Extranjera Secretaria de Economía. SEDESOL (1998). El Programa de la 100 Ciudades en México. Ciudad de México: Secretaría de Desarrollo Social. Sen, A. (1999). Development as Freedom. New York: Knopf. Shaw, M. (2002). Theory of the global: the unfinished revolution. New York: Martin Press. SHCP (1997). El sector paraestatal mexicano. Ciudad de México: Secretaría de Hacienda y Crédito Público. Shoenberger, E. (1994). Corporate strategy and corporate strategist: power, identity, and knowledge within the firm. Environmental Planning A, 26, 3, pp. 435-452. Sklair, L. (1993). Assembling for development: the maquila industry in Mexico and the United States. San Diego, CA: Center for US-Mexican Studies, University of California, San Diego. Smith, D. (1995). Third World Cities in Global perspective: the political economy of uneven urbanisation. Boulder, CO: Westview.
318
Sobel, R. (1993). The age of giant corporations: A microeconomic history of American business 1914-1992. Westport, CT and London: Praeger. Sobhani, L. (2001). Fuelling climate change. In Goldsmith, E. and J. Mander (ed.) The case against the global economy. London: Earthscan. Solís, M. L. (1981). Economic policy reform in Mexico: A case study for developing countries. New York: Pergamon Press. Sony (Various years). Annual Reports. Electronic resource: http://www.sony.net/SonyInfo/IR/financial/ar/Archive.html Steinfeld, E. S. (2004). China’s shallow integration: networked production and the new challenges for late industrialization. World Development, 32(11), 1971-1987. Stiglitz, J. (2002). Globalization and its discontents. London: Allen Lane. Storper, M. (1997). The regional world: territorial development in a global economy. New York: Guilford Press. Storper, M. and S. Thomadakis (1998). Latecomers in the global economy. London: Routledge. Sturgeon, T. (2001). Introduction: globalization, value chains, and development. IDS Bulletin, 32, pp. 1-10. Sturgeon, T. (2002). Modular Production Networks: A New American Model of Industrial Organization. Industrial and Corporate Change, 11, 3, pp. 451-496. Sturgeon, T. (2003). Exploring the Risks of Value Chain Modularity: Electronics Outsourcing During the Industry Cycle of 2001–2002. MIT IPC Working Paper 03-02. Cambridge, MA: MIT Press. Sturgeon, T. (2007). How Globalization Drives Institutional Diversity: The Japanese Electronics Industry’s Response to Value Chain Modularity. Journal of East Asian Studies, 7, 1, pp. 1–34. Sturgeon, T. and R. Florida (1999). The world that changed the machine: globalisation and jobs in the automotive industry. Unpublished report, MIT International Motor Vehicle Program. Sturgeon, T. and R. Lester (2004). The New Global Supply-base: New Challenges for Local Suppliers in East Asia. In S. Yusuf, M. Anjum Altaf and K. Nabeshima (eds.) Global Production Networking and Technological Change in East Asia. Oxford: Oxford University Press. Taylor, P. (1997). Hierarchical tendencies among world cities: a global research proposal. Cities, 14, pp. 323-332.
319
Television Digest with Consumer Electronics (1984), Electronics market trends. Television Digest, 33, 49, pp.1198-1209. Thornley, A. and Y. Rydin (2001). Planning in a Global Era. Aldershot, Ashgate. Thrift, N. and A. Leyshon (1994). A phantom state de-territorialisation of money; the internationalisation of financial system and international financial centres. Political Geography, 13, pp. 299-327. Todd, D. (1990). The World Electronics Industry. London and New York: Routledge. Truett, D.B and L.J. Truett (1994) Government Policy and the Export Performance of the Automobile Industry. Growth and Change, 25, 3, pp 301-324. UNCTAD (1994). World Investment Report: transnational corporations, employment and workplace. Geneva: UNCTAD. UNCTAD (1997). World Investment Report Trends and Determinants. Geneva: UNCTAD. UNCTAD (1998). World Investment Report Trends and Determinants. Geneva: UNCTAD. UNCTAD (2000). Industrial Database. Geneva: UNCTAD. UNCTAD (2002). Trade and Development Report, 2002. Geneva: UNCTAD. UNIDO (2003). The global automotive Industry, Value Chain: What Prospects for Upgrading by Developing Countries. Sectoral Studies Series. Vienna: UNIDO. United Nations (1991). World Population Prospects, 1990. New York: United Nations. Department of International Economic and Social Affairs. Upton, D. (1994). The management of manufacturing flexibility. California Management Review,7, pp. 72-89. Van Biesebroeck, J. (2003). Productivity Dynamics with Technology Choice: An Application to Automobile Assembly. Review of Economic Studies, 70, 1, pp. 167-198. Van den Bulcke, D., A. Verbeke and J. H. Dunning. (2001). Globalization and the Small Open Economy. Cheltenham, UK; Northampton, MA: Edward Elgar. Venables, A. J. (1996). Equilibrium locations of vertically linked industries. International Economic Review, 37, pp. 341-359.
320
Venables, A. J. (1998). The Assessment: Trade and Location. Oxford Review of Economic Policy, 14, 2, pp. 1-6. Venables, A. J. and N. Limao (1999). Geographical disadvantage: A Heckscher-Ohlin-von Thünen model of international specialisation. Washington DC: World Bank. Von Thünen, J. H. (1966). Von Thünen's Isolated State: An English Version of Der Isolierte Staat. Pergamon Press: Oxford. Ward, P.M. (1986). Welfare Politics in Mexico: papering over the cracks? London: Allen & Unwin. Ward, P. M. (1990). Mexico City: the production and reproduction of an urban environment. London: Belhaven Press. Ward, P. M. (1998). Ciudad de México. Chichester and New York: John Wiley. Weber, B. (1969). US $Savings Cos. Invade Mexico. Billboard The International Music-Record Newsweekly, 26, pp. 1-8. Weber, B. (1990). Strategic information technology investment: guidelines for decision making. Journal of Management Information Systems, 7, 2, pp. 9-28. Weintraub, S. (1994) NAFTA: What comes next? Westport: Praeger. Whitehead, L. (1996). The international dimensions of democratization: Europe and the Americas. Oxford: Oxford University Press. Willaiams, K., C. Haslam, J. Williams, T. Cultler, A. Adcroft and S. Willaiams (1992). Against lean production. Economy and Society, 21, 3, pp. 321-354. Williamson, J. G. (1993). The political economy of policy reform. Washington DC: Institute for International Economics. Williamson, J. G. (1997). Globalization and inequality, past and present. World Bank Research Observer, 12, pp. 117-35. Womack, J., D. T. Jones, and D. Roos (1990). The machine that changed the world. New York: Rawson and Associates. Wood, A. (1994). North-South Trade, Employment and Inequality. Oxford: Oxford University Press. World Bank (1991). Mexico: Decentralization and urban management sector study. Washington DC: The World Bank.
321
World Bank (1992). Export Processing Zones. Washington DC: World Bank. World Bank (1997). Financial Sector Report. Washington DC: World Bank. World Bank (2005). Poverty Statistics and Indicators. Washington DC: World Bank. WTO (1995). World Trade Report. Geneva: WTO. WTO (2001). Trading into the future. Geneva: WTO. WTO (2002). WTO Annual Report. Geneva: WTO. Yasuhiro, M. (1993). Toyota production system: an integrated approach to just-in-time. New York: Routledge. Zampetti, F., A. Beviglia and T. Hoshino (1994). Globalisation in the Consumer Electronics Industry. Globalization of Industry: Overview and sector studies. Paris: OECD. Zedillo, E. (2000). Sexto Informe de Gobierno: Anexo Estadístico. Ciudad de México: Presidencia de la República. Zelenovich, D. M. (1982). Flexibility -a condition for effective production systems. International Journal of Production Research, 20, 3, pp. 319-337. Zey, M. and B. Camp (1996). The transformation for multidivisional for to corporate groups of subsidiaries in the 1980s: capital and crisis theory. Sociological Quarterly, 37, 2, pp. 327-351.