Embed Size (px)
Citation preview

>> Focus on sustainability,
innovation and international
Global Challenges in Smart Logistics - innovation driving supply
chain control
Presenter:
João Araujo - ILOS
NOST Network

Agenda
2
Institutional Presentation - ILOS
Brazil Overview
Service and reverse logistics
Future challenges and R&D partnership

Agenda
3
Institutional Presentation - ILOS
Brazil Overview
Service and reverse logistics
Future challenges and R&D partnership

Institutional Presentation - ILOS Our Background
1973
1991
1994
2008 The team led by Paulo Fleury,
founded ILOS – Institute of
Logistic and Supply Chain, an
independent Company located
at the UFRJ campus.
Led by Paulo Fleury, professor at
COPPEAD/UFRJ, with a partnership
with Petroleo Ipiranga, the Ipiranga
Operations Strategy Chair is
created.
COPPEAD, the Institute for Post
Graduation in Business Administration
of Rio de Janeiro Federal University
(UFRJ) starts with the first Master in
Business Administration class.
The Ipiranga Operations Strategy Chair
originated CEL (Center for Excellency
in Logistic) at COPPEAD, expanding
the original scope from Operations to
the Supply Chain.
4

5
MARKET
INTELLIGENCE
CONSULTING
FORUMS
EXECUTIVE
EDUCATION
ILOS expertise areas
work in constant
SYNERGY,
generating knowledge
and TRANSFORMATION
for its customers.
Institutional Presentation - ILOS Our Areas
Forums
International Technical
Mission
Panorama Series
Benchmarking
Customized researches
Demand & Supply Market
Analysis
Supply Chain Management
Advisory
PMO
M&A
Training Program
In company courses
Online courses
Company games
6
Institutional Presentation - ILOS Some International Partners
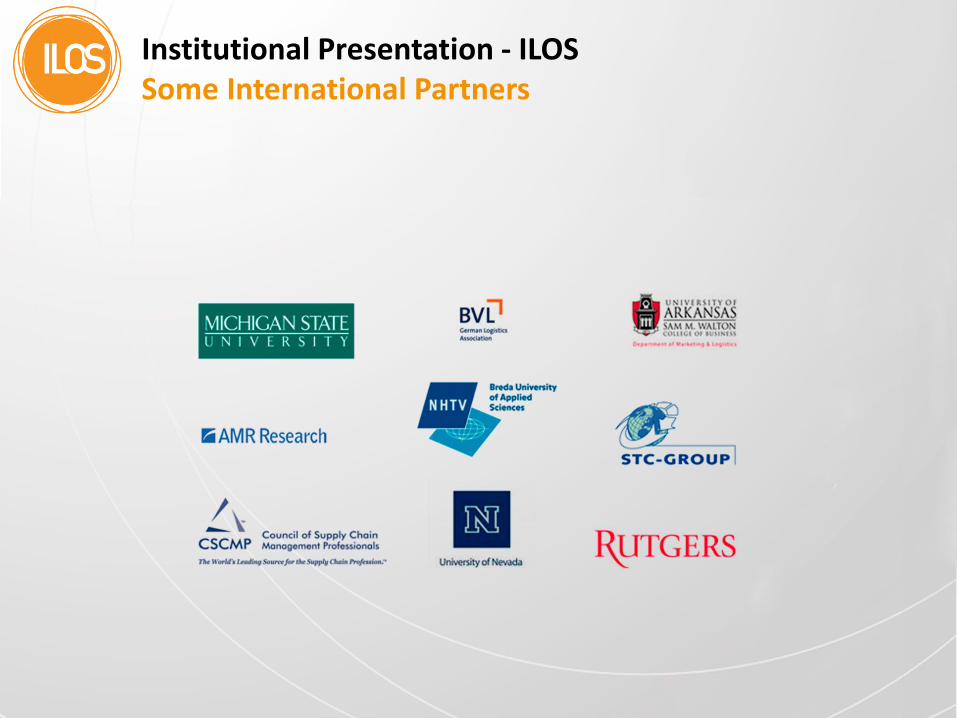
Institutional Presentation - ILOS Our Background in Sustainable Supply Chain
2010
2011
2012
2013
7
Operation strategy of reverse
logistics for post-consumer
packages and other 2 projects
2 forums with 17 sessions about
sustainability on supply chain
Operation strategy of reverse
logistics for post-consumer mercury
bulbs
2 forums with 18 sessions about
sustainability on supply chain
Panorama of Green Logistics in Brazil
Course Sustainability on Supply
Chain
2009 Planning of Network
Logistics considering
carbon footprint
Panorama of Post-Consume
Reverse Logistics in Brazil
Forum with 11 sessions about
sustainability on supply chain
Reverse Logistics and
Secondary Market Research
(Brazil and USA) presented
on International Forum of
Supply Chain (Rio de Janeiro)
Forum with 4 sessions about
sustainability on supply
chain

Agenda
Institutional Presentation - ILOS
Brazil Overview
Service and reverse logistics
Future challenges and R&D partnership
8
9
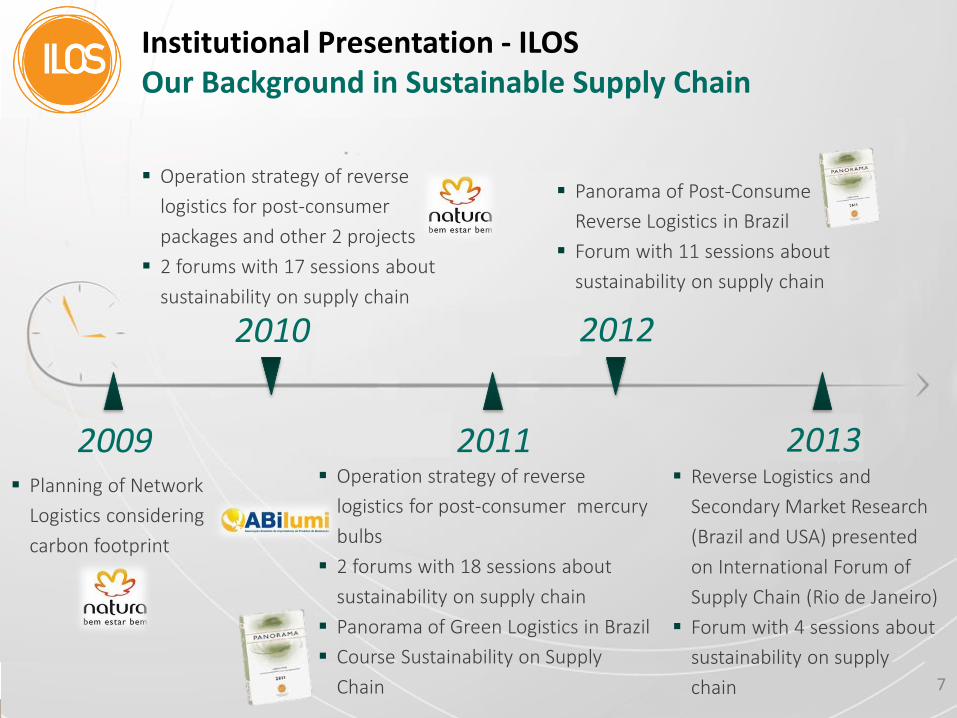
Overview Brazilian GDP represents nearly 55% of South America GDP.
Uruguay Argentina
Chile Paraguay
Brazil
French Guyana Suriname
Guyana Venezuela
Colombia
Ecuador
Peru
Bolivia
Population (million)
GDP (US$ billion)
Area (thousand km²)
South America 402 4,133 17,800
Brazil 199 2,252 8,515
São Paulo City
Rio de Janeiro City
19.6
11.8
Argentina 41 470 2,780
Buenos Aires City 2.9
Chile 17 268 756
Santiago City 6.0
USA 314 15,685 9,832
New York City 8.3
GDP at current prices . Source: World Bank, IBGE, UNSD (ONU), Argentina Census, USA Census
1.5
1.2
0.2
0.6
1.2
2012

Overview However, the development and challenges are not the same in all regions.
North
Northeast
Midwest
Southeast
South
NATURAL WEALTH
DROUGHT/BEACH CONTRAST
MEGA CITIES AND ITS TRAFFIC
BRAZILIAN GRANARY
10
ARAUCARIA FOREST AND LOCAL BUSINESS

11
Infrastructure and costs Brazil has a huge lack of infrastructure. The World Bank´s Logistics Performance Index brings Brazil in 45nd position.
29,000 km of railway
1.6 million km of roads 219,000 km paved
34 major airports
46 organized ports and more than 120 private use terminals
Potential for 50,000 km of waterways 13,600 km in use
19,200 km of pipelines
Sources: World FactBook and World Bank, ANTT, ANTAQ, Infraero (2013)
USA 9º
China 26º
India 46º
Brazil 45º
Russia 95º
World Bank´s Logistics Performance Index (2012)
2014: New president election and FIFA World Cup 2016: Olympic Games
Netherlands 5º
12
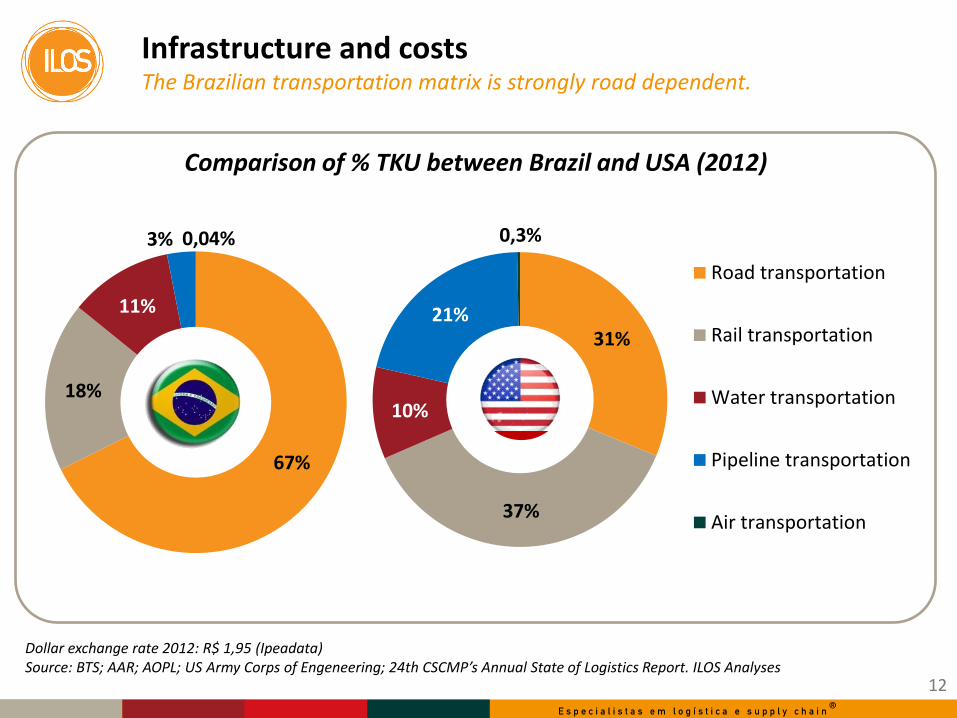
Infrastructure and costs The Brazilian transportation matrix is strongly road dependent.
67%
18%
11%
3% 0,04%
31%
37%
10%
21%
0,3%
Road transportation
Rail transportation
Water transportation
Pipeline transportation
Air transportation
Dollar exchange rate 2012: R$ 1,95 (Ipeadata) Source: BTS; AAR; AOPL; US Army Corps of Engeneering; 24th CSCMP’s Annual State of Logistics Report. ILOS Analyses
Comparison of % TKU between Brazil and USA (2012)

13
Infrastructure and costs Therefore, transportation costs are the most important ones.
Dollar exchange rate: R$ 1,95 Only domestic transportation. ILOS Analyses
160 73
17 10
Transportation Inventory Carrying
Warehousing Administrative
Total 260
0,4%
0,3%
11,5%
8,7% 0,8%
3,2%
7,1%
0,8%
2,8%
4,8%
Logistics costs (US$ billion) 2012 Logistics costs as percentage of GDP (2012)
62% 28%
7% 4%

Agenda
Institutional Presentation - ILOS
Brazil Overview
Service and reverse logistics
Future challenges and R&D partnership
14

15
Sustainable Supply Chain Reverse Logistics and Secondary Market are part of the context of the formation of a sustainable supply chain (environmental, economic and social aspects).
Packaging Industry
Bottler/Potting Industry
DCs/Hubs
Wholesaler/ Retailer
Collection (Transportation)
DCs/Hubs
Separation/ Disposal
Raw material extraction
Manufacturing Industry Landfill
Secondary Market
Traditional Supply Chain
Reverse Supply Chain
After Sales or Post-Consumer
Internal Use
Consumer *With no
consumption
*Items that were not sold (surplus on industry, DCs/Hubs, Wholesale, Retailer).
Legislations, Costs, Shorter product life cycle, etc.
16
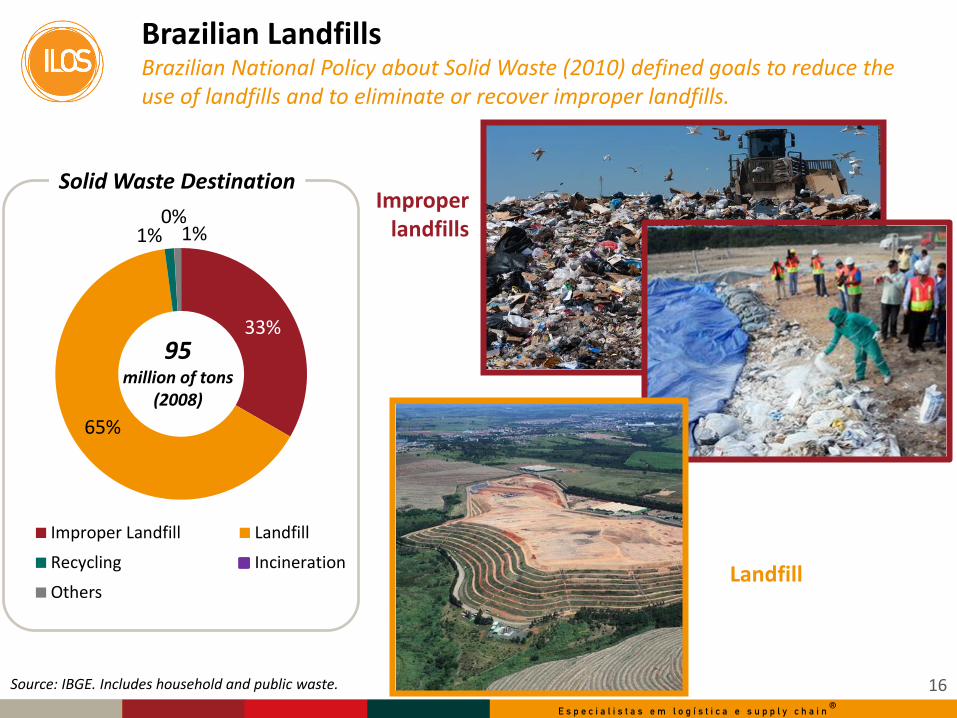
Brazilian Landfills Brazilian National Policy about Solid Waste (2010) defined goals to reduce the use of landfills and to eliminate or recover improper landfills.
Solid Waste Destination
Source: IBGE. Includes household and public waste.
95 million of tons
(2008)
Improper landfills
Landfill
33%
65%
1% 0%
1%
Improper Landfill Landfill
Recycling Incineration
Others

17
Solid Waste Destination Comparing to the Netherlands situation
3%
80%
16%
1%
33%
65%
1% 1% ImproperLandfill
Landfill
Recycling
Incineration
Others
Solid Waste Destination
Sources: IBGE. Includes household and public waste. Twenty years of experience in waste management. Herman Huisman. Fiesp Conference, Sao Paulo. April 10, 2012.
61 mln tons (2010)
95 mln tons (2008)

18
Waste Management Evolution in Brazil Waste generated in the different steps of the supply chain are treated differently by the government and by each stakeholder.
Extraction of Raw Materials
Industrial Waste Commercial Waste
Production Retail
Post-Consumer Waste
Returns
• Law 6.803/ 1980 (Industrial zone) • Law 6.938/1981 (Enviromental National
Policy) • Leaw 7347 / 1985 (Public civil liability for
damage caused to the environment)
• Law 11.445/2007 (Sanation)
• CONAMA 257/263 e 258 (batteries and tires): 1999
• Federal Decree nº 4.074/2002 (Pesticides)
• PNRS/10
Law 8.078/1990 (Consumer Protection Code)
The Brazilian Nation Policy is the latest and refers to the disposal of post-consumer waste.
~ 1
98
0
~20
05
~19
90
2000 - Currently
Criminal sanctions
Law No. 9.605/1998 - Environmental Crimes Law: Art 3 - "Fines from R$50.00 to R$ 50 millions"

19
Reverse Logistics (Post-consumer waste) In 2010, Brazilian Government released the Brazilian National Policy about Solid Waste (PNRS) , requiring a Reverse Logistics System for some groups.
Pesticide - waste and packaging
Batteries
Tires
Lubricating oils - packaging and waste
Mercury Lamps
Appliances
PNRS
Packaging
These will be just the first segments of products to define and sign a plan. Governement will include other segments after these plan will be signed.
Last december the Brazilian Governement included drug on the list of products.
First release
20
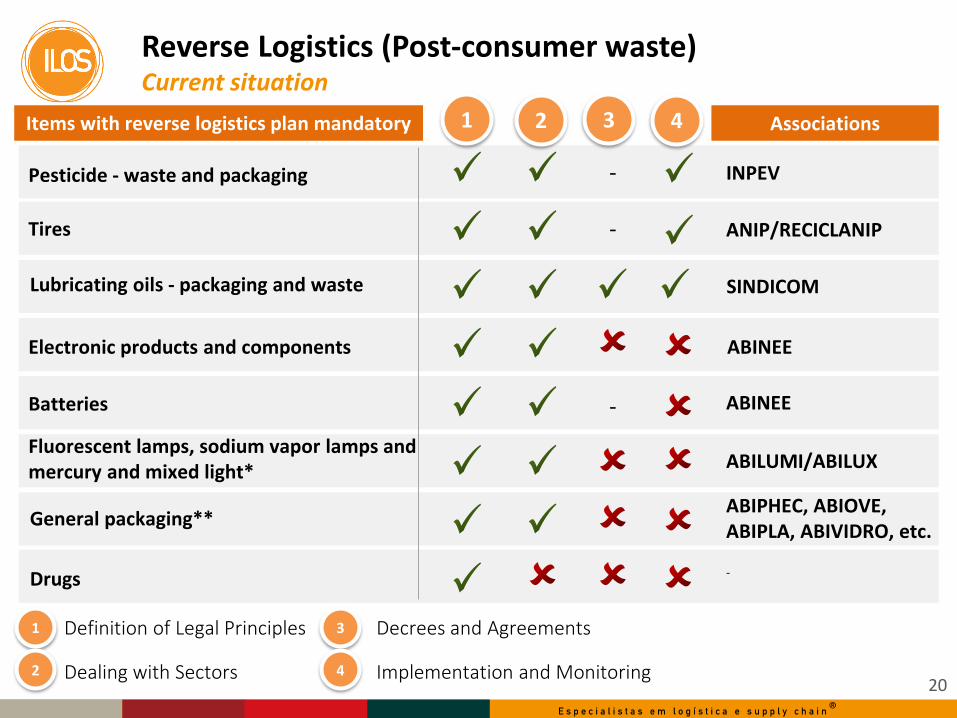
Reverse Logistics (Post-consumer waste) Current situation
Pesticide - waste and packaging
1 2 3 4
Lubricating oils - packaging and waste
Tires
Electronic products and components
Batteries
Fluorescent lamps, sodium vapor lamps and mercury and mixed light*
Items with reverse logistics plan mandatory
General packaging**
ABILUMI/ABILUX
ABINEE
ABIPHEC, ABIOVE, ABIPLA, ABIVIDRO, etc.
SINDICOM
ANIP/RECICLANIP
ABINEE
Drugs -
INPEV -
Associations
1
2
3
4
Definition of Legal Principles
Dealing with Sectors
Decrees and Agreements
Implementation and Monitoring
-
-
21
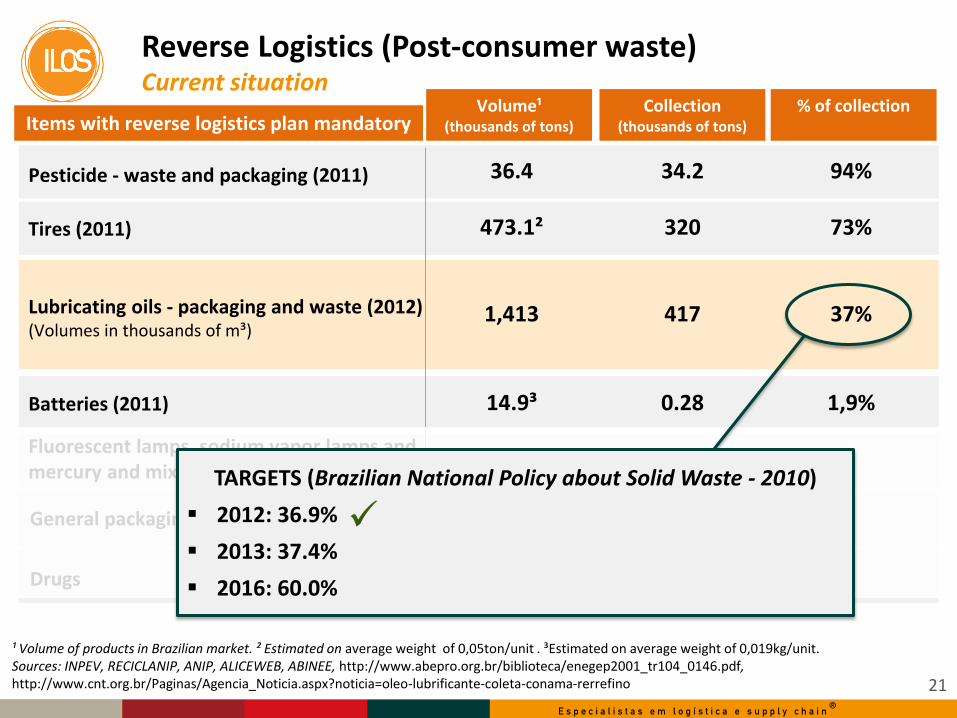
Reverse Logistics (Post-consumer waste) Current situation
Pesticide - waste and packaging (2011)
Lubricating oils - packaging and waste (2012) (Volumes in thousands of m³)
Tires (2011)
Batteries (2011)
Fluorescent lamps, sodium vapor lamps and mercury and mixed light*
Items with reverse logistics plan mandatory
General packaging**
Drugs
Volume¹ (thousands of tons)
36.4
Collection (thousands of tons)
% of collection
¹ Volume of products in Brazilian market. ² Estimated on average weight of 0,05ton/unit . ³Estimated on average weight of 0,019kg/unit. Sources: INPEV, RECICLANIP, ANIP, ALICEWEB, ABINEE, http://www.abepro.org.br/biblioteca/enegep2001_tr104_0146.pdf, http://www.cnt.org.br/Paginas/Agencia_Noticia.aspx?noticia=oleo-lubrificante-coleta-conama-rerrefino
34.2 94%
473.1² 320 73%
14.9³ 0.28 1,9%
1,413 417 37%
TARGETS (Brazilian National Policy about Solid Waste - 2010)
2012: 36.9%
2013: 37.4%
2016: 60.0%
Agenda
Institutional Presentation - ILOS
Brazil Overview
Service and reverse logistics
Challenges and Partnership Opportunities
22

23
Main Challenges and Opportunities
Business
Games
Researches
Training
International Benchmarking (International
KPIs)
Consulting Projects/
Business Advisory
Sustainable Supply Chain
City Logistics
Customs Clearence
Executive Education

João Guilherme M. E. de Araujo
BD & Consulting Director
+55 21 9 9192 4665
+55 11 9 3847 1909
ILOS
www.ilos.com.br
+55 21 3445 3000
+55 11 3847 1909