Embed Size (px)
Citation preview

CapitalConfidenceBarometer
Global
Companies embrace sustainable M&A
October 2015 | ey.com/ccb | 13th edition

Capital Confidence Barometer
Key M&A findings
of companies expect to actively pursue acquisitions in the next 12 months See page 9
59%
55%of companies currently have three or more deals in their pipelines See page 11
24%increase in appetite for upper-middle-market deals See page 10
48%of companies intend to pursue acquisitions outside their own sector See page 15
26%of companies have increased their intention to acquire in the eurozone See page 17
Sectors with the highest appetite to acquire
Oil and gas 69%Consumer products and retail 67%Mining and metals 67%Diversified industrial products 66%Power and utilities 65%
Top investment destinations
1. United States
2. United Kingdom
3. China
4. India
5. Germany

1 Capital Confidence Barometer |
Companies embrace sustainable M&A as deal markets generate renewed growth
Pip McCrostie Global Vice Chair Transaction Advisory Services
The 13th edition of our Global Capital Confidence Barometer finds companies pursuing deals at a rate not seen this decade. As 2015 global M&A value approaches record highs, executives’ long-term growth considerations outweigh short-term concerns about market volatility.
With deal intentions at a six-year peak, executives’ economic optimism is steadfast, and companies are pursuing bolder, more innovative growth strategies.
In 2015 we have seen continued volatility in commodities and currencies, intense swings in equity markets and decelerating growth in several key emerging economies. Despite these challenges, companies remain confident about dealmaking in the current macroeconomic environment.
Almost half of companies are now looking at acquisitions beyond their traditional industry boundaries, fueled by innovative disruption and changing customer preferences. Cross-border as well as cross-sector deals will also be a big part of the M&A story. The majority of potential acquirers are looking beyond their own national borders – with intentions around deals in the eurozone strengthening.
With all signs in the deal market pointing upward, some analysts raise the prospect of a market overheating. However, executives are proceeding judiciously as they look to M&A for growth. They are conducting more thorough due diligence, including new levels of cyber risk scrutiny. And they are prepared to walk away from transactions that do not meet their strategic goals.
In short, M&A is back as an essential mechanism for generating long-term value. With global macroeconomic growth tempered and their industries perpetually challenged, executives are searching for more than organic growth. In government and global leadership circles, “sustainability” has long been a buzzword for big-picture thinking about the interdependence of nations and resources to support development worldwide. In their way, executives are pursuing their own form of corporate sustainability, reimagining their businesses to both safeguard the last decade’s cost-reduction rigor and build the next decade’s platform for growth.

Macroeconomic environmentDespite significant market volatility during the survey period, companies remain confident about dealmaking in the current macroeconomic environment.
2 | Capital Confidence Barometer
83% of executives are resilient in
their economic outlook

Macroeconomic environment
3Capital Confidence Barometer |
Executives are resilient in the face of short-term macro volatilityHaving acclimatized to low growth globally, executives remain resilient about the economic big picture. Corporate leaders, whose investment decisions have impacts that span years or even decades, generally do not overreact to short-term volatility. Executives have become less sensitive to daily speculation around such issues as an emerging market slowdown or the potential timing of a US interest rate hike.
While downside risks to the global economy persist, executives remain confident that conditions are improving across many regions and countries. The vast majority of respondents anticipate some form of global economic improvement.
Corporate earnings and other leading market indicators remain positiveExecutives are looking beyond recent volatility and taking a balanced long-term view of capital markets. Notwithstanding a potential rise in US interest rates, they expect credit availability to continue to be boosted by quantitative easing programs in the eurozone and Japan, as well as policy shifts in China. If and when the US Federal Reserve begins to raise interest rates, most analysts believe it will be gradual and data-dependent, taking global economic conditions into account.
As for corporate earnings and other leading market indicators, executives are bullish. This is consistent with actual performance seen so far in 2015, as corporate earnings have generally exceeded analyst expectations. Even with recent currency fluctuations, the outlook for earnings remains positive.
What is your perspective on the state of the global economy today?Q:
Please indicate your level of confidence in the following at the global level.Q:
Political instability, currency and commodity volatility are key economic risksNo single outstanding issue is tainting executives’ overall macro view. Ongoing geopolitical tension in Eastern Europe, the Middle East and Southeast Asia ranks as executives’ top concern, but no issue significantly dents executive sentiment around economic confidence overall.
Currency and commodity shifts are a more immediate concern. Continued volatility in commodities challenges companies’ long-term planning assumptions. For companies reporting in US dollars, currency shifts may directly affect near-term earnings, potentially leading to negative investor impressions.
Eurozone stability remains an ever-present, evolving issue. Recent negotiations over Greek debt and the ongoing refugee crisis point to political unrest in the region, which undermines confidence in the long-term stability of the wider eurozone project.
Finally, the emerging market slowdown and anticipated changes in US monetary policy are more muted concerns, reinforcing that executives are able to see beyond short-term global volatility.
What do you believe to be the greatest economicrisk to your business over the next 6—12 months?Q:
1%
3% 3%Oct 15
83%
9%
Apr 15
83%
14% 8%
Oct 14
44%
53%
Improving DecliningStable
3% 1%Oct 15
36%
7%
Apr 15
22%
14%
61%
9%
47%
Oct 14
9%
47%
7%
36%
Stronglyimproving
Modestlyimproving
Stronglydeclining
Modestlydeclining
Stable
Improving Stable Declining
Equityvaluations
Short-termmarket stability
Creditavailability
Corporateearnings
72% 69% 51% 72%
Oct 14 Apr 15 Oct 15 Oct 14 Apr 15 Oct 15 Oct 14 Apr 15 Oct 15 Oct 14 Apr 15 Oct 15
26% 27%
45%
25%
70%
20%
10%
71%
19%
10%
54%
34%
12%
73%
22%
5%2%
77%
22%
1% 4%
64%
32%
4% 4%
54%
43%
3% 3%
58%
39%
3%
Increased global andregional political instability
Increased volatility incommodities and currencies
Economic and politicalsituation in the eurozone
Slowing growth in keyemerging markets
Timing and pace of interestrate rises in the US
23%
18%
6%
24%
29%

Executives are pursuing bolder investments to get ahead of the next wave of innovation.
Corporate strategy
4 | Capital Confidence Barometer
55%of available capital is allocated to support
growth strategies

5Capital Confidence Barometer |
Corporate strategy
Balancing act between growth and efficiency is here to stayAs in prior Barometers, cost efficiencies remain a permanent feature of the boardroom agenda. However, we also see a slight increase over the last six months in those focused on growth.
As acquisition activity has increased over the past year, more companies are focusing on the operational rigor required to integrate acquired businesses. Executives have learned from past upturns that timely integration of these assets leads to more efficient value creation.
With survival now clearly in the rearview mirror, executives are pursuing both growth and cost efficiency concurrently as they progress on the road to normal-state business operations.
Oct 15
Apr 15
Maintainstability
Cost reduction andoperational efficiency
Growth Survival
33%
31%
56%
54%
11%
1%14%
Which statement best describes your organization’s focus over the next 12 months?Q:
Organic investment focus shifting to meet disruptive challengesExecutives are preparing to shift their attention toward innovative organic growth strategies. The Barometer finds that increases in R&D and exploiting technology to develop new markets and products rank highest in organic growth focus. However, executives are not losing sight of their current operations, with nearly a quarter choosing more rigorous focus on core products and existing markets as their primary growth strategy.
This somewhat more active pursuit of new products and services provides evidence of executives’ boldness in an increasingly complex marketplace. Even those companies not using M&A as a means of countering disruptive forces are moving to develop technologies and expertise that will enable them to remain competitive.
What is the primary focus of your company’s organic growth over the next 12 months?Q:
Conventional
InnovativeIncrease research and development/product introductions
Exploiting technology todevelop new markets/products
Investing in newgeographies/markets
14%
More rigorous focus on coreproducts/existing markets
New sales channels
23%
6%
25%
32%
With regards to employment, which of the following does your organization expect to do in the next 12 months?Q:Companies remain focused on talent retention,
but positive hiring intentions reboundExecutives’ confidence in the outlook for the global economy is driving most companies to retain or grow their workforce. This finding is consistent with reported employment growth in the US and UK and an improving situation in the eurozone.
This Barometer also finds that, somewhat contrary to popular belief, corporate emphasis on digital evolution can coexist with positive sentiment on job creation. Technology opens up new business segments and revenue opportunities, which can counteract the side of digital evolution that undermines employment.
45%
Oct 15
29%
Apr 15
6% 6%
52%
Oct 14
7%
41% 65% 49%
Reduce workforcenumbers
Keep currentworkforce size
Create jobs/hire talent

6 | Capital Confidence Barometer6 | Capital Confidence Barometer
Capi
tal a
lloca
tion Fundamental global changes reshaping
corporate strategies
Companies are considering a full range of opportunities for allocating available capitalThe effective allocation of capital is a senior management team’s most fundamental responsibility. In a time of modest global economic growth, executives are taking extra care to balance their allocations to support long-term strategic goals. A typical capital allocation strategy also strikes a balance between long-range planning and shorter-term imperatives.
In the years immediately after the global financial crisis, many companies pursued share buybacks and other short-term measures, in many cases under pressure from large or institutional investors. While these maneuvers satisfied various constituencies at a time of market challenge, executives were reminded of a perennial truth: A focus on short-term tactics can be at odds with building long-term value.
Balance and frequency are key to successful allocationIn this Barometer, we find executives beyond the financial-crisis mindset and employing a full range of available allocation tools. They are balancing financial prudence (reducing debt), rewarding existing shareholders (returning cash), and growing the business for the long term (organic and inorganic growth).
Research consistently shows that those companies with the most active capital allocation processes will outperform and ultimately achieve higher returns than those with more passive or infrequent allocation approaches. In the new-normal environment of tempered global growth, continual reassessment of where to deploy and recycle capital is how companies sustain their growth trajectory and maximize value.
What percentage of available capital will you allocate to each of the following? Q:
Improve balance sheet by reducing debt
Organic growth (e.g., investing in products,talent retention, research and development)
Inorganic growth (e.g., acquisitions, alliances and JVs)
Returning cash to shareholders
27%
28%
30%
15%
Companies with the most active capital allocation processes are consistently shown to outperform those with more passive or infrequent allocation approaches.

7Capital Confidence Barometer | 7
Boar
droo
m a
gend
aLow-growth, low-inflation environment compelling boardroom discipline
Executives have accepted the reality of a low-growth global economy and the impact of this environment on their current operations. Greater currency volatility and fluctuations in commodity pricing are causing many to allocate their valuable boardroom time to protecting the bottom-line achievements generated over the last half-decade.
Strategic divestment and related portfolio strategies are moving higher on the boardroom agenda, due in part to the ongoing influence of shareholder activism. Interestingly, activism has become so deeply entrenched a feature of the corporate agenda that it is now drawing minimal direct boardroom focus. According to data from S&P Capital IQ, more than 95% of companies in the S&P 500 have activists on their share register. In the UK, more than half of FTSE 100 companies have activist shareholders onboard, and for companies on the German DAX the total is more than one-third. Similarly, over the past few years, acquisitions have become a mainstay of boardroom considerations.
Globalization, entrepreneurship and digital have greatest near-term impactAmong the megatrends affecting companies’ core business and acquisition strategies in the near term, the growth in economic influence of China, India and the wider Asian economy is expected to have the greatest impact. Additionally, the emergence of a more decentralized, entrepreneurial working world is having impacts executives are only beginning to grapple with.
Fueled by the convergence of social, mobile, cloud and big data technologies, as well as growing demand for anytime–anywhere access, the digitalization of the enterprise is disrupting all areas of corporate strategy.
Increased volatility in commodities and
currencies
40%
Portfolio analysis, including strategic
divestments (spin-off/IPO)
21%
Regulatory and competition/
antitrust oversight
7%
AcquisitionsShareholder activism, including returning cash to
shareholders
5%
Cybersecurity
4%2%
Reducing costs/improving margins
Which of the following has been elevated on your boardroom agenda in the past six months?Q:
Capital Confidence Barometer |
21%
Top three responses
Acquisition strategyCore business
Entrepreneurship rising
Global marketplace
Digital future20%
26%
32%
24%
15%
23%
Which of the following will affect your core business and your acquisition strategy most in the next 12 months?Q:

8 | Capital Confidence Barometer
M&A outlookDeal intentions, pipeline depth and deal size are all growing as companies take advantage of robust dealmaking conditions — but the new M&A market is led by companies intent on strategic fit and focused on execution.
59%of companies intend to
pursue acquisitions in the next 12 months

9Capital Confidence Barometer |
Do you expect your company to actively pursue acquisitions in the next 12 months?Q:
Please indicate your level of confidence in the following at the global level. Q:
M&A outlookM&A outlook
Highest appetite to acquire in six years…After a record increase six months ago, the number of executives planning to pursue acquisitions not only holds its gain but rises slightly, remaining well above the Barometer’s long-term average. While the rate of increase has moderated, the continued upward trend indicates a sustained appetite for dealmaking.
…but prudence prevailsDeal fundamentals are also up across the board, with particularly strong increases in the number and quality of acquisition opportunities and the likelihood of closing deals.
What distinguishes this market from prior M&A booms is its judiciousness. Executives are not pursuing deals without a strong strategic rationale, and they are prepared to walk away from those that do not have one. We see further evidence of this discipline in the deal metrics, which, while high, are not yet at levels seen in previous market upturns. Apr 15 Oct 15Oct 14
Qualityof acquisitionopportunities
Numberof acquisitionopportunities
Likelihoodof closing
acquisitions
69%
46%
51%
69%
76%
58%
44%
37%
57%
Oct 13 Apr 14 Oct 14 Apr 15 Oct 15
35%
31%
56% 59%
40%
Expectations to pursue an acquisition
% of positive attitudeDeal metrics
Apr 15 Oct 15Oct 14
Qualityof acquisitionopportunities
Numberof acquisitionopportunities
Likelihoodof closing
acquisitions
69%
46%
51%
69%
76%
58%
44%
37%
57%
Oct 13 Apr 14 Oct 14 Apr 15 Oct 15
35%
31%
56% 59%
40%
Expectations to pursue an acquisition
% of positive attitudeDeal metrics
Executives’ willingness to withdraw from an acquisition underscores maturity and stability of M&A marketCurrent levels of M&A activity are prompting concern for an overheating deal market. Lessons have clearly been learned from prior M&A cycles. Companies in our survey report a strong willingness to withdraw from deals that are not fully aligned with their strategy. This is a sign of a market that is sustainable.
Heated buyer competition is the top cause for walking away from deals. Companies are prepared to withdraw rather than overpay for assets. Concern over regulatory scrutiny ranks a close second, as we see the effect of increased intervention by antitrust regulators. There has been an increase in the number and the complexity of antitrust reviews. It has also become standard procedure for acquiring companies to assure markets of limited competitive impact or plans for mitigating via divestment of selected assets.
Prepared to walk away
73% YES 27% NO
Have you either failed to complete or canceled a planned acquisition in the past 12 months?Q:
If so, what was the primary reason?Q:
5% 12% 21% 29% 33%
Issues uncovered during due diligence
Competition from other buyers
Concerns about regulatory or antitrust reviews
Gap between buyer and seller
expectations too wide
Investor or board scrutiny

10 | Capital Confidence Barometer
M&A outlook
Q: What is your largest planned deal size in the next 12 months?
The real action is in medium-size deals, but megadeals remain prominentThe vast majority of planned investments are forecast to be in the lower middle market. However, the trend since 2014 has been toward more upper-middle-market deals (between US$250 million and US$1 billion), which now make up more than a quarter of planned M&A. This trend corresponds with the direction of the 2015 year-to-date M&A market: We have seen an increased number of deals across all value ranges, except those below US$50 million.
Deals valued at more than US$1 billion dominate current M&A headlines. But while these megadeals are a vital component of total M&A transacted value, they make up a small proportion of the total population of deals. Executives do expect more of these megadeals over the next 12 months, even as only a small percentage of companies plan to pursue them.
21%
77%
Greater than US$1bUS$251m—US$1b Less than US$250m
2%
14%
81%
5%Oct 14 Apr 15
26%
71%
3%
Oct 15
Changing market dynamics encourage dealmaking sentimentsOur current survey shows positive deal-market sentiment accelerating, with a particular shift in the past 12 months from those expecting stability to those anticipating greater activity. This dovetails with other market trends highlighted in this Barometer. The disruption of business models, the blurring of sector boundaries and the drive toward sector consolidation in search of growth are all combining to lift dealmaking at or above record highs.
The vast majority of executives predict the global M&A market will thrive in the next 12 months. This sentiment is driven by executives’ positive outlook regarding the global economy and their resilience in the face of a persistently low-growth environment.
What is your expectation for the M&A market in the next 12 months?Q:
Stable
Declining
Improving
15%
39%
26%
1%
2%
5%
69%
60%
83%
Oct 14 Oct 15Oct 13

11Capital Confidence Barometer |
Pipelines continue to grow
How many deals do you currently have in your pipeline?Q:
Executives are more comfortable with M&A as a driver of growth.
Growth in deal pipelines mirrors improved M&A sentimentThe past 12 months have brought an upward shift in the quantity of deals companies are considering, with three- and four-deal pipelines up strongly from a year ago. The number of companies with more than five deals in their pipeline has also increased.
Looking ahead, we find a majority of companies expecting no change in deal pipelines, likely due to their already robust activity.
Companies that have returned to dealmaking accelerate activityThe prior Barometer showed a large number of companies returning to dealmaking after spending much of the post–financial crisis years on the sidelines.
The correlation analysis below maps planned acquisitions against deals completed in the past 12 months. It reveals that those companies that recently returned to dealmaking are continuing, and even accelerating, their activity.
As we move deeper into a sustained deal-market upturn, executives are more comfortable with M&A as a driver of growth. We see strong evidence of companies planning to pursue more transactions in the next 12 months than they completed in the prior year.
>=5
4
3
2
1
Oct 15Apr 15Oct 14
8%7%
13%
30%16%
33%38%
30%
26%28%
12%
23%
13%
11%12%
Correlation analysis between planned acquisitions and deals completed in the past 12 months.Q:
Oct 15
Apr 15
Oct 14
Increase No change Decrease
23%44% 33%
29%66% 5%
16%
63%35%
>=5
4
3
2
1
Number of planned acquisitions in the next 12 months
65% 8%27%
30% 4%66%
9% 2%89%
79% 4%17%
66% 6%28%
More Stay the same Less
2%
How do you expect this to change over the next 12 months?Q:
Oct 15
Apr 15
Oct 14
Increase No change Decrease
23%44% 33%
29%66% 5%
16%
63%35%
>=5
4
3
2
1
Number of planned acquisitions in the next 12 months
65% 8%27%
30% 4%66%
9% 2%89%
79% 4%17%
66% 6%28%
More Stay the same Less
2%
M&A outlookM&A outlook
6% 53% 39%
15% 49% 35%
2%
1%
18% 78%
35% 61%
4%
4%
17% 78%
39% 56%
5%
5%
ContractStay the sameWiden
DecreaseRemain at current levelsIncrease
The gap is small (<10%) No gap
Somewhat higher (10%–25% gap)Significantly higher (25% or more)
Apr 15
Oct 15
Apr 15
Oct 15
Apr 15
Oct 15
Oct 14 Apr 15 Oct 15
2,695
3,702
16%
63%
2,963
Total number of deals our survey respondents have in their pipeline

12 | Capital Confidence Barometer
2000 2001 2002 2003 2004 2005 2006 2007 2008 2009 2010 2011 2012 2013 2014
2%
2015
4%
6%
8%
10%
0
1t
2t
3t
4t
5tM&A/GDP Value (US$t)
Value US$t M&A value as % of GDP
Manageable valuation gap supports dealmakingHow do you think that buyers’ expectations currently compare to sellers’ (valuation gap)?Q:
Do you expect the valuation gap between buyers and sellers in the next 12 months to:Q:
What do you expect the price/valuation of assets to do over the next 12 monthsQ:
When asked how buyers’ expectations compare with sellers’ view of asset valuations in the current market, most respondents see a sizable gap. Nearly two-thirds see the valuation gap as greater than 10%. However, that response is consistent with that of our previous Barometer.
Executives see beyond near-term volatilityAs might be expected in an active deal market, asset valuation multiples are elevated compared with historic levels. But they are not yet at the peaks seen in previous M&A highs. Executives appear to be maintaining a relatively confident attitude toward asset valuations. Most see the recent correction in global stocks as temporary, and they expect asset prices to revert to levels seen in early 2015.
Similarly, EY analysis demonstrates a strong relationship between M&A value and gross domestic product and finds headroom in this current cycle (see below). That is particularly true if the eurozone returns to previous levels of dealmaking and China fulfills its potential. In short, as with the global economy, executives are able to see beyond near-term volatility, and this deal market still has some way to run.
Global macro trends affect asset values One area that may have a deeper impact on valuations is the timing and pace of rate normalization by the US Federal Reserve, which will have a direct impact on the cost of capital. Even here, executives believe rate increases will be gradual, data-dependent and reflective of global economic conditions.
Valuations also differ widely by geography and sector, differences that may spur share-based deals and bring new opportunities to the table. In the eurozone, while rising valuations are a drag on M&A, other stimulus in the region, particularly the current program of quantitative easing, should offset this. Similarly, headwinds in emerging markets, especially a slowing China, coupled with downward pressure on commodity pricing will likely be more than offset by attractive asset valuations in those markets.
M&A outlook
6% 53% 39%
15% 49% 35%
2%
1%
18% 78%
35% 61%
4%
4%
17% 78%
39% 56%
5%
5%
ContractStay the sameWiden
DecreaseRemain at current levelsIncrease
The gap is small (<10%) No gap
Somewhat higher (10%–25% gap)Significantly higher (25% or more)
Apr 15
Oct 15
Apr 15
Oct 15
Apr 15
Oct 15
Oct 14 Apr 15 Oct 15
2,695
3,702
16%
63%
2,963
Total number of deals our survey respondents have in their pipeline
Global M&A value as a share of global GDP
Source: Dealogic, OEF & EY analysis
Number in brackets represents the country’s position in the previous Barometer, published in April 2015.
13Capital Confidence Barometer |
Deal
cha
lleng
es a
nd ri
sks
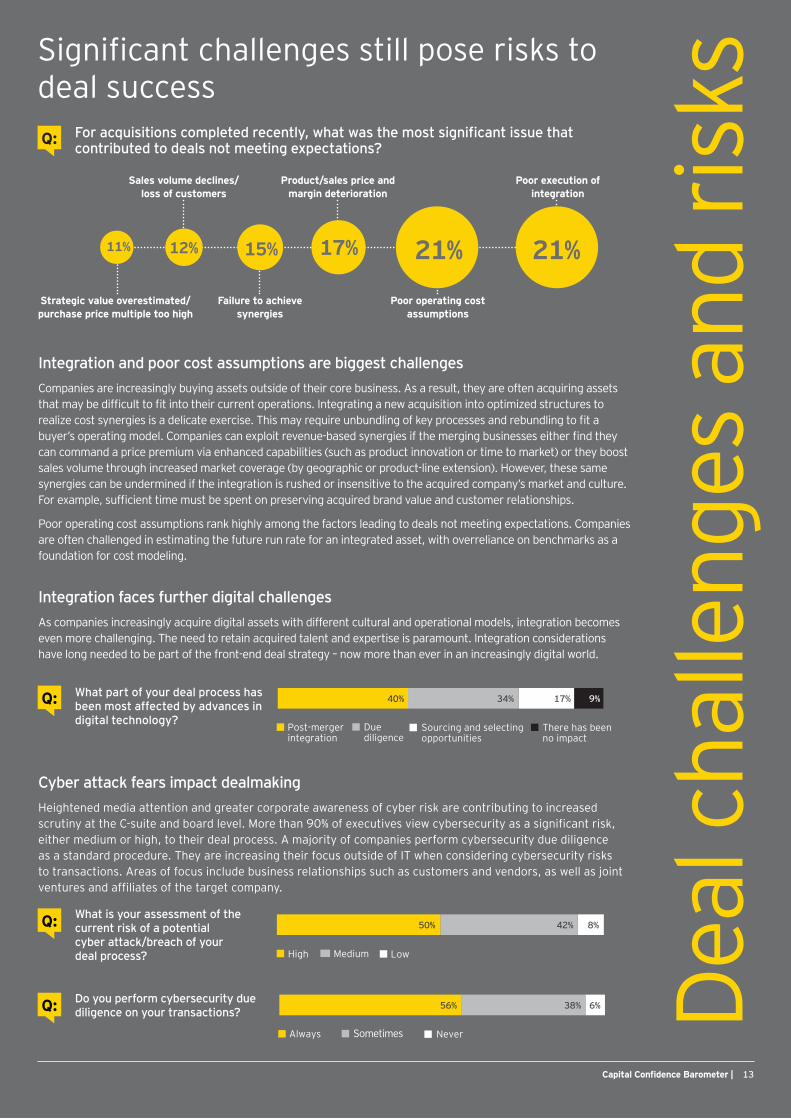
Integration and poor cost assumptions are biggest challengesCompanies are increasingly buying assets outside of their core business. As a result, they are often acquiring assets that may be difficult to fit into their current operations. Integrating a new acquisition into optimized structures to realize cost synergies is a delicate exercise. This may require unbundling of key processes and rebundling to fit a buyer’s operating model. Companies can exploit revenue-based synergies if the merging businesses either find they can command a price premium via enhanced capabilities (such as product innovation or time to market) or they boost sales volume through increased market coverage (by geographic or product-line extension). However, these same synergies can be undermined if the integration is rushed or insensitive to the acquired company’s market and culture. For example, sufficient time must be spent on preserving acquired brand value and customer relationships.
Poor operating cost assumptions rank highly among the factors leading to deals not meeting expectations. Companies are often challenged in estimating the future run rate for an integrated asset, with overreliance on benchmarks as a foundation for cost modeling.
Integration faces further digital challengesAs companies increasingly acquire digital assets with different cultural and operational models, integration becomes even more challenging. The need to retain acquired talent and expertise is paramount. Integration considerations have long needed to be part of the front-end deal strategy – now more than ever in an increasingly digital world.
Cyber attack fears impact dealmakingHeightened media attention and greater corporate awareness of cyber risk are contributing to increased scrutiny at the C-suite and board level. More than 90% of executives view cybersecurity as a significant risk, either medium or high, to their deal process. A majority of companies perform cybersecurity due diligence as a standard procedure. They are increasing their focus outside of IT when considering cybersecurity risks to transactions. Areas of focus include business relationships such as customers and vendors, as well as joint ventures and affiliates of the target company.
Significant challenges still pose risks to deal success
For acquisitions completed recently, what was the most significant issue that contributed to deals not meeting expectations? Q:
13Capital Confidence Barometer |
Poor operating cost assumptions
Failure to achieve synergies
15%
Sales volume declines/ loss of customers
12%
Strategic value overestimated/ purchase price multiple too high
11%
Poor execution of integration
21%21%
Product/sales price and margin deterioration
17%
What part of your deal process has been most affected by advances in digital technology?
Q:
Sourcing and selectingopportunities
Duediligence
Post-mergerintegration
There has beenno impact
9%17%40% 34%
8%50% 42%
64%68%
75% 77%
LowMediumHigh
NeverSometimesAlways
56% 38%
5%49% 46%
Just prior toannouncement
A part of the corediligence process
Between signingand closing
Customersagreements/
systeminterfaces
JV/affiliates
ITsystems
Supply chainagreements/
systeminterfaces
6%What is your assessment of the current risk of a potential cyber attack/breach of your deal process?
Q:
Sourcing and selectingopportunities
Duediligence
Post-mergerintegration
There has beenno impact
9%17%40% 34%
8%50% 42%
64%68%
75% 77%
LowMediumHigh
NeverSometimesAlways
56% 38%
5%49% 46%
Just prior toannouncement
A part of the corediligence process
Between signingand closing
Customersagreements/
systeminterfaces
JV/affiliates
ITsystems
Supply chainagreements/
systeminterfaces
6%
Do you perform cybersecurity due diligence on your transactions?Q:
Sourcing and selectingopportunities
Duediligence
Post-mergerintegration
There has beenno impact
9%17%40% 34%
8%50% 42%
64%68%
75% 77%
LowMediumHigh
NeverSometimesAlways
56% 38%
5%49% 46%
Just prior toannouncement
A part of the corediligence process
Between signingand closing
Customersagreements/
systeminterfaces
JV/affiliates
ITsystems
Supply chainagreements/
systeminterfaces
6%

14 | Capital Confidence Barometer
Sect
or o
utlo
ok Commodity price volatility providing impetus to pursue acquisitions in sectors with greatest exposurePercentages reflect those who intend to actively pursue acquisitions in the next 12 months.
Strong deal sentiment across many sectors
Consumer products and retailIn the absence of ample growth avenues for mature brands, consumer products companies are focused on portfolio optimization as a critical theme. Companies have sharpened their focus on developed-market businesses, and large players are optimizing their brand portfolios and market exposure by disposing of non-core and lower-growth businesses. These companies are rechanneling investments into acquiring or expanding within faster-growth or higher-margin segments.
67%Oil and gasThe sharp fall in oil prices during 2014 put pressure on those producers who invested heavily during the last commodity supercycle. With demand forecast to remain low and supply still abundant, many oil and gas executives are looking to strengthen their companies by focusing on financial, operational and portfolio resilience. M&A will play a major role in determining which companies survive the downturn in prices, especially in the oilfield services and midstream sub-sectors. Consolidation in these two areas has grown in 2015 and is expected to continue.
69%
Mining and metalsThe sector remains largely focused on portfolio management and capital returns instead of exploring options for growth. With weak commodity prices putting pressure on margins, earnings and debt serviceability, the sector continues to be cautious against countercyclical investment. Mining companies are now facing tougher scrutiny about their investment and funding decisions than ever. However, those companies that are cash-rich and with lower levels of debt are beginning to look at attractively priced assets, with a close eye on future growth potential. Private equity and other alternative investors are also looking to acquire in the sector while prices remain subdued.
67%
Power and utilitiesInnovations in both financing and technology are emerging drivers of transaction activity in the power industry, and utilities are responding by adapting their traditional business models. Spinoffs of conventional generation, trading, and exploration and production businesses highlight utilities’ willingness to change and to move toward growth opportunities. Institutional
investors and private equity firms are also playing an increasingly important buyside role in the sector. Regulatory changes in Europe have created a challenging new operating environment for utilities. This has put divestment and redeployment of capital at the center of the utility agenda. Disruptive trends such as digitization, distributed energy and empowered customers will continue to influence deal activity and asset valuations.
66%Diversified industrial productsAs growth in industrials is typically tied to gross domestic product, M&A is often necessary to achieve above-market returns in this industry. Consolidation in high-end capital goods has been a significant trend, and we have also seen high demand for emergent technologies such as undersea mining equipment, especially from companies in China looking to move up the value chain. Given the low-growth environment, portfolio management will continue to be a major focus, especially for those industrials companies affected by recent volatility in energy prices. For these companies, cost reduction remains an imperative, due to pressure on topline growth.
65%

15Capital Confidence Barometer | 15
Sect
or d
isru
ptio
n
Capital Confidence Barometer |
Companies look for growth amid disruptionExecutives reassessing business models in response to changing customer behavior and evolving technologyAs consumer preference and geographic shifts rewrite the rules in many sectors, executives find themselves working harder to stay ahead of their customers. They are also adapting and responding to technological and regulatory change. These trends have compelled many companies to cross sector lines, and M&A is often the easiest path to that objective.
Industry regulation
Increased globalization
Changing customerbehavior and expectations
Sector convergence/increase competitionfrom companies in other sectors
Product innovation
Advances in technologyand digitalization
16%
14%
12%
16%
21%
20%
From where do you see the most disruption to your core business in the next 12 months?
Q:
Strong deal sentiment across many sectors
Convergence of industries spurs companies to consider cross-sector M&AAs traditional sector boundaries blur, particularly around technology and industrial processes, it is not surprising that nearly half of the executives we surveyed are considering acquisitions outside their own sector. Acquisitions into manufacturing segments were the most cited. Second was retail and wholesale, followed by government and public services acquisitions, which are often achieved through privatizations and public–private partnerships. We also see strong demand to invest in technology and other intellectual property–driven sectors.
Accordingly, several factors are influencing companies to pursue those cross-sector acquisitions. Changes in customer behavior are shifting competitive dynamics within sectors, as are similar moves made by competitors. In these scenarios, companies use M&A as a mechanism to protect market share, or in response to evolution in production elements or technologies.
48%
2% Other transportation2% Hospitality and leisure2% Healthcare/provider care2% Construction3% Technology3% IT hardware and software4% Logistics and distribution4% Government and public sector
9% Manufacturing6% Retail and wholesale
11% Other sectors
52%48%
Not planning an acquisition outside of my own sectorPlanning an acquisition outside of my own sector
Changes in customerbehavior
Access to new materials orproduction technologies
Reacting to competition
New product innovation
17%
15%
29%
36%
If you are planning an acquisition in a sector other than your own, please indicate which sector?Q:
What is the main strategic driver for pursuing an acquisition outside your own sector?
Q:

16 | Capital Confidence Barometer
Many companies looking further afield for dealsWhere is the main focus of your M&A strategy over the next year?Q:
What percentage of your acquisition capital are you going to allocate to the emerging markets in the next 12 months?Q:
Amid globalization, executives consider all locations for acquisitionsWhile one-third of companies are planning to acquire in their home country or domestic market, a larger number are looking not just across borders but outside of their immediate region entirely. This is unsurprising in a fast-moving and increasingly divergent global economy.
Focus of allocation still on developed marketsThe majority of allocation for global investment remains focused on developed markets. However, we still see a modest increase in appetite for higher-risk global investment.
Recent currency swings and lower equity valuations in emerging markets have raised concerns. However, from a valuation perspective, these changes have also made emerging market assets more attractive. A significant number of our respondents plan to allocate at least 10% of their acquisition capital to emerging markets — up six points from the last Barometer.
Primary preferred destination outside their domestic market/immediate region*
M&A outlook
0 10 20 30 40 50 60 70 80
3%
6%4%
3%
1%9%
29%
53%61%
31%
Above 50%
25%—50%
10%—25%
Less than 10%
None
Apr 15 Oct 15
Domestic market (home country)
Immediate region (countries close to home)Outside domestic market/immediate region
Oct 15
41%
30%
29%
Companies preferred investment destinations outside their domestic market/immediate region
Outside domestic market/immediate regionImmediate region (countries close to home)Domestic market (home country)
North America
Latin America
Western Europe
Eastern Europe
Asia-Pacific
Africa and Middle
East
* Respondents were polled on their top three investment destinations; this chart reflects the cumulative preference for each region (overall top 10 country investment destinations on page 17).

Stronger growth in the United States and the United Kingdom and the attractiveness of high-quality assets in Germany are making these countries popular investment destinations. China and India also remain attractive destinations for investors, notwithstanding recent concerns about the wider Asia-Pacific region’s economic growth and stability.
Number in brackets represents the country’s position in the previous Barometer, published in April 2015.
17Capital Confidence Barometer |
Top 10 investment destinations
1. United States (3) 2. United Kingdom (1) 3. China (2) 4. India (6) 5. Germany (4) 6. Australia (5) 7. Canada (-) 8. Brazil (-) 9. France (7) 10. Argentina (-)
M&A outlook
More than a quarter of executives have increased plans to acquire assets in the eurozone. This is in part due to companies “catching up” on planned acquisitions in the region following a period of instability, and attractive pricing due to currency fluctuations. The ongoing program of quantitative easing by the European Central Bank may also help improve dealmaking in the eurozone.
Strengthening growth across the area, together with changes in the euro exchange rate and local asset valuations, will make this a dynamic and fast-moving market for deals in the near term. We could see further inbound investment from China, the US and Japan.
While it may be the world’s largest single market, the eurozone’s wide range of economic conditions and business environments means investors are picking and choosing where to invest.
Eurozone investment appetite increasesHas your intention to acquire assets in the eurozone altered due to recent political events and changes in monetary and economic policy?
Q:
26%63%IncreasedStayed the sameDecreasedNot relevant/no plansto invest in eurozone
6% 5%

18 | Capital Confidence Barometer
Top M&A markets and their key characteristics
M&A outlook
Germany continues to be the main bright spot within an otherwise depressed eurozone. Recent economic data points to slow but stable growth, with an acceleration in gross domestic product forecast for 2016. Germany’s high-quality corporate assets, especially in the industrials, chemicals and automotive sectors, are already attractive to foreign acquirers. Also, a weakening euro promises to make these assets relatively less expensive. The main competition for these assets is likely to come from China, Japan and the US. As for M&A from within Germany, acquisitions by German companies have historically focused on the domestic market. However, we are beginning to see an increase in cross-border acquisitions, especially investment in US assets.
Even amid headlines over its recent economic slowdown, mainland China retains its status as an attractive destination. This is due to levels of growth that remain very strong relative to the global economy. The Chinese Government now targets annual growth at about 7%, down from previous rates that ranged as high as 10%. With economic rebalancing a stated Chinese policy, further investment opportunities should arise for inbound investors. As for outbound investment, lower domestic growth, combined with increasingly assertive, cash-rich Chinese companies, should compel China-based enterprises to invest capital overseas. The government has also introduced a range of measures to encourage outbound acquisitions, particularly targeting companies with intellectual property assets in the industrial and technology sectors.
Even as the outlook for many emerging markets turns negative, investor sentiment toward India is seeing a significant recovery, with the country’s deal market expected to improve. The Indian Government’s pro-business stance and an increasingly promising economic outlook should foster a more benign investment landscape for inbound investment. Several positive macroeconomic factors are also burnishing India’s investment outlook. Low oil prices will help shrink the country’s import bill and narrow its current-account deficit. Easing inflation and looser monetary policy are expected to encourage consumer spending and investment. On the whole, India’s status among global investors as one of, if not the, most attractive emerging markets should also boost growth.
GermanyChina India
1. US 2. China 3. Germany
1. US 2. China 3. India
1. US 2. Germany 3. China
1. Germany 2. UK 3. China
1. US 2. China 3. India
1. India 2. UAE 3. US
Top investors
Top destinations
Top sectors
Diversified industrial products
Power and utilities
Diversified industrial products
Consumer products and retail
Technology TechnologyAutomotive AutomotiveAutomotive

19Capital Confidence Barometer |
M&A outlook
The United Kingdom has long been a favored destination for foreign firms accessing the wider European Union. With strong domestic growth in 2015, similar levels forecast through 2016 and a focus on reducing red tape, the UK should be able to maintain its unique status as a global M&A hub. Among leading UK sectors likely to engage in M&A, life sciences and technology companies are strong innovators, the financial services sector is robust, and consumer products companies are globally recognized. Companies in all of these sectors should be looking to make acquisitions both domestically and abroad and will be attractive to foreign acquirers. As for downside risks, the impending UK referendum on EU membership, as well as uncertainty regarding the timing of an expected interest rate increase, may check the deal markets.
Japan continues to suffer from weak domestic economic growth combined with persistently low inflation. However, recent policy decisions by the Japanese Government and the Bank of Japan have reinforced policymakers’ determination to resolve the country’s economic malaise. While gross domestic product is expected to return to growth in 2016, Japan faces increased exposure to the slowdown in China, a key market for Japanese exports. In the deal markets, Japanese companies have increasingly shifted toward outbound acquisitions, especially in the financial services, industrials and consumer products sectors. This shift has been coupled with a small increase in inbound acquisitions into Japan, mainly by private equity investors but also in combinations involving US and Japanese companies in the technology and real estate sectors.
The M&A market in the United States is expected to maintain its upward momentum and continues to be attractive to foreign investors. Positive US economic fundamentals, and low interest rates are all strengthening boardroom confidence. US companies continue to perform exceptionally: The majority of the S&P 500 beat earnings estimates in the first half of 2015. This has kept investor morale up and driven M&A. Additionally, the US dollar’s increasing value should make outbound deals appealing, especially those focused on the eurozone, where valuation and currency differentials are most apparent. The main potential downside for dealmakers in the US concerns the timing of the Federal Reserve’s first anticipated rate hike and the overall pace of a return to normalized interest rates; however, recent announcements by the Federal Reserve have pushed back the timing on such moves.
Japan United Kingdom
United States
1. US 2. Japan 3. UK
1. US 2. China 3. UK
1. US 2. UK 3. Australia
1. UK 2. US 3. China
1. UK 2. China 3. US
1. Canada 2. Argentina 3. Germany
Top investors
Top destinations
Top sectors
Diversified industrial products
Power and utilities
Financial services
Diversified industrial products
Oil and gasConsumer products and retail
TechnologyTechnologyAutomotive

20 | Capital Confidence Barometer20 | Capital Confidence Barometer
The Global Capital Confidence Barometer gauges corporate confidence in the economic outlook and identifies boardroom trends and practices in the way companies manage their Capital Agendas — EY’s framework for strategically managing capital.
It is a regular survey of senior executives from large companies around the world, conducted by the Economist Intelligence Unit (EIU). Our panel comprises select global EY clients and contacts and regular EIU contributors.
• In August and September, we surveyed a panel of more than 1,600 executives in 53 countries; more than 50% were CEOs, CFOs and other C-level executives.
• Respondents represented 19 sectors, including financial services, consumer products and retail, technology, life sciences, automotive and transportation, oil and gas, power and utilities, mining and metals, diversified industrial products, and construction and real estate.
• Surveyed companies’ annual global revenues were as follows: less than US$500m (14%); US$500m—US$999.9m (25%); US$1b—US$2.9b (24%); US$3b—US$4.9b (11%); and greater than US$5b (26%).
• Global company ownership was as follows: publicly listed (65%), privately owned (31%), family-owned (2%) and government/state owned (2%).
Abo
ut th
is s
urve
y

21Capital Confidence Barometer |
Global
Pip McCrostieGlobal Vice ChairTransaction Advisory [email protected]+ 44 20 7980 0500Follow me on Twitter: @PipMcCrostie
Steve KrouskosDeputy Global Vice ChairTransaction Advisory [email protected]+ 44 20 7980 0346Follow me on Twitter: @SteveKrouskos
Barry PerkinsGlobal Lead ResearcherTransaction Advisory [email protected]+44 (0)207 951 4528
Americas
Richard M. JeanneretAmericas LeaderTransaction Advisory [email protected]+ 1 212 773 2922Follow me on Twitter: @RichJeanneret
Asia-Pacific
John HopeAsia-Pacific LeaderTransaction Advisory [email protected]+ 852 2846 9997
Europe, Middle East, India and Africa (EMEIA)
Andrea GuerzoniEMEIA LeaderTransaction Advisory [email protected]+ 39 028 066 9707
Japan
Kenneth G. SmithJapan LeaderTransaction Advisory [email protected]+ 81 3 4582 6400
For a conversation about your capital strategy, please contact us:
Cont
acts

EY | Assurance | Tax | Transactions | Advisory
About EYEY is a global leader in assurance, tax, transaction andadvisory services. The insights and quality services wedeliver help build trust and confidence in the capitalmarkets and in economies the world over. We developoutstanding leaders who team to deliver on our promisesto all of our stakeholders. In so doing, we play a criticalrole in building a better working world for our people, forour clients and for our communities.
EY refers to the global organization, and may refer toone or more, of the member firms of Ernst & YoungGlobal Limited, each of which is a separate legal entity.Ernst & Young Global Limited, a UK company limited byguarantee, does not provide services to clients. For moreinformation about our organization, please visit ey.com.
About EY’s Transaction Advisory ServicesHow you manage your Capital Agenda today will defineyour competitive position tomorrow. We work with clientsto create social and economic value by helping themmake better, more informed decisions about strategicallymanaging capital and transactions in fast-changing markets.Whether you’re preserving, optimizing, raising or investing capital, EY’s Transaction Advisory Services combine a unique set of skills, insight and experience to deliver focused advice. We help you drive competitiveadvantage and increased returns through improveddecisions across all aspects of your Capital Agenda.
© 2015 EYGM Limited.All Rights Reserved.
EYG no. DE0640ED None
This material has been prepared for general informationalpurposes only and is not intended to be relied upon asaccounting, tax or other professional advice. Please referto your advisors for specific advice.
ey.com/ccb