Embed Size (px)
Citation preview

Global Business Engineering
Contribution to a Concept for Successful Production and Business
Development in Emerging Markets
Masterthesis
Department Maschinenbau und Produktion Studiengang Master Produktionstechnik und -management Prüfer: Prof. Dr.-Ing. Dipl.-Math. H.-J. Germer Prof. Dr.-Ing. E. Kuhn Student: Dipl.-Ing. (FH) Martin Kalka Matrikelnu.: 1732018

II
Acknowledgment
At this first point of this master’s thesis I would want to thank my two professors, Mr. Prof. Dr.-
Ing. Dipl.-Math. Germer and Mr. Prof. Dr.-Ing. Kuhn, for their contribution and their time spend
on this thesis.
And I especially want to thank my friend Mr. MEng. Dipl.-Ing. (FH) Milos Gorgolewski, how has
always been a big source of inspiration in every field of this thesis. And I wane say thank you
for the great time we spend at the university.
Martin Kalka

III
List of Contents
Acknowledgment ..................................................................................................... II
1. INTRODUCTION ................................................................................... 1-1
1.1 The world is changing throughout global trends ................................................. 1-2
1.2 Growth of the lower end (the 3th world) ............................................................. 1-4
1.3 Business Transformation ................................................................................... 1-6
1.4 Cross cultural leading ........................................................................................ 1-7
1.5 The requirement of going global ........................................................................ 1-8
2. GLOBAL PRODUCTION AND BUSINESS ENGINEERING ........................... 2-11
2.1 1th Phase – Pre-Phase .................................................................................... 2-14
2.1.1 Assessing the Selection Criteria .............................................................. 2-14
2.1.2 Foreign Investments ................................................................................ 2-23
2.1.3 Adjustment of the Production Technology (Reengineering) ..................... 2-27
2.2 2nd Phase - Designing a Global Footprint ......................................................... 2-34
2.3 3rd Phase - The Ramp Up ................................................................................ 2-41
2.3.1 Improvement Potentials ........................................................................... 2-41
2.3.4 Ramp-Up of the Production ..................................................................... 2-48
2.3.5 Equipment Transfer or Purchase ............................................................. 2-51
2.4 4th Phase – Sustainability-Phase ..................................................................... 2-53
2.4.1 Role of the Management ......................................................................... 2-53
2.4.2 Global Sourcing ....................................................................................... 2-68
2.4.3 Research & Development (R&D) ............................................................. 2-73
3. CONCLUSION ................................................................................... 3-79
APPENDIX 2 ........................................................................................... 3-80
APPENDIX 3 ........................................................................................... 3-81
REFERENCE INDEX ............................................................................... LXXXII

IV
List of Figures
Figure 1: Development of Globalization ............................................................................. 1-1
Figure 2: Mega Trends ...................................................................................................... 1-3
Figure 3: Trend Typologies ................................................................................................ 1-3
Figure 4: Decreasing poverty ............................................................................................. 1-4
Figure 5: The Economic Pyramid ....................................................................................... 1-5
Figure 6: Forces of Global Production................................................................................ 1-9
Figure 7: GDP Growth in 2008 ......................................................................................... 1-10
Figure 8: Global Production Engineering Process ............................................................ 2-13
Figure 9: Site Selection Factors ....................................................................................... 2-15
Figure 10: Relevance of Location Criteria ........................................................................ 2-16
Figure 11: Scope of Analysis and Relevance of Location Parameters ............................. 2-16
Figure 12: Assessing Parameters .................................................................................... 2-17
Figure 13: Example for Labor Cost Differences ............................................................... 2-18
Figure 14: Country-Specific Cost of Capital/ Risk Premiums ............................................ 2-19
Figure 15: Comparison of Raw Material Costs ................................................................. 2-19
Figure 16: Impacts through Productivity and EoS ............................................................ 2-20
Figure 17: Risk-Management Cycle ................................................................................. 2-21
Figure 18: Risk Types / Focus / Measures ....................................................................... 2-22
Figure 19: Structure of ramp-up costs .............................................................................. 2-22
Figure 20: Method and Scope of Analysis for Selecting Locations ................................... 2-23
Figure 21: Models for location selection ........................................................................... 2-24
Figure 22: Pro's and Con's Knockout Method .................................................................. 2-24
Figure 23: Pro's and Con's Portfolio Analyze ................................................................... 2-25
Figure 24: Pro's and Con's Strategic Location Concept ................................................... 2-25
Figure 25: Dimensions of Location Decisions .................................................................. 2-27
Figure 26: Different Strategies for Low-Cost Countries .................................................... 2-28
Figure 27: Advantage of Adjusting the Automation for Low-Cost Countries ..................... 2-28
Figure 28: Extent of Adoptions to Local Requirements .................................................... 2-29
Figure 29: Ways to Adjust Production technology and Product Design ............................ 2-31
Figure 30: Automated vs. Manual Assembly .................................................................... 2-32
Figure 31: Manufacturing Alternatives.............................................................................. 2-32
Figure 32: Transparency throughout the Trade-Offs ........................................................ 2-33
Figure 33: Comparative of Integration Depth and the Affect on the Labor Costs .............. 2-36
Figure 34: Example Adaption of Production Technology .................................................. 2-36

V
Figure 35: Integrated Strategy for Globalization ............................................................... 2-37
Figure 36: Identifying Strategic Objects and Urgencies .................................................... 2-38
Figure 37: Generating a Strategic Location Concept ........................................................ 2-40
Figure 38: Implementation and Management ................................................................... 2-41
Figure 39: Emphasis of Global Leaders ........................................................................... 2-42
Figure 40: Advantages of Market Leaders ....................................................................... 2-42
Figure 41: Criteria for Site Location ................................................................................. 2-43
Figure 42: Indicators that Support is needed ................................................................... 2-44
Figure 43: Additional Staff Expenditures for a Site Star-Up Abroad ................................. 2-45
Figure 44: Approaches to Staffing New Locations Abroad ............................................... 2-46
Figure 45: Assignment of Local Managers ....................................................................... 2-46
Figure 46: Staff Preparing Schedule for a Posting Abroad ............................................... 2-47
Figure 47: Planned and Actual Ramp-Up Curve .............................................................. 2-48
Figure 48: Sequential Product Launch ............................................................................. 2-50
Figure 49: Parallel Ramp-Up ........................................................................................... 2-50
Figure 50: Out-Leveled Ramp-Up .................................................................................... 2-50
Figure 51: Sequential Process Ramp-Up ......................................................................... 2-50
Figure 52: Comparison of Machine Transfer and Purchase ............................................ 2-51
Figure 53: Transfer Steps of Equipment and Machinery .................................................. 2-52
Figure 54: Phased Organizational Structure .................................................................... 2-55
Figure 55: Selection Matrix for the Degree of Independence ........................................... 2-56
Figure 56: Degree of Dependence ................................................................................... 2-56
Figure 57: Optimization of the Global Supply Chain ......................................................... 2-58
Figure 58: Global Production Program Planning .............................................................. 2-61
Figure 59: Commercial Vehicle Ownership Structure in India .......................................... 2-62
Figure 60: Development of Organized Retail ................................................................... 2-63
Figure 61: Material and Information Flow Analysis (MIFA) ............................................... 2-67
Figure 62: Share of Material Costs for Production in HCC's (Example Germany) ............ 2-69
Figure 63: Cost reduction Potentials for an Automotive Supplier from Relocating ............ 2-70
Figure 64: Time frame for Building Up suppliers (Example: Injection Parts) ..................... 2-70
Figure 65: RFP-Form for Supplier Assessing ................... Fehler! Textmarke nicht definiert.
Figure 66: Form for Calculating Taget Prices ................... Fehler! Textmarke nicht definiert.
Figure 67: Typical Purchasing Organization in a LCC ...................................................... 2-72
Figure 68: Potentials from Supplier Development (India) ................................................. 2-72
Figure 69: Cumulated Global Foreign R&D Investments .................................................. 2-74
Figure 70: Global Labor Market for Engineers ................................................................. 2-78

VI
List of Abbreviations
R&D Research and Development
B2B Business to Business
B2C Business to Customer
IT Information Technology
CRM Customer Relationship Management
MNC Multinational Company
LCC Low Cost Country
EoS Economics of Scale
HCC High Cost Country
SME Small and Medium Sized Company
BU Business Unit
TLC Total Landed Costs
GPF Global Production Footprint
NPV Net Present Value
ROI Return on Investment
OEM Original Equipment Manufacturer
HRM Human Resources Management
SCM Supply Chain Management
JIT Just in Time
JIS Just in Sequence
FOB Free on Board (trade term international logistics)
LSP Logistic Service Provider
CIP Continuous Improvement Process
VSM Value Stream Mapping
RFP Request for Proposal

1-1 Introduction
1. Introduction
The world is changing. Our world as we know it, is about to change. This change isn’t going
to be as quick and dramatic as some prophets want us to believe. But, it will change! Most of
these changes aren’t to happen in our world – the 1th world – it will change the bottom of the
pyramid – the 3th world. But the western country will have to face some dramatic changes,
too. It will come to a migration from the high-tech industry to a service industry, earning most
of its profit by using their knowledge.
Globalization is not a phenomenon. Working in internationalized supply chains with
worldwide, cross functional collaborations is the state of the art.1 Globalization is
accelerating by low cost of communication and decreasing costs of shipping and transfer all
over the globe. International integration is growing and rising exponentially since the 1980s.
It is heated by a huge technical progress and the fall of trading barriers and custom duties.
Since them, companies went over to work in cross organizational networks, learned to
source and sell globally.
Figure 1: Development of Globalization2
By the beginning of the 21th century this trend changed in to a high of accelerating the
growth of collaboration. Customers no longer change goods through borders, they change
1 Abele, Meyer, Näher, Strube, Sykes (Global Production, 2008) p.1
2 Cf. Abele, Meyer, Näher, Strube, Sykes (Global Production, 2008) p.4

1-2 Introduction
stuff, work on global projects from different continents on a 24/7 base. Reducing the time to
market and lever the potentials of different locations.
Functions, like HR, R&D, production and marketing, are well spread throughout the
world. But this isn’t the challenge of or new world, it is to work in corporative functions, to
adapt and lever always the best of each location. It is time to manage this summery of global
locations as a network, using digitized technology to connect the advantages of know-how
clusters to create a global knowledge network. - This development has just begun, and is
leading to a new century of information -
1.1 The world is changing throughout global trends
The future is unpredictable – is a common statement of or time. Everything is changing
faster and faster, nobody alone is able or has the capability to predict the future. But the
performance of prognostic and especially the performance of predicting mega-trends aren’t
as bad as it may seams. Fulfill forecasts are boring, because they appeared to be true and
are now a part of our everyday life.3
Germany is a special area for future trend scouting. Everybody is specialized in his own field
of production. It’s a land of specialists. But specialization makes us blind for future trends.
Predicting the future by using only forecasters of the own special field can lead to a
disastrous result. Innovations normally appear in weak signals out of the own industrial
business. After a period of unknowingness, these innovations have a big breakthrough to the
own business. Companies not prepared for this, could miss the chance of being at the pole
position. They could end up in the role of the follower or totally miss the game in a new
business.
But technology innovation is not the biggest driver of changes of our today’s future. It is the
social change and the connection of information. It is more and more about social
relationships, education, personalization, individualization and the access to information, like
knowhow, data and specialists, worldwide.
So it is the most important role for our industries to analyze this trends and have always an
eye in different industries not related to the own, and relocated and adjust the business to
ongoing developments in the market.
3 Cf. Horx, Huber, Steinle, Wenzel (Zukunft machen, 2007) p. 15

1-3 Introduction
Figure 2: Mega Trends4
These trends should be faced by every company worldwide. Not all and not at the same
time, but they have to be observed and taken into account in every overall strategy meeting.
The five yellow market trends are going to have the biggest impact to our future business. All
of these trends transcend to smaller steps and can be broken down to the core business of
every company.
Figure 3: Trend Typologies5
4 Cf. Horx, Huber, Steinle, Wenzel (Zukunft machen, 2007) p. 36

1-4 Introduction
These trends should be identified, filtered, evaluated and implemented in today business
strategies. However, they can be used as new ways to innovation and define key strategies
for future markets.
So these trends will have huge importance to our next step of business and a major impact
to the industrial production footprint.
1.2 Growth of the lower end (the 3th world)
One of these trends is the now accelerating globalization with a major development of the
3th world. Up to the year 2015 there will be 7.2 billion people on earth, and two thirds will be
out of poverty, that’s nearly 2 billion more than now, this means that in 5 years there will be a
new lower mid-class of about 2-3 billion people. Throughout this, there will be billions of
people who want to buy their first car, there first TV, there first house, and there first
vacations. This people will have a high influence to business and production. Production and
business will develop or migrate to this country of demand. 2-3 billion new customers will
lead to a market 24-time larger than the German.
Figure 4: Decreasing poverty6
5 Cf. Horx, Huber, Steinle, Wenzel (Zukunft machen, 2007) p. 31
6 Cf. Horx, Huber, Steinle, Wenzel (Zukunft machen, 2007) p. 121 ff.

1-5 Introduction
Figure 5: The Economic Pyramid7
Now it would be a mistake to think that western industries could deliver these markets from
their home base. These are total different markets with different needs and habits. These
markets have to be seen as new source of demand and innovation. But, how can you
enter a market, that magerial exists, in whom the purchasing power isn’t high enough
to buy any of western products? The solution is empowerment of the customers.
Customers have to be empowered in all of their problems, purchasing power, knowhow,
skills and abilities. Companies how want to make business, have to help their customers to
gain new strong business. There are several good examples like of the firm ICICI in India8,
or the firm CEMEX in Mexico, how empower their customers and helped them through new
business innovations.
With Empowerment to Business
Realize the new growth opportunity of the private sector and the huge potential for
innovation at the bottom of the pyramid. Old solution will not create markets at the bottom of
the pyramid. 9 If you want to get strong position in the market, you will have to implement
services out of your core products and services. Services stepping out to empower the poor,
7 Copyright © 2007 Campus Verlag, Frankfurt a.M./ Horx, Huber, Steinle, Wenzel (Zukunft machen,
2007, CD Anhang zu Kapitel 5), Abb. Arm und Reich global – die >>Globalen Aufsteiger<< kommen 8 Cf. Prahalad, Krishnan(The new age of innovation, 2008) p.60 ff.
9 Cf. Prahalad (The Fortune at the Bottom of the Pyramid, 2005) p.3 ff.

1-6 Introduction
creating sustainable improvements for the people you are bringing service to. Therefore you
need understanding and sympathy for the specific and emotional situation the people living
in.10
One of the best examples for this empowerment of the poor is the firm ICICI, who is giving
micro credits to self-help groups. First they teach them how to save money, - learn to save -
, by saving per woman 1 Dollar a month, up to 120 Dollar inclusive interests in sum. In the
second step than they learn how to lend money to others, - learn to lend what you have
saved -, in the most cases for medical emergencies. By taking these two steps the groups
qualifies for the final step. The group is taking a credit over 5000 Dollar (250 for each
person), - learn to borrow -, for buying cattle, land or open a small shop.
This concept is so successful that the ICICI have a 99 repayment rate and makes the ICICI
to one of the major players in the Indian market.
1.3 Business Transformation
Forget by digitization, ubiquitous connectivity, and globalization, there is a fundamental
transformation of business underway. This will radically alter the nature of companies and
how they create value. No industry is immune to this mega trend. It will impact traditional
industries such as education, insurance, health care, automobiles, as well as new emerging
industries such as life extension, social networks, and augmented reality. Coming to terms
adoption of this changes is critical for survival and growth. The main transformation will be
based on two basic pillars:11
• Value will be based on unique, personalized experiences of customers. Firms have
to learn to focus on one personal customer at the time, even if they serve thousands
at the moment. The customer has to be the center of individuality.
• No company will be big enough in scope and size to satisfy customers experience at
the time. Companies have to learn how to act in a global ecosystem, using and
accessing resources from a wide variety of other big and small firms. The focus will
change from ownership of resources to an access orientation of resources.
10
Cf. Horx, Huber, Steinle, Wenzel (Zukunft machen, 2007) p. 126 11
Prahalad, Krishnan (The new age of innovation, 2008), p.10

1-7 Introduction
That means to companies:
1. Companies have to move from selling a product to selling a service. The value is the
service, where therefore the product is reduced to an integral part of the service.
2. Companies have to move from a transactional relationship with a customer to a
service relationship with the customer. That means that companies have to move to
service, solution, and a superior experience for individual customers.
3. Furthermore companies serving a B2B organization will have to act like a B2C
organization in a more and more converge way.
In general, that means the value of a product will shift from the physical product to solutions
to experiences. The B2B and the B2C coverage for the individual customer experience.
Companies will not have all the resources they need to create unique personalized
experiences. Therefore, it will be crucial to open up an access to talent, components,
products, and services from the best sources worldwide. Internal management has to be
adjusted to a flexible system, for more flexibility in continually configuring resources in a
global ecosystem. But the main task will be to develop the organizational abilities to focus on
one customer from the millions, that implements every part of firms structure (IT, R&D, CRM,
etc.)
1.4 Cross cultural leading
The world is now seeing a new dramatically increasing connectivity around the globe.
Manager and organizations have to expand their repertoires of skills in a global context.
International management is no longer a limited jet setting troubleshooting or expatriatel
management of global located businesses. Businesses are now working in international
supply chains and cross functional collaborations.12 This makes it difficult to identify a
product which is not somehow influenced by an international supply chain. International
contacts and responsibilities are directly linked with different cultures without even leaving
the office. Changes in economics, politics, and technology lead to a new kind of international
12
Cf. Abele, Meyer, Näher, Strube, Sykes (Global Production, 2018)

1-8 Introduction
managers, facing new tasks and functions of globalization in terms of economic, legal,
political, technological, and cultural elements. 13
The most underestimated and neglected part is the cultural aspect of different nations. It is
the biggest cause for failing business with international partners. Managers have to face new
and total different cultural than their own. Working with that, managers needs to have broad
soft skills and cultural awareness in every possible manner. For example, in Asian countries
people understand the fact of being copied as a great honor to them personally; in western
countries it is always seen as product piracy. Or, working with Indian stuff, you cannot let
work different casts working together as a team, with equal rights, or making someone from
a lower cast leading the team. However, that might change but only in “generations or
decades”, but now it is the normal way of doing business. So, dealing with foreign countries
is not as easy as it might first appear, there can be a great variety in understanding of
contractual terms, copyrights, and habits.
1.5 The requirement of going global
Why is it a necessity to go global?
Globalization is not a new mode; it is the biggest and most persistent trend which will affect
all of or lives. Globalization has taken a new pace, scope, and scale in the 21st century.
Since we know from be building up of the European Union, the wage gap, between newly
industrialized and developing countries, is not going to close soon. The factor of costs and
growth are widening the disparity in the attractiveness of different production locations.
Liberalization of markets and the reduction of trade barriers also lead to new centers of
economic. Declining transaction costs for transport and communication, promotes the
globalization in accelerating speed.14
13
Cf. Thomas (Cross-Cultural Management, 2008)p. 3 ff. 14
Cf. Abele, Meyer, Näher, Strube, Sykes (Global Production, 2008) p.9
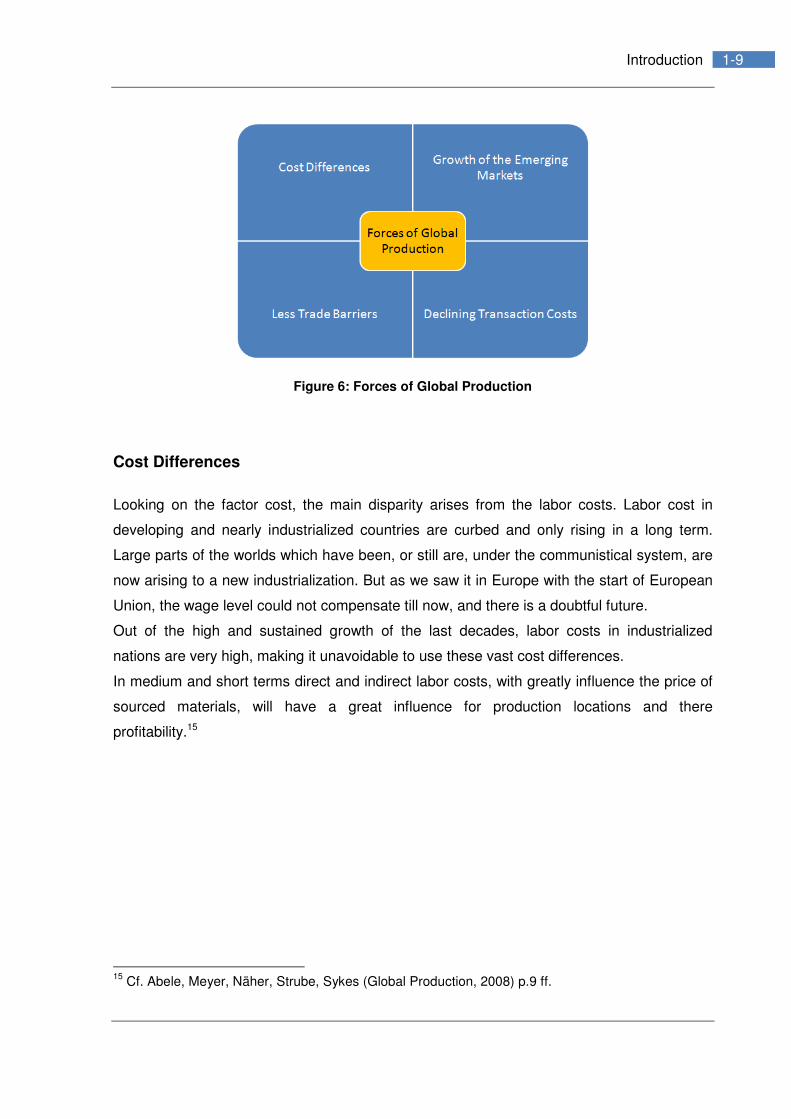
1-9 Introduction
Figure 6: Forces of Global Production
Cost Differences
Looking on the factor cost, the main disparity arises from the labor costs. Labor cost in
developing and nearly industrialized countries are curbed and only rising in a long term.
Large parts of the worlds which have been, or still are, under the communistical system, are
now arising to a new industrialization. But as we saw it in Europe with the start of European
Union, the wage level could not compensate till now, and there is a doubtful future.
Out of the high and sustained growth of the last decades, labor costs in industrialized
nations are very high, making it unavoidable to use these vast cost differences.
In medium and short terms direct and indirect labor costs, with greatly influence the price of
sourced materials, will have a great influence for production locations and there
profitability.15
15
Cf. Abele, Meyer, Näher, Strube, Sykes (Global Production, 2008) p.9 ff.

1-10 Introduction
Growth of the Emerging Markets
The main activity in home markets of industrialized countries is to gain market shares from
concurrent companies. Emerging markets therefore experience a high sustainable growth in
market volume. These markets are becoming more and more attractive as a result. This
growth has now become the key motivator for the globalization of production.16
Figure 7: GDP Growth in 200817
Declining Transaction Costs
Transaction cost of any kind like transport costs or information transfer, has moved down to
a low in costs, and is still decreasing. Historically the transportation cost has been the
biggest cost factor for global trading. Nowadays, it can be efficient to move goods with a low
value density through the world. Ships and harbors are getting bigger and bigger, fighting for
transshipment, automating everything in the chain, and minimizing the crew. Cost of fuel,
salaries and fees are spreaded on more and more containers.
But none of these barriers for the globalization had such a great influence like the progress
in communication. Today’s communication is based on real time, sending R&D blueprints
through the world in a second, controlling and steering remote locations with a direct
response. And this technology is still in its infancies.18
Less Trade Barriers
The political changes of the last two decades changed the world in accessibility and
liberalization as never known before. Eastern Europe, Russia and China have become
attractive markets for all kinds of goods. Exports and imports are more and more increasing.
This countries are liberalizing there trade, improving their protection of intellectual rights,
eliminating custom fees and quotes. In this development emerging markets are getting more
16
Cf. Abele, Meyer, Näher, Strube, Sykes (Global Production, 2008) p.9 ff. 17
www.cbs.nl 18
Cf. Abele, Meyer, Näher, Strube, Sykes (Global Production, 2008) p.9 ff.

2-11 Global Production and Business Engineering
attractive and competitive in the globalization process. But sill, there are a lot of areas
deregulation have not reached yet, protecting their own national companies from
competition.
India and China as the biggest countries, and the biggest beneficiaries of the globalization,
have started some big initiatives to reduce regulations and protections. Today protection is
getting a danger for the growth of markets. Companies are not anymore interested only in
quick profits, to make in a market; they try to gain a sustainable a business. Custom duties
have been historically a source of governmental income. Now governments have to
deregulate to generate or develop business at all.
Regional economic alliances, like free trade zones and customs unions, with zero tariff on
the moved goods, and standard tariffs for non-members, aim to create a win-win situation for
all their members. So that members get a better access to markets and can better use the
economics of scale in higher production volumes.
2. Global Production and Business Engineering
Global Production and Business Engineering

2-12 Global Production and Business Engineering
The process of building up a new production in an emerging market can mainly be divided
into 4 Phases:
• 1th phase: After a previous phase of generally generating an ambition to go global,
the 1th phase starts. This is a pre-phase of definition to analyze the initial or starting
situation, setting target aims and tasks, assessing alternatives and making pre-
decisions.

2-13 Global Production and Business Engineering
• 2nd phase: The 2nd phase is the framing or the structure creation process of the
company’s global footprint by modeling and recreation of holistic business processes
and strategic location concepts.
• 3rd phase: In the 3rd phase the production ramp-up phase, it is to avoid potential
mistakes and lever all potentials you can get.
• 4th phase: The last phase 4, can be described as a after or sustainability phase,
using further strategies in management by applying best-practice, levering the
potentials of sourcing and aligning the global R&D (research and development)
interface.
Figure 8: Global Production Engineering Process

2-14 Global Production and Business Engineering
2.1 1th Phase – Pre-Phase
2.1.1 Assessing the Selection Criteria19
As all companies, no matter in which specific area of business, have their on specific
processes of operations to fulfill customer needs, every company has to define their own
business objectives for building up a new production site in an emerging market customized
to their own business and the strategic goals. Therefore, there are multiple factors, for with
location is best for producing a product. Setting this up can be a very complex task facing
different economies and cultures.
This makes it necessary to work with facts over specific countries, creating road-
maps, enabling decision makers to find the right key-factors for or against a specific location.
Often companies neglect the most of the existing key-factors, only looking to the wage level.
This leads to desperate migration and poor success stories of the most companies in
emerging markets. Key-factors like the availability of qualified stuff, logistic costs, exchange
rates, and lots more.
To evaluate specific production locations it is a necessity to evaluate the howl network,
location parameters and process parameters can be really different. This two distinctions
help to understand the economics and the operational aspects. Analyzing a product or a
product line by individual available locations, including process parameters could reveal high
cost potential and lead to better or the optimal strategic decision.
19
Cf. Abele, Meyer, Näher, Strube, Sykes (Global Production, 2008) p.35 ff.

2-15 Global Production and Business Engineering
Location parameters Process parameters
(product- and production-related factors)
Factor costs Labor costs (by skill level) Input factor volumes Labor time (by skill level)
Cost of capital Capital employment (plant
and equipment)
Cost of materials Purchased parts/ raw
materials
Productivity Labor productivity Parts (made in-house)
Capital productivity Space requirements (land
and buildings)
Other quantitative
factors
Distance from relevant
markets Other quantitative
factors
Volume and weight
Potential restructuring and
closure costs delivery time requirements
Freight rates Maintenance costs
Qualitative factors Availability of land,
infrastructure, and right and
ownership
Qualitative
requirements
Process complexity
Protection of intellectual
property Know-how intensity
Regulations, work safety,
guidelines Environmental
requirements
Figure 9: Site Selection Factors20
Location parameters are characteristics for geographic locations and show the
attractiveness of a “specific process” of a product. Process parameters picture the
manufacturing process and the special characteristic of a product.
These parameters can be very useful in the pre-selection process of possible countries and
locations. Qualitative parameters, because of their often subjective view, should be listed at
the very end of such a comparison enabling transparency for managers.
Perspectives are varying between locations, regions, industries, products, processes, and
the company itself and can affect the importance of different locations. Companies with a
strong brand name can attract more skilled employees than other, but are expected to pay
more. Vice versa, companies without a strong brand name poorly attack skilled workers.
However, productivity and quality are generally more depending on the company than the
location. To be successful companies should first estimate there capability of influencing
global productions, their ability to train stuff and to create the business environment they
need. Successful global players, confident in there global abilities, primarily use the
20
Cf. Abele, Meyer, Näher, Strube, Sykes (Global Production, 2008) fig. 2.1

2-16 Global Production and Business Engineering
opportunity to reduce costs via lower labor expenses and increase sale with greater market
proximity.21 But also behavioral patterns from the country of origin influence the importance
of considered parameters.
Figure 10: Relevance of Location Criteria22
As the number of parameters can be extreme and vary greatly, analyses should be divided
in levels of geographical scope, preselecting and determine in each step. It should start with
a global view and been broken down to a short lists with detailed information’s to specific
locations.
Figure 11: Scope of Analysis and Relevance of Location Parameters23
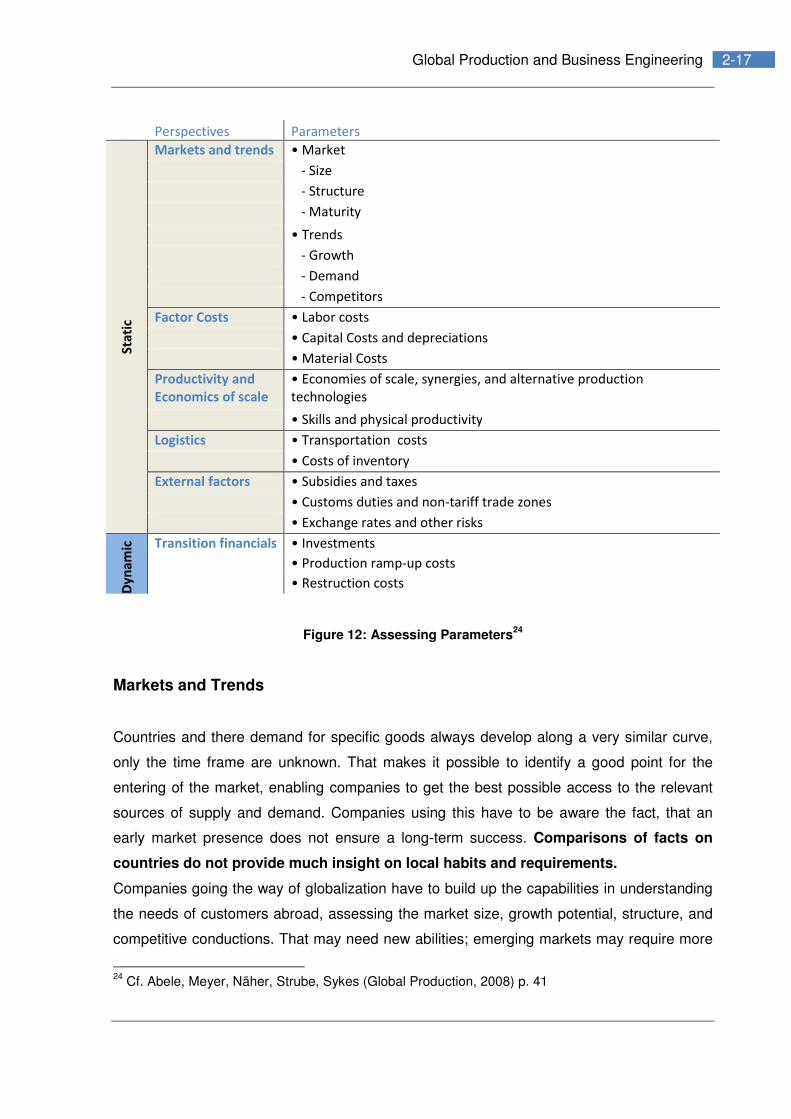
Input parameters can be shortly divided into two sections the static perspective and the
dynamic perspective. The static perspective is looking at network operating costs, which
influence the landed costs of products. The dynamic perspective focuses on the costs of
transition or migration, on costs that apply to the transition phase.
21
Cf. Abele, Meyer, Näher, Strube, Sykes (Global Production, 2008) p. 38 22
Cf. Abele, Meyer, Näher, Strube, Sykes (Global Production, 2008) p. 39 23
Cf. Abele, Meyer, Näher, Strube, Sykes (Global Production, 2008) p. 40
2-17 Global Production and Business Engineering
Perspectives Parameters S
tati
c
Markets and trends • Market
- Size
- Structure
- Maturity
• Trends
- Growth
- Demand
- Competitors
Factor Costs • Labor costs
• Capital Costs and depreciations
• Material Costs
Productivity and
Economics of scale
• Economies of scale, synergies, and alternative production
technologies
• Skills and physical productivity
Logistics • Transportation costs
• Costs of inventory
External factors • Subsidies and taxes
• Customs duties and non-tariff trade zones
• Exchange rates and other risks
Dy
na
mic
Transition financials • Investments
• Production ramp-up costs
• Restruction costs
Figure 12: Assessing Parameters24
Markets and Trends
Countries and there demand for specific goods always develop along a very similar curve,
only the time frame are unknown. That makes it possible to identify a good point for the
entering of the market, enabling companies to get the best possible access to the relevant
sources of supply and demand. Companies using this have to be aware the fact, that an
early market presence does not ensure a long-term success. Comparisons of facts on
countries do not provide much insight on local habits and requirements.
Companies going the way of globalization have to build up the capabilities in understanding
the needs of customers abroad, assessing the market size, growth potential, structure, and
competitive conductions. That may need new abilities; emerging markets may require more
24
Cf. Abele, Meyer, Näher, Strube, Sykes (Global Production, 2008) p. 41

2-18 Global Production and Business Engineering
product types and variants, significant changes in R&D and manufacturing, and the ability to
fight with aggressive competitors, low-cost countries usually have.
Factor Costs
• Labor costs
Developing and newly industrialized countries have a very significant labor cost advantage,
and therefore an enormous advantage on the cost of goods manufactured.25 This fact is
often overlooked for the price of sourced goods, and can lead therefore to a major
advantage in the capital costs and the utility of investment.
Companies with a high demand of skilled work force should be aware of high wage
differences in LCCs (low cost country) markets. A variation from 1 USD per day for an
unskilled, to 100 USD per day or more, for a skilled person is normal. This can vary through
countries, regions, industries, and skills needed. This trend is expected to continue for the
next 20-30 year, for china and India it is more likely to be 50 years.26
Figure 13: Example for Labor Cost Differences
Only MNC’s (multinational companies) have a better position in stuff recruitment. Out of their
brand names these firms can attract young high qualified management stuff, which want to
further their careers.
• Costs of capital and depreciation
As investments are always a risk, cost of capital are not simply to measure. Political stability
and social conditions can jeopardize the payback of such investments. As these conditions
can vary through regions and locations, the varying depreciation rate should be calculated
and factored in as a location parameter. Avoiding multiple investment risks and calculations,
there can be used country-specific cost-of-capital rates.
25
Cf. Gutenberg (1965) 26
Cf. Abele, Meyer, Näher, Strube, Sykes (Global Production, 2008) p. 50 ff.

2-19 Global Production and Business Engineering
Figure 14: Country-Specific Cost of Capital/ Risk Premiums27
• Material costs
Generally material cost amount 50-80 percent of costs of goods manufactured. This can be
distinct between product specific materials from suppliers, standardized materials, and raw
materials. Companies should be aware of the fact that they may have to develop suppliers,
or because of know-how lakes, materials and products are not available at regional markets
and have to be imported. As well as the cost according to the availability, state regulations
and taxation, can lead to high cost deviations, like for energy, water and steel. For some raw
materials the price can differs globally up to the factor 10.
Figure 15: Comparison of Raw Material Costs28
Productivity and Economics of Scale (EoS)
To lever the best of each location, harmonizing the choice of location and manufacturing
technology is crucial. As experiences showed, world-class firms virtually achieve high quality
and productivity anywhere in the world, so that productivity depends most on the
company and location is only secondary.
But still, companies investing in emerging markets focusing on productivity and EoS have to
be aware the facts of low labor and capital productivity (which are directly depending on
each other), low availability and quality of skilled stuff and mangers, low possibilities of
supply and demand, and poor infrastructure. Therefore, more non-complex
manufacturing will have to be implemented, and adjust to the level of education and
infrastructure. This means, that product design, manufacturing and processes have to be
adapt to the location. Complex production technology has to be simplified or exchanged to
non-complex systems with similar properties.
27
McKinsey (Global Production, 2008) 28
Cf. Abele, Meyer, Näher, Strube, Sykes (Global Production, 2008) p. 60

2-20 Global Production and Business Engineering
Adapting these non-complex systems makes it often possible to simplify the production
technology, which can have a high impact to the fixed costs using less machinery and
automation. About that, this leads to minor quantities and more flexibility.
Figure 16: Impacts through Productivity and EoS29
Logistics
Logistic is one headword of or time due to the globalization. Thus to the increase of global
trading logistic cost exploded in there relevance. There are two main costs of logistics, direct
and indirect costs. Direct transportation costs are costs for fright rates, sea or flight transport,
handling, distribution and warehousing. Indirect costs are costs of the inventory like tied
capital, depreciation, cost of extended delivery times, obsolescence and lost sales (due to
stock outs).
Calculating logistic cost accurately on the expected long-term costs is not only crucial in
the decision phase on a future location; it is also for the profitability of the howl production
network. Bottom-up costing or statistical analyses are two methods for determination of
these costs.
Long term analyses showed that transportation is not necessarily more expensive from
LCC’s (Low Cost Countries) than from HCC’s (High Cost Country) and that freight rates are
declining in long term.
Logistics often have an untapped optimization potential due the high changes of logistic
processes, like parallel multi-modal transportation or serial multi-modal transportation
(Appendix 2).
External Factors Going the way of globalization means to go through opportunities and risks at once. New
knowledge and skills are required to face these risks. The reduction of this risk should be
one top point on the agenda. The common way to reduce external risks is negotiate on
29
Abele, Meyer, Näher, Strube, Sykes (Global Production, 2008) Table 2.2

2-21 Global Production and Business Engineering
benefits for location decisions, like subsidies in form of taxes (for sales and earnings),
custom duties. These negotiations should be made parallel with different locations right up to
the end of the decision on a location, gaining most possible direct subsidies.
But also, external factors like exchange rate effects, changes in tariffs and non-tariff trade
barriers, violation of intellectual property rights, and the risk of the unknown and
unforeseeable, have to be taken into account. Professional risk-management is therefore a
crucial necessity.
Figure 17: Risk-Management Cycle30
Risks types Focus
Subsidies and taxes -Parallel conduction with federal and local governments
Custom duty -Optimizing product design
-Non-tariff trade barriers
-Selection production location
Exchange rate effects -Change rate fluctuations
-Duration of transport and lead time
-Market price for intermediate products
-Market prices for own products
-Exchange rates are interdependent
Measures:
Static -Elimination: Adjusting cost and sales footprint
30
Cf. Prof. Dr.-Ing. Randolf Isenberg, SS10 Production Management in TI-MuP HAW

2-22 Global Production and Business Engineering
-Transfer: Price adjustment clauses in contracts
Dynamic -Production: Temporary relocation of production
-Sourcing: Temporary relocation of costs
-Sales: Increase efforts to improve sales in markets with better value
currencies
-Product selection: Combine previous points and push products with
attractive production, sourcing and sales structure
Figure 18: Risk Types / Focus / Measures31
Transition Financials
Building up a new facility in a foreign country usually needs a lot of money. Companies
normally finance this on their free cash flow, selling old facilities and tangible assets in their
home country or by borrowing this investment. But generating cash flow in a ramp-up phase
often does not work, selling of intangible assets can take a long time and borrowed money,
once it is lend, it is hard to get more.
Ramp-ups phases are normally very cost intensive, and can lead in the worst case of delays
to a breakdown of the howl investment. The key factor is ramp-up speed. Firms should be
aware of this, make adequate reserves, spend a lot in the planning phase and push the
ramp-up to gain cash flow.
Figure 19: Structure of ramp-up costs32
31
Abele, Meyer, Näher, Strube, Sykes (Global Production, 2008) p.90 ff. 32
McKinsey (Global Production, 2008)

2-23 Global Production and Business Engineering
2.1.2 Foreign Investments
The most neglected thing in evaluating investment decisions is the evaluation itself. The key
reason why companies fail to capture the full anticipated potentials of global investments
and there network reconfiguration is the weakness in strategic planning and there
overestimation of factor costs and operational improvement. A good level of detailed
accuracy and a more granular analyze can provide more success or the success at all.
A survey of McKinsey/PTW showed that more than two-third of the companies consider only
three or less locations and use none standardized tools or processes in investment
decisions.
Figure 20: Method and Scope of Analysis for Selecting Locations33
Companies should select an approach or a model that best matches their information they
need to reduce complexity and capture the full potential of a global reconfiguration.
Methods chosen for the evaluation should envelope three elements:
1. The evaluation technique used should be one hand appropriate to determine the target
structure and on the other hand be action-oriented and lead to steps of implementation.
2. The evaluation must include the significant upstream suppliers and customers, which
include mainly a big share of total manufacturing costs.
3. Because of evaluations can take a great deal of time and can be much cost intensive,
the proportion between costs and benefits have to be right.
Three Basic Models34
33
McKinsey/PTW (ProNet analysis) 34
Abele, Meyer, Näher, Strube, Sykes (Global Production, 2008) p.104 ff.

2-24 Global Production and Business Engineering
The next figure shows a simple guideline which method can be used by a company based
on their constellation and objectives.
Figure 21: Models for location selection35
• Knockout Process
This method is most suitable for SME’s (small and medium sized companies) with a clearly
defined product portfolio and production volumes. Knockout processes are reducing options
step by step, and therefore only suitable for a small number of locations and interfaces.
Pro's - Simplicity
- Limited effort required
- Quick realization
- Various evaluation techniques can be combined at different levels
Con's - No guarantee of correct prioritization
- Synergy losses between factories
- Higher materials costs due to lack of coordination with purchasing
- Higher transaction costs (transportation, warehouses, customs duties)
- Synergy losses due to uncoordinated choice of manufacturing technology
- Suboptimal use of economies of scale
Figure 22: Pro's and Con's Knockout Method
• Portfolio Analyze
The portfolio analyze is most suitable for big sized companies with independently working
BU’s (Business Units) with overlapping businesses. The objective is to identify those BU’s
with the greatest potential for globalization and relocation.
Pro's - Analysis of the entire company
- Application of the same evaluation methods for all Bus
- Relatively simple
35
Abele, Meyer, Näher, Strube, Sykes (Global Production, 2008) p.105

2-25 Global Production and Business Engineering
- Helps organization to focus on biggest opportunities
Con's - Synergy losses between factories
- Higher materials costs due to lack of coordination with purchasing
- Higher transaction costs
- Synergy losses due to uncoordinated choice of manufacturing technology
- Suboptimal use of economies of scale
Figure 23: Pro's and Con's Portfolio Analyze
• Strategic Location Concept
The strategic location concept is an integrated concept that includes a diversity of products,
production step, and locations, accounting al relevant interactions. This allows it to
reorganize and optimize the howl production network from the bottom.36
Pro's - Integrated analysis of many products, manufacturing steps, and locations
- Synergies fully tapped
- All transaction costs taken into account
- Integrated globalization strategy for production and purchasing
Con's - Complex modeling and evaluation required
- Could overstrain company’s financial/human resources and change capabilities
Figure 24: Pro's and Con's Strategic Location Concept
Dimensions
But also, where different evaluation methods exist there are lots of different existing
perspectives of views on one and the same thing. Perspectives like long or short term 5, 7,
or up to 30 years perspectives like that are valid, there suitability depends on the investment
and the investor.
Investment alternatives can be assessed by a wide range of different aspects and criteria.
Companies should therefore choose a number of indicators and dimension depending on its
specific situation. For better comparison to management criteria should be kept the same in
(similar) investments enabling a better comparison.
36
Abele, Meyer, Näher, Strube, Sykes (Global Production, 2008) p.104

2-26 Global Production and Business Engineering
Dimension Values
Scope along
functions
Non-production functions Production in a broader sense
Sales/distribution
Finance
R&D management
Production capacity per product
per factory
Transport/inventory
management
Procurement planning (in
collaboration with purchasing)
Planning
horizons
Tactical Strategic
Capacity adjustments Opening/closure of locations
Time horizon: > 1 year and < 3 years Target value: present value of
net inflows
Time
perspective and
corresponding
financial
indicator
Static/single-period Dynamic/several periods
More long-term, steady-state conditions Development over time
Target value: costs or profit Target value: present value of
net inflows
Scope of
analysis
Single-stage Multi-stage
One manufacturing step Integrated analysis of several
manufacturing steps
Decoupled view of several
manufacturing steps
Higher complexity due to
interdependencies,
e.g., inventory
Mapping of dependencies, e.g.,
using bills of materials
Type of analysis Qualitative Quantitative
Nominally or ordinal scaled
characteristics, e.g., “good”
infrastructure
Metrically scaled attributes, e.g.,
sales, production volumes
Knockout criteria, analysis of locations
along strengths and weaknesses
Landed cost analysis, NPV
calculation of redesign of
network configuration
Granularity Macro-environment Micro-environment
Example: high political stability Example: costs per effective hour
worked
Analysis of groups of issues/summary
indicators
Analysis/evaluation based on
detailed individual factors
Uncertainty Deterministic/certainty Stochastic/risk
Parameters are regarded as certain Parameters are subject to
uncertainty
Problem-solving
precision
Exact Heuristic
The solution definitely represents the
global optimum
The solution only represents the
global optimum by chance
Problem-solving Simulation Optimization

2-27 Global Production and Business Engineering
method Achievement of target value(s) Determination of the result by
optimizing the target value(s)
using an algorithm Extension via stochastic choice of profit
parameters
Result specified
Figure 25: Dimensions of Location Decisions37
Companies successfully going the way of globalization should be familiar with the most
appropriate approaches, analysis techniques, and tools. Redesigning the production network
will be the most improving competitive and sustainable method in the future. However,
existing investment analyses fail to adequately consider network effects emerging out of the
interdependencies between global products and plants.
2.1.3 Adjustment of the Production Technology38 (Reengineering)
Setting up new production locations abroad should not mean one-to-one transfer of
company’s manufacturing technology. Using the same manufacturing methods and product
design as at home to try to ensure fast, risk-free production of high volumes can lead to false
economy.
Selecting production technology for global manufacturing sites ought to balance the
advantages of standardization against those of local adaptation. Tailoring production
technology to different locations can be highly profitable. It enables manufacturers to use
cost differentials more effectively, adjust production complexity to employee skill
levels, and match plant and machinery to the unit volumes required at that site.
Production technology may also need adapting to allow changes to the work-piece
design, such as to suit local taste or customs regulations.39
37
Abele, Meyer, Näher, Strube, Sykes (Global Production, 2008) p.114 38
Abele, Meyer, Näher, Strube, Sykes (Global Production, 2008) p.192 ff. 39
Abele, Meyer, Näher, Strube, Sykes (Global Production, 2008) p.192

2-28 Global Production and Business Engineering
Figure 26: Different Strategies for Low-Cost Countries40
The trouble is that this adjustment to the local productions broadens the portfolio of product,
variants, and technologies a company has to maintain, that creates new complexity and
drives costs. Therefore, companies should carefully manage the number of variants and
production technologies they have.
Three Basic Options of Adjustment:
1. Complex technologies with high development costs should stay unchanged through
global locations.
2. Less complex and with a grater scope of reconfiguration in technology, firms should first
use legacy or proven processes, without modification of the product design. For example
work piece handling and transport, or process changes that did not change or affect
product characteristics.
3. The next option or a further step could be the change to the work-piece design; this often
allows using easier technology or even total different manufacturing methods and
machinery.
The next figure shows how the automation level can significantly decrease cost of goods if
the automation level is adjusted to the locations general ability. An adjusted automation
enables local stuff to gain economies of scale and enhance the learning by doing.
Figure 27: Advantage of Adjusting the Automation for Low-Cost Countries41
No matter for what reason a company is planning to move, be it for cost reasons or for
developing new markets, companies should consider adoptions to gain advantages of costs
effects and production volumes. It can be unwise to transfer existing products and
production techniques, without a previous test of feasibility. Different languages mean
different worlds;42 local markets require modifications in functionality, design, and price. That
all lead to changes in production and the related cost.
40
Dubbel, 1994; McKinsy/PTW (ProNet analysis) 41
McKinsey/PTW (ProNet analysis) 42
Based loosely on Richerd D. Lewis (When Cultures Collide, 2009)

2-29 Global Production and Business Engineering
This makes it necessary to adopt at least two different forms of production
technology: One for high-cost countries with a high capital intensive production and
one for low cost countries with a flexible, simple, and labor-intensive production.
Transferring the same production technology and design to low-wage countries can result in
a production that is too high automated and thus too capital-intensive, complicated, and
inflexible.
The next framework should help companies integrate a side-specific manufacturing
technology into their globalization strategy.
Factor costs - Low labor cost make labor-intensive manufacturing more profitable
than Capital-intensive
Skills & qualifications - Lack of qualified stuff lead to use easier production methods
Unit volume and
flexibility
- Lower volumes make different production technologies more
attractive, and vice versa
Customer requirements
and local supplies
- alternative materials, new tolerances, different features, piece is
often more preferred than quality (overall simpler products)
External conditions and
risks
- requirements for product parts and assembly sequences, prevent
know-how drain and product piracy
Figure 28: Extent of Adoptions to Local Requirements
Companies should not underestimate this five facts and there effects through their business.
Some of them can cause costs, but other can hinder the market access, further, other can
destroy the howl competitive advantage or build up new competitors. This effect can be
mostly seen in China or India, where not only product and processes are copied, howl
production facilities and distribution ways are copied and rebuild. Company can only avoid
this by making sufficient measures in the pre-process of migration to a new location,
especial in emerging markets where fast moving competition can be found, willing to go
every possible step to gain market share.
Entering new markets mean quite always specific functionalities or designs, depending on
the industry, product, regions, cultures, and markets as well. Products have to meet local
expectations, mostly based on the product price. Therefore, companies have to make their
product more affordable for lower-income customers. Entry prices have to be very low,
sometimes for western countries unbelievable low, what can lead to an underestimation of
the price target, which has to be met. Emerging to a LLC (Low Cost Country), companies
have aggressively to stick to their target unit cost, by defining their product features to it.

2-30 Global Production and Business Engineering
Options for Adjustment
• Alternatives for Manufacturing Processes
For every “basic” manufacturing process there are multiple alternatives available, with
similar or variable process parameters.
For example joining: Assembling, Filling, Pressing against/into, joining by metal forming,
joining by welding, gluing and so on.
• Adjustment of Existing Processes
Adjusting existing processes can have important effects and implications. Changes in
manufacturing technology and product design are interdependent. This will inevitably alter
the product’s characteristics and should be adequately analyzed by the management. That
means that you may end up creating new variants, products with maybe small changes, but
they will be different and they will create one-time costs and more complexity in products
and equipment.
Level of
adjustment
Production Technology Product Design
Low Adaptation of materials flow Adaptation of auxiliary parts
• Automation of materials flow and
handling
• Storage technology
Linking of work stations
• Mounting elements
• Covering elements
• Fastener
Adaptation of quality control
• Scope and automation of quality
control
Moderate Adaptation of work piece handling Adaptation of product design (core
components)
• Loading and unloading of
machines
• Automation of work piece
mounting and assembly
• Material
• Shape
• Tolerances
• Surface
• Quality
Adaptation of jigs and tools
• Adaptation to local supply
• Adaptation to local requirements

2-31 Global Production and Business Engineering
Adaptation of process control and
parameters
• Computer-controlled vs. manual
processing
• Processing parameters
Comprehensive Adaptation of the production
technology and process chain
Adaptation of product functionality and
value to the customer
• Altered machinery and plant
• Alternative manufacturing process
• Alternative process sequence
• Modified functional principle
• Change in size and capacity
• Modified area of application
Figure 29: Ways to Adjust Production technology and Product Design43
Adjustment Concepts
There are three basic concepts of adjustment:
1. Adapting the production technology “without” changes to the design
This Strategy is mainly used to reduce capital intensity or automation in LCC’s by using for
example simple and manual workstations for assembly. This Strategy allows low production
volumes and competitive costs by variation the level of automation.
But OEM’s (Original Equipment Manufacturers) have to make some additional work in this
process, to ensure high process reliability. Manual work needs new additional guidelines,
process descriptions, and quality control cards. As well as in the ramp-up phase, there have
to be taken major changes to the production technology, the budget, and the time due to the
preparation of manufacturing notes and examples for training.
“Simplicity = Productivity”,44 this equation is especially true for low-wage locations. That
also applies for control mechanisms. Checklists, tallies, and control cards are better than
correlation diagrams and regression calculations. In general the usage of all, easy to use,
Japanese lean production techniques. But this has to be adequately developed, planed and
tested in advance.
43
Cf. Abele, Meyer, Näher, Strube, Sykes (Global Production, 2008) 44
Abele, Meyer, Näher, Strube, Sykes (Global Production, 2008)
2-32 Global Production and Business Engineering
Figure 30: Automated vs. Manual Assembly45
2. Adapting the production technology “with” changes to the design
Allowing changes to the product design opens up adaptations to the core manufacturing
processes. That gives production engineer a broader flexibility to adopt the product to a
specific location. But Management has to be aware of one-time costs, more product variants
and lacks to standardization. Changes to the design, especially in the automotive or aviation
industry, need to be approved audited, that can be expensive and time-consuming.
For example, it can be used integral design than differential design: Simpler joining for
connection (forming or gluing than welding), simpler test devices for quality control (Poka-
Yoke) and simpler sometimes poor tolerances.
Figure 31: Manufacturing Alternatives46
3. Global Standardizing
In other industries customer requirements are fairly similar worldwide; quality guidelines are
strict and prohibit changes to product design and process technology. In this industries using
different designs and production processes can lead to a significant disadvantage in
competition. The key is to adopt dominate production methods and meet future standards as
quick as possible to gain strategic competitive advantage as a fast mover with best quality
and costs of goods manufactured.
Assessment and Selection To find the optimum in the production technology portfolio, mainly the level of automation,
further adoptions have to be taken to determinate labor costs, capital costs, technical know-
how, and the number of variants. To find the right production technology there have to be
build up further knowledge about the trade-offs, staff capabilities and mindset.
45
DS Engineering, McKinsey/PTW (analysis) 46
McKinsey/PTW (ProNet analysis)

2-33 Global Production and Business Engineering
First there should be transparency around the trade-offs clarifying the advantages and
disadvantages of adapting process to a specific location, the trade-offs throughout customer
expectations and the capabilities of the company’s own stuff. The next step would be to
analyze the impact of the adaption whether an existing production technology is suitable and
what the opportunities of adaptation are. The last step would be to analyze the howl
production network in a broader context. If adaption is required for a specific location, but
reengineering is too expensive, expanding existing production locations could contain more
advantageous.
Transparency
throughout the Trade-
Offs
Opportunities - Substitution of labor by capital and vice versa
- Adjustment of production complexity and
requirements to local conditions
- Adjustment of production volumes
- Adjustment of product specifications to local
market requirements and preferences
Cons - Location adjustments can cause costs, especially in
a holistic perspective
- Local adaptations hinder standardization
- Process and product redesign entail one-off costs
- Adaptations take time
- Changes entail market risk
Figure 32: Transparency throughout the Trade-Offs47
47
Cf. Abele, Meyer, Näher, Strube, Sykes (Global Production, 2008) p. 222 ff.

2-34 Global Production and Business Engineering
2.2 2nd Phase - Designing a Global Footprint48
Optimization of the global production footprint can lead to long-term saving from up to 20
percent and 40 percent for companies with old or legacy structures in western countries.
This savings are based on the TLC49 (total landed costs) which therefore led to a major
impact of the firms’ competitive advantage. But also, optimizing of the global production
footprint creates new opportunities in production, sourcing, and more important, it can open
up new markets.
Using all benefits of an optimized GPF (global production footprint) means to implement an
integrated perspective that involves multiple factors along the value chain and include
impute factors, factor from labor costs and productivity, materials, energy, logistics, as well
as customs, taxes, and exchange rates. But these factors are aging and altering in ongoing
economics, so that these perspectives have to be measured in a new quantitative way.
However, these new approaches does not mean that every western location have to be
closed and migrated to emerging markets. Management should take improvement measures
like lean manufacturing into account and work always with a transition plan which is aiming
to the target structure focusing on speed and the sequence of migration. That means that a
global adjustment always sees the howl network and their interactions to optimize net
present value (NPV) and return on investment (ROI).
The challenge is to create an integrated approach folding production into a global operations
and growth strategy, with the key performance on dynamic reactions to market changes.
This has to be proactive developed by the management in regularly reviews and measures.
Up till now, companies with new manufacturing locations make on average a 13 percent
saving on cost of goods manufactured, a very low figure. How is that possible? 13 percent
cannot be enough to make up the increasing logistic costs, inventory, cost of capital, and the
48
Abele, Meyer, Näher, Strube, Sykes (Global Production, 2008) p.140 ff. 49
TLC includes manufacturing, materials, and logistic costs, customs, and duties up to delivery of the product to the customer.

2-35 Global Production and Business Engineering
additional work of management. The problem is companies fall far short of their cost
reduction aspirations when reconfiguring their global footprint; mostly they act too
slow and only incrementally.
The main reason is, as noted in Chapter 2.1.2, the use of conventional location planning
techniques on foreign investments. This results in decisions that lead to higher cost of the
interface. These costs have not been précised in the advance of the investment.
Conventional approaches of evaluation do not contain these factors, so that companies tend
to ignore these additional costs.
• The Holistic Approach
This new adjustment of the global production footprint is a new holistic approach through
company’s entire production network. The location selection is viewed as one integrated
task with the procurement. Bundling multiple factors from labor costs through to customs
duties, accounting there relevant interdependencies. The key goal is to minimize total
production network costs.
This approach works with two different types of view, the greenfield network and the
brownfield perspective. The Greenfield shows the ideal target structure (production
network with the minimum landed costs) for supplying all relevant markets. It can be seen as
the structure of a fast moving competitor with all his threats. The brownfield view take into
account all existing facilities and assets, it represent a plan how to get from the given
structure to the target. This is a more realistic view; it includes investments needed and the
cost of changing. This view helps to get a feeling for the speed and sequences needed.
However, this approach will take a lot of time and great deal of effort in analyses and
evaluation. This makes it only worthwhile for medium sized companies, employing hundreds
of employees, with a great will and intention to change.

2-36 Global Production and Business Engineering
• Redesigning
The integration and optimization of the total production and supply chain has a much higher
cost impact, in real, it can achieve nearly twice as much as a standalone optimization.50
Integrated optimization has a major impact to the labor cost factor, as labor costs go
throughout the entire value chain.
Figure 33: Comparative of Integration Depth and the Affect on the Labor Costs
Looking at this, the labor costs affect the material cost, which have mainly a large share of
overall cost. This can lead to a direct increase in profitability.
As well as the labor costs, the adaption of the production technology to the new location can
have a significant high cost impact. That means to use simple or outmoded production
steps. This of course, is dependent on the industry, the product concerned, and the market
expectations to the product. The next figure shows one possible way to down turn the cost
by reducing the automation. This also has a big positive influence on flexibility (design
changes, quantities etc.), leveraging labor cost effects, one-off expenditures, relocation and
migration costs, and the skill level needed.
Figure 34: Example Adaption of Production Technology51
Another step into this is to redesign the location structure, proactively ahead of the
globalization for relevant market. That means to move before all others and relocate
production capacity there where the costs are at a minimum. Companies acting on this will
always have a strategic edge – the first mover advantage.
• Strategic Location Concept
Redesigning a global footprint, need an approach that ensure systematic planning and focus
on the elements and parameters that have the greatest leverage on financials and
operations.
50
Cf. Abele, Meyer, Näher, Strube, Sykes (Global Production, 2008) p.142 51
Abele, Meyer, Näher, Strube, Sykes (Global Production, 2008)

2-37 Global Production and Business Engineering
This approach can be divided into 4 phases that can help to manage complexity of
redesigning a network. The 1th phase is a determination of essentials. It helps to identify
urgencies and strategic objects, and is therefore the groundwork for following comparisons.
The phase 2 is generally the comparison and analyses of the current state of the production
network and different scenarios of possible future models. Out of this, the strategic location
concept is developed in phase 3. Phase 4 shows the importance of the implementation and
the managemental abilities.
Figure 35: Integrated Strategy for Globalization
Phase 1
There has to be a need out of the company’s strategic objects of redesigning the network.
Objects like market share (segments and regions), technology aspirations (leader or
follower)52, or first mover, should be followed in new location selection. This phase want to
reveal the urgency of redesigning the global footprint.53
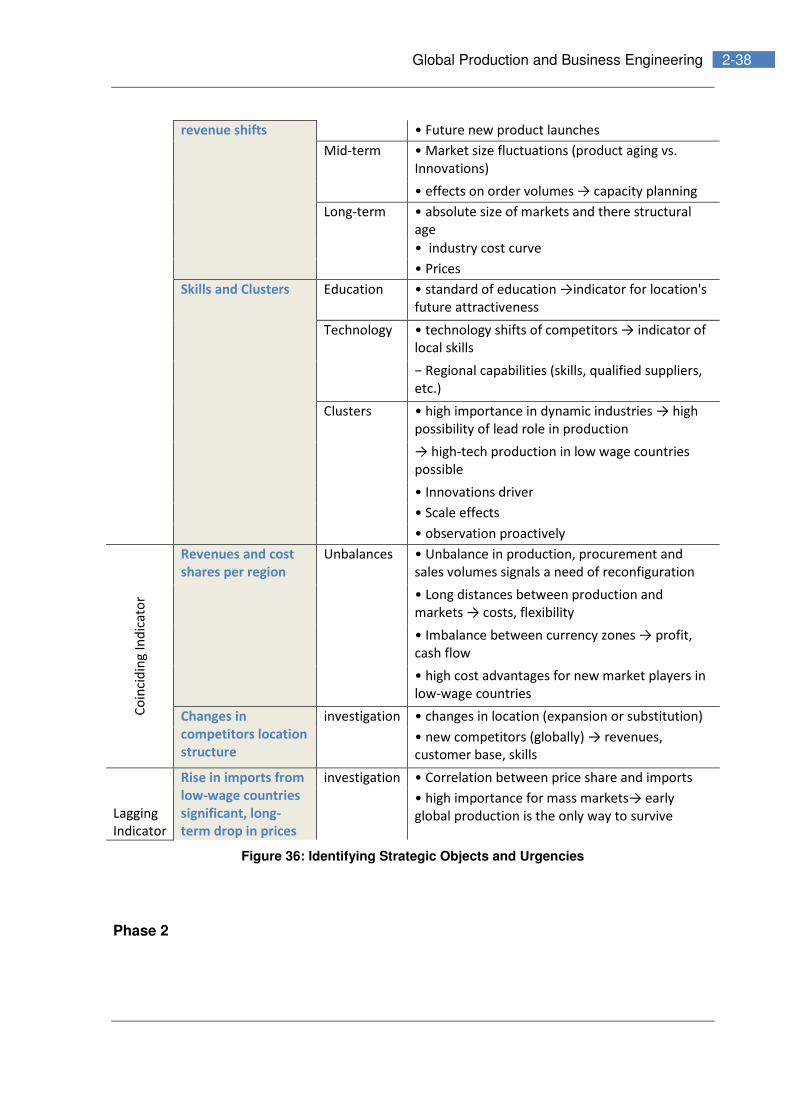
The next table shows a list of the most important object and urgencies in this first phase:
Identifying Strategic Objects and Urgencies
ad
i
ng
Ind
ica New markets and Short term • Attractiveness of current product portfolio
52
Cf. Porter 1980 53
Abele, Meyer, Näher, Strube, Sykes (Global Production, 2008) p. 144 ff.
2-38 Global Production and Business Engineering
revenue shifts • Future new product launches
Mid-term • Market size fluctuations (product aging vs.
Innovations)
• effects on order volumes → capacity planning
Long-term • absolute size of markets and there structural
age
• industry cost curve
• Prices
Skills and Clusters Education • standard of education →indicator for location's
future attractiveness
Technology • technology shifts of competitors → indicator of
local skills
− Regional capabilities (skills, qualified suppliers,
etc.)
Clusters • high importance in dynamic industries → high
possibility of lead role in production
→ high-tech production in low wage countries
possible
• Innovations driver
• Scale effects
• observation proactively
Co
inci
din
g I
nd
ica
tor
Revenues and cost
shares per region
Unbalances • Unbalance in production, procurement and
sales volumes signals a need of reconfiguration
• Long distances between production and
markets → costs, flexibility
• Imbalance between currency zones → profit,
cash flow
• high cost advantages for new market players in
low-wage countries
Changes in
competitors location
structure
investigation • changes in location (expansion or substitution)
• new competitors (globally) → revenues,
customer base, skills
Lagging
Indicator
Rise in imports from
low-wage countries
significant, long-
term drop in prices
investigation • Correlation between price share and imports
• high importance for mass markets→ early
global production is the only way to survive
Figure 36: Identifying Strategic Objects and Urgencies
Phase 2

2-39 Global Production and Business Engineering
This phase is divided into 3 main sections, (1th section) the first and most important is to get
a model of the current product and process portfolio. It aims to group out steps with a similar
cost structure and complexity. The result provides the underlying structure needed for a new
location configuration. The next task is to collect the process parameters like energy or time
needs. The 2nd section is to assess the improvement potential of current locations. Means,
companies should analyze their potential on lean manufacturing. But also consider the value
that existing sites contribute to, like the total production network including economics of
scale and R&D. Adapting the production technology is the next section (section 3), it
examines whether alternative production technologies and product design might be more
cost effective in other locations.54
Phase 3
This phase includes all previous indicators and parameters of phase 2 for the calculation
and development of the new strategic location concept. It starts with the ideal target
structure using comparisons:55
- How many new locations are needed?
- Where should which manufacturing steps for which product be located?
- What are the effects for the own facilities, and for those of the suppliers?
- What would the cost position of an optimal production network be?
The second step is an overall planning of the network, optimizing the return on investment,
like:
- Capacity plan: Create or reduce capacity for which process and which location
- Trends: Which trends should be factored in, sales volumes or other factors which
affect the production network or the cost position
- Financial effect: Star-up costs, spending on restructuring, or capital requirements
54
Abele, Meyer, Näher, Strube, Sykes (Global Production, 2008) p. 155 ff. 55
Abele, Meyer, Näher, Strube, Sykes (Global Production, 2008) p. 160 ff.

2-40 Global Production and Business Engineering
Developing the Target
Structure
Blueprint • Model of lowest-cost location structure
Analysis of global conflicts • Comparison of total costs, time
restrictions, currency imbalances, critical
manufacturing steps
Detailed design • Validation and check of the critical
assumptions like cost structure and
production volumes
Planning the Network
Migration and Optimizing
ROI
Migration planning • Determination and scheduling the
steps from the starting position to the
target structure
Skills (Organization and
Individuals)
• Skills have to be compared with the
needs of the project
Action plan • Planning of specific actions in line with
the targeted structure
Figure 37: Generating a Strategic Location Concept
Phase 4
Decision makers should prevent and be aware of a lake in resources and skills needed for a
relocation project, right of the beginning of the implementation. A better allocation of
resources, adaption of an implementation plan, and target structures can ensure an easier
and faster implementation.56
Besides this, regional and individual locations need further activities relating to the
production network (next table).
Further Local Level
Activities
Selection Processes
and Implementation
at a local level
• Building up, expanding, or acquiring
production capacity
• Setting up joint ventures
• Relocating by outsourcing
Creation of the
organizational skills
• Internal and for external suppliers
• Quality management, management
processes, information systems
• Best practice implementation (from
the first step, the ramp-up)
56
Abele, Meyer, Näher, Strube, Sykes (Global Production, 2008) p. 162

2-41 Global Production and Business Engineering
Figure 38: Implementation and Management
2.3 3rd Phase - The Ramp Up
Surveys show that companies with little experience internationally need more time and have
greater costs in establishing new sites abroad.57 Out of this there had been extracted clear
success factors and taps to avoid. Companies going global should not overestimate there
capabilities in this process. Companies should carefully align their skills and resources and
carefully identify pre-requirements and complexity of the undertaking. Apparent mismatches
have to be proactively handled by reducing complexity or by additional experienced stuff.
Companies with the capability to transfer best practice from one location to another can
achieve rapid ramp-up in there targeted structure and quality. They also need painstaking
foresight to ensure reliability and capacity utilization, before and during the move.
Furthermore, they need a phased start-up with a sequential introduction to reduce downtime
from technical faults.
2.3.1 Improvement Potentials
The key to success is perfect planning! Surveys showed that companies using much more
time and expenditure on planning and preparation can save up to 50 percent of there on
costs and can set up their new location in half the time required by average competitors.
There are two major factors:
• Complexity has a major impact on time and one-time costs, caused by the location,
manufacturing process and product range. All this facts dictate requirements and
should be minimized.
57
MCKinsey/PTW (ProNet analysis)

2-42 Global Production and Business Engineering
• Operational excellence and risk management is another factor through this. A
perfect project management reduces costs, time and effort needed in establishing a
new location. This includes an effective site selection, an excellent personnel policy
and high product quality (even in the start-up phase).
Emphasis of global leader in their crucial success factors:
Figure 39: Emphasis of Global Leaders58
The next figure shows the advantages of market leaders in the process of setting up new
locations and reveals significant differences in the cost and time they had required.
Figure 40: Advantages of Market Leaders59
2.3.2 Regional Planning
Setting up a new location makes it vital to have precise analyses of local conditions. These
conditions have to be coordinated and balanced to company’s own skills and plans. Keys
are the complexities the new location can deal with, skills available at the location (and
which skills can be provided by other locations), and the way of going it (partnerships,
licensing, acquisition).
58
Own figure; HRM (Human Resources Management); Cf. Abele, Meyer, Näher, Strube, Sykes (Global Production, 2008) 59
McKinsey/PTW (ProNet analysis)

2-43 Global Production and Business Engineering
• Complexity vs. Capabilities
Companies should not only consider successful models from high-wage locations. Mainly
these models are too complex, too vertical integrated and the product range is too wide. But
complexity is not responsible for the success of a new location. It is more about the skills
and the abilities, out of the determinate experiences, which enables companies to handle
with complexity. The key is to align skills and complexity throughout this multiple factors.
Ways to manage complexity and capabilities:
• Systematically identifying weaknesses and approaches to reduce complexity
• Soft start of the new location with a limited product range
• Taking along established suppliers
• Different location with a richer supply of qualified staff
• Local partnership
• Early-on assembling of local qualified staff
• Site Selection
To decide about the exact location for the new site in a country or region three investment
relevant criteria should be analyzed caused of the varying investment conditions: human
resources, costs, and logistics. Projects with a high impact to the local labor market or
project in the high-tech field, will always find an open ear at local public authorities.
Negotiations therefore can be very lucrative and can significantly reduce the risk of
investment. Furthermore firms should play local sites off against to each other, up to the very
final decision point.
Figure 41: Criteria for Site Location60
• Alone vs. Partnering
60
Abele, Meyer, Näher, Strube, Sykes (Global Production, 2008) p. 242

2-44 Global Production and Business Engineering
The most common way for opening up new locations abroad is to go the way alone. But it
can be useful to involve old familiar or local partners in joint ventures, acquisitions, or sub
contractions. Partners can support and simplify the process in many different ways.
Furthermore, it can be very promoting for the own business to follow or enhance a customer
in globalization. Most companies following a customer can open up new markets, and find
new local customers.
The next figure shows when a local partner could promote or even enable business in
foreign markets.
Figure 42: Indicators that Support is needed
However, companies should be very carefully in selecting a partner and use every possible
legal safeguard to prevent any surprises. To minimize surprises, especially where legal
systems are not very reliable, companies should always use three measures to prevent this:
• Control: Companies should have a minimum 50 percent share, install a third party
as a neutral mediator, or have de vacto or veto rights
• Management and leadership: Companies should fulfill positions of influence with
people they trust and who are familiar with local conditions.
• Collaboration incentives: Incentives beyond the joint venture can safeguard the
commitment of the partner.
In Appendix 3 is a short story about why to choose the right partner.
2.3.3 Human Resources Management (HRM)
The primary task of the HRM at new facilities is to recruit as many local suitable personal at
low cost with the requested skills. But technical and management expertise mostly in
emerging or new industrialized countries is very rare and can lead to big problems.
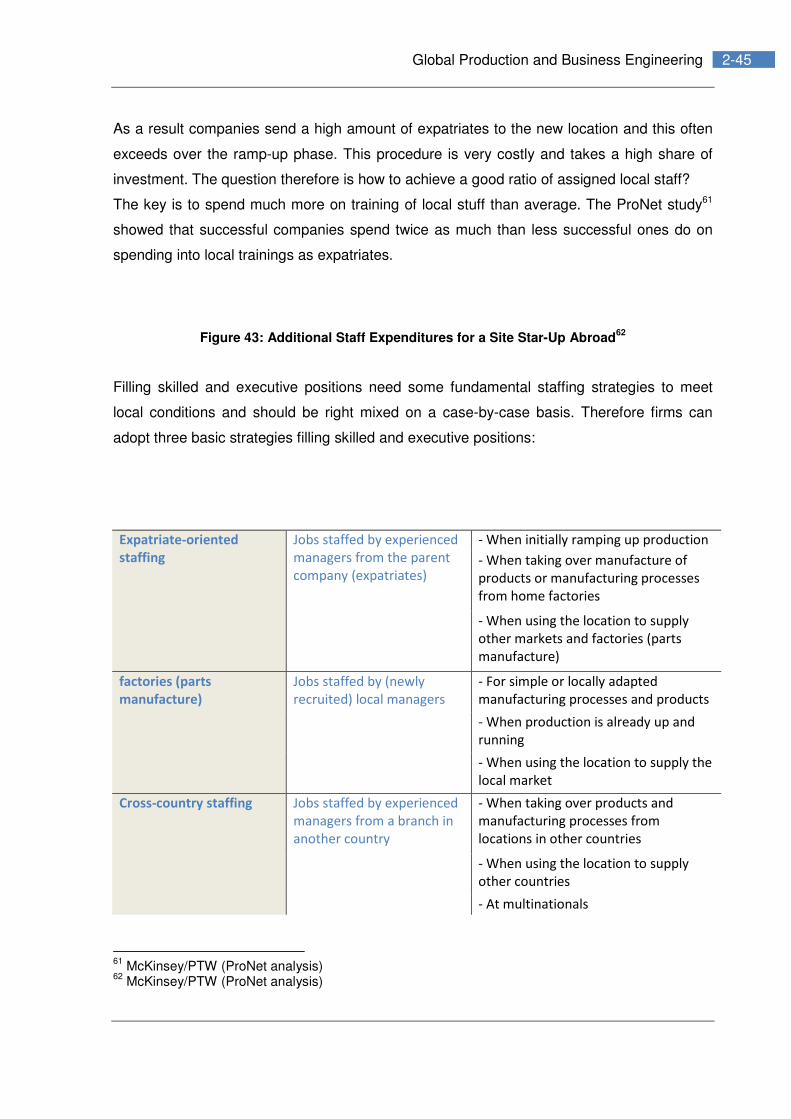
2-45 Global Production and Business Engineering
As a result companies send a high amount of expatriates to the new location and this often
exceeds over the ramp-up phase. This procedure is very costly and takes a high share of
investment. The question therefore is how to achieve a good ratio of assigned local staff?
The key is to spend much more on training of local stuff than average. The ProNet study61
showed that successful companies spend twice as much than less successful ones do on
spending into local trainings as expatriates.
Figure 43: Additional Staff Expenditures for a Site Star-Up Abroad62
Filling skilled and executive positions need some fundamental staffing strategies to meet
local conditions and should be right mixed on a case-by-case basis. Therefore firms can
adopt three basic strategies filling skilled and executive positions:
Expatriate-oriented
staffing
Jobs staffed by experienced
managers from the parent
company (expatriates)
- When initially ramping up production
- When taking over manufacture of
products or manufacturing processes
from home factories
- When using the location to supply
other markets and factories (parts
manufacture)
factories (parts
manufacture)
Jobs staffed by (newly
recruited) local managers
- For simple or locally adapted
manufacturing processes and products
- When production is already up and
running
- When using the location to supply the
local market
Cross-country staffing
Jobs staffed by experienced
managers from a branch in
another country
- When taking over products and
manufacturing processes from
locations in other countries
- When using the location to supply
other countries
- At multinationals
61
McKinsey/PTW (ProNet analysis) 62
McKinsey/PTW (ProNet analysis)
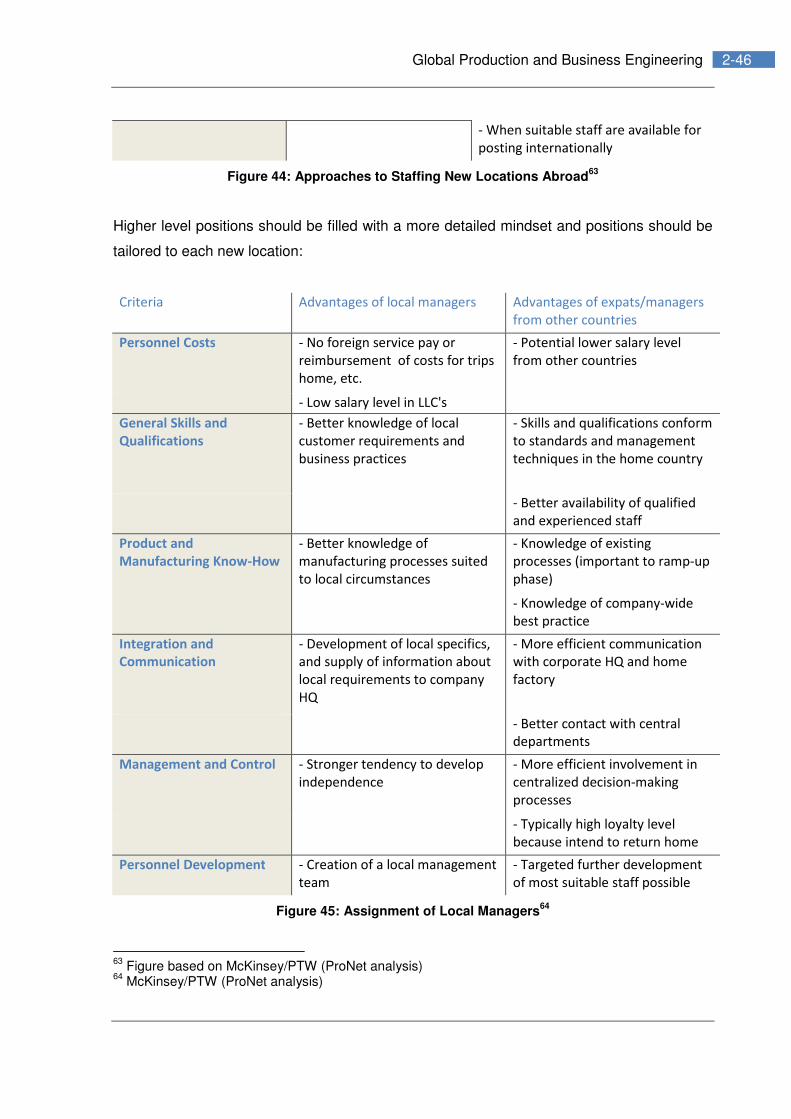
2-46 Global Production and Business Engineering
- When suitable staff are available for
posting internationally
Figure 44: Approaches to Staffing New Locations Abroad63
Higher level positions should be filled with a more detailed mindset and positions should be
tailored to each new location:
Criteria Advantages of local managers Advantages of expats/managers
from other countries
Personnel Costs - No foreign service pay or
reimbursement of costs for trips
home, etc.
- Potential lower salary level
from other countries
- Low salary level in LLC's
General Skills and
Qualifications
- Better knowledge of local
customer requirements and
business practices
- Skills and qualifications conform
to standards and management
techniques in the home country
- Better availability of qualified
and experienced staff
Product and
Manufacturing Know-How
- Better knowledge of
manufacturing processes suited
to local circumstances
- Knowledge of existing
processes (important to ramp-up
phase)
- Knowledge of company-wide
best practice
Integration and
Communication
- Development of local specifics,
and supply of information about
local requirements to company
HQ
- More efficient communication
with corporate HQ and home
factory
- Better contact with central
departments
Management and Control - Stronger tendency to develop
independence
- More efficient involvement in
centralized decision-making
processes
- Typically high loyalty level
because intend to return home
Personnel Development - Creation of a local management
team
- Targeted further development
of most suitable staff possible
Figure 45: Assignment of Local Managers64
63
Figure based on McKinsey/PTW (ProNet analysis) 64
McKinsey/PTW (ProNet analysis)

2-47 Global Production and Business Engineering
Selecting of suitable staff for work abroad is difficult and can be solved or alleviated by
implementing a targeted recruitment and a human resources development program via
systematic planning. Expatriates should therefore suit following points:
• Functional expertise with a broad technical knowledge
• Ability to built a company and relationship network
• High level of intercultural skills and awareness, as well as the local language
• Personal situation (family, stress tolerance)
• Suitable job profile with specific strengths and weaknesses
However, high-quality preparation is crucial to the success of any assignment abroad. Any
weakness found in the selection process should be worked out in suited training programs,
like trainings in the language, country specific information’s, or collections of documents for
best practice or meetings with expatriates in the region. Preparing expatriates for the heavier
functional and cultural demands they will face, is a worthwhile investment. An action plan for
this should be started 3 months in advance and acquire location specific knowledge.
Figure 46: Staff Preparing Schedule for a Posting Abroad
A good way to get local skilled workers and executives up to the company’s standards is to
work in mixed teams at the new facility on one position. That means to allocate one position
with two persons simultaneously – one an expatriate, the other a local manger. Temporary
tandem or mixed management means local knowledge can be retained and know-how
transferred, both at the same time.
To attract suitable employees in LLC’s it takes fare more effort than the standard HR
management initiatives in HCC’s. Standards of education are usually lower and even
qualified candidates tend to be unfamiliar with advanced technologies and management
processes. Further points are a high staff fluctuation and the attractiveness companies have
for potential candidates.

2-48 Global Production and Business Engineering
2.3.4 Ramp-Up of the Production
The aim in a ramp-up phase is to achieve full capacity and the usual quality as fast as
possible. Companies going through this have to expect, losses, downtimes, and delays in
the production process.
The quickest companies manage to reach their quality and production targets in just 4
months, slower ones do the same on average in 14 months and some companies need up
to 3 or 4 years. Global leaders in the ramp-up phase plan this phase carefully beforehand by
evaluating the situation and taking the right strategy and measures.
Winners are working through questions in advance:65
• What is the best way to organize the start of production?
• Which equipment should be adopted from the other location?
• Who is responsible for what? (packaging, transport, un-packaging, building-up,
installment)
• How can delivery failures be avoided? And so on…
However, delays are inevitable, especially when new persons, new suppliers, or even new
products are provided. The ProNet survey showed that 5 percent in delay should be
calculated with.
Figure 47: Planned and Actual Ramp-Up Curve66
Some examples for causes of delays:
Loss of production:
• Rejects due to incorrect operation of the NC machining center
65
Abele, Meyer, Näher, Strube, Sykes (Global Production, 2008) p. 261 66
Mckinsey/PTW (ProNet analysis)

2-49 Global Production and Business Engineering
• Interrupted supply of utilities (electricity, gas, water, etc.)
• Logistical obstacles to the supply of materials (e.g., accidents, delays at customs)
Ramp-up delay:
• Delays in coordinating with additional production line
• Training of machine operators scheduled at short notice
• Delay in commissioning transferred machine
• Sample production for customer approval
Production downtime:
• Design changes
• Poorly reassembled machine
• Insufficient supply of spare parts
• Materials held at customs
• Late discovery of quality defects in materials supplied
Developing a strategy to the ramp-up phase complexity and sequential introduction should
be focused. A sequential introduction of products and manufacturing steps can reduce
deviations, better detected and solved. Due to preselection of the product portfolio and
production technologies complexity can be significantly reduced in the ramp-up.
Ramp-Up Variants
• Mode 1 – Sequential product launch
If applicable, this mode enables staff and suppliers to prepare themselves successfully for
new requirements due to the products. This mode should be preferred for mass products,
production lines with long setup times or general for more complex portfolios.

2-50 Global Production and Business Engineering
Figure 48: Sequential Product Launch67
• Mode 2 – Parallel Ramp-Up
In this strategy all products are launched simultaneously. This needs simple products, high
skilled and trained staff; therefore it is only applicable in very specific cases, like sport shoes,
household appliances and simple polymeric products.
Figure 49: Parallel Ramp-Up68
• Mode 3 – Minimum Complexity and an Out-Leveled Ramp-Up
This mode reduces the complexity of every step to a minimum and enables a successive
employee training. This approach should be used for very demanding processes and
products. However, this mode includes a very long ramp-up and therefore only a late
realized economies of scale.
Figure 50: Out-Leveled Ramp-Up69
• Mode 4 – Sequential Process Launch
This mode introduces production steps sequentially but products simultaneously. This
Ramp-up therefore enable manufacturer to in traduce very complex and divers
manufacturing processes with high quality requirements and it also enables a simultaneous
market launch. This method it especially used in cell phone production migration starting
with the end of the value chain. The new production is therefore producing high-quality right
from the start.
Figure 51: Sequential Process Ramp-Up70
67
McKinsey/PTW (ProNet analysis) 68
McKinsey/PTW (ProNet analysis) 69
McKinsey/PTW (ProNet analysis)

2-51 Global Production and Business Engineering
To decide about the right ramp-up phase, is overall crucial to the howl success of
investment. Once the ramp-up strategy is chosen, further other value levers should be
taken:
- Enlist active support from suppliers
- Choosing local equipment manufacturers for repair and spare parts
- Involving suppliers in the quality assurance process
- Staff trainings at home location (cutting corners)
- Linking wages to reject rates
- Binding careers to the location performance
2.3.5 Equipment Transfer or Purchase
One of the main effecting points to the costs of a new location is weather the equipment
should be shipped from the old location or purchased. To decide this we have to distinguish
between standard machinery, automated systems and complex system of the process
industry.
For no more needed standard equipment it is usually cheaper to transfer it, as to sell it and
buy new at the new location. Automated systems could, if applicable, be bought at local
supplier. In some countries like China or Malaysia, thus to governmental subsidies, there are
a lot of good suppliers available. Complex systems of the process industry should be
shipped, to avoid surprises in the production and for long term utilization. Production
downtimes can cause significant losses and high costs.
Figure 52: Comparison of Machine Transfer and Purchase71 72
Once the decisions are taken of transfer or purchase, additional steps have to be taken:
70
McKinsey/PTW (ProNet analysis) 71
McKinsey/PTW (ProNet analysis) 72
Standard mashine center, transportation from Germany to China

2-52 Global Production and Business Engineering
Process steps Tasks Success factors
Planning - Inspection of halls and
machinery
- Planning of optimal export and
import sequence
- Detailed removal plan - Mobile workshop
- Traffic route planning
Disassembly - Documentation - Machine overhaul
- Dismantling - Machine status report
- Cleaning
Transport - Packing
- Loading
- Fastening
- Shipment by truck/sea/rail
- Unloading
- Individual packing where
necessary
- Presence of special hoisting
equipment
- Insurance
Reassembly - Placement
- Alignment
- Installation
- Modification to local condition
(elect., air etc.)
- Monitoring by foreman from
disassembly team
Internal/external
acceptance
- Performance test - Experienced staff on site
- Acceptance inspection
- Machine capability
- Process capability
Figure 53: Transfer Steps of Equipment and Machinery73
Companies in this process should be aware the loss of production and should initiate
necessary steps. Companies have to plan additional capacities and bridges due to these
losses, like to increase capacity in advance (extra shifts), built reserves, or use fluctuations
in demand for short-term downtimes.
73
Cf. McKinsey/PTW (ProNet analysis)

2-53 Global Production and Business Engineering
2.4 4th Phase – Sustainability-Phase
This phase mainly contribute to large enterprises, because of the large number of
approaches, functions, and tasks. It should help companies to adopt the right structures,
processes and give additional thoughts for the mature phase of a new location.
2.4.1 Role of the Management
Making a decision about a potential new facility abroad is not just a decision about the
strategic design and the systematic setup. Operations and tactical management is just as
crucial and becomes more and more important in a growing globalization. The new location
has to be integrated into the network and crucial decisions have to be made. This should be
done in a step-by-step approach, leading to a totally independent and accountable strategic
business unit.
The globalization makes a professional SCM (supply chain management) necessary, as well
as, it increase distances, service and quality level expectations, the number of variants, and
the costs of inventory. Companies working with a proficient SCM can achieve significant
competitive advantages and can reduce their costs by optimization their distribution network
and managing their transportation intelligently.

2-54 Global Production and Business Engineering
Implementing best practice in a global context, because of the physical proximity, which
makes it hard to overcome cultural and language barriers, means to implement a uniform
standard of how things are done. Best practice means to establish a standard language
for communication in the operational process or guidance for managers globally in standard
procedures and problem solving techniques. Best practice is also the creation of the right
KPI’s (key performance indicators) and their rigorous tracking.
Designing the Organizational Structure
The most common organizational structure in today’s world is the divisional model. There
are several more complex models like the matrix organization or a hybrid organization with
strategic business units. However, all this models have to be adapted to the new location;
and as more complex they are, the more complex it get. This is so important to the fact that
small projects often do not get the needed attention of the top management, leading to slow
solving in case of problems and slow decision making.
Avoiding this, companies can implement a three-phase adaption of the organizational
structure.
1. In the ramp-up: The top management should be responsible for planning and
implementation of the new location. As a direct response, they have to be connected
without any between steps to the local managers with regular reporting’s and committee
meetings. This approach is fastening the decision process and can reduce the conflict of
interests between production, purchase, and R&D. This critical phase may also require a
bundling of responsibilities, by putting one person in charge of the entire project or
region.
2. In the stabilization phase: With the start of production the requirements through the
organization are changing. Cost target are getting into the focus reducing scrap rates,
improving the processes and quality by riding the economies of scale. In this phase
competences and responsibilities should be slowly passed to local mangers, by
simultaneously implementing a supporting management system.

2-55 Global Production and Business Engineering
3. In the Mature phase: In this phase the requirements of the new location are align with
the requirements of established locations – profitable growth. This mainly means
companies develop new products, to open up new customers and segments. Companies
should therefore swift to a more entrepreneurial structure and get more competences,
to work as an individual division and develop cross-functional skills.
Phase and Level of
Integration
Location Operations
1. Focus: Regional/Ramp-Up
Ensure the ability to
develop new markets
and swiftly capture factor
cost advantages
- Flat hierarchy
- High degree of top
management attention
- Low level of technical
expertise
- Inefficient due to high level
of decentralization
- Very close to customers,
individual problem solving
2. Focus:
Functional/Stabilization
Stabilize and utilize global
synergies; grow rapidly
- Focus is solely on
production: no focus on
market requirements
- Incentives to tap economies
of scale
3. Focus: Divisional/Maturity
Return to original structure
(divisional)
- Low level of responsibility:
no top management
- High level of technical
expertise
- Conflict of interests
minimized
Figure 54: Phased Organizational Structure74
However, companies should as well define the level of independence of their new factory.
This has multiple causes, but the most important are to reduce conflicts, short-term risk and
the level of ability to work independently. Working on this requires organizational changing
abilities of the new location and the empowerment abilities to change of the home
organization. The simplest form of organization is the service center, with a minimum of
independence, and the most independent, is the strategic business unit, which can be
legally and logistically separated from the all other businesses.
74
Own figure, Pictures: Global Production 2008

2-56 Global Production and Business Engineering
De
gre
e o
f
ind
ep
en
de
nce
Strategic Business
Unit
Profit Center
Cost Center
Service Center
Cri
teri
a
- Criteria are always
fulfilled
- Costs can be
allocated efficiently
and with reasonable
accuracy
- Expected to utilize
freedom to make
cost cutting
decisions/ maximize
efficiency
- Revenue and costs
can be allocated
efficiently with
reasonable accuracy
- Expected to utilize
freedom to make
decisions
- Free market exists
and is accessible
- Must already be
competitive
- Expected to fully
utilize freedom to
make decisions
- Business unit can be
separated legally and
logistically
Ad
va
nta
ge
s
- Corporate synergies
can be tapped
without conflicts of
interest between the
centers
- Greater motivation
to control and reduce
costs
- Greater motivation
to increase revenues
- Greater
performance
pressure/
competitiveness
provided by external
market participants
Figure 55: Selection Matrix for the Degree of Independence75
The core behind this selection is to reduce costs. Global leader use this matrix to decide
about centralization of the product design to gain R&D synergy and economies of scale in
machinery procurement/ purchasing.
Global production leaders are generally more centralized to lower their costs via synergies
and economies of scale. The next figure shows the results of the ProNet survey to the
degree of dependence.
Figure 56: Degree of Dependence76
SCM – Supply Chain Management
75
Own figure; Cf. McKinsey (Global Production 2008) 76
McKinsey/PTW (ProNet analysis)

2-57 Global Production and Business Engineering
As production and the howl network’s footprint grow, the demand for supply chain
management is going to climb. Managing the global production network does not only
means to create structures; it also includes designing organizational processes. Therefore
supply chain management plays a key role as informational coordination becomes much
more difficult in a global context.
The main task in SCM is to coordinate the flow of materials and information between
(material) sources, (internal and external) production steps, and the customer. So that SCM
mainly focus on relationships between the logistical structure, transport management, the
exchange of data within the network, and cross-factory production planning.
SCM Challenges
The three main drivers in growing the demand of SCM:
• Transport costs rise: Due to more and longer transportations the cost of tied up
inventory and transactions are growing. As well as, customers are getting higher in
there demands of flexibility and robustness, which can lead to more costly
transportations and supply commitments.
• Complexity: Due to the increase of operational control and planning and due to
varying conditions in different countries, complexity becomes a major factor. The
logistic chain becomes more prone to disruptions driven by more transactions (more
loadings/unloading, varying transport charges and cross-border routes).
• Language and cultural barriers: This is usually to most underestimated topic.
Cultural and language problems can lead to significant problems in speed of
bureaucratic between parties involved or in the process of finding a solution for an
existing problem.
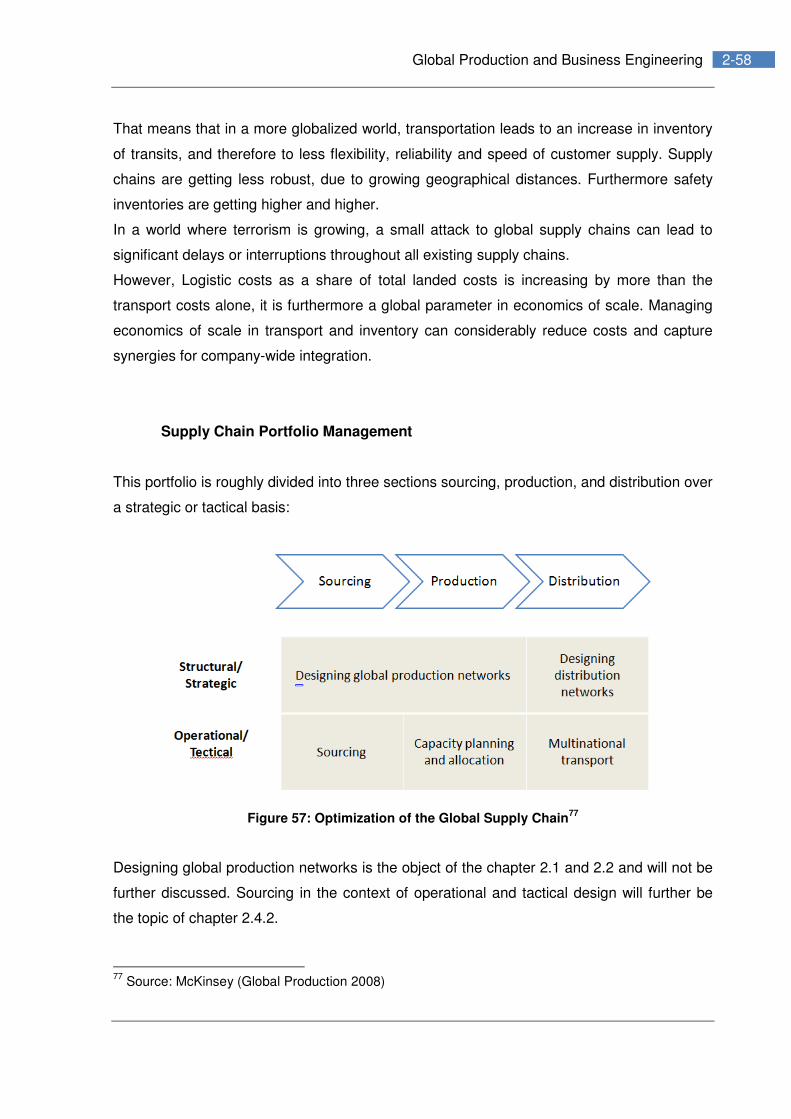
2-58 Global Production and Business Engineering
That means that in a more globalized world, transportation leads to an increase in inventory
of transits, and therefore to less flexibility, reliability and speed of customer supply. Supply
chains are getting less robust, due to growing geographical distances. Furthermore safety
inventories are getting higher and higher.
In a world where terrorism is growing, a small attack to global supply chains can lead to
significant delays or interruptions throughout all existing supply chains.
However, Logistic costs as a share of total landed costs is increasing by more than the
transport costs alone, it is furthermore a global parameter in economics of scale. Managing
economics of scale in transport and inventory can considerably reduce costs and capture
synergies for company-wide integration.
Supply Chain Portfolio Management
This portfolio is roughly divided into three sections sourcing, production, and distribution over
a strategic or tactical basis:
Figure 57: Optimization of the Global Supply Chain77
Designing global production networks is the object of the chapter 2.1 and 2.2 and will not be
further discussed. Sourcing in the context of operational and tactical design will further be
the topic of chapter 2.4.2.
77
Source: McKinsey (Global Production 2008)

2-59 Global Production and Business Engineering
Designing Distribution Networks
Ensuring high ability and performance of customer supply makes efficient design throughout
distribution networks essential weather in internal or external distribution logistics. The key is
to develop a strategic planning and to evaluate the various options. Analyzing and
optimization normally reveals 15 to 30 percent reduction potentials over the howl system.
But this needs a strict and rigorous implementation because of the rapidly growing markets
and fast changing conditions.
To measure the level of performance in distribution network, adequate key indicators have to
be implemented. The most important are how customer’s deadlines and volume
requirements are fulfilled. These are indicators “normally” customer rate their suppliers:
• Customer delivery lead times
• Reached service level
• Delivery reliability
Due to Volume structures, economies of scale, delivery requirements, and product
characteristics the key question is which products or services are best delivered to the
customer by which way. There are some main characteristics:78
• Resource-to-order: Resources will only be installed, rented, called in when there is
an actual need/ demand e.g. contractor projects
• Make-to-order: Resources are mostly in place, the start of production is trigger by
the customer order.
• Assemble-to-order: Subassemblies are pre-produced and are finally assembled
according to an actual customer order.
• Make-to-stock: Production lead times being longer than customer’s expectations to
delivery lead times, goods are make to stock.
Longer delivery times allow greater flexibility, decrease depreciable costs, and enable a
better control of the production.
However, there are more factors which influence the options for transportation:
78
The World of Operations (Hieby Consulting, 2009)

2-60 Global Production and Business Engineering
• Volumes per customer: Combined use of different transportation shipments (lorry,
truck, etc.), ensuring cost-efficient transport.
• Economies of scale: General increase in volumes should be planned in, as
transport cost decrease per unit.
• High requirements: Customer more and more rising there expectations due to the
transport (Just in Time JIT, Just in Sequence JIS, etc.), this demand can lead to
uneconomical transportation.
Furthermore the transport network has to be measured and proved to vehicle efficiency,
capacity utilization, detour factor, and the number of handling events. To identify the best
form and mix of transportation the best way is to make a clustered analysis of products and
their key characteristics. That means to analyze the number of consolidated levels of
transactions between production sites, warehouses, and logistical suppliers; and the
inventory level of consider products. Out of this companies should operate their own
transport network, even so, when using logistical providers’ transport. This cluster analyze is
high complex and should be made by companies specialized on this.
Global acting companies know the painful fact that distribution networks include tied-up
capital costs, which can be often higher than the actual transport costs. Therefore, transport
management is a necessary task in every supply chain. But this task can be easily switched
to external services, which implement routing and all operational tasks.
Strategic Capacity Planning
As companies usually are used to plan their production in advance, this, especially in global
productions, should be also implemented in a strategic global production program. This
should be a system to manage complexity in a global production planning and should be
therefore be distinguished into three planning horizons:
4. Strategic planning: Planning over years or decades (target planning)
5. Tactical planning: Planning over months (production program planning)

2-61 Global Production and Business Engineering
6. Operational planning: Planning for the actual period (Shop schedule or detailed plan).
This strategic capacity planning enables an advanced adaption of the SCM to the howl
production network, avoiding surprises by the inclusion of unforeseeable events. This
method is known from technology managemental programs – the technology roadmap.
Fundamental to this proceeding is the choice of the right target parameters for capacity
planning.
Interval
Planning
horizon Unit of time Product resources
Strategic
planning Yearly 10 years
Month
Series
Factory Operational
Planning Yearly 3 years
Design
Short-term
planning
Monthly
current year
Monthly
production plan 1 month 10 days Section/ area
Figure 58: Global Production Program Planning79
Special Logistics in Emerging Markets
The landscape of logistic providers in emerging markets is highly fragmentized. Only in
China, there are more than 5 million registered trucking companies and much more are
79
DaimlerChrysler / McKinsey (Global Production, 2008)

2-62 Global Production and Business Engineering
unregistered. That means more than 2/3 of the logistical providers are small companies with
less than 5 trucks. Thinking about the traffic situations in China or India, the size of the
mainland in China, you can get a feeling for the challenge of managing logistics are in this
fast growing countries.
Figure 59: Commercial Vehicle Ownership Structure in India80
Companies who want to enter the market should study the market structure in detail and
implement a new approach in pioneering and development of logistical providers, or should
empower them in optimizing there structures.
However, delivering in HCC’s is not the same like in LCC’s. Delivering customers in LCC’s,
means a multi-layer system, sometimes with more than 10 or more steps from the
manufacturing to the customer. These steps can contain one specific way of transportation
with different third-party logistics (providers, carrying, and forwarding).
Furthermore, a save transportation often cannot be guaranteed, due to the fact that this
small companies will mainly overload there truck to gain most as possible utilization and cost
reduction. This proceeding includes unpredictable events with high dangerous impacts
through the production company.
Divergences in logistical operations to LCC’s:
• Much higher share of manual labor (packaging, transportation, loading, unloading,
low level of standards and safety).
• Overloading (cause of quick truck payback and tough competition): Serious concerns
for international companies due to accidents, road damages, and unreliable
transportation.
Distributers in emerging markets are not only logistic providers. As most shops and
businesses are small and family-owned, they function as credit providers. As well as,
distributors, retailers and shopkeepers are typically very close and have developed very well
established business practices. These businesses are normally in-transparent to outsiders.
80
Source: Asian Development Bank estimates / McKinsey (Global Production, 2008)

2-63 Global Production and Business Engineering
Companies should be patient in developing new distribution ways in emerging markets and
should follow a more differentiated approach, remembering that markets mature at different
points of time. Mainly this structures in retail and there distribution change with de
development of the GDP per captia.
Figure 60: Development of Organized Retail81
Key Issues and Best Practice in the Logistic of Emerging Markets:82
• Overloading: Overloading is a hazard and illegal. However, it is difficult for
companies to act alone to enforce compliance. Enforcing compliance is generally
difficult: It can make distribution costs 50 to 100 percent higher than those of local
competition and will still not provide any guarantee that truckers actually do not
overload and use the higher freight rates to boost their profits. This problem should
be address to industry associations and government lobbyists.
• Palletization: Start introducing pallets for handling in your own and directly
controlled warehouses and movements between your own and directly controlled
locations. Be prepared for palletization, but do not try to be the first to introduce
pallets and other loading devices. Customers are not used to it and will not be able to
handle them and will often not return empty pallets.
• Unorganized retail: Small shopkeepers and street businesses will require credit,
and only pay for goods once they have been sold to the end user. This process is
very difficult to handle for international companies. Most companies will have to rely
on local distributors with experience in the sector.
• Distributors and stockists: Do not underestimate the role of distributors, which
goes beyond logistics in areas such as credit management. Often these distributers
are a form of underground criminality. How hold the howl business of supply of an
area in their hand. Develop a plan and gradually eliminate layers of distributors. If
81
Morgan Stanly, Mckinsey (Global Production, 2008) 82
McKinsey (Global Production, 2008)

2-64 Global Production and Business Engineering
distributors or stockists are organized in industry associations, manufacturing
companies should align their actions. Trying to break the power of these associations
alone can have disastrous consequences. Manufacturers may find their products
boycotted or restricted by the government.
• Exports from LCC’s: Aim for “ex-works” or “FOB (free on board)” trade terms with
vendors and consolidate goods in the country of origin. Locate as many value-adding
activities as possible in the emerging market to capture the maximum cost
advantage, e.g., labeling, packaging. Optimize container loading and routing. Deliver
direct to the store or customer in the destination country wherever possible.
• Imports into LCC’s: Aim to locate value added in the country of destination. Make
trade terms dependent on which organization can obtain better rates with forwarders
or carriers.
• Supply chain management: Categorize goods and supply chains to define the
optimal mode of transport, consolidation structure, and inventory holding points. Use
criteria such as value density (the USD value per unit of weight), demand volatility,
and criticality to determine the optimal mode of transport and supply chain structure.
Define clear switches between local supply chain management in the LCC location
and the management of international volume flows. Local distribution requires local
management up from the ground. Better to outsource local distribution as a whole if
such supply resources are not available. Ensure that both your own organization as
well as logistics service providers communicate well along trade lanes at an
operational level for international transport flows.
• Selection of logistics service provider (LSP): Invest time to understand the
capabilities of providers and how they are integrated with their subcontractors. Make
sure your provider actually has control over critical parts of the transport chain. Use a
scorecard with multiple decision criteria, rate, reliability, ease-of-use, speed or
inventory reduction, innovativeness of provider or helpfulness in developing new
solutions that assist in reducing costs.
Place greater emphasis on reliability and innovativeness than price when bidding for
comprehensive logistics solutions in LCC’s: A provider that supports you in

2-65 Global Production and Business Engineering
optimizing inventory and flow, handles your goods carefully, and prevents them from
getting lost, can be worth a lot and more. Companies that require special logistics
services such as cold chain logistics or the transport of valuables should plan way
ahead. Testing the solution before “going live” should be a common practice in these
cases.
• Contracting: Monitor the spending by service type, local warehousing and
distribution, airfreight, ocean freight, air express, trucking, etc., and by trade lane.
Bundle volumes and bid for them by region and service type. Enforce compliance
with the framework agreement to remain credible in negotiations with logistics
service providers and realize lower rates. Allow local organizations to opt out of the
framework agreement only to realize innovative logistics concepts, the use of
international trucking instead of airfreight. Otherwise, strictly enforce and stick to
compliance.
• Expand your reach: Use an LSP to jointly enter attractive areas of the product value
chain, spare parts, return and repair services. Combine OEM brand with the LSP’s
reach and capabilities to achieve a unique competitive advantage.
Managing supply chains in emerging markets need therefore two advantages. First,
management needs the right people and contacts with the access to know how to make
things work in a non-transparent and chaotic environment. The topic to this is how much
control can be delegated to local staff of time. Second, management has to be prepared for
changes and be ready for the next phase of development. This needs a good knowledge of
the local market and the ability to draw parallels to the past developments of other market
spaces.
Establishing Standards in the Production System
As global companies know, exchanging knowledge, experience, and best practices among
global locations is really challenging. Physical distance, cultural, and language differences
have to be overcome. Everything from the level of automation and staff training has to be

2-66 Global Production and Business Engineering
adapted to local conditions to gain best practices. Management has to work as an
intermediate between different locations to ensure the development of process improvement
abilities, transfer and implementation from one location to the other.
The most important way to do so is to implement to the global production system a lean
manufacturing system, to aim to eliminate all existing non-value-adding steps (waste or
muda (Jap.)) in kaizen activities developed by Taiichi Ohno, this process is also called
continuous improvement process (CIP).
To implement a successful production system are mainly tree steps to go:
1. Develop the production system itself (technical requirements for processes and
production technology).
2. Build in and development of the skills and experience needed to apply the production
system.
3. Implementation of the system throughout the howl global factory.
The best way to implement a production system is to start a lean transformation project in
two phases: a design/ pilot phase and a rollout phase.
Design and Pilot
In this phase companies have to develop their own customized system tailored to its own
company-specific structures, concepts, and terminology. It starts with detailed blueprint and
working models of highly efficient manufacturing processes, to be rolled out across the howl
production chain. This requires a lot of time and a systematic analyze of the current
production system and operating data, in combination with a launch team of engineers and
experts. The analyzed opportunities within the specific processes and technologies are than
combined with the relevant tools and techniques of the production system. The goal is to
maximize the benefits of the howl system. The key is to avoid waste of any kind.
Another further step to improve the production process is to analyze the flow; it helps to
identify current waste and is a vital prerequisite for designing a production system. The
measurement throughout this shows weaknesses in the supply chain in which the production
function is integrated.

2-67 Global Production and Business Engineering
The next figure shows an advanced business process mapping technology, also known as
Value Stream Mapping (VSM). There are further more programs and technologies available.
To name the most important, ARIS83, and MEGA.84
Figure 61: Material and Information Flow Analysis (MIFA)85
Rollout
The rollout should be started with a stepped implementation, not all at the same time, to
ensure a built-in time of implementation. This offers several advantages:
• Experienced managers can train staff and oversee the start-up, at numerous plants,
and can self benefit from the learning curve
• But most important to this are the involvement of the staff. They have to be
convinced of the importance of the effort and sustainably changed in there ingrained
behaviors.
A leak in an appropriate implementation of staff can endanger the entire rollout. Therefore
change management processes have to be communicated and appropriate measures have
to be taken to ensure employees’ identification with the project objectives without negative
attitudes.
Ounce these methods of a new production system have been implemented, the main task is
to ensure sustainability through continuous use to quality the results achieved. After all
improvements should be recognized, and reworded to motivate and continually strive to
improve the process. Measuring the performance of these process key indicators could be
implemented in-line with corporate objectives.
83
ARIS by IDS Scheer www.IDS-Scheer.com and the software AG 84
www.MEGA.com 85
McKinsey (global Production, 2008)

2-68 Global Production and Business Engineering
2.4.2 Global Sourcing
In most industrial production the material costs have the biggest share of total cost of the
product. This means companies how want to use the howl potential of a global network, in
addition to having their own manufacturing sites, have to source their materials most cost-
efficient globally. Actually, this cost savings make foreign investments so attractive in the
long term. But this task needs a lot of patients and intuition. Companies need to spend a lot
of time in selecting and building up of new suppliers. Therefore a planned organized process
is needed of identifying the potentials to realize this savings.
First companies have to develop an adequate sourcing strategy, beginning with
segmentation of the material groups required. Over each group has to be decided; whether
or not it will be sourced at the existing supplier. Furthermore, risks and process implications
have to be factored into the decision criteria.
The process of local sourcing should be implemented in two phases. First, to realize quick
wins, there have to be sourced the parts and materials who can be reliably supplied without
intensive preparation and training. Secondly, starting when the production is smoothly
running, more complex parts can be sourced locally. Companies in this process have to
refine there capabilities in their own sourcing organization in the local environment as well as
supplier skills.
Importance of Sourcing
As material costs make a large share of total products manufacturing costs, the integrated
optimization of production also include the suppliers’ network.

2-69 Global Production and Business Engineering
Share of product's manufacturing costs86
Electronic products 70 - 80 %
Automotive industry 50 - 60 %
Pharmaceutical Industry 20 - 40 %
How greatly companies underestimate this topic, can be seen as only e few companies have
implemented a systematically local sourcing. Companies normally obtain their suppliers from
their home country, and taking therefore the home prices to the new location. Mainly it
makes sense to build up local sourcing for parts with a low value density, where
transportation costs quickly wipe out the advantages of the home base.
However, developing a local sourcing is often a more serious obstacle than setting up the
production site itself, caused of the poor infrastructure, low qualifications and technology
skills in products and processes, as well as, lack of international practices in expectations
and aspirations. As a result, companies tend to use their known infrastructures, than to build
up a new one.
Management attention should be therefore focused on building up new local sourcing, as
global manufacturing locations only become attractive when a local supply base has been
established, by evaluating opportunities and risks with the greatest care.
Potentials
The main motivation for local sourcing is the additional saving potential; which can boost the
economic viability of the entire project. As high developed companies now all have used
their in-house production potentials, operating costs cannot be reduced significantly. Out of
this usually labor costs in HCC’s have only a share of 5 – 15 percent of production costs and
Material costs account for over more than 50 percent of manufactured goods.
Figure 62: Share of Material Costs for Production in HCC's (Example Germany)87
86
Source: McKinsey (Global Production, 2008)

2-70 Global Production and Business Engineering
Moving both production and sourcing to a LCC can realize potentials of over 30 percent.
Figure 63: Cost reduction Potentials for an Automotive Supplier from Relocating88
Challenges
One big hurdle to source in local environments is the lack of insights, transparency, and
sensitivity of or to local practices, businesses, and culture. As well as, often experience local
suppliers are limited or not existing. Furthermore, there can be cultural or linguistic barriers,
differences through technical equipment, or lacks of trust.
Building up suppliers in LCC’s needs much more costs and time than at HCC’s. Companies
have to provide appropriate support through their suppliers, generally working close in
operations using companies’ engineers as direct contacts for feedback loops and direct
problem tackling without long journeys and interpreters.
Figure 64: Time frame for Building Up suppliers (Example: Injection Parts)89
Systematic Sourcing
Developing a network sourcing strategy, materials should be beforehand divided in
segments of material groups by be sourced short or medium term and be bought at the
same supplier. The main criterion through this is the cost potential, and factors of risk and
complexity.
Using this, sourcing can be assigned to 4 segments:
87
Statistisches Bundesamt / McKinsey (Global Production, 2008) 88
McKinsey Company data 89
McKinsey (Gloabal Production, 2008)

2-71 Global Production and Business Engineering
• Strategic partnerships: Technical complex components that are related to
company’s intellectual property should be bought at trusted and established
suppliers
• Global sourcing: Standard components of high-volume should be bought at best
price by whatever supplier worldwide
• Local quick wins: Simple parts should be sourced as quick as possible directly at
the new location
• Local supplier development: Complex parts with the potential of local sourcing
(targeted local supplier development)
First Phase
In the first phase in gaining quick wins locally, a systematic approach should be
implemented to avoid the most common problems western buyers mainly disregard or
overlook.
The next approach shows a clear process to define the end product and the roles of
everyone involved:
The key to this all is to implement and establish a local sourcing organization, which can
properly develop the location. Its tasks include:
• Market analyses and selecting local suppliers
• Negotiation and concluding contracts with local suppliers
• Managing the site’s sourcing
• Coordinating local logistics
• Implementing test plans for quality management

2-72 Global Production and Business Engineering
Figure 65: Typical Purchasing Organization in a LCC90
In the process of purchasing it can be worthwhile using external services providers for
sourcing, because western companies are expected to pay an extra on sourced materials,
cause of their known and expected fortune. This is also one of the main causes why LCC
companies are so rapidly growing.
Second Phase
The second phase includes the sourcing of more complex parts and components once the
local sourcing is one a solid footing. This phase will need both training of the local supplier
and the own company, to gain the quality, reliability, and efficiency required for such a
cooperation. Manufactures should also consider providing methodical training for local
purchasers relating to production, quality, and management to tap potential saving in this
phase. Furthermore, providing modern methods to local purchasers can create transparency
on further cost reduction potentials.
Figure 66: Potentials from Supplier Development (India)91
90
McKinsey (Global Production, 2008) 91
McKinsey (Global Production, 2008)

2-73 Global Production and Business Engineering
Therefore, developing suppliers in LLC’s can achieve fast, impressive results.
2.4.3 Research & Development (R&D)
As the R&D-expenses are not equal to the development of a company’s turnover and R&D-
projects getting more and more expensive with an unpredictable and low success, R&D has
to change in a global context. The future is not driven by major technological innovations,
changing the howl industrial situation; the future is about trends and about the innovative
adaption of this.
Today R&D key factors are more about factor costs, market proximity, the access to top-
caliber engineers and the knowledge about cluster. That is why the R&D of companies is
currently not as globalized as production, enhancing the gap between production and R&D.
This is also why managing the interfaces is becoming ever more important.
Therefore companies with a more complex manufacturing process and products with normal
or high share of involvement of R&D should collocate there R&D and there production.
Especially for more complex products, detailed analysis is required, to determine which
aspects of the R&D process should remain centralized and which would bring more benefit
from collocation.
But this process is depending on the local product design requirements and location specific
production technologies, and therefore, various constellations are possible. Surveyed
companies showed, that in a later period, it is advisable to expand from a pure production
site to a center of competence with full product accountability.
In the future HCC’s will continue to have high appeal for R&D. This is mostly to the
established knowledge clusters of specific industries, mixed out of a high density of public
and private research activities, together with suppliers, customers, competitors, and venture
capitalists. However, this will change with the development of the emerging markets. HCC’s
2-74 Global Production and Business Engineering
will continue to dominate product development in some industries, but others will see the
shift of entire industries and clusters.
The next figure shows the development of the R&D in cumulated foreign investments with a
sustainable trend and their main driving industries:
Figure 67: Cumulated Global Foreign R&D Investments92
Finding the Right Constellation
Any company opening up a global production structure has to consider how to integrate
R&D. The interface between the two functions has to be balanced with the focused product
strategy, target market and the production network.
Normally the R&D is located or implemented between knowledge clusters and markets,
while production locations due to their factor costs are more globalized into LCC’s.
The clue to this, the more intensive the interactions between R&D and production is, the
more seriously collocation should be considered. There are two indicators in which
collocation should be considered. First, a high level of product innovativeness, which
frequently necessitates complex and detailed knowledge transfer between R&D and
production, and there close feedback loops (Indicators: short product life cycles or many
production ramp-ups). Second, the complexity of production processes, as high complexity
always extent engineers interactions between development and production.
Designing the R&D Interface
R&D can be typically divided into 5 phases. All of these phases have a very different
demand to the proximity to market and production. According to these phases there is a
wide spectrum of possible solutions between a minimal and complete collocation of R&D
and production. Choosing the right solution can lead to major development advantage in the
92
McKinsey (Global Production, 2008)

2-75 Global Production and Business Engineering
global network and optimize efficiency and effectiveness in product innovation and
complexity reduction.
Phase 1 Phase 2 Phase 3 Phase 4
Research
Platform
Development
Applications
Development Production Support
Process Development
- Develop basic
innovations
(products,
technologies,
manufacturing
processes)
- Development
products platforms
and standardized
modules
- Adjust products to
regional markets and
customers
- Solve technical
problems during
ramp up
- Development
manufacturing
processes in parallel
- Optimize ongoing
production
1. Option
Independent Networks with a Minimal Collocation: In this option, only a minimum of
employees are based permanently or temporarily at the production location. This approach
is particularly suitable for mature products which are already being manufactured at other
locations.
Phase 1 Phase 2 Phase 3 Phase 4
Research
Platform
Development
Applications
Development Production Support
Process Development
Indicators - Products and manufacturing processes are not very innovative
- Low complexity or limited number of manufacturing processes
- Not much adaptation of products to specific requirements needed
- Manufacturing processes are highly standardized

2-76 Global Production and Business Engineering
2. Option
Collocation of the process development: The second option involves the developing
production processes at the site itself. This is advised if processes need adaption to local
circumstances, or are so complex that development support is needed even in ongoing
operations.
Phase 1 Phase 2 Phase 3 Phase 4
Research
Platform
Development
Applications
Development
Production Support Process Development
Indicators - A cost-driven production site with site-specific manufacturing
processes
- A independent development of products and manufacturing
processes
- High complexity and high number of manufacturing processes
- Manufacturing equipment is different to other plants
3. Option
Relocation of application development: The next step is to transfer the application
development. This approach is often used for highly market specific or customer specific
products, and can be combined with option 2.
Phase 1 Phase 2 Phase 3 Phase 4
Research
Platform
Development
Applications
Development Production Support
Process Development
Indicators - Products need a adaptation to specific requirements
- Low complexity or limited number of manufacturing processes
- Manufacturing processes are highly standardized

2-77 Global Production and Business Engineering
4. Option
Relocation of platform development: Option 4 is to relocate product platform development
to the same location, or the same region. This is relevant when the target market requires
totally different product architecture (low cost product platform).
Phase 1 Phase 2 Phase 3 Phase 4
Research
Platform
Development
Applications
Development Production Support
Process Development
Indicators - Manufacturing processes and products are highly innovative
- High complexity and high number of manufacturing processes
- A constant need to adapt product architecture to local requirements
5. Option
Full collocation: Companies usually only reach for the full integration at long established
locations that serve as a knowledge cluster for an entire sector.
Phase 1 Phase 2 Phase 3 Phase 4
Research
Platform
Development
Applications
Development Production Support
Process Development
Indicators - Time or location right for developing a new knowledge center of
global significance
- Customer constraints require completely new solutions or products
architecture
- Limited synergies within the research
- High synergies between research and production

2-78 Global Production and Business Engineering
Outlook
LCC’s and HCC’s already competing with another for the top scientists and researchers
globally. Therefore, for new R&D locations should be chosen parameters like market
requirements and local knowledge clusters to ensure a good amount of qualified staff. For
example, Nokia and Motorola have set up a development centers in Chine’s clusters with
thousands of engineers to develop only specific mobiles for the Chine’s market. As qualified
staff in china and India is a tight up market, the wage level for high performers is nearly the
same than in HCC’s.
However, in some developing countries there is very large number and a good level of
skilled engineers available:
Figure 68: Global Labor Market for Engineers93
As now emerging countries recognize, knowledge cluster like in HCC’s have so far offered a
better environment for development. Knowledge cluster create exponential dynamics
through leading universities, state and private research institutions, specialized industry
zones, and venture capitalists. Out of this self-reinforcing feedback, these clusters are
difficult to replace anywhere else. To mention for example it the California’s Silicon Valley for
IT or the Stuttgart area for machine tool manufacturing.
As a conclusion to this, knowledge clusters will grow in their importance for future
developments of howl industries, but other location factors will be even out. Therefore new
markets will emerge in today’s low-cost countries and education standards will converge.
Countries have now the chance to develop region’s leadership in a specific industry with
further high potential for their future.
93
McKinsey (Global Production, 2008)

3-79 Conclusion
3. Conclusion
Global Business Engineering will more and more become the reality at our todays live.
Companies not adapting to the trend of globalization will face a disastrous consequences or
the end. In mid- and long-term industrial manufacturing of goods will almost migrate to low
cost countries. Companies ignoring this fact will lose their competitional power and will have
to defend their own against fast moving and aggressive competitors from LCC’s.
Competition will get far more aggressive and totally unmerciful for those missing the trend.
Adopting Global Business Engineering is not an option; it is the only way for manufacturing
companies to stay alive. Those who delay the process will be left behind and have to catch
up with their more powerful competitors. Companies have to develop new capabilities and
have to adapt to new circumstances out of the globalizational journey. Companies have to
stick to transformation and have to have the sense of urgency and stamina to stay the
course.
Companies realizing this will develop detailed metrics and measures through this
organizational transformation both for the technical (Master Thesis) and the social
infrastructures.
The concepts in this master’s thesis need passion for value creation and the ability to
convert concepts to detailed steps. This will bring up a new challenge in leadership, acting
now with a precise look for the future.

3-80 Appendix 2
Appendix 2
Parallel and Serial Multi-Nodal Transportation
Parallel: One part of the transport volume is shippt by one mode of transport, while the rest
is sent by another. This parallel use of transportation can lead to a reduction of 50 percent
for good with a middle high value desity94 by reducing safty inventories.
Serial: One shipping mode is taken for on part of the way, while another method takes the
goods the rest of the way. This is propebly used in every company, but only rarely in
comparison to other transportational possibilities.
94
Middle till high value density: EUR 15 - 80per kilogram.

3-81 Appendix 3
Appendix 3
Choose your Friends Carefully: How an SME was Exploited by its Joint
Venture Partner
A mid-sized mechanical engineering company established a plant in China as a fifty-fifty JV
with a local partner in the 1990s. The two parent companies each appointed a director. The
foreign company’s director had no experience whatsoever of business practices in China.
The Chinese partner was very quick to supply staff, but they all needed training. The partner
also helped plan the manufacturing processes without actually contributing any know-how
worth mentioning.
Within a matter of weeks after production had started, all the local employees handed in
their notice and switched to a neighboring location belonging to the Chinese partner in the
joint venture.
They had procured exactly the same machinery and plant without the knowledge of the
foreign company. Production was able to start immediately with these now semi-skilled
employees – without involvement of the foreign firm.
The foreign company failed in its attempt to assert its claims against the joint venture partner
through the courts. It paid dearly for its lack of local experience: it had placed too much trust
in its partner and had no effective means of applying pressure. What is more, it had failed to
look for a partner without any conflict of interest.
Joint venture failures could be prevented by deploying an assertive managing director with
appropriate intercultural skills, and giving the local partner an incentive to collaborate over
the long term (by only gradually disclosing technical details).

Reference Index
Internet Sources:
[http://www.bbs.nl/]
Link: http://www.cbs.nl/
Date: 13:29/ 19.01.2011
[http://www.teekampagne.de/
Link: http://www.teekampagne.de/
Date: 23:18/ 18.07.2010
Book Sources:
/BefI/ Wiehndahl/ Betriebsorganisation für Ingenieure/ 2005
/GanF/ Pawellek/ Ganzheitliche Fabrikplanung/ 2008
/TeB/ Prahalad/ The Fortune at the Bottom of the Pyramid/ 2005
/LsyF/ Kettner, Schmidt, Greim/ Leitfaden der systematischen Fabrikplanung/
1984
/CCMa/ Thomas/ Cross-Cultural Management/ 2008
/TIA/ Buchholz, Wördemann/ The Impossible Advantage/ 2009
/Wwbd/ Buchholz, Wördemann/ what makes winning brands different/ 2000
/GPE/ Abele, Meyer, Näher, Strube, Sykes/ Global Production/ 2008

/CinC/ Amabile, T. M. Creativity in Context. Boulder, Colo.: Westview Press,
1996
/IeIv/ S. General und G. Lantelme / Immer eine Idee voraus / Von der Idee zum
Spin-off / 2010
/KosK/ Günter Faltin / Kopf schlägt Kapital / 7. Auflage / 2010
/SpBu/ A. Buchholz und W. Wördemann / Spielstrategien im Business
/QMa/ Tilo Pfeifer/ Quality Management/ 2002
/ZuMa/ Horx, Huber, Steinle, Wenzel/ Zukunft machen/ 2007
/WaoI/ Prahalad, Krishnan/ the ne wage of innovation/ 2008
/ComS/ Porter/ Competitive Strategy/ 2004

DIESE SEITE AUF KEINEN FALL LÖSCHEN
ES IST MAL WIEDER EINE EIGENART VON OFFICE! WIRD DIE SEITE GELÖSCHT,
VERSCHWINDET IN ER KOPFZEILE DIE SEITENANGABE!!!


![Lloyd Electric and Engineering Limited announces acquisition of Noske-Kaeser's Rail & Vehicle global business [Company Update]](https://img.pdfslide.us/doc/110x75/577c83db1a28abe054b68b45/lloyd-electric-and-engineering-limited-announces-acquisition-of-noske-kaesers.jpg)