Embed Size (px)
Citation preview

June 2014 1
Global bond rally continues
Markit iBoxx fixed income monthly market monitor
Credit spread tightened in US amid growth in corporate revenue and earnings
ECB triggered another round of economic stimulus
Apart from Portugal, Eurozone peripheral countries extended the rally
Emerging market debt starts to attract investors
Activity calendar
It has been a very calm month for US treasury and
corporates market.
US treasury market witnessed record low volatility
after Fed revised its forward rate guidance. The rally,
especially in the intermediate and long end, extended
to a significant magnitude. Year to date, iBoxx
$ Treasury 7-10 year, 10-15 year and 15+year
returned 4.8%,7.3% and 12.3%, respectively.
US unemployment rate in May held at 6.3% and non-
farm payroll advanced 217K. However, it is worth
noting that other labour statistics did not improve in a
similar fashion. The labour force participation rate, for
example, has fallen to 62.8% compared to 65.7% in
Jan 2009. Therefore, Fed now stresses more on the
broad measure of the health of the job market instead
of focusing solely on the unemployment rate. Market
participants see this change as a possible relief sign
from a near-term rate hike.
Meanwhile, ECB’s rate cut could also potentially bring
new demand for US treasuries. However, the
historical correlation between US treasuries and
Eurozone sovereigns has been just 46%. As a result,
rates in the US could still increase if there is clear
signal of inflation or strong US economic growth.
Credit spreads in the US narrowed as a result of
improved economic activity, corporate revenue,
earnings growth and an ease in lending criteria. In the
past earning season, most of the S&P 500 companies
reported growth in both revenue and earnings, albeit
in small magnitude. The spread between iBoxx $ IG
Corporates and iBoxx $ Treasuries tightened to 1.5%
from 1.7% in the beginning of this year, the lowest
since 2000.
Source: Markit iBoxx Data
ECB’s stimulus will make peripheral countries more
competitive?
The European Central Bank cut its main refinancing
rate from 0.25% to 0.15%, the marginal lending
facility to 0.40% from 0.75% and the deposit rate to
negative -0.10% from 0%. Besides, the central bank
also launched €400 billion bank funding program in
the form of four years low interest loans. In addition,
similar to Fed’s asset buying programme, the ECB
will purchase asset-back securities in the secondary
market. The measures are likely to encourage banks
to increase lending, prevent potential deflation risk
and possibly weaken Euro.
It would be interesting to see the outcome of the
stimulus package on both the economic activity in
Europe and yields on Eurozone sovereign bonds.
1.5
2
2.5
3
3.5
4
4.5
5
An
nu
al
Yie
ld (
%)
$ Corporates $ Treasuries
Markit fixed income research
Issue 6, June 2014 Data as of May 31st, 2014

Markit iBoxx fixed income monthly market monitor \ June 2014
June 2014 2
During the previous round of LTRO in 2011, the
yields dropped significantly in the following two years.
However, we believe there is much less room for
yields to decrease in a similar fashion at this point.
Source: Markit iBoxx Data
Actually, there has been a significant pickup in
economic activity in European peripheral countries.
The Markit Composite (Manufacturing + Services)
PMI numbers have been consistently above the 50
mark after the end of 2013, signalling economic
expansion.
Source: Markit iBoxx Data
Additionally, the rebalancing of the economies that is
so needed in order to make the countries more
competitive has finally begun taking place. The unit
labour costs in Spain, Ireland and Portugal have been
dropping after 2009 while those in Germany have
been going up. The only exception is Italy where unit
labour costs have increased throughout the period.
Source: ECB
However, there are still underlying problems in the
countries. Unemployment is stubbornly high, public
debt is still at elevated levels and increasing, banking
sector problems have not been completely resolved.
Yet, Italy with its public debt to GDP ratio of 133%
and unstable politics can borrow at 2.8% for a ten
year period as of the middle of May. Although rated
below investment grade, Portugal can refinance at
3.5% for similar maturities. Even Greece, which went
through a restructuring of its debt, was able to tap the
markets with a 5 year bond yielding at 6.5%.
Therefore, we think that the recent drop in yields is
stepping into bubble territory.
Emerging market countries see investors coming back
Emerging market debts had a volatile year in 2013. A
number of countries, such as South Africa, India,
Turkey and others, suffered from significant currency
depreciation due to unprecedented capital outflow.
Meanwhile, political turmoil also added to the sell-off
pressure.
-5
0
5
10
15
20
25
Yie
ld (
%)
iBoxx € Portugal iBoxx € Ireland
iBoxx € Spain iBoxx € Italy
iBoxx € Germany
20
25
30
35
40
45
50
55
60
65
Italy PMI Composite Spain PMI Composite
Ireland PMI Composite
90
95
100
105
110
115
120
125
Un
it L
ab
ou
r c
os
ts
Spain Italy Portugal
Germany Ireland
LTRO

Markit iBoxx fixed income monthly market monitor \ June 2014
June 2014 3
iBoxx $ Emerging Market Corporates
Source: Markit iBoxx Data
However, investors are returning to emerging market
debt because of attractive risk-return profile. New
elections took place in Turkey and India; current
account deficit shrank in Indonesia; flash PMI and
export numbers for China have started to pick up
again. These positive news brought investors a
glimpse of hope. In May, iBoxx $ EM Sovereigns and
iBoxx $ EM Corporates index gained 2.90% and
2.37%, bringing the year to date return of 8.7% and
5.7%, respectively.
Although emerging market sovereign bonds have
higher yields than their developed market
counterparts, the yield pick-up brings significant risks.
The economies of these countries are still vulnerable
to unexpected market turmoil and currency instability
triggered risks might come back.
Market movements
Correlation increases; yields shifted down.
The correlation, measured on a yearly basis,
between US Treasuries and Euro Sovereigns rose
significantly to 67% from 39% in April. Meanwhile,
correlation between Treasuries and Gilts also
elevated to 63% from 43%. This change is likely
caused by expectations of ECB’s stimulus package
in June, which is becoming the new driver of global
rates market.
Annual yields of iBoxx $ Treasuries, iBoxx £ Gilts
and iBoxx € Sovereigns dropped, following similar
patterns. However, the yield curve moved in slightly
different ways. Euro yield curve had a parallel
downward shift while the Treasury yield curve held
on the short end and moved lower only in
intermediate and long end.
Source: Markit iBoxx Data
Except for Portugal, yields on Eurozone sovereigns
continued their move downwards. After experiencing
a 250 bps fall YTD, yields on Portuguese bonds
stalled the rally and remained flat in May. iBoxx €
Corporates gained 0.92%, with 8bps coming from
credit return, 66 bps coming from duration return and
28 bps from calendar return.
UK Gilts provided 0.94% return in May, slightly better
than last month. Meanwhile, iBoxx £ Corporates
registered a 1.35% gain with duration and credit
contributing 61bps and 38 bps, respectively.
US Treasuries and corporates both provided positive
returns. iBoxx $ Treasuries increased 1.09% and
iBoxx $ corporates surged 1.5% in May. For
corporates, the biggest gain came from duration
return, 109 bps.
US inflation-linked bonds as well as UK inflation-
linked bonds are starting to get investors’ interest.
iBoxx $ TIPS inflation-linked index registered 2.1%
gain while iBoxx £ inflation-linked index provided
1.04% return in May. In contrast, Eurozone is still
struggling with disinflation. For example, iBoxx
Germany inflation-linked index gained merely 0.2%
for the same period.
ETF Market Activity Review
US intermediate term treasuries ETF experienced strong
inflows
USD fixed income ETFs are the biggest winners of
fund inflows in May. In total, $ 11.6 billion proceeds
went to USD fixed income ETF instruments, with the
majority going to US Treasuries ($7.5 bn). Relieved
from imminent rate hike, investors felt more
comfortable to take on duration risk while still keeping
the necessary liquidity. Besides, US Corporates IG
4.6
4.8
5
5.2
5.4
5.6
5.8
6
6.2
-2%
0%
2%
4%
6%
8%
10%
Yie
ld (
%)
To
tal R
etu
rn (
%)
Total Return Yield
1.5
1.7
1.9
2.1
2.3
2.5
2.7
2.9
3.1
3.3
Yie
ld (
%)
iBoxx $ Treasuries iBoxx £ Gilt
iBoxx € Sovereigns

Markit iBoxx fixed income monthly market monitor \ June 2014
June 2014 4
and High Yield ETFs gained 0.9billion and 1.25 billion,
respectively.
Euro fixed income ETF market was relatively quiet in
May. Euro sovereign ETFs attracted around $0.93
billion fund inflow, while IG corporates and covered
bond funds received $0.6 billion and $0.35 billion,
respectively. On the other hand, high yield ETFs
incurred a $0.83 billion outflow.
Emerging market ETFs were very popular assets for
investors in May. iShares Emerging Markets Local
Government Bond UCITS ETF gained $400 million of
flow. Meanwhile, iShares J.P. Morgan $ Emerging
Markets Bond UCITS ETF attracted $188 million of
new assets.
Top 10 Fixed Income ETF providers by positive inflows in May (in $mm)
Source: Markit ETP Analytics
BlackRock was able to attract the biggest chunk of
inflows to its fixed income ETFs in May, with $13 bn.
One of its products, iShares 7-10 Year Treasury Bond
ETF received 5.2 billion. Similarly, ProShares Ultra 7-
10 Year Treasury ETF received around $2 billion of
new flows.
New ETF launches in May
Similar to previous month, there were no new Euro
fixed income ETF launches. Meanwhile, five new US
fixed income ETF funds were launched in May.
db X-trackers added to its portfolio the db X-trackers
Solactive Investment Grade Subordinated Debt Fund.
The ETF tracks the performance of subordinated and
junior subordinated debt denominated in US dollars.
PowerShares introduced the PowerShares Variable
Rate Preferred Portfolio ETF, which invests in
preferred stocks and hybrid securities that pay
floating or variable dividends or coupons. The
securities must be denominated in US dollars.
First Trust launched the First Trust Managed
Municipal ETF, which invests in intermediate and long
term investment grade municipal bonds, which are
exempt from federal income tax.
iShare US launched two interest rate hedged
products - iShare interest Rate Hedged Corporate
Bond ETF and iShare Interest Rate Hedged High
Yield Bond ETF. The funds are designed to provide
protection from rising rates by taking a short position
in treasury futures along with a long position in the
underlying corporate bonds.
0 2000 4000 6000 8000
BlackRock
ProShares
Vanguard
BMO Funds
State Street
Source
Société Générale
PIMCO
ComStage
Others

Markit iBoxx fixed income monthly market monitor \ June 2014
June 2014 5
Contents
Facts and figures ................................................................................................................................................ 6
Key trends: Markit iBoxx € Corporates and € Eurozone ............................................................................. 13
Key trends: Markit iBoxx € spot and swap curve ........................................................................................ 14
Key trends: Markit iBoxx £ Corporates and £ Gilts .................................................................................... 15
Key trends: Markit iBoxx £ spot and swap curve ........................................................................................ 16
Key trends: Markit iBoxx $ Corporates and $ Treasuries............................................................................ 17
Key trends: Markit iBoxx $ spot and swap curve ........................................................................................ 18
Markit iBoxx € Corporates rebalance movements ....................................................................................... 19
Markit iBoxx £ Corporates rebalance movements ....................................................................................... 19
Markit iBoxx $ Corporates rebalance movements ....................................................................................... 20
Markit iBoxx € Corporates rebalancing activity – May 14.......................................................................... 21
Markit iBoxx £ Corporates rebalancing activity – May 14.......................................................................... 22
Markit iBoxx $ Corporates rebalancing activity – May 14.......................................................................... 23
Analysis and trends .......................................................................................................................................... 26
€ Fixed income return attribution ................................................................................................................. 27
£ Fixed income return attribution ................................................................................................................. 28
$ Fixed income return attribution ................................................................................................................. 29
€ Fixed income stress test ............................................................................................................................ 36
£ Fixed income stress test ............................................................................................................................ 37
$ Fixed income stress test ............................................................................................................................ 38
Fixed income ETF market activity ................................................................................................................... 41
Markit iBoxx fixed income monthly market monitor \ June 2014
June 2014
6
Fixed income market
Facts and figures

Markit iBoxx fixed income monthly market monitor \ June 2014
June 2014 7
Figure 1: Global fixed income market YTD total returns
3.5%4.0%
4.3%
5.1%
7.3%
7.9%
5.4%
4.2%4.2%4.2%
5.1%
3.3%
8.7%
5.7%
6.6%
-1.2%
4.6%
6.0%
9.3%
5.9%
4.9%4.9%
2.3%
-2.0%
0.0%
2.0%
4.0%
6.0%
8.0%
10.0%
US
UK
Ge
rma
ny
Fra
nce
Italy
Sp
ain
US
IG
US
HY
EU
IG
EU
HY
UK
IG
UK
HY
EM
So
v U
SD
EM
Co
rp U
SD
Bra
zil
Ru
ssia
Ch
ina
Ind
ia
Tu
rke
y
Me
xico US
UK
Ge
rma
ny
Figure 2: Global fixed income market MTD total returns
1.1%0.9%1.0%
1.2%
0.7%0.8%
1.5%
0.93%0.92%
0.6%
1.4%
0.3%
2.9%
2.4%2.2%
3.8%
2.1%
2.4%2.3%
2.8%
2.1%
1.0%
0.2%
0.0%
0.5%
1.0%
1.5%
2.0%
2.5%
3.0%
3.5%
4.0%
US
UK
Ge
rma
ny
Fra
nce
Italy
Sp
ain
US
IG
US
HY
EU
IG
EU
HY
UK
IG
UK
HY
EM
So
v U
SD
EM
Co
rp U
SD
Bra
zil
Ru
ssia
Ch
ina
Ind
ia
Tu
rke
y
Me
xico US
UK
Ge
rma
ny
Source: Markit iBoxx Data
Sovereigns
Corporates Emerging Markets
Inflation Sovereigns
Sovereigns Corporates
Emerging Markets
Inflation
YTD
May

Markit iBoxx fixed income monthly market monitor \ June 2014
June 2014
8
Fixed income correlation
Table 1: 1-month correlation Correlation is based on daily returns for the period stated, excluding common holidays Correlation between indices in different currencies is based on unhedged daily returns in USD of the two indices Markit iBoxx CVBX index represents the performance of USD denominated convertible bonds
EUR GBP USD
Sov Corp IG HY Gilts Corp IG HY IL TSY Corp IG HY TIPS EM Sov
EM Corp Loans CVBX
EUR
Sov 1.00 0.64 0.57 0.59 0.61 0.10 0.39 0.39 0.52 0.15 0.42 0.47 0.48 0.16 0.17
Corp IG 0.64 1.00 0.76 0.67 0.73 0.36 0.49 0.28 0.36 0.21 0.32 0.35 0.33 0.23 0.20
HY 0.57 0.76 1.00 0.48 0.56 0.40 0.30 0.11 0.21 0.29 0.12 0.26 0.23 0.30 0.15
GBP
Gilts 0.59 0.67 0.48 1.00 0.99 0.27 0.89 0.54 0.56 0.03 0.65 0.43 0.42 0.02 0.33
Corp IG 0.61 0.73 0.56 0.99 1.00 0.36 0.86 0.47 0.51 0.13 0.56 0.44 0.40 0.11 0.33
HY 0.10 0.36 0.40 0.27 0.36 1.00 0.15 -0.50 -0.44 -0.05 -0.40 -0.38 -0.54 0.02 0.00
IL 0.39 0.49 0.30 0.89 0.86 0.15 1.00 0.51 0.48 0.02 0.56 0.42 0.42 -0.05 0.34
USD
TSY 0.39 0.28 0.11 0.54 0.47 -0.50 0.51 1.00 0.96 0.26 0.90 0.54 0.81 0.04 0.48
Corp IG 0.52 0.36 0.21 0.56 0.51 -0.44 0.48 0.96 1.00 0.33 0.88 0.59 0.85 0.17 0.45
HY 0.15 0.21 0.29 0.03 0.13 -0.05 0.02 0.26 0.33 1.00 0.07 0.29 0.38 0.80 0.26
TIPS 0.42 0.32 0.12 0.65 0.56 -0.40 0.56 0.90 0.88 0.07 1.00 0.58 0.75 0.03 0.50
EM Sov 0.47 0.35 0.26 0.43 0.44 -0.38 0.42 0.54 0.59 0.29 0.58 1.00 0.88 0.31 0.22
EM Corp 0.48 0.33 0.23 0.42 0.40 -0.54 0.42 0.81 0.85 0.38 0.75 0.88 1.00 0.30 0.33
Loans 0.16 0.23 0.30 0.02 0.11 0.02 -0.05 0.04 0.17 0.80 0.03 0.31 0.30 1.00 0.34
CVBX 0.17 0.20 0.15 0.33 0.33 0.00 0.34 0.48 0.45 0.26 0.50 0.22 0.33 0.34 1.00
Source: Markit iBoxx Data

Markit iBoxx fixed income monthly market monitor \ June 2014
June 2014 9
Fixed income correlation
Table 2: 1-year correlation Correlation is based on daily returns for the period stated, excluding common holidays Correlation between indices in different currencies is based on unhedged daily returns in USD of the two indices Markit iBoxx CVBX index represents the performance of USD denominated convertible bonds
EUR GBP USD
Sov Corp IG HY Gilts Corp IG HY IL TSY Corp IG HY TIPS
EM Sov
EM Corp Loans CVBX
Euro
Sov 1.00 0.84 0.21 0.73 0.72 0.51 0.67 0.45 0.55 0.37 0.45 0.41 0.47 0.10 -0.03
Corp IG 0.84 1.00 0.30 0.72 0.71 0.54 0.64 0.39 0.49 0.37 0.39 0.39 0.45 0.11 -0.03
HY 0.21 0.30 1.00 0.59 0.61 0.55 0.53 0.25 0.37 0.39 0.28 0.36 0.42 0.16 0.01
GBP
Gilts 0.73 0.72 0.59 1.00 0.96 0.08 0.85 0.43 0.51 0.33 0.40 0.36 0.43 0.01 -0.04
Corp IG 0.72 0.71 0.61 0.96 1.00 0.21 0.79 0.39 0.48 0.41 0.36 0.39 0.47 0.08 -0.02
HY 0.51 0.54 0.55 0.08 0.21 1.00 0.03 0.05 0.14 0.35 0.06 0.25 0.32 0.14 0.05
IL 0.67 0.64 0.53 0.85 0.79 0.03 1.00 0.41 0.48 0.29 0.39 0.34 0.40 -0.05 -0.05
USD
TSY 0.45 0.39 0.25 0.43 0.39 0.05 0.41 1.00 0.91 0.17 0.91 0.36 0.44 -0.01 -0.08
Corp IG 0.55 0.49 0.37 0.51 0.48 0.14 0.48 0.91 1.00 0.41 0.84 0.55 0.65 0.06 -0.07
HY 0.37 0.37 0.39 0.33 0.41 0.35 0.29 0.17 0.41 1.00 0.20 0.64 0.72 0.39 0.04
TIPS 0.45 0.39 0.28 0.40 0.36 0.06 0.39 0.91 0.84 0.20 1.00 0.40 0.45 0.04 -0.04
EM Sov 0.41 0.39 0.36 0.36 0.39 0.25 0.34 0.36 0.55 0.64 0.40 1.00 0.91 0.19 0.00
EM Corp 0.47 0.45 0.42 0.43 0.47 0.32 0.40 0.44 0.65 0.72 0.45 0.91 1.00 0.19 0.00
Loans 0.10 0.11 0.16 0.01 0.08 0.14 -0.05 -0.01 0.06 0.39 0.04 0.19 0.19 1.00 0.00
CVBX -0.03 -0.03 0.01 -0.04 -0.02 0.05 -0.05 -0.08 -0.07 0.04 -0.04 0.00 0.00 0.00 1.00
Source: Markit iBoxx Data

Markit iBoxx fixed income monthly market monitor \ June 2014
June 2014
10
Table 3: Markit iBoxx € market snapshot: the month in figures
Markit iBoxx Index Total Return Yield OAS Bonds Duration
Month YTD Current Month YTD Current Month YTD
€ Overall 0.94% 5.07% 1.88% -0.12% -0.65% 72.1 0.6 -11.9 2,838 5.9
Sovereigns
€ Eurozone 0.97% 5.82% 2.03% -0.11% -0.67% 69.6 1.2 -14.5 279 6.6
€ Germany 1.00% 4.34% 1.40% -0.12% -0.51% 0.2 -0.4 1.0 51 6.9
€ France 1.16% 5.06% 1.77% -0.13% -0.56% 40.2 -1.2 -3.2 41 7.0
€ Italy 0.70% 7.27% 2.88% -0.07% -0.90% 160.9 7.4 -34.4 59 6.3
€ Netherlands 1.03% 4.60% 1.54% -0.13% -0.51% 16.0 -0.5 -1.6 22 7.0
€ Spain 0.83% 7.95% 2.61% -0.10% -1.10% 144.5 4.0 -58.5 33 5.7
€ Austria 1.15% 5.04% 1.62% -0.13% -0.53% 23.2 -1.2 -1.5 19 7.2
€ Belgium 1.30% 5.73% 1.92% -0.14% -0.57% 48.2 -1.9 -6.6 23 7.5
€ Portugal 0.21% 14.89% 3.10% 0.02% -2.40% 216.6 17.6 -187.4 11 5.1
€ Ireland 0.94% 6.79% 1.90% -0.13% -0.99% 109.0 2.0 -43.2 10 5.3
Corporates
€ Corporates 0.92% 4.23% 1.86% -0.15% -0.62% 110.5 -0.8 -10.4 1,457 4.7
€ Corporates A 0.91% 3.93% 1.73% -0.15% -0.59% 93.7 -0.7 -6.0 659 4.8
€ Corporates AA 0.98% 3.82% 1.45% -0.18% -0.61% 70.1 -3.7 -8.3 146 4.6
€ Corporates AAA 1.33% 5.85% 2.00% -0.15% -0.24% 62.4 -0.1 10.2 6 7.9
€ Corporates BBB 0.92% 4.69% 2.14% -0.13% -0.67% 145.4 0.5 -16.6 646 4.5
€ Banks 0.80% 3.84% 1.71% -0.15% -0.66% 112.7 0.1 -13.6 416 4.1
€ Basic Materials 0.99% 4.12% 1.75% -0.11% -0.64% 98.6 0.9 -10.9 71 4.8
€ Consumer Goods 0.87% 3.62% 1.72% -0.13% -0.37% 89.4 -0.2 7.7 168 4.9
€ Consumer Services 1.09% 4.47% 1.86% -0.17% -0.62% 101.6 -5.1 -12.6 59 5.3
€ Financials 0.82% 4.03% 1.84% -0.14% -0.68% 121.5 0.9 -14.5 563 4.2
€ Health Care 0.69% 2.91% 1.29% -0.14% -0.54% 70.4 -0.8 -1.1 26 4.0
€ Industrial Goods & Services
0.90% 4.30% 1.69% -0.15% -0.66% 100.5 -1.5 -12.4 117 4.7
€ Industrials 0.91% 4.31% 1.69% -0.14% -0.66% 101.1 -0.9 -12.4 141 4.6
€ Insurance 0.62% 5.55% 2.82% -0.03% -0.80% 199.6 10.3 -21.5 61 4.9
€ Non-Financials 1.01% 4.40% 1.87% -0.15% -0.59% 103.3 -1.7 -7.0 894 5.1
€ Oil & Gas 1.41% 4.36% 2.03% -0.21% -0.47% 119.4 -6.6 -3.4 79 5.1
€ Retail 1.06% 4.37% 1.94% -0.16% -0.56% 100.3 -5.3 -9.0 36 5.5
€ Technology 1.34% 6.15% 1.98% -0.16% -0.58% 70.8 -0.6 -8.6 12 7.4
€ Telecommunications 1.04% 4.95% 2.03% -0.14% -0.64% 109.5 -1.6 -9.5 118 5.4
€ Utilities 1.01% 4.85% 2.00% -0.15% -0.66% 112.3 -1.4 -9.6 220 5.2
€ Covered 0.76% 3.63% 1.37% -0.14% -0.63% 68.4 -0.2 -10.2 628 4.3
High Yield
€ High Yield 0.60% 4.20% 3.69% -0.08% -0.87% 332.2 10.9 -17.2 492 3.0
€ High Yield B 0.49% 3.98% 5.32% 0.04% -0.87% 489.4 32.8 18.0 158 2.2
€ High Yield BB 0.59% 4.03% 3.12% -0.10% -0.76% 267.9 3.7 -16.7 300 3.3
€ High Yield CCC 1.37% 6.16% 8.91% -0.74% -1.17% 789.5 -8.2 -32.7 26 1.9
Inflation-linked
€ France Inflation-Linked 0.60% 3.51% 0.24% -0.07% -0.41% -118.5 5.5 18.0 19 7.7
€ Germany Inflation-Linked 0.20% 2.29% -0.29% 0.02% -0.38% -115.2 5.1 10.8 5 5.4
Source: Markit iBoxx Data
€
Markit iBoxx fixed income monthly market monitor \ June 2014
June 2014 11
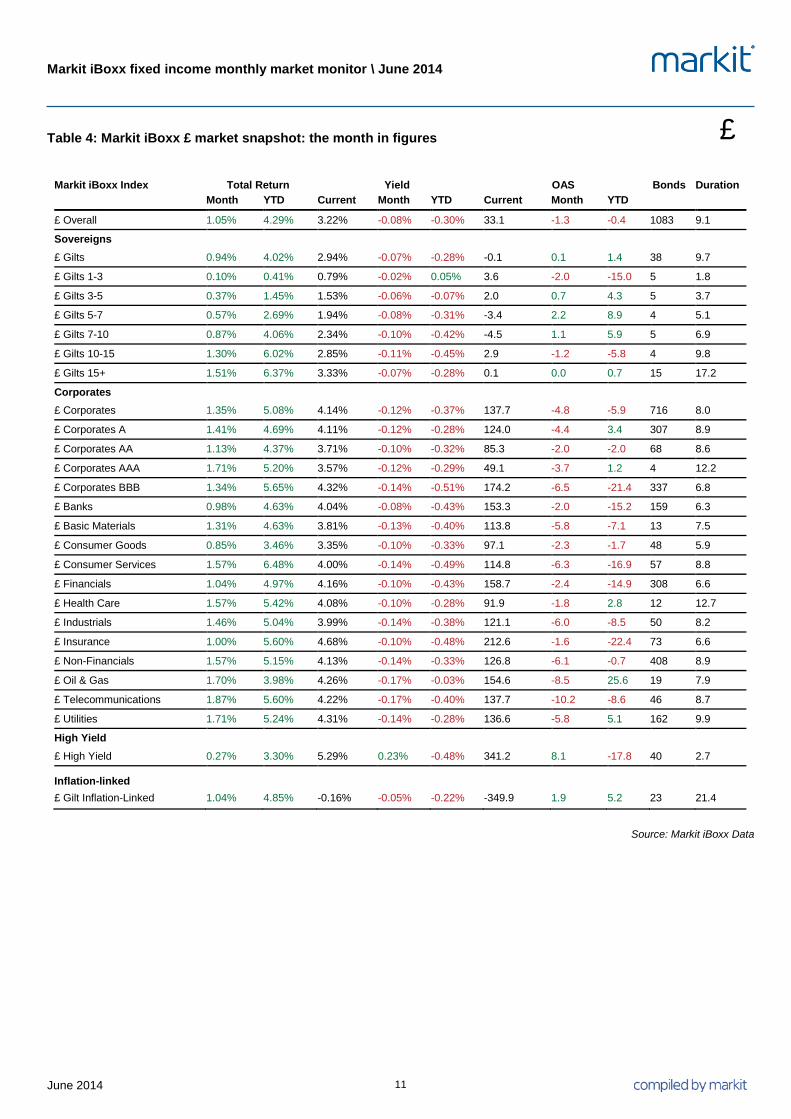
Table 4: Markit iBoxx £ market snapshot: the month in figures
Markit iBoxx Index Total Return Yield OAS Bonds Duration
Month YTD Current Month YTD Current Month YTD
£ Overall 1.05% 4.29% 3.22% -0.08% -0.30% 33.1 -1.3 -0.4 1083 9.1
Sovereigns
£ Gilts 0.94% 4.02% 2.94% -0.07% -0.28% -0.1 0.1 1.4 38 9.7
£ Gilts 1-3 0.10% 0.41% 0.79% -0.02% 0.05% 3.6 -2.0 -15.0 5 1.8
£ Gilts 3-5 0.37% 1.45% 1.53% -0.06% -0.07% 2.0 0.7 4.3 5 3.7
£ Gilts 5-7 0.57% 2.69% 1.94% -0.08% -0.31% -3.4 2.2 8.9 4 5.1
£ Gilts 7-10 0.87% 4.06% 2.34% -0.10% -0.42% -4.5 1.1 5.9 5 6.9
£ Gilts 10-15 1.30% 6.02% 2.85% -0.11% -0.45% 2.9 -1.2 -5.8 4 9.8
£ Gilts 15+ 1.51% 6.37% 3.33% -0.07% -0.28% 0.1 0.0 0.7 15 17.2
Corporates
£ Corporates 1.35% 5.08% 4.14% -0.12% -0.37% 137.7 -4.8 -5.9 716 8.0
£ Corporates A 1.41% 4.69% 4.11% -0.12% -0.28% 124.0 -4.4 3.4 307 8.9
£ Corporates AA 1.13% 4.37% 3.71% -0.10% -0.32% 85.3 -2.0 -2.0 68 8.6
£ Corporates AAA 1.71% 5.20% 3.57% -0.12% -0.29% 49.1 -3.7 1.2 4 12.2
£ Corporates BBB 1.34% 5.65% 4.32% -0.14% -0.51% 174.2 -6.5 -21.4 337 6.8
£ Banks 0.98% 4.63% 4.04% -0.08% -0.43% 153.3 -2.0 -15.2 159 6.3
£ Basic Materials 1.31% 4.63% 3.81% -0.13% -0.40% 113.8 -5.8 -7.1 13 7.5
£ Consumer Goods 0.85% 3.46% 3.35% -0.10% -0.33% 97.1 -2.3 -1.7 48 5.9
£ Consumer Services 1.57% 6.48% 4.00% -0.14% -0.49% 114.8 -6.3 -16.9 57 8.8
£ Financials 1.04% 4.97% 4.16% -0.10% -0.43% 158.7 -2.4 -14.9 308 6.6
£ Health Care 1.57% 5.42% 4.08% -0.10% -0.28% 91.9 -1.8 2.8 12 12.7
£ Industrials 1.46% 5.04% 3.99% -0.14% -0.38% 121.1 -6.0 -8.5 50 8.2
£ Insurance 1.00% 5.60% 4.68% -0.10% -0.48% 212.6 -1.6 -22.4 73 6.6
£ Non-Financials 1.57% 5.15% 4.13% -0.14% -0.33% 126.8 -6.1 -0.7 408 8.9
£ Oil & Gas 1.70% 3.98% 4.26% -0.17% -0.03% 154.6 -8.5 25.6 19 7.9
£ Telecommunications 1.87% 5.60% 4.22% -0.17% -0.40% 137.7 -10.2 -8.6 46 8.7
£ Utilities 1.71% 5.24% 4.31% -0.14% -0.28% 136.6 -5.8 5.1 162 9.9
High Yield
£ High Yield 0.27% 3.30% 5.29% 0.23% -0.48% 341.2 8.1 -17.8 40 2.7
Inflation-linked
£ Gilt Inflation-Linked 1.04% 4.85% -0.16% -0.05% -0.22% -349.9 1.9 5.2 23 21.4
Source: Markit iBoxx Data
£

Markit iBoxx fixed income monthly market monitor \ June 2014
June 2014 12
Table 5: Markit iBoxx $ market snapshot: the month in figures
Markit iBoxx Index Total Return Yield OAS Bonds Duration
Month YTD Current Month YTD Current Month YTD
$ Overall 1.23% 4.03% 2.77% -0.15% -0.41% 50.9 -0.4 -1.7 5281 5.8
Sovereigns
$ Treasuries 1.09% 3.47% 2.23% -0.14% -0.36% -1.1 4.1 -3.1 246 5.7
$ Treasuries 1-3Y 0.17% 0.45% 0.42% -0.05% -0.02% 1.1 2.9 -3.1 88 1.8
$ Treasuries 3-5Y 0.70% 1.54% 1.18% -0.13% -0.11% 0.1 5.6 1.7 59 3.7
$ Treasuries 5-7Y 1.27% 3.16% 1.76% -0.20% -0.34% 0.2 6.2 -3.7 38 5.4
$ Treasuries 7-10Y 1.87% 5.38% 2.24% -0.22% -0.53% 0.2 4.5 -6.6 20 7.4
$ Treasuries 10-15Y 2.20% 7.96% 2.66% -0.21% -0.69% -0.4 3.2 -5.1 12 9.5
$ Treasuries 15Y+ 3.00% 13.41% 3.25% -0.16% -0.69% -3.2 3.0 -3.1 29 17.0
Corporates
$ Corporates 1.50% 5.43% 3.72% -0.17% -0.52% 133.3 -0.3 -6.4 3,980 6.6
$ Corporates A 1.26% 4.61% 3.40% -0.14% -0.44% 106.8 2.2 0.7 1662 6.3
$ Corporates AA 1.20% 4.25% 3.28% -0.13% -0.37% 90.9 3.2 4.6 441 6.3
$ Corporates AAA 1.51% 5.85% 3.44% -0.10% -0.59% 74.6 3.7 2.5 48 8.4
$ Corporates BBB 1.84% 6.63% 4.16% -0.20% -0.63% 172.1 -3.2 -15.4 1829 6.9
$ Banks 1.26% 3.59% 3.31% -0.19% -0.37% 137.7 -4.7 -6.5 866 4.8
$ Basic Materials 1.61% 6.67% 4.28% -0.17% -0.57% 180.5 0.8 -9.9 248 7.3
$ Consumer Goods 1.14% 4.77% 3.38% -0.14% -0.49% 106.2 3.7 -3.7 336 6.2
$ Consumer Services 1.55% 7.68% 3.92% -0.15% -0.67% 125.7 2.0 -13.3 356 8.2
$ Financials 1.26% 4.06% 3.41% -0.18% -0.43% 136.2 -2.6 -7.7 1340 5.1
$ Health Care 1.36% 5.34% 3.59% -0.13% -0.44% 102.9 3.6 3.4 283 7.5
$ Industrials 1.43% 5.96% 3.61% -0.15% -0.56% 112.7 2.3 -6.4 314 7.2
$ Insurance 1.36% 6.71% 4.01% -0.17% -0.66% 150.0 1.7 -15.2 189 7.2
$ Non-Financials 1.64% 6.26% 3.85% -0.17% -0.56% 132.2 0.7 -5.8 2640 7.4
$ Oil & Gas 2.19% 6.44% 4.07% -0.22% -0.56% 156.3 -5.2 -6.4 521 7.3
$ Technology 1.19% 4.76% 3.24% -0.12% -0.49% 96.7 5.6 -1.9 150 6.2
$ Telecommunications 1.94% 6.82% 4.15% -0.19% -0.57% 150.1 -1.9 -3.8 160 8.1
$ Utilities 1.83% 7.57% 4.01% -0.17% -0.63% 129.2 0.9 -7.1 272 8.8
High Yield
$ Liquid High Yield 0.93% 4.16% 5.15% -0.12% -0.58% 335.5 14.0 -16.4 892 3.5
Inflation-linked
$ TIPS Inflation-Linked 2.10% 4.90% 0.29% -0.24% -0.51% -230.3 -1.9 -1.9 35 8.5
Emerging Markets
$ EM Sovereigns 2.90% 8.69% 5.10% -0.33% -0.79% 257.8 -15.1 -28.5 299 7.4
$ EM Corporates 2.37% 5.70% 5.02% -0.43% -0.68% 295.1 -27.3 -29.8 1213 5.0
Loans
$ Leveraged Loans 0.58% 1.87% 0.00% 0.00% 0.00% 0.0 0.0 0.0 991 0.0
RMBS
$ US RMBS Seniors 1.14% 6.33% 0.00% 0.00% 0.00% 0.0 0.0 0.0 350 0.0
Convertible
$ CVBX 2.94% 8.10% -0.46% -0.42% 1.05% 0.0 0.0 0.0 100 7.0
Source: Markit iBoxx Data
$

Markit iBoxx fixed income monthly market monitor \ June 2014
June 2014 13
Key trends: Markit iBoxx € Corporates and € Eurozone
Figure 3: € Total return Figure 4: € Yield
0
0.5
1
1.5
2
2.5
3
3.5
€ Corporates € Eurozone
Figure 5: € Duration Figure 6: € ASW
0
50
100
150
200
250
AS
W (
bp
s)
€ Corporates AAA € Corporates AA
€ Corporates A € Corporates BBB
Source: Markit iBoxx Data
€
0
1
2
3
4
5
6
7
€ Corporates € Eurozone
90
92
94
96
98
100
102
104
106
€ Corporates € Eurozone

Markit iBoxx fixed income monthly market monitor \ June 2014
June 2014 14
Key trends: Markit iBoxx € spot and swap curve
Figure 7: € Spot curve Figure 8: € Curve steepness
0
20
40
60
80
100
120
140
160
180
200
Bps
2s10s 10s30s
Figure 9: € Spot vs. Swap curve Figure 10: € One month change Spot vs. Swap
-18
-16
-14
-12
-10
-8
-6
-4
-2
0
2Y 5Y 10Y 30Y
Bps
Spot Swap
Source: Markit iBoxx Data
€
0
0.5
1
1.5
2
2.5
3
0 10 20 30 40 50
Yie
ld
Maturity
Yield curve 2014-May-30 Yield curve 2014-Apr-30
Swap curve 2014-May-30 Swap curve 2014-Apr-30
0
0.5
1
1.5
2
2.5
3
0 10 20 30 40 50
Yie
ld
Maturity
2014-May-30 2014-Apr-30 2013-May-30

Markit iBoxx fixed income monthly market monitor \ June 2014
June 2014 15
Key trends: Markit iBoxx £ Corporates and £ Gilts
Figure 11: £ Total return Figure 12: £ Yield
0
0.5
1
1.5
2
2.5
3
3.5
4
4.5
5
£ Corporates £ Gilts
Figure 13: £ Duration Figure 14: £ ASW
0
50
100
150
200
250
300
Bp
s
£ Corporates AAA £ Corporates AA
£ Corporates A £ Corporates BBB
Source: Markit iBoxx Data
£
0
2
4
6
8
10
12
£ Corporates £ Gilts
88
90
92
94
96
98
100
102
104
106
108
£ Corporates £ Gilts

Markit iBoxx fixed income monthly market monitor \ June 2014
June 2014 16
Key trends: Markit iBoxx £ spot and swap curve
Figure 15: £ Spot curve Figure 16: £ Curve steepness
0
50
100
150
200
250
300
Bp
s
2s10s 10s30s
Figure 17: £ Spot vs. Swap curve Figure 18: £ One month change Spot vs. Swap
-12
-10
-8
-6
-4
-2
0
2
4
2Y 5Y 10Y 30Y
Bp
s
Spot Swap
Source: Markit iBoxx Data
£
0
0.5
1
1.5
2
2.5
3
3.5
4
0 10 20 30 40 50
Yie
ld
Maturity
Yield curve 2014-May-30 Yield curve 2014-Apr-30
Swap curve 2014-May-30 Swap curve 2014-Apr-30
-0.5
0
0.5
1
1.5
2
2.5
3
3.5
4
0 10 20 30 40 50
Yie
ld
Maturity
2014-May-30 2014-Apr-30 2013-May-30

Markit iBoxx fixed income monthly market monitor \ June 2014
June 2014 17
Key trends: Markit iBoxx $ Corporates and $ Treasuries
Figure 19: $ Total return Figure 20: $ Yield
0
0.5
1
1.5
2
2.5
3
3.5
4
4.5
5
$ Corporates $ Treasuries
Figure 21: $ Duration Figure 22: $ ASW
0
50
100
150
200
250
AS
W (
bp
s)
$ Corporates AAA $ Corporates AA
$ Corporates A $ Corporates BBB
Source: Markit iBoxx Data
$
0
1
2
3
4
5
6
7
$ Corporates $ Treasuries
90
92
94
96
98
100
102
104
106
$ Corporates $ Treasuries

Markit iBoxx fixed income monthly market monitor \ June 2014
June 2014 18
Key trends: Markit iBoxx $ spot and swap curve
Figure 23: $ Spot curve Figure 24: $ Curve steepness
0
50
100
150
200
250
300
350
Bp
s
2s10s 10s30s
Figure 25: $ Spot vs. Swap curve Figure 26: $ One month change Spot vs. Swap
-25
-20
-15
-10
-5
0
5
2Y 5Y 10Y 30Y
Bp
s
Spot Swap
Source: Markit iBoxx Data
$
0
0.5
1
1.5
2
2.5
3
3.5
4
0 5 10 15 20 25 30
Yie
ld
Maturity
Yield curve 2014-May-30 Yield curve 2014-Apr-30
Swap curve 2014-May-30 Swap curve 2014-Apr-30
0
0.5
1
1.5
2
2.5
3
3.5
4
0 5 10 15 20 25 30
Yie
ld
Maturity
2014-May-30 2014-Apr-30 2013-May-30

Markit iBoxx fixed income monthly market monitor \ June 2014
June 2014 19
Markit iBoxx € Corporates rebalance movements
Table 6: Index rebalance stats
After rebalance
Changes due to rebalance
Sub-Index Bonds Weight Yield Duration OAS
Bonds Weight Yield Duration OAS
Corporates 1,476 100% 1.88 4.77 110.93
+19 0.0% 0.02 0.10 0.51
Non-Financials 903 55.8% 1.89 5.14 103.65
+9 -0.1% 0.02 0.08 0.39
Financials 573 44.2% 1.86 4.31 121.93
+10 0.1% 0.03 0.12 0.52
AAA 6 0.5% 2.00 7.85 62.41
0 0.0% 0.00 0.00 0.00
AA 142 12.6% 1.46 4.72 70.09
-4 -0.5% 0.01 0.12 0.07
A 671 46.4% 1.76 4.93 94.44
+12 0.5% 0.03 0.12 0.79
BBB 657 40.6% 2.16 4.57 145.59
+11 0.1% 0.01 0.06 0.27
1-3y 381 27.1% 0.96 1.99 91.44
-1 -0.5% -0.03 0.07 -3.88
3-5y 388 25.3% 1.35 3.70 106.91
+4 -0.2% 0.03 0.06 1.96
5-7y 334 22.9% 1.75 5.53 112.93
+6 0.3% 0.03 0.05 1.84
7-10y 268 17.7% 2.24 7.29 119.19
+5 0.2% 0.01 0.08 -0.70
10-15y 83 5.5% 2.67 9.74 110.18
+4 0.2% 0.04 0.09 2.15
15+ 22 1.4% 3.21 13.69 113.29
+1 0.0% -0.01 0.04 -1.09
Markit iBoxx £ Corporates rebalance movements
Table 7: Index rebalance stats
After rebalance
Changes due to rebalance
Sub-Index Bonds Weight Yield Duration OAS
Bonds Weight Yield Duration OAS
Corporates 721 100% 4.13 7.99 137.49
+5 0.0% 0.00 0.02 -0.23
Non-Financials 411 58.7% 4.12 8.89 126.67
+3 -0.1% 0.00 -0.02 -0.12
Financials 310 41.3% 4.16 6.71 157.78
+2 0.1% 0.00 0.09 -0.88
AAA 5 0.7% 3.65 13.90 50.64
+1 0.1% 0.08 1.72 1.52
AA 68 10.9% 3.71 8.56 85.25
0 -0.1% 0.00 0.00 0.00
A 309 44.7% 4.11 8.91 124.25
+2 0.2% 0.00 0.00 0.23
BBB 339 43.7% 4.31 6.83 173.97
+2 -0.2% 0.00 0.01 -0.16
1-3y 115 12.6% 2.22 1.96 138.55
+3 0.3% 0.06 0.05 3.44
3-5y 117 14.5% 2.75 3.60 124.55
+6 0.6% 0.05 0.08 1.62
5-7y 93 12.0% 3.55 5.06 152.62
-1 0.3% 0.10 0.11 6.36
7-10y 109 15.0% 3.89 6.87 147.59
-4 -1.1% -0.04 0.11 -5.53
10-15y 115 16.3% 4.28 9.27 148.78
+1 0.1% 0.01 0.06 0.59
15+ 172 29.6% 4.52 13.77 129.91
0 -0.2% 0.00 0.04 -0.45
Source: Markit iBoxx Data
€
£

Markit iBoxx fixed income monthly market monitor \ June 2014
June 2014 20
Markit iBoxx $ Corporates rebalance movements
Table 8: Index rebalance stats
After rebalance
Changes due to rebalance
Sub-Index Bonds Weight Yield Duration OAS
Bonds Weight Yield Duration OAS
Corporates 4,041 100% 3.73 6.61 133.26
+61 0.0% 0.00 0.04 0.02
Non-Financials 2,685 62.7% 3.86 7.46 132.04
+45 0.2% 0.00 0.04 0.03
Financials 1,356 37.3% 3.42 5.17 136.20
+16 -0.2% 0.00 0.04 0.00
AAA 47 1.0% 3.44 8.49 74.56
-1 0.0% 0.01 0.13 0.05
AA 459 13.5% 3.27 6.34 90.51
+18 0.4% -0.01 0.03 -0.33
A 1,689 43.4% 3.40 6.30 106.77
+27 -0.1% 0.00 0.04 0.04
BBB 1,846 42.1% 4.17 6.97 172.44
+17 -0.2% 0.01 0.06 0.49
1-3y 859 20.1% 1.17 1.99 68.75
+24 0.4% 0.03 0.07 -0.45
3-5y 919 23.3% 2.11 3.70 90.87
+15 0.2% 0.04 0.07 1.49
5-7y 543 13.5% 3.00 5.24 122.49
+2 -0.2% 0.03 0.09 0.25
7-10y 836 19.9% 3.60 7.17 135.07
+1 -0.2% 0.02 0.08 0.23
10-15y 51 1.1% 4.26 9.11 162.37
+5 0.0% 0.02 0.12 0.12
15+ 833 22.3% 4.71 14.02 155.19
+14 -0.1% 0.01 0.04 0.30
Source: Markit iBoxx Data
$

Markit iBoxx fixed income monthly market monitor \ June 2014
June 2014 21
Markit iBoxx € Corporates rebalancing activity – May 14
Table 9: iBoxx € Corporates - Out
ISIN Issuer Sector Rating Maturity Weight Reason
DE000A1MLSR4 DAIMLER AG Automobiles & Parts A 21/05/2015 0.07% <1Y
XS0364671346 BMW US CAP LLC Automobiles & Parts A 28/05/2015 0.13% <1Y
XS0624668801 SANTANDER INTL Banks BBB 18/05/2015 0.07% <1Y
XS0272401356 HAA-BANK INTL AG Banks BB 31/10/2016 0.09% Downgraded
XS0281875483 HAA-BANK INTL AG Banks BB 24/01/2017 0.14% Downgraded
XS0363922823 TORONTO DOM BANK Banks AA 14/05/2015 0.15% <1Y
XS0365320174 NATL AUSTRALIABK Banks AA 20/05/2015 0.09% <1Y
XS0366202694 XSTRATA CAN FIN Basic Resources BBB 27/05/2015 0.04% <1Y
XS0782580392 DVB BANK SE Financial Services A 15/05/2015 0.04% <1Y
XS0363471805 GE CAP EUR FUND Financial Services AA 18/05/2015 0.15% <1Y
FR0010612713 DANONE Food & Beverage A 06/05/2015 0.04% <500M
XS0782692510 CATERPILLAR INTL Industrial Goods & Services A 18/05/2015 0.04% <1Y
XS0218469962 GENERALI FINANCE Insurance BBB 06/05/2015 0.04% <1Y
XS0428461718 TOTAL CAPITAL Oil & Gas AA 19/05/2015 0.04% <1Y
XS0218734118 TELIA AB Telecommunications A 11/05/2015 0.05% <1Y
FR0010612622 RTE EDF TRANSPOR Utilities A 06/05/2015 0.09% <1Y
Source: Markit iBoxx Data
Table 10: iBoxx € Corporates - In
ISIN Issuer Sector Rating Maturity Weight Reason
ES0314970239 LA CAIXA Banks BBB 09/05/2019 0.07% New Issue
XS1068866950 DANSKE BANK A/S Banks BBB 19/05/2021 0.03% New Issue
XS1068871448 BNP PARIBAS Banks A 20/05/2024 0.07% New Issue
XS1069518451 SPAREBANK 1 SMN Banks A 20/05/2019 0.03% New Issue
XS1069521083 CREDIT AGRICOLE Banks A 20/05/2024 0.10% New Issue
FR0011915321 BPCE Banks A 22/05/2019 0.10% New Issue
XS1069772082 RABOBANK Banks A 26/05/2021 0.14% New Issue
XS1069549761 BANQ FED CRD MUT Banks A 21/05/2024 0.07% New Issue
BE6266619319 BELFIUS BANK SA Banks BBB 22/05/2017 0.03% New Issue
XS1068874970 CITIGROUP INC Banks A 22/05/2024 0.07% New Issue
XS1072796870 SKANDINAV ENSKIL Banks BBB 28/05/2021 0.07% New Issue
XS1074053130 CREDIT SUISSE LD Banks A 29/11/2019 0.12% New Issue
XS0287195233 DANSKE BANK A/S Banks BBB 15/05/2017 0.04% Other
XS0336744650 UBS AG JERSEY Banks BBB 21/12/2017 0.05% Other
XS0992293570 SOLVAY FIN Chemicals BBB 12/05/2019 0.05% Other
XS0992293901 SOLVAY FIN Chemicals BBB 12/11/2023 0.04% Other
XS1069522057 JEFFERIES GROUP Financial Services BBB 20/05/2020 0.03% New Issue
XS1069539374 DIAGEO FIN PLC Food & Beverage A 20/04/2019 0.06% New Issue
XS1069539291 DIAGEO FIN PLC Food & Beverage A 20/05/2026 0.06% New Issue
€

Markit iBoxx fixed income monthly market monitor \ June 2014
June 2014 22
XS1070363343 KAZAGRO NATL MGM Food & Beverage BBB 22/05/2019 0.04% New Issue
XS1070075988 KELLOGG CO Food & Beverage BBB 24/05/2021 0.03% New Issue
XS1071713470 CARLSBERG BREW Food & Beverage BBB 28/05/2024 0.07% New Issue
XS1028955091 ILLINOIS TOOL WK Industrial Goods & Services A 20/05/2022 0.03% New Issue
XS1028954870 ILLINOIS TOOL WK Industrial Goods & Services A 19/02/2034 0.04% New Issue
XS1069552393 HEATHROW FNDG Industrial Goods & Services A 23/05/2022 0.04% New Issue
XS1062900912 ASSICURAZIONI Insurance BBB 04/05/2026 0.07% New Issue
XS1062493934 AON PLC Insurance BBB 14/02/2026 0.04% New Issue
XS1069439740 AXA SA Insurance A 08/10/2025 0.07% New Issue
XS1068765418 PEARSON FUND FIV Media BBB 19/05/2021 0.03% New Issue
XS1066312395 PHILIP MORRIS IN Personal & Household Goods
A 14/05/2029 0.04% New Issue
XS1028954953 BHARTI AIRTEL IN Telecommunications BBB 20/05/2021 0.05% New Issue
XS1069430368 TELEFONICA EMIS Telecommunications BBB 27/05/2022 0.09% New Issue
BE0002470459 EANDIS Utilities A 07/05/2029 0.04% New Issue
FR0011911239 GDF SUEZ Utilities A 19/05/2020 0.08% New Issue
FR0011911247 GDF SUEZ Utilities A 19/05/2026 0.09% New Issue
Source: Markit iBoxx Data
Markit iBoxx £ Corporates rebalancing activity – May 14
Table 11: iBoxx £ Corporates - Out
ISIN Issuer Sector Rating Maturity Weight Reason
XS0366686284 LLOYDS BANK PLC Banks 0 29/05/2015 0.23% <1Y
Source: Markit iBoxx Data
Table 12: iBoxx £ Corporates - In
ISIN Issuer Sector Rating Maturity Weight Reason
XS1064797126 RCI BANQUE Automobiles & Parts BBB 09/05/2019 0.07% New Issue
XS1066467678 VOLKSWAGEN FIN Automobiles & Parts A 13/11/2018 0.09% New Issue
XS1069529490 FCE BANK PLC Automobiles & Parts BBB 20/11/2018 0.07% New Issue
XS1069886841 RABOBANK Banks A 23/05/2029 0.29% New Issue
XS0279056419 DANSKE BANK A/S Banks BBB 15/02/2017 0.15% Other
XS1065371277 WELLCOME TRST FI Financial Services AAA 09/05/2059 0.12% New Issue
Source: Markit iBoxx Data
£

Markit iBoxx fixed income monthly market monitor \ June 2014
June 2014 23
Markit iBoxx $ Corporates rebalancing activity – May 14
Table 13: iBoxx $ Corporates - Out
ISIN Issuer Sector Rating Maturity Weight Reason
USN4578BLH51 ING BANK NV Financials BBB 01/05/2015 0.02% <1Y
US46625HAX89 JPMORGAN CHASE Financials A 01/05/2015 0.02% <500M
US172967BW09 CITIGROUP INC Financials BBB 07/05/2015 0.02% <1Y
US172967CY55 CITIGROUP INC Financials A 29/05/2015 0.02% <1Y
USY3815NAB74 HYUNDAI CAPITAL Financials BBB 05/05/2015 0.01% <1Y
US64952XAP69 NEW YORK LIFE GL Financials AAA 04/05/2015 0.02% <1Y
US172967FD81 CITIGROUP INC Financials A 19/05/2015 0.04% <1Y
US59156RAY45 METLIFE INC Financials 0 06/02/2041 0.02% Reclassified
US345397VH30 FORD MOTOR CRED Financials BBB 15/05/2015 0.03% <1Y
US38141GGT58 GOLDMAN SACHS GP Financials A 03/05/2015 0.06% <1Y
US345397WC34 FORD MOTOR CRED Financials BBB 15/05/2015 0.03% <1Y
US98105HAC43 WOORI BANK Financials BB 30/04/2024 0.02% Downgraded
US637432CT02 NATL RURAL UTIL Non-Financials 0 01/03/2032 0.02% Reclassified
USU29481AK14 ERAC USA FINANCE Non-Financials BBB 01/05/2015 0.01% <1Y
US913017BH13 UNITED TECH CORP Non-Financials A 01/05/2015 0.03% <1Y
USG3400TAA72 SADIA OVERSEAS Non-Financials 0 28/01/2020 0.02% Reclassified
USG9400PAA24 VOTO-VOTORANTIM Non-Financials BBB 05/04/2021 0.02% Reclassified
US126650BT69 CVS CAREMARK Non-Financials BBB 18/05/2015 0.01% <1Y
US726505AK63 PLAINS EXPLORATI Non-Financials 0 01/05/2016 0.02% Reclassified
US63946BAB62 NBCUNIVERSAL MED Non-Financials A 30/04/2015 0.02% <500M
US377373AB16 GLAXOSMITHKLINE Non-Financials A 08/05/2015 0.02% <1Y
US459200HD61 IBM CORP Non-Financials AA 11/05/2015 0.02% <1Y
USU71000AA85 PENSKE TRUCK LE Non-Financials BBB 11/05/2015 0.02% <1Y
US14912L5D99 CATERPILLAR FINL Non-Financials A 29/05/2015 0.01% <1Y
US22303QAM24 COVIDIEN INTL FI Non-Financials A 29/05/2015 0.01% <1Y
US58013MEP59 MCDONALD'S CORP Non-Financials A 29/05/2015 0.01% <1Y
USC75088AC53 PTTEP CANADA INT Non-Financials BBB 12/06/2042 0.01% Reclassified
USU59354AN79 MIDAM-EXCH04/14 Non-Financials 0 15/05/2043 0.02% Reclassified
USU59354AM96 MIDAM-EXCH04/14 Non-Financials 0 15/08/2023 0.01% Reclassified
USG9393UAA00 VOTORANTIM OVER Non-Financials BBB 25/09/2019 0.02% Reclassified
Source: Markit iBoxx Data
Table 14: iBoxx $ Corporates - In
ISIN Issuer Sector Rating Maturity Weight Reason
USU45974AS81 INTL LEASE FIN Financials BBB 01/09/2018 0.04% Other
USU45974AR09 INTL LEASE FIN Financials BBB 01/09/2016 0.03% Other
XS1039273740 CHINA RES LAND Financials BBB 27/02/2019 0.02% Other
US867914BG73 SUNTRUST BANKS Financials BBB 01/04/2019 0.02% New Issue
US89114QAQ10 TORONTO DOM BANK Financials AA 02/05/2017 0.03% New Issue
$

Markit iBoxx fixed income monthly market monitor \ June 2014
June 2014 24
US172967HS33 CITIGROUP INC Financials BBB 06/05/2044 0.02% New Issue
XS1063561143 CHINA OVERSEAS F Financials BBB 08/05/2019 0.01% New Issue
XS1064799841 MAF GLOBAL SEC Financials BBB 07/05/2024 0.01% New Issue
US90520EAF88 UNION BANK NA Financials A 06/04/2019 0.01% New Issue
US06406HCV96 BANK OF NY MELLO Financials A 15/04/2024 0.01% New Issue
US06406HCU14 BANK OF NY MELLO Financials A 15/04/2019 0.02% New Issue
US46625HJX98 JPMORGAN CHASE Financials A 13/05/2024 0.05% New Issue
US12803X2D25 CAIXA ECONOMICA Financials BBB 13/05/2019 0.03% New Issue
USG2117CAC67 CHINA CINDA FIN Financials A 14/05/2024 0.01% New Issue
USG2117CAB84 CHINA CINDA FIN Financials A 14/05/2019 0.02% New Issue
US74432QBZ72 PRUDENTIAL FIN Financials A 15/05/2024 0.02% New Issue
US74432QCA13 PRUDENTIAL FIN Financials A 15/05/2044 0.01% New Issue
US06739FHV67 BARCLAYS BK PLC Financials A 15/05/2024 0.05% New Issue
US74153XAP24 PRICOA GLOB FUND Financials A 16/05/2019 0.01% New Issue
XS1041751980 IND & COMM BK/SG Financials A 21/11/2017 0.01% New Issue
US961214CH46 WESTPAC BANKING Financials AA 19/05/2017 0.03% New Issue
XS1067688033 GUOTAI JUNAN FIN Financials A 22/05/2019 0.01% New Issue
US631103AF50 NASDAQ OMX GROUP Financials BBB 01/06/2024 0.01% New Issue
US00185AAG94 AON PLC Financials BBB 14/06/2044 0.01% New Issue
US00440EAR80 ACE INA HOLDINGS Financials A 15/05/2024 0.02% New Issue
USU49486AA84 KKR GROUP FINAN Financials A 01/12/2043 0.01% New Issue
US22546QAL14 CRED SUIS NY Financials A 26/05/2017 0.04% New Issue
US22546QAN79 CRED SUIS NY Financials A 28/05/2019 0.05% New Issue
US24668PAE79 DELHAIZE GROUP Non-Financials BBB 01/10/2040 0.02% Other
XS0938722666 GLENCORE FDG LLC Non-Financials BBB 30/05/2023 0.03% Other
US59562VBD82 MIDAMERICAN ENER Non-Financials BBB 15/05/2043 0.02% New Issue
US59562VAY39 MIDAMERICAN ENER Non-Financials BBB 15/08/2023 0.01% New Issue
XS1061043367 OFFICE CHERIFIEN Non-Financials BBB 25/04/2044 0.01% New Issue
US863667AF81 STRYKER CORP Non-Financials A 15/05/2024 0.01% New Issue
USG8449WAB03 STATE GRID OSEAS Non-Financials AA 07/05/2019 0.03% New Issue
USG8449WAC85 STATE GRID OSEAS Non-Financials AA 07/05/2024 0.04% New Issue
USG8449WAD68 STATE GRID OSEAS Non-Financials AA 07/05/2044 0.02% New Issue
US037833AM25 APPLE INC Non-Financials AA 05/05/2017 0.04% New Issue
US037833AQ39 APPLE INC Non-Financials AA 06/05/2019 0.05% New Issue
US037833AR12 APPLE INC Non-Financials AA 06/05/2021 0.07% New Issue
US037833AS94 APPLE INC Non-Financials AA 06/05/2024 0.06% New Issue
US037833AT77 APPLE INC Non-Financials AA 06/05/2044 0.02% New Issue
US28370TAG40 EL PASO PIPELINE Non-Financials BBB 01/02/2024 0.01% New Issue
XS1017435352 TAQA ABU DHABI Non-Financials A 06/05/2024 0.02% Upgraded
USP7358RAC09 OLEODUCTO CENTRA Non-Financials BBB 07/05/2021 0.01% Upgraded
US577081AZ57 MATTEL INC Non-Financials BBB 06/05/2019 0.01% New Issue
USP39198AA76 FERMACA ENTERPR Non-Financials BBB 30/09/2028 0.01% New Issue
US149123CC35 CATERPILLAR INC Non-Financials A 15/02/2024 0.02% New Issue
US149123CD18 CATERPILLAR INC Non-Financials A 15/11/2043 0.01% New Issue

Markit iBoxx fixed income monthly market monitor \ June 2014
June 2014 25
US149123CE90 CATERPILLAR INC Non-Financials A 15/11/2063 0.01% New Issue
US277432AP52 EASTMAN CHEMICAL Non-Financials BBB 15/10/2044 0.01% New Issue
US151020AN42 CELGENE CORP Non-Financials BBB 15/05/2019 0.01% New Issue
US151020AP99 CELGENE CORP Non-Financials BBB 15/02/2024 0.02% New Issue
US151020AM68 CELGENE CORP Non-Financials BBB 15/11/2043 0.02% New Issue
US582839AG14 MEAD JOHNSON NUT Non-Financials BBB 01/12/2043 0.01% New Issue
XS1066895399 NESTLE HOLDINGS Non-Financials AA 14/01/2020 0.02% New Issue
USG22004AG38 CNPC GENERAL CAP Non-Financials A 14/05/2019 0.02% New Issue
US40049JBA43 GRUPO TELEVISA Non-Financials BBB 13/05/2045 0.02% New Issue
US341081FK84 FLORIDA POWER & Non-Financials AA 01/12/2023 0.01% New Issue
US36962G7J74 GEN ELEC CAP CRP Non-Financials AA 13/04/2017 0.02% New Issue
US36962G7K48 GEN ELEC CAP CRP Non-Financials AA 13/02/2024 0.02% New Issue
US717081DJ98 PFIZER INC Non-Financials AA 15/05/2017 0.02% New Issue
US717081DL45 PFIZER INC Non-Financials AA 15/05/2019 0.04% New Issue
US717081DM28 PFIZER INC Non-Financials AA 15/05/2024 0.02% New Issue
US717081DK61 PFIZER INC Non-Financials AA 15/05/2044 0.01% New Issue
USU21180AE13 CONTINENTAL RESO Non-Financials BBB 01/12/2043 0.02% New Issue
USU21180AD30 CONTINENTAL RESO Non-Financials BBB 01/03/2024 0.02% New Issue
USY7136YAA83 PERUSAHAAN GAS Non-Financials BBB 16/05/2024 0.03% New Issue
USN1384FAB15 BHARTI AIRTEL IN Non-Financials BBB 20/05/2024 0.02% New Issue
XS1069612122 BP CAPITAL PLC Non-Financials A 16/01/2020 0.01% New Issue
US502413BD83 L-3 COMMS CORP Non-Financials BBB 28/02/2024 0.02% New Issue
US89236TBH77 TOYOTA MTR CRED Non-Financials A 16/05/2017 0.02% New Issue
US89236TBJ34 TOYOTA MTR CRED Non-Financials A 17/05/2021 0.02% New Issue
XS1070074312 VOLKSWAGEN GRP Non-Financials A 23/05/2017 0.03% New Issue
XS1070074668 VOLKSWAGEN GRP Non-Financials A 23/05/2019 0.02% Upgraded
USP1905CAE05 BRF SA Non-Financials BBB 22/05/2024 0.02% New Issue
US03073EAK10 AMERISOURCEBERGE Non-Financials BBB 15/05/2017 0.01% New Issue
US03073EAL92 AMERISOURCEBERGE Non-Financials BBB 15/02/2024 0.01% New Issue
US031162BR07 AMGEN INC Non-Financials BBB 22/05/2017 0.02% New Issue
US031162BU36 AMGEN INC Non-Financials BBB 22/04/2019 0.03% New Issue
US031162BV19 AMGEN INC Non-Financials A 22/02/2024 0.03% New Issue
USU29490AL04 ERAC USA FINANCE Non-Financials BBB 15/08/2024 0.01% New Issue
USU2916GAA86 ENABLE MIDSTRM Non-Financials BBB 15/04/2019 0.01% New Issue
USU2916GAC43 ENABLE MIDSTRM Non-Financials BBB 15/11/2043 0.01% New Issue
USU2916GAB69 ENABLE MIDSTRM Non-Financials BBB 15/02/2024 0.01% New Issue
US55616XAL10 MACYS RETAIL HLD Non-Financials BBB 01/06/2024 0.01% New Issue
US887317AT21 TIME WARNER INC Non-Financials BBB 01/06/2019 0.02% New Issue
US887317AV76 TIME WARNER INC Non-Financials BBB 01/03/2024 0.02% New Issue
US887317AU93 TIME WARNER INC Non-Financials BBB 01/06/2044 0.01% New Issue
US279158AJ82 ECOPETROL SA Non-Financials BBB 28/05/2045 0.05% New Issue
USG79456AF99 SEAGATE HDD CAYM Non-Financials BBB 01/01/2025 0.02% New Issue
Source: Markit iBoxx Data

Markit iBoxx fixed income monthly market monitor \ June 2014
June 2014 26
Fixed income market
Analysis and trends

Markit iBoxx fixed income monthly market monitor \ June 2014
June 2014
27
€ Fixed income return attribution
Table 15: Return attribution (bps) Total Return = Income Return + Price Return + Residual Return Price Return = Duration Return + Credit Return + Calendar Return + Option Return + Redemption Return Duration Return = 1-5Y + 6-10Y + 15+Y Credit Return = Sector Return + Issuer Return
Index Weight Total Return
Income Return
Price Return
Curve Spread Calendar Return
Option Return
Redemp tion
Residual Return Duration
Return 1-5Y 6-10Y 15+Y
Credit Return
Sector Return
Issuer Return
€ Overall 100.00% 94.87 18.06 77.34 77.48 21.24 40.10 16.14 -0.47 -3.59 3.12 0.33 0.00 0.00 -0.53
€ Sovereigns 59.73% 97.80 15.99 82.19 84.63 19.93 41.25 23.45 -5.24 -7.69 2.45 2.80 0.00 0.00 -0.37
€ Sub-Sovereigns 13.38% 97.41 13.02 84.64 73.56 23.30 41.67 8.59 8.62 3.82 4.80 2.46 0.00 0.00 -0.24
€ Collateralized 10.21% 76.77 19.69 58.08 60.09 23.40 34.31 2.38 2.04 1.04 1.00 -4.05 0.00 0.00 -1.00
€ Corporates 16.69% 93.42 28.42 66.02 65.88 22.91 38.26 4.71 7.61 2.20 5.41 -7.48 0.01 0.00 -1.02
€ Financials 7.39% 82.51 27.35 55.96 58.06 23.68 31.01 3.38 4.71 -4.24 8.95 -6.81 0.00 0.00 -0.80
€ Non-Financials 9.30% 102.06 29.27 73.99 72.07 22.30 44.00 5.77 9.91 7.30 2.61 -8.00 0.01 0.00 -1.20
€ Corporates AAA 0.08% 134.07 20.72 114.13 109.82 12.89 55.33 41.61 0.36 0.36 0.00 3.82 0.12 0.00 -0.77
€ Corporates AA 2.19% 98.90 53.29 46.41 65.19 22.16 38.91 4.12 17.38 16.52 0.86 -36.16 0.00 0.00 -0.80
€ Corporates A 7.58% 91.75 27.34 65.60 68.06 22.08 40.74 5.24 5.13 2.73 2.41 -7.61 0.01 0.00 -1.18
€ Corporates BBB 6.84% 93.04 21.67 72.29 63.10 24.20 35.03 3.87 7.34 -3.02 10.36 1.84 0.01 0.00 -0.92
Source: Markit iBoxx Data
€

Markit iBoxx fixed income monthly market monitor \ June 2014
June 2014 28
£ Fixed income return attribution
Table 16: Return attribution (bps) Total Return = Income Return + Price Return + Residual Return Price Return = Duration Return + Credit Return + Calendar Return + Option Return+ Redemption Return Duration Return = 1-5Y + 6-10Y + 15+Y Credit Return = Sector Return + Issuer Return
Index Weight Total Return
Income Return
Price Return
Curve Spread Calendar Return
Option Return
Redemp tion
Residual Return Duration
Return 1-5Y 6-10Y 15+Y
Credit Return
Sector Return
Issuer Return
£ Overall 100.00% 105.60 9.51 97.58 67.49 3.59 24.84 39.05 9.86 9.78 0.08 20.20 0.07 -0.04 -1.48
£ Gilts 67.17% 94.84 0.00 96.35 71.02 3.89 24.27 42.86 -1.17 -1.04 -0.13 26.50 0.00 0.00 -1.50
£ Sub-Sovereigns 6.78% 90.60 4.47 87.29 48.71 1.86 17.45 29.39 16.40 14.19 2.21 22.17 0.00 0.00 -1.16
£ Collateralized 4.59% 140.95 10.56 131.18 73.41 2.43 34.40 36.58 30.53 35.58 -5.06 28.17 0.00 -0.93 -0.79
£ Corporates 21.21% 136.42 41.20 96.88 60.81 3.47 26.94 30.41 38.14 37.31 0.84 -2.42 0.34 0.00 -1.66
£ Financials 8.78% 104.91 73.62 34.55 49.55 3.22 25.55 20.77 18.59 18.00 0.59 -33.59 0.00 0.00 -3.26
£ Non-Financials 12.43% 158.70 18.27 140.96 68.78 3.64 27.92 37.22 51.97 50.96 1.01 19.63 0.58 0.00 -0.53
£ Corporates AAA 0.12% 172.05 68.82 103.45 96.77 1.56 41.54 53.66 42.23 42.52 -0.29 -35.55 0.00 0.00 -0.22
£ Corporates AA 2.33% 114.40 42.97 71.39 64.43 3.01 25.06 36.37 17.38 16.18 1.20 -10.42 0.00 0.00 0.03
£ Corporates A 9.45% 142.29 29.78 114.47 67.75 3.58 26.06 38.12 38.22 36.69 1.52 7.74 0.76 0.00 -1.96
£ Corporates BBB 9.31% 135.51 51.97 85.35 52.44 3.50 28.12 20.82 43.19 43.12 0.07 -10.28 0.00 0.00 -1.80
Source: Markit iBoxx Data
£

Markit iBoxx fixed income monthly market monitor \ June 2014
June 2014 29
$ Fixed income return attribution
Table 17: Return attribution (bps) Total Return = Income Return + Price Return + Residual Return Price Return = Duration Return + Credit Return + Calendar Return + Option Return+ Redemption Return Duration Return = 1-5Y + 6-10Y + 15+Y Credit Return = Sector Return + Issuer Return
Index Weight Total Return
Income Return
Price Return
Curve Spread Calendar Return
Option Return
Redemp tion
Residual Return Duration
Return 1-5Y 6-10Y 15+Y
Credit Return
Sector Return
Issuer Return
$ Overall 100.00% 123.33 37.80 87.47 92.59 19.73 38.81 34.05 6.76 -12.52 19.27 -11.24 0.37 -0.99 -1.94
$ Treasuries 58.41% 109.92 41.74 68.13 90.11 20.18 36.24 33.69 -2.27 -22.87 20.60 -19.70 0.00 0.00 0.06
$ Sub-Sovereigns 9.31% 82.45 31.32 52.22 51.34 21.06 20.47 9.81 10.52 5.37 5.14 0.34 0.69 -10.67 -1.08
$ Covered 0.78% 72.12 15.46 54.37 27.18 21.52 3.70 1.97 23.43 14.72 8.71 3.75 0.00 0.00 2.29
$ Corporates 28.59% 150.73 33.96 123.49 109.11 18.65 48.59 41.88 14.40 0.99 13.41 -0.71 0.77 -0.08 -6.73
$ Financials 10.74% 127.09 32.07 99.82 81.37 20.32 39.39 21.66 18.11 10.20 7.90 -0.39 0.74 0.00 -4.81
$ Non-Financials 17.85% 164.98 35.11 137.76 125.84 17.64 54.13 54.07 12.17 -4.56 16.74 -0.91 0.79 -0.13 -7.89
$ Corporates AAA 0.29% 152.18 37.17 126.79 137.95 20.82 45.18 71.95 -2.88 -28.37 25.49 -8.27 -0.02 0.00 -11.78
$ Corporates AA 3.72% 121.14 24.27 98.40 103.07 19.25 42.36 41.46 -8.05 -18.81 10.76 3.18 0.20 0.00 -1.53
$ Corporates A 12.42% 126.53 29.61 104.26 102.30 19.93 43.83 38.54 1.28 -12.23 13.51 0.66 0.03 0.00 -7.34
$ Corporates BBB 12.16% 184.92 41.41 151.11 117.34 17.08 55.53 44.73 35.40 21.55 13.85 -3.16 1.73 -0.20 -7.60
Source: Markit iBoxx Data
$

Markit iBoxx fixed income monthly market monitor \ June 2014
June 2014
30
Figure 27: Return attribution for current month (bps) – € Non-Financials and Financials
29
72
10
-8
0 0
102
27
58
5
-7
0 0
83
-20
0
20
40
60
80
100
120
Income Return Duration Return Credit Return Calendar Return Option Return Redemp tion Total Return
€ Non-Financials € Financials
Figure 28: Return attribution by months (bps) - € Corporates
15
5036
4228 28
-120
148
-1
1124
6653
-35
37
9
48
8
-150.00
-100.00
-50.00
0.00
50.00
100.00
150.00
200.00
Dec-13 Jan-14 Feb-14 Mar-14 Apr-14 May-14
Income Return Duration Return Credit Return
Source: Markit iBoxx Data
€

Markit iBoxx fixed income monthly market monitor \ June 2014
June 2014 31
Figure 29: Return attribution for current month (bps) – £ Non-Financials and Financials
18
69
52
20
1 0
159
74
50
19
-34
0 0
105
-50
0
50
100
150
200
Income Return Duration Return Credit Return Calendar Return Option Return Redemption Total Return
£ Non-Financials £ Financials
Figure 30: Return attribution by months (bps) - £ Corporates monthly
39 3525
5144 41
-115
178
-9-18
35
61
-28 -23
27
-35
56
38
-150.00
-100.00
-50.00
0.00
50.00
100.00
150.00
200.00
Dec-13 Jan-14 Feb-14 Mar-14 Apr-14 May-14
Income Return Duration Return Credit Return
Source: Markit iBoxx Data
£

Markit iBoxx fixed income monthly market monitor \ June 2014
June 2014 32
Figure 31: Return attribution for current month (bps) – $ Non-Financials and Financials
35
126
12
-1
1
0
165
32
81
18
0
1 0
127
-20
0
20
40
60
80
100
120
140
160
180
Income Return Duration Return
Credit Return Calendar Return
Option Return Redemption Return
Total Return
$ Non-Financials $ Financials
Figure 32: Return attribution by months (bps) - $ Corporates monthly
31 38 33
5740 34
-148
182
12
-39
44
109101
-60
67
2512 14
-200.00
-150.00
-100.00
-50.00
0.00
50.00
100.00
150.00
200.00
Dec-13 Jan-14 Feb-14 Mar-14 Apr-14 May-14
Income Return Duration Return Credit Return
Source: Markit iBoxx Data
$

Markit iBoxx fixed income monthly market monitor \ June 2014
June 2014 33
Key rate duration and attribution – € Corporates
Figure 33: Key rate duration at beginning of May-14
1Y 2Y 3Y 4Y 5Y 6Y 7Y 8Y 9Y 10Y 15Y 20Y 25Y 30Y
KRD 0.09 0.29 0.46 0.48 0.48 0.56 0.58 0.42 0.37 0.45 0.24 0.09 0.04 0.06
0.00
0.10
0.20
0.30
0.40
0.50
0.60
0.70
Bp
s
Figure 34: Yield curve shifts for May-14 at key rates
1Y 2Y 3Y 4Y 5Y 6Y 7Y 8Y 9Y 10Y 15Y 20Y 25Y 30Y
RF Delta -6.99 -9.61 -11.95 -13.90 -15.32 -16.13 -16.40 -16.29 -15.91 -15.40 -12.86 -10.51 -8.35 -6.42
-18
-16
-14
-12
-10
-8
-6
-4
-2
0
Bp
s
Figure 35: Return attribution for May-14 by key rates
1Y 2Y 3Y 4Y 5Y 6Y 7Y 8Y 9Y 10Y 15Y 20Y 25Y 30Y
Return 0.61 2.78 5.46 6.71 7.35 9.06 9.46 6.88 5.89 6.96 3.04 0.95 0.37 0.36
0
1
2
3
4
5
6
7
8
9
10
Bp
s
Source: Markit iBoxx Data
€

Markit iBoxx fixed income monthly market monitor \ June 2014
June 2014 34
Key rate duration and attribution – £ Corporates
Figure 36: Key rate duration at beginning of May-14
1Y 2Y 3Y 4Y 5Y 6Y 7Y 8Y 9Y 10Y 15Y 20Y 25Y 30Y
KRD 0.08 0.18 0.27 0.32 0.39 0.36 0.39 0.41 0.41 1.02 1.40 0.95 0.79 0.55
0.00
0.20
0.40
0.60
0.80
1.00
1.20
1.40
1.60
Bp
s
Figure 37: Yield curve shifts for May-14 at key rates
1Y 2Y 3Y 4Y 5Y 6Y 7Y 8Y 9Y 10Y 15Y 20Y 25Y 30Y
RF Delta 8.20 3.41 -0.95 -4.67 -7.53 -9.40 -10.41 -10.79 -10.74 -10.50 -9.25 -8.26 -7.48 -6.85
-15
-10
-5
0
5
10
Bp
s
Figure 38: Return attribution for May-14 by key rates
1Y 2Y 3Y 4Y 5Y 6Y 7Y 8Y 9Y 10Y 15Y 20Y 25Y 30Y
Return -0.62 -0.62 0.26 1.49 2.96 3.37 4.02 4.46 4.44 10.66 12.95 7.83 5.87 3.75
-2
0
2
4
6
8
10
12
14
Bp
s
Source: Markit iBoxx Data
£

Markit iBoxx fixed income monthly market monitor \ June 2014
June 2014 35
Key rate duration and attribution – $ Corporates
Figure 39: Key rate duration at beginning of May-14
1Y 2Y 3Y 4Y 5Y 6Y 7Y 8Y 9Y 10Y 15Y 20Y 25Y 30Y
KRD 0.09 0.25 0.38 0.50 0.45 0.38 0.44 0.49 0.50 0.46 0.49 0.58 0.74 0.47
0.00
0.10
0.20
0.30
0.40
0.50
0.60
0.70
0.80
Bp
s
Figure 40: Yield curve shifts for May-14 at key rates
1Y 2Y 3Y 4Y 5Y 6Y 7Y 8Y 9Y 10Y 15Y 20Y 25Y 30Y
RF Delta 1.68 -3.91 -9.05 -13.50 -17.04 -19.50 -21.03 -21.86 -22.19 -22.25 -21.58 -19.86 -17.45 -14.69
-25
-20
-15
-10
-5
0
5
Bp
s
Figure 41: Return attribution for May-14 by key rates
1Y 2Y 3Y 4Y 5Y 6Y 7Y 8Y 9Y 10Y 15Y 20Y 25Y 30Y
Return -0.16 0.98 3.44 6.69 7.69 7.44 9.33 10.65 11.01 10.16 10.58 11.60 12.86 6.84
-2
0
2
4
6
8
10
12
14
Bp
s
Source: Markit iBoxx Data
$

Markit iBoxx fixed income monthly market monitor \ June 2014
June 2014
36
€ Fixed income stress test
Table 18: Stress test The table shows how much each index will move in the following scenarios (in bps)
Yield curve shift: Shift up – All key rates 1-30yr (+ 100 bps) Steepener - key rates 1-5 yr (+ 50 bps), key rates 10,15,20,25,30 yr (- 50 bps) Butterfly - key rates 1-5 yr (+ 50 bps), key rates 6-9 yr (- 50 bps), key rates 10,15,20,25,30 yr (+ 50 bps)
Highest historical shift – biggest monthly historical shift of the yield curve for the past 12 months
Spreads shift: Shift up: BBB bonds (+ 100 bps), A bonds (+ 85 bps), AA bonds (+ 52 bps), AAA bonds (- 42 bps) – based on 1 year rolling correlation between spreads
Overall Sovereigns Sub-
Sovereigns Collateralized Corporates Financials
Non-Financials
Corporates AAA
Corporates AA
Corporates A
Corporates BBB
Yield Curve
Shift up
-570.2 -639.8 -516.0 -413.2 -460.9 -414.8 -497.4 -772.1 -460.4 -476.1 -439.9
Steepener
-31.1 -77.9 16.7 61.9 40.8 55.3 29.3 -141.0 51.8 29.9 52.1
Butterfly
-98.8 -136.9 -58.8 -29.6 -37.6 -45.1 -31.6 -96.9 -23.6 -36.3 -42.6
Highest historical shift
-208.2 -235.5 -188.7 -143.1 -165.8 -144.2 -182.9 -304.8 -163.1 -173.4 -156.2
Spreads
Shift up
-75.4 -72.7 121.3 107.7 -353.6 -292.5 -402.1 674.7 -70.7 -365.7 -439.9
Source: Markit iBoxx Data
€

Markit iBoxx fixed income monthly market monitor \ June 2014
June 2014 37
£ Fixed income stress test
Table 19: Stress test The table shows how much each index will move in the following scenarios (in bps)
Yield curve shift: Shift up – All key rates 1-30yr (+ 100 bps) Steepener - key rates 1-5 yr (+ 50 bps), key rates 10,15,20,25,30 yr (- 50 bps) Butterfly - key rates 1-5 yr (+ 50 bps), key rates 6-9 yr (- 50 bps), key rates 10,15,20,25,30 yr (+ 50 bps)
Highest historical shift – biggest historical shift of the yield curve for the past 12 months
Spreads shift: Shift up: BBB bonds (+ 100 bps), A bonds (+ 97 bps), AA bonds (+ 99 bps), AAA bonds (+ 95 bps) – based on 1 year rolling correlation between spreads
Overall Gilts Sub-
Sovereigns Collateralized Corporates Financials
Non-Financials
Corporates AAA
Corporates AA
Corporates A
Corporates BBB
Yield Curve
Shift up -861.4 -915.4 -671.8 -852.5 -750.9 -626.9 -838.6 -1142.7 -808.2 -836.4 -645.2
Steepener -222.3 -244.7 -130.4 -249.8 -172.8 -99.5 -224.6 -430.1 -198.6 -227.6 -107.8
Butterfly -275.4 -298.8 -231.9 -251.2 -218.4 -147.2 -268.7 -402.6 -243.2 -279.3 -148.2
Highest historical shift -443.5 -455.4 -368.7 -487.4 -419.0 -361.3 -459.7 -576.1 -437.2 -451.3 -379.8
Spreads
Shift up -835.3 -898.1 -622.1 -802.7 -709.2 -593.1 -791.4 -1025.9 -792.9 -748.0 -645.2
Source: Markit iBoxx Data
£
Markit iBoxx fixed income monthly market monitor \ June 2014
June 2014 38
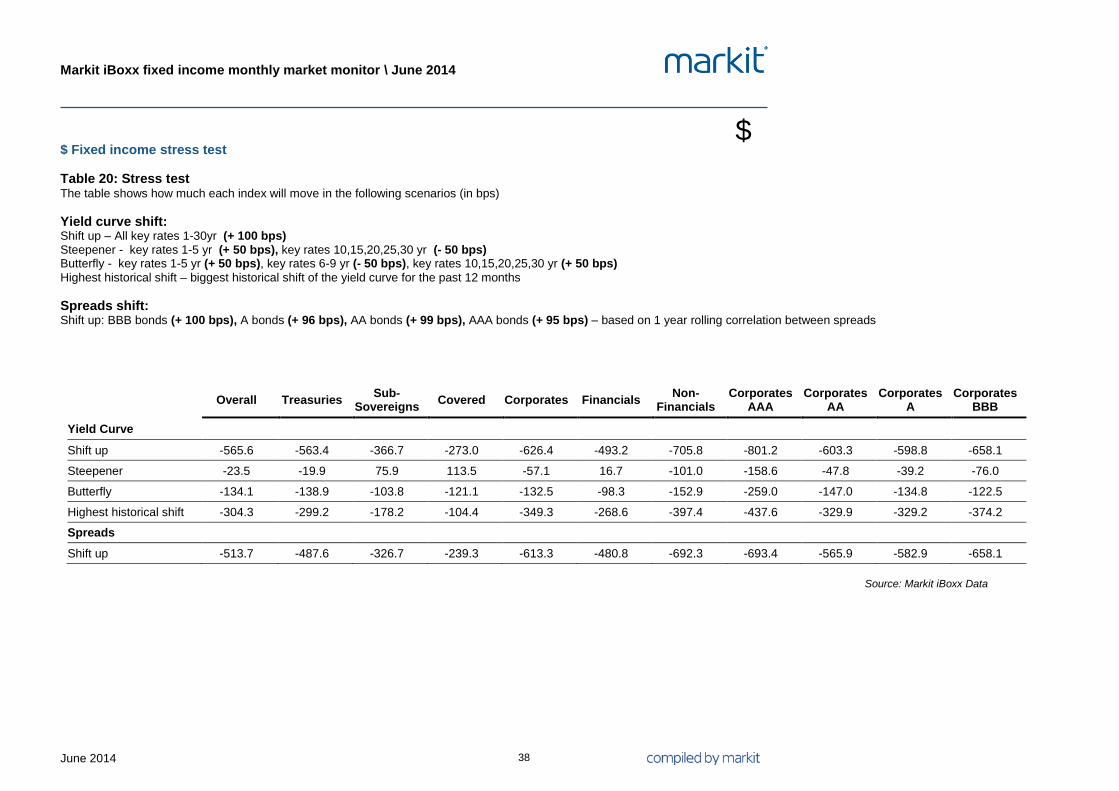
$ Fixed income stress test
Table 20: Stress test The table shows how much each index will move in the following scenarios (in bps)
Yield curve shift: Shift up – All key rates 1-30yr (+ 100 bps) Steepener - key rates 1-5 yr (+ 50 bps), key rates 10,15,20,25,30 yr (- 50 bps) Butterfly - key rates 1-5 yr (+ 50 bps), key rates 6-9 yr (- 50 bps), key rates 10,15,20,25,30 yr (+ 50 bps)
Highest historical shift – biggest historical shift of the yield curve for the past 12 months
Spreads shift: Shift up: BBB bonds (+ 100 bps), A bonds (+ 96 bps), AA bonds (+ 99 bps), AAA bonds (+ 95 bps) – based on 1 year rolling correlation between spreads
Overall Treasuries Sub-
Sovereigns Covered Corporates Financials
Non-Financials
Corporates AAA
Corporates AA
Corporates A
Corporates BBB
Yield Curve
Shift up -565.6 -563.4 -366.7 -273.0 -626.4 -493.2 -705.8 -801.2 -603.3 -598.8 -658.1
Steepener -23.5 -19.9 75.9 113.5 -57.1 16.7 -101.0 -158.6 -47.8 -39.2 -76.0
Butterfly -134.1 -138.9 -103.8 -121.1 -132.5 -98.3 -152.9 -259.0 -147.0 -134.8 -122.5
Highest historical shift -304.3 -299.2 -178.2 -104.4 -349.3 -268.6 -397.4 -437.6 -329.9 -329.2 -374.2
Spreads
Shift up -513.7 -487.6 -326.7 -239.3 -613.3 -480.8 -692.3 -693.4 -565.9 -582.9 -658.1
Source: Markit iBoxx Data
$

Markit iBoxx fixed income monthly market monitor \ June 2014
June 2014
39
Relative value opportunities in € Financials
Figure 42: € Financial AA sector curve
0
0.5
1
1.5
2
2.5
3
3.5
4
0 5 10 15 20 25 30
Yie
ld
Maturity
Yield Curve
Table 21: Top/Bottom 5 bonds according to distance to curve
Bottom 5
ISIN Name TTM OAS
XS0986102605 IND BK OF KOREA 4.41 109
XS0491922828 BNZ INTL FUNDING 2.76 79
XS0300966495 MET LIFE GLOB 2.95 74
XS0873665706 MET LIFE GLOB 8.61 88
XS0273570241 GE CAP EUR FUND 7.42 91
Top 5
ISIN Name TTM OAS
DE000A1R1BC6 DEUTSCHE BOERSE 3.81 45
DE000A1HG1K6 ALLIANZ FINANCE 13.78 59
XS0350890470 GE CAP EUR FUND 23.75 116
DE000A1HG1J8 ALLIANZ FINANCE 3.78 51
XS0590179692 NORDEA BANK AB 1.70 44
Figure 43: € Financial A sector curve
0
0.5
1
1.5
2
2.5
3
3.5
4
4.5
0 5 10 15 20 25 30
Yie
ld
Maturity
Yield Curve
Table 22: Top/Bottom 5 bonds according to distance to curve
Bottom 5
ISIN Name TTM OAS
XS0491211644 GE CAP TRUST II 3.29 314
XS0319639232 GEN ELEC CAP CRP 3.29 294
XS0253627136 SWISS RE 1.98 287
XS0491212451 GE CAP TRUST IV 2.29 266
XS0304987042 MUNICH RE 3.03 257
Top 5
ISIN Name TTM OAS
DE000DB5DCS4 DEUTSCHE BANK AG 8.61 62
XS0802756683 SOCIETE GENERALE 8.11 72
XS0522030310 DNB NOR BANK ASA 6.07 64
XS0732513972 DNB BANK 7.63 73
XS0794246925 SWEDBANK AB 1.04 42
Source: Markit iBoxx Data
€

Markit iBoxx fixed income monthly market monitor \ June 2014
June 2014 40
Figure 44: € Financial BBB sector curve
0
1
2
3
4
5
6
0 5 10 15
Yie
ld
Maturity
Yield Curve
Table 23: Top/Bottom 5 bonds according to distance
to curve Bottom 5
ISIN Name TTM OAS
DE000A0TU305 DB CAP TRST IV 3.95 403
XS0283629946 GENERALI FINANCE 2.69 349
XS0295383524 SWISS LIFE 2.86 342
XS1034950672 RAIFFEISEN BK IN 5.72 391
FR0010409789 CNP ASSURANCES 2.56 327
Top 5
ISIN Name TTM OAS
XS0531068897 BBVA SENIOR FIN 1.18 89
XS0829721967 BBVA SENIOR FIN 1.30 93
XS0541608286 LEASEPLAN CORP 1.29 98
XS0802960533 INTESA SANPAOLO 1.10 104
XS0713861127 SANTANDER INTL 1.50 95
Relative value opportunity trades in £ and $ fixed income markets currently unavailable
Figure 45: € Financial BB sector curve
0
10
20
30
40
50
60
0 5 10 15 20 25 30
Yie
ldMaturity
Yield Curve
Table 24: Top/Bottom 5 bonds according to distance to curve Bottom 5
ISIN Name TTM OAS
XS0418134663 SANTANDER FINANC 4.79 4900
XS0418134663 SANTANDER FINANC 4.79 4900
FR0010670422 CREDIT AGRICOLE 4.33 1262
XS0253262025 RZB FIN JERSEY 1.96 710
BE0930906947 ETHIAS 1.55 756
Top 5
ISIN Name TTM OAS
XS0875105909 BPE FINANCIACION 1.12 150
XS0221082125 RBS NV EX-ABN NV 1.03 171
XS0290422095 WENDEL INVEST 1.30 139
XS0877925361 CREDITO VALTELLI 1.14 202
PTCG32OM0004 CAIXA GERAL DEPO 1.32 178
Source: Markit iBoxx Data
€

Markit iBoxx fixed income monthly market monitor \ June 2014
June 2014
41
Fixed income market
ETF market activity

Markit iBoxx fixed income monthly market monitor \ June 2014
June 2014 42
ETF product launch activity Table 25: Europe fixed income ETF launches
Launch date ETF Name Ticker Provider Type
No launches
Table 26: US fixed income ETF launches
Launch date ETF Name Ticker Provider Type
01/05/2014 db X-trackers Solactive Investment Grade Subordinated Debt Fund
SUBD db x-trackers - US Corporate
01/05/2014 PowerShares Variable Rate Preferred Portfolio VRP PowerShares - US Preferred Stock
13/05/2014 First Trust Managed Municipal ETF FMB First Trust ETFs Municipal
29/05/2014 iShares Interest Rate Hedged High Yield Bond ETF HYGH iShares - US Corporate
29/05/2014 iShares Interest Rate Hedged Corporate Bond ETF LQDH iShares - US Corporate
Fixed income ETF cash flows Table 27: Fixed income ETF cash flows by sector All figures in $ million except otherwise stated
May-14
YTD
Type Europe* USA* Asia* Total
Europe* USA* Asia* Total
Broad Market (39) 894 6 862
943 4,087 18 5,048
Sovereigns 933 7,456 137 8,526
6,677 11,045 (354) 17,367
Sub-Sovereigns 28 348 6 382
28 1,016 18 1,063
Corporates IG 603 945 0 1,548
3,284 5,391 (101) 8,574
Covered 358 3 0 361
514 3 0 517
Convertible 0 54 0 54
0 602 0 602
High Yield (338) 1,259 0 921
922 2,485 28 3,435
Loans 0 (45) 0 (45)
0 984 0 984
Asset Backed 0 136 0 136
0 403 0 403
CDS (22) 0 0 (22)
(165) 0 0 (165)
Inflation 88 216 0 304
404 (192) 1 214
Money Market (160) 0 (18) (178)
(341) 0 514 173
Preferred Stock 0 390 0 390
0 1,129 1 1,130
Yield-Curve Strategy 0 0 0 0
0 0 0 0
Total 1,450 11,656 131 13,236
12,266 26,954 125 39,345
* Listing Region Source: Markit ETP Analytics

Markit iBoxx fixed income monthly market monitor \ June 2014
June 2014 43
Fixed income ETF issuers by AUM
Table 28: Top 10 Fixed income ETF issuers by AUM and regions All figures in $ million except otherwise stated
Europe
US
Issuer AUM Share
Issuer AUM Share
iShares - Europe 57,880 59.4%
iShares - US 143,642 49.2%
db x-trackers - Europe 12,313 12.6%
Vanguard - US 55,286 18.9%
Lyxor 8,143 8.4%
SPDR ETFs - US 32,730 11.2%
Source ETF 5,174 5.3%
PowerShares - US 15,965 5.5%
Amundi ETF 3,779 3.9%
PIMCO ETFs 14,975 5.1%
Deka ETFs 3,607 3.7%
ProShares ETFs 8,453 2.9%
SPDR ETFs - Europe 3,180 3.3%
Guggenheim Funds 6,388 2.2%
ComStage ETFs 1,350 1.4%
Market Vectors 3,889 1.3%
Think Capital 1,077 1.1%
FlexShares 2,445 0.8%
UBS ETF - Europe 484 0.5%
Charles Schwab 1,885 0.6%
Others 439 0.5%
Others 6,406 2.2%
Total 97,427 100.0%
Total 292,064 100.0%
Asia
Total
Issuer AUM Share
Issuer AUM Share
SSgA Asia ETFs 3,033 22.1%
BlackRock 201,782 50.0%
Fortune SG China ETFs 2,881 21.0%
Vanguard 55,311 13.7%
Yinhua China ETFs 1,763 12.9%
State Street 38,958 9.7%
Kodex Korea ETFs 1,185 8.6%
PowerShares 16,300 4.0%
Tiger Korea 591 4.3%
PIMCO 14,975 3.7%
KOSEF Korea ETFs 504 3.7%
Deutsche Bank 12,413 3.1%
BetaShares Australia ETFs 438 3.2%
ProShares 8,453 2.1%
KStar Korea ETFs 417 3.0%
Société Générale 8,143 2.0%
HSBC - Hong Kong 383 2.8%
Guggenheim Investments 6,388 1.6%
CSOP Hong Kong ETFs 322 2.3%
Source 5,174 1.3%
Others 2,203 16.1%
Others 35,317 8.8%
Total 13,721 100.0%
Total 403,213 100.0%
Source: Markit ETP Analytics

Markit iBoxx fixed income monthly market monitor \ June 2014
June 2014 44
Fixed income ETFs by inflow and outflow
Table 29: Europe top 10 fixed income ETF by inflows during last month All figures in $ million except otherwise stated
ETF Name Ticker Issuer May-14 Flows
YTD Flows
iShares Emerging Markets Local Government Bond UCITS ETF IEML BlackRock 404 536
Lyxor UCITS ETF EuroMTS 5-7Y Investment Grade LMTC Société Générale
360 696
PIMCO Covered Bond Source UCITS ETF COVR Source 357 363
SPDR Barclays Emerging Markets Local Bond UCITS ETF SYBM State Street 226 411
iShares Euro Corporate Bond ex-Financials UCITS ETF IEXF BlackRock 223 165
iShares J.P. Morgan $ Emerging Markets Bond UCITS ETF IEMB BlackRock 188 1,217
ComStage ETF iBoxx EUR Sovereigns Germany Capped 10+ TR UCITS ETF 8523 ComStage 164 164
iShares Euro Government Bond UCITS ETF IEGA BlackRock 157 227
iShares UK Gilts UCITS ETF IGLT BlackRock 129 129
db x-trackers II Emerging Markets Liquid Eurobond UCITS ETF (EUR) DXSU Deutsche Bank 92 126
Table 30: US top 10 fixed income ETF by inflows in last month All figures in $ million except otherwise stated
ETF Name Ticker Issuer May-14 Flows
YTD Flows
iShares 7-10 Year Treasury Bond ETF IEF BlackRock 5,211 5,964
ProShares Ultra 7-10 Year Treasury UST ProShares 1,868 1,896
iShares iBoxx $ Investment Grade Corporate Bond ETF LQD BlackRock 463 1,289
iShares iBoxx $ High Yield Corporate Bond ETF HYG BlackRock 399 (1,714)
iShares U.S. Preferred Stock ETF PFF BlackRock 386 1,063
Vanguard Total Bond Market ETF BND Vanguard 328 1,751
ProShares UltraShort 20+ Year Treasury ETF TBT ProShares 292 743
iShares Core U.S. Aggregate Bond ETF AGG BlackRock 272 1,403
PIMCO 0-5 Year High Yield Corporate Bond Index Fund HYS PIMCO 241 1,461
Vanguard Total International Bond Index Fund BNDX Vanguard 226 501
Source: Markit ETP Analytics

Markit iBoxx fixed income monthly market monitor \ June 2014
June 2014 45
Table 31: Europe top 10 fixed income ETF by outflows during last month All figures in $ million except otherwise stated
ETF Name Ticker Issuer May-14 Flows
YTD Flows
iShares eb.rexx Government Germany 1.5-2.5yr UCITS ETF (DE) EXHB BlackRock (334) (518)
iShares $ High Yield Corporate Bond UCITS ETF SHYU BlackRock (307) (235)
db x-trackers II iBoxx EUR Sovereigns Euro Yield Plus UCITS ETF XY4P Deutsche Bank (223) 272
Lyxor UCITS ETF Euro Cash CSH Société Générale
(191) (234)
Lyxor UCITS ETF EuroMTS Global MTX Société Générale
(140) (71)
iShares Euro Aggregate Bond UCITS ETF IEAG BlackRock (85) 254
Amundi EX AAA Government Bond EuroMTS Investment Grade UCITS ETF X1G Amundi (83) 463
iShares Euro Government Bond 3-5yr UCITS ETF IBGX BlackRock (75) 142
db x-trackers II IBOXX SOVEREIGNS EUROZONE YIELD PLUS 1-3 UCITS ETF XY1D Deutsche Bank (66) (57)
db x-trackers II iBoxx Sovereigns Eurozone 5-7 UCITS ETF DBXR Deutsche Bank (62) 161
Table 32: US top 10 fixed income ETF by outflows during last month All figures in $ million except otherwise stated
ETF Name Ticker Issuer May-14 Flows
YTD Flows
iShares 20+ Year Treasury Bond ETF TLT BlackRock (224) 1,187
PIMCO Enhanced Short Maturity Strategy Fund MINT PIMCO (163) (21)
iShares 1-3 Year Credit Bond ETF CSJ BlackRock (137) 1,064
iShares Floating Rate Bond ETF FLOT BlackRock (132) (86)
SPDR Barclays 1-3 Month T-Bill ETF BIL State Street (96) (92)
iShares Short Treasury Bond ETF SHV BlackRock (88) (441)
WisdomTree Emerging Markets Local Debt Fund ELD WisdomTree (75) (353)
PowerShares Senior Loan Portfolio ETF BKLN PowerShares
(74) 838
iShares S&P/Citigroup International Treasury Bond Fund IGOV BlackRock (42) (71)
SPDR Barclays Intermediate Term Corporate Bond ETF ITR State Street (41) (14)
Source: Markit ETP Analytics

Markit iBoxx fixed income monthly market monitor \ June 2014
June 2014 46
Fixed income ETFs by assets
Table 33: Europe top 20 fixed income ETFs by assets All figures in $ million except otherwise stated
ETF Name Ticker Issuer Type AUM Turnover
iShares Euro Corporate Bond UCITS ETF IEAC iShares - Europe Corporate 4,515 254
iShares Euro High Yield Corporate Bond UCITS ETF IHYG iShares - Europe High Yield 4,221 377
iShares Euro Corporate Bond Large Cap UCITS ETF IBXLQ iShares - Europe Corporate 4,218 165
iShares J.P. Morgan $ Emerging Markets Bond UCITS ETF IEMB iShares - Europe Sovereign 4,173 841
iShares $ Treasury Bond 1-3yr UCITS ETF IDBT iShares - Europe Treasury 2,679 92
iShares Euro Corporate Bond ex-Financials UCITS ETF IEXF iShares - Europe Corporate 2,678 98
iShares Euro Government Bond 3-5yr UCITS ETF IBGX iShares - Europe Government 2,504 106
db x-trackers II iBoxx EUR Sovereigns Euro Yield Plus UCITS ETF
XY4P db x-trackers - Europe
Sovereign 1,977 147
Amundi EX AAA Government Bond EuroMTS Investment Grade UCITS ETF
X1G Amundi ETF Government 1,878 161
iShares £ Corporate Bond UCITS ETF SLXX iShares - Europe Investment Grade
1,847 195
PIMCO US Dollar Short Maturity Source UCITS ETF MINT Source ETF Government 1,813 2
PIMCO Euro Short Maturity Source UCITS ETF PJS1 Source ETF Broad Market 1,719 8
iShares $ Corporate Bond UCITS ETF LQDE iShares - Europe Corporate 1,652 122
iShares Emerging Markets Local Government Bond UCITS ETF
IEML iShares - Europe Government 1,599 90
iShares UK Gilts 0-5yr UCITS ETF IGLS iShares - Europe Government 1,577 124
iShares Euro Covered Bond UCITS ETF ICOV iShares - Europe Covered Bond
1,543 24
iShares Euro Aggregate Bond UCITS ETF IEAG iShares - Europe Broad Market 1,527 47
iShares UK Gilts UCITS ETF IGLT iShares - Europe Government 1,406 309
iShares Pfandbriefe UCITS ETF (DE) EXHE iShares - Europe Covered Bond
1,365 44
iShares £ Index-Linked Gilts UCITS ETF INXG iShares - Europe Inflation 1,363 110
Source: Markit ETP Analytics

Markit iBoxx fixed income monthly market monitor \ June 2014
June 2014 47
Table 34: US top 20 fixed income ETFs by assets All figures in $ million except otherwise stated
ETF Name Ticker Issuer Type AUM Turnover
Vanguard Total Bond Market ETF BND Vanguard - US Broad Market 19,944 700
iShares iBoxx $ Investment Grade Corporate Bond ETF
LQD iShares - US Investment Grade
17,789 1,404
iShares Core U.S. Aggregate Bond ETF AGG iShares - US Broad Market 17,154 1,162
Vanguard Short-Term Bond ETF BSV Vanguard - US Broad Market 14,388 304
iShares iBoxx $ High Yield Corporate Bond ETF HYG iShares - US High Yield 13,666 3,264
iShares TIPS Bond ETF TIP iShares - US TIPS 12,947 414
iShares 1-3 Year Credit Bond ETF CSJ iShares - US Investment Grade
12,933 239
iShares U.S. Preferred Stock ETF PFF iShares - US Preferred Stock 10,066 368
SPDR Barclays High Yield Bond ETF JNK SPDR ETFs - US High Yield 9,939 1,168
iShares 7-10 Year Treasury Bond ETF IEF iShares - US Treasury 9,835 1,254
Vanguard Short-Term Corporate Bond Index Fund VCSH Vanguard - US Investment Grade
8,055 250
iShares 1-3 Year Treasury Bond ETF SHY iShares - US Treasury 7,862 500
PowerShares Senior Loan Portfolio ETF BKLN PowerShares - US Leveraged Loan
7,289 404
iShares MBS ETF MBB iShares - US Agency MBS 5,785 199
iShares Intermediate Credit Bond ETF CIU iShares - US Corporate 5,779 201
PIMCO 0-5 Year High Yield Corporate Bond Index Fund
HYS PIMCO ETFs High Yield 5,097 265
iShares J.P. Morgan USD Emerging Markets Bond ETF
EMB iShares - US Sovereign 4,597 956
SPDR Barclays Short Term High Yield Bond ETF SJNK SPDR ETFs - US High Yield 4,226 84
ProShares UltraShort 20+ Year Treasury ETF TBT ProShares ETFs Treasury 4,180 3,056
PIMCO Enhanced Short Maturity Strategy Fund MINT PIMCO ETFs Broad Market 3,859 139
Source: Markit ETP Analytics

Markit iBoxx fixed income monthly market monitor \ June 2014
June 2014 48
Markit iBoxx ETF investible universe
Table 35: Markit iBoxx ETFs by asset class All figures in $ million except otherwise stated Summary
Asset Class No. Indices AUM Share
Government 93 14,688 20.4%
Corporate 58 53,572 74.5%
Inflation 14 3,617 5.0%
Total 165 71,877 100%
Government indices
Index Name ETP Name ETP Ticker Issuer Type Region AUM
Markit iBoxx ABF Indices (HKD, ABF Hong Kong, Total Gross Return)
ABF Hong Kong Bond Index Fund
2819 HSBC - Hong Kong
Government APAC 383
Markit iBoxx ABF Indices (IDR, ABF Indonesia, Total Gross Return)
ABF Indonesia Bond Index ETF Fund
R-ABFII Bahana Indonesia ETFs
Government APAC 149
Markit iBoxx ABF Indices (MYR, ABF Malaysia, Total Gross Return)
ABF Malaysia Bond Index Fund 0800EA AmInvestment Malaysia ETFs
Government APAC 217
Markit iBoxx ABF Indices (USD, ABF Pan-Asia, Total Gross Return)
ABF Pan Asia Bond Index Fund 2821 SSgA Asia ETFs
Government APAC 3,033
Markit iBoxx ABF Singapore (SGD, Total Gross Return)
ABF Singapore Bond Index Fund
A35 Nikko Singapore ETFs
Government APAC 40
Markit iBoxx ABF Indices (THB, ABF Thailand, Total Gross Return)
ABF Thailand Bond Index Fund ABFTH Kasikorn Thailand ETFs
Government APAC 177
Markit iBoxx ABF Singapore (SGD, Total Gross Return)
db x-trackers II Makrit iBoxx ABF Singapore Government UCITS ETF
KV4 db x-trackers - Asia
Government APAC 12
Markit iBoxx $ Short Treasuries 7-10Y (USD, Total Gross Return)
Amundi ETF Short US Treasury 7-10 Daily UCITS ETF
SU7 Amundi ETF Government Europe 65
Markit iBoxx EUR Germany Covered Capped Indices (EUR, Germany Covered Capped 3-5, Total Gross Return)
ComStage ETF iBoxx € Germany Covered Capped 3-5 TR UCITS ETF
C541 ComStage ETFs
Government Europe 45
Markit iBoxx EUR Germany Covered Capped Indices (EUR, Germany Covered Capped 5-7, Total Gross Return)
ComStage ETF iBoxx € Germany Covered Capped 5-7 TR UCITS ETF
C542 ComStage ETFs
Government Europe 15
Markit iBoxx EUR Germany Covered Capped Indices (EUR, Germany Covered Capped 7-10, Total Gross Return)
ComStage ETF iBoxx € Germany Covered Capped 7-10 TR UCITS ETF
C543 ComStage ETFs
Government Europe 18
Markit iBoxx EUR Germany Covered Indices (EUR, Germany Covered, Total Gross Return)
ComStage ETF iBoxx € Germany Covered Capped Overall TR UCITS ETF
C540 ComStage ETFs
Government Europe 15
Markit iBoxx EUR Liquid Sovereigns Diversified (EUR, Liquid Sovereign Diversified 7-10, Total Gross Return)
ComStage ETF iBoxx EUR Liquid Sovereigns Diversified 7-10 TR UCITS ETF
X505 ComStage ETFs
Government Europe 36
Markit iBoxx GBP Gilts Indices (GBP, Gilts, Total Gross Return)
db x-trackers II iBoxx GBP Gitls UCITS ETF
XBUT db x-trackers - Europe
Government Europe 11
Markit iBoxx EUR Germany Indices (EUR, Germany 1-3, Total Gross Return)
db x-trackers II iBoxx Germany 1-3 UCITS ETF
D5BC db x-trackers - Europe
Government Europe 252
Markit iBoxx EUR Germany Indices db x-trackers II iBoxx Germany XGN5 db x-trackers - Government Europe 1

Markit iBoxx fixed income monthly market monitor \ June 2014
June 2014 49
(EUR, Germany 3-5, Total Gross Return)
3-5 UCITS ETF Europe
Markit iBoxx EUR Germany Indices (EUR, Germany, Total Gross Return)
db x-trackers II iBoxx Germany UCITS ETF
D5BB db x-trackers - Europe
Government Europe 190
xxx(ETP) Markit iBoxx EUR Spain Indices (EUR, Spain 1-3, Total Gross Return)
db x-trackers II IBOXX SPAIN 1-3 UCITS ETF
X1ES db x-trackers - Europe
Government Europe 25
xxx(ETP) Markit iBoxx EUR Spain Covered (EUR, Total Gross Return)
db x-trackers II IBOXX SPAIN UCITS ETF
XIES db x-trackers - Europe
Government Europe 18
xxx(ETP) Markit iBoxx ABF Indonesia Government TR Index (IDR, Total Net Return)
db x-trackers II Markit iBoxx ABF Indonesia Government UCITS ETF
XIDR db x-trackers - Europe
Government Europe 2
Markit iBoxx EUR Liquid Sovereigns Diversified (EUR, Liquid Sovereign Diversified 7-10, Total Gross Return)
Deka iBoxx EUR Liquid Sovereign Diversified 7-10 UCITS ETF
EL4P Deka ETFs Government Europe 20
Markit iBoxx GBP Gilts Indices (GBP, Gilts, Total Gross Return)
Lyxor UCITS ETF iBoxx £ Gilts GILS Lyxor Government Europe 13
Markit iBoxx EUR Germany Indices (EUR, Germany, Total Gross Return)
PIMCO German Government Bond Index Source UCITS ETF
BUND Source ETF Government Europe 14
Markit iBoxx EUR Liquid Sovereigns Capped AAA-AA 1-5 Index (EUR, Total Gross Return)
Think iBoxx AAA-AA Government Bond UCITS ETF
TAT Think Capital Government Europe 555
Markit iBoxx EUR Germany Indices (EUR, Germany 1-3, Total Gross Return)
UBS ETF Markit iBoxx € Germany 1-3 UCITS ETF (EUR) A-dis
UEFL UBS ETF - Europe
Government Europe 109
Markit iBoxx EUR Germany Indices (EUR, Germany 3-5, Total Gross Return)
UBS ETF Markit iBoxx € Germany 3-5 UCITS ETF (EUR) A-dis
UEFM UBS ETF - Europe
Government Europe 3
Markit iBoxx EUR Germany Indices (EUR, Germany 7-10, Total Gross Return)
UBS ETF Markit iBoxx € Germany 7-10 UCITS ETF (EUR) A-dis
UEFP UBS ETF - Europe
Government Europe 11
Markit iBoxx EUR Germany Sov & Sub-Sov Liquid Index (EUR, Total Gross Return)
ProShares German Sovereign/Sub-Sovereign ETF
GGOV ProShares ETFs
Sovereign Americas 4
Markit iBoxx USD Liquid Emerging Markets Sovereigns (USD, Liquid Emerging Markets Sovereigns, Total Gross Return)
Amundi ETF Global Emerging Bond Markit iBoxx UCITS ETF
AGEB Amundi ETF Sovereign Europe 78
Markit iBoxx EUR Liquid Sovereigns Diversified (EUR, Liquid Sovereign Diversified 1-3, Total Gross Return)
ComStage ETF iBoxx EUR Liquid Sovereigns Diversified 1-3 TR UCITS ETF
X502 ComStage ETFs
Sovereign Europe 187
Markit iBoxx EUR Liquid Sovereigns Diversified (EUR, Liquid Sovereign Diversified 10-15, Total Gross Return)
ComStage ETF iBoxx EUR Liquid Sovereigns Diversified 10-15 TR UCITS ETF
X507 ComStage ETFs
Sovereign Europe 18
Markit iBoxx EUR Liquid Sovereigns Diversified (EUR, Liquid Sovereign Diversified 15+, Total Gross Return)
ComStage ETF iBoxx EUR Liquid Sovereigns Diversified 15+ TR UCITS ETF
X508 ComStage ETFs
Sovereign Europe 15
Markit iBoxx EUR Liquid Sovereigns Diversified (EUR, Liquid Sovereign Diversified 25+, Total Gross Return)
ComStage ETF iBoxx EUR Liquid Sovereigns Diversified 25+ TR UCITS ETF
X509 ComStage ETFs
Sovereign Europe 15
Markit iBoxx EUR Liquid Sovereigns Diversified (EUR, Liquid Sovereign Diversified 3-5, Total Gross Return)
ComStage ETF iBoxx EUR Liquid Sovereigns Diversified 3-5 TR UCITS ETF
X503 ComStage ETFs
Sovereign Europe 22
Markit iBoxx EUR Liquid Sovereign Diversified 3m-1 (EUR, Total Gross Return)
ComStage ETF iBoxx EUR Liquid Sovereigns Diversified 3m-1 TR UCITS ETF
X501 ComStage ETFs
Sovereign Europe 150
Markit iBoxx EUR Liquid Sovereigns Diversified (EUR, Liquid Sovereign Diversified 5-7, Total Gross Return)
ComStage ETF iBoxx EUR Liquid Sovereigns Diversified 5-7 TR UCITS ETF
X504 ComStage ETFs
Sovereign Europe 23
Markit iBoxx EUR Liquid Sovereigns Diversified (EUR, Liquid Sovereign Diversified , Total Gross Return)
ComStage ETF iBoxx EUR Liquid Sovereigns Diversified Overall TR UCITS ETF
X500 ComStage ETFs
Sovereign Europe 53
Markit iBoxx EUR Sovereigns Germany Capped Indices (EUR, Sovereigns Germany Capped 1-5, Total Gross Return)
ComStage ETF iBoxx EUR Sovereigns Germany Capped 1-5 TR UCITS ETF
8521 ComStage ETFs
Sovereign Europe 31

Markit iBoxx fixed income monthly market monitor \ June 2014
June 2014 50
Markit iBoxx EUR Sovereigns Germany Capped Indices (EUR, Sovereigns Germany Capped 10+, Total Gross Return)
ComStage ETF iBoxx EUR Sovereigns Germany Capped 10+ TR UCITS ETF
8523 ComStage ETFs
Sovereign Europe 181
Markit iBoxx EUR Sovereigns Germany Capped 3m-2 (EUR, Total Gross Return)
Comstage ETF iBoxx EUR Sovereigns Germany Capped 3m-2 TR UCITS ETF
8520 ComStage ETFs
Sovereign Europe 35
Markit iBoxx EUR Sovereigns Germany Capped Indices (EUR, Sovereigns Germany Capped 5-10, Total Gross Return)
ComStage ETF iBoxx EUR Sovereigns Germany Capped 5-10 TR UCITS ETF
8522 ComStage ETFs
Sovereign Europe 28
Markit iBoxx EUR Eurozone (EUR, Eurozone AAA, Total Gross Return)
db x-trackers II iBoxx EUR Sovereigns Euro AAA TR UCITS ETF
XBAT db x-trackers - Europe
Sovereign Europe 78
Markit iBoxx EUR Sovereigns Eurozone Yield Plus (EUR, Total Gross Return)
db x-trackers II iBoxx EUR Sovereigns Euro Yield Plus 2C UCITS ETF
XHYP db x-trackers - Europe
Sovereign Europe 12
Markit iBoxx EUR Sovereigns Eurozone Yield Plus (EUR, Total Gross Return)
db x-trackers II iBoxx EUR Sovereigns Euro Yield Plus UCITS ETF
XY4P db x-trackers - Europe
Sovereign Europe 1,977
Markit iBoxx EUR Germany Indices (EUR, Germany 7-10, Total Gross Return)
db x-trackers II iBoxx Germany 7-10 UCITS ETF
XG71 db x-trackers - Europe
Sovereign Europe 2
xxx(ETP) Markit iBoxx Japan Sovereign Index (JPY, Short Daily, Total Gross Return)
db x-trackers II IBOXX JAPAN SOVEREIGN SHORT DAILY UCITS ETF
XJSS db x-trackers - Europe
Sovereign Europe 8
xxx(ETP) Markit iBoxx Japan Sovereign Index (JPY, Total Gross Return)
db x-trackers II IBOXX JAPAN SOVEREIGN UCITS ETF
XJSE db x-trackers - Europe
Sovereign Europe 9
Markit iBoxx EUR Eurozone (EUR, Eurozone 1-3, Total Gross Return)
db x-trackers II iBoxx Sovereigns Eurozone 1-3 UCITS ETF
DBXP db x-trackers - Europe
Sovereign Europe 474
Markit iBoxx EUR Sovereigns Indices (EUR, Sovereigns 1-3, Total Gross Return)
db x-trackers II iBoxx Sovereigns Eurozone 1-3 UCITS ETF
X03B db x-trackers - Europe
Sovereign Europe 12
Markit iBoxx EUR Eurozone (EUR, Eurozone 10-15, Total Gross Return)
db x-trackers II iBoxx Sovereigns Eurozone 10-15 UCITS ETF
DBXC db x-trackers - Europe
Sovereign Europe 143
Markit iBoxx EUR Eurozone (EUR, Eurozone 15+, Total Gross Return)
db x-trackers II iBoxx Sovereigns Eurozone 15+ UCITS ETF
DBXF db x-trackers - Europe
Sovereign Europe 47
Markit iBoxx EUR Eurozone (EUR, Eurozone 25+, Total Gross Return)
db x-trackers II iBoxx Sovereigns Eurozone 25+ UCITS ETF
DBXG db x-trackers - Europe
Sovereign Europe 7
Markit iBoxx EUR Eurozone (EUR, Eurozone 3-5, Total Gross Return)
db x-trackers II iBoxx Sovereigns Eurozone 3-5 UCITS ETF
DBXQ db x-trackers - Europe
Sovereign Europe 597
Markit iBoxx EUR Sovereigns Indices (EUR, Sovereigns 3-5, Total Gross Return)
db x-trackers II iBoxx Sovereigns Eurozone 3-5 UCITS ETF
X03C db x-trackers - Europe
Sovereign Europe 20
Markit iBoxx EUR Eurozone (EUR, Eurozone 5-7, Total Gross Return)
db x-trackers II iBoxx Sovereigns Eurozone 5-7 UCITS ETF
DBXR db x-trackers - Europe
Sovereign Europe 433
Markit iBoxx EUR Eurozone (EUR, Eurozone 7-10, Total Gross Return)
db x-trackers II iBoxx Sovereigns Eurozone 7-10 UCITS ETF
DBXB db x-trackers - Europe
Sovereign Europe 139
Markit iBoxx EUR Eurozone (EUR, Eurozone AAA 1-3, Total Gross Return)
db x-trackers II iBoxx Sovereigns Eurozone AAA 1-3 UCITS ETF
XAXA db x-trackers - Europe
Sovereign Europe 7
xxx(ETP) Markit iBoxx EUR Sovereigns Eurozone AAA Index (EUR, Total Gross Return)
db x-trackers II IBOXX SOVEREIGNS EUROZONE AAA UCITS ETF
XBAI db x-trackers - Europe
Sovereign Europe 39
Markit iBoxx EUR Eurozone (EUR, Eurozone, Total Gross Return)
db x-trackers II iBoxx Sovereigns Eurozone UCITS ETF
DBXN db x-trackers - Europe
Sovereign Europe 1,302

Markit iBoxx fixed income monthly market monitor \ June 2014
June 2014 51
Markit iBoxx EUR Eurozone (EUR, Eurozone, Total Gross Return)
db x-trackers II iBoxx Sovereigns Eurozone UCITS ETF 4% - D
X03F db x-trackers - Europe
Sovereign Europe 16
xxx(ETP) Markit iBoxx EUR Sovereigns Eurozone Yield Plus 1-3 Index (EUR, Total Gross Return)
db x-trackers II IBOXX Sovereigns Eurozone Yield + 1-3 ETF UCITS ETF
XYP1 db x-trackers - Europe
Sovereign Europe 621
xxx(ETP) Markit iBoxx EUR Sovereigns Eurozone Yield Plus 1-3 Index (EUR, Total Gross Return)
db x-trackers II IBOXX SOVEREIGNS EUROZONE YIELD PLUS 1-3 UCITS ETF
XY1D db x-trackers - Europe
Sovereign Europe 47
Markit iBoxx EUR Sovereigns Eurozone Yield Plus (EUR, Total Gross Return)
db x-trackers II IBOXX SOVEREIGNS EUROZONE YIELD PLUS UCITS ETF
XYPD db x-trackers - Europe
Sovereign Europe 132
xxxxMarkit iBoxx EUR Short Sovereigns Eurozone (EUR, Total Gross Return)
db x-trackers II Short Short iBoxx EURO Sovereigns Eurozone Daily UCITS ETF
DXSV db x-trackers - Europe
Sovereign Europe 185
Markit iBoxx EUR Liquid Sovereigns Diversified (EUR, Liquid Sovereign Diversified 1-10, Total Gross Return)
Deka iBoxx EUR Liquid Sovereign Diversified 1-10 UCITS ETF
EL4K Deka ETFs Sovereign Europe 26
Markit iBoxx EUR Liquid Sovereigns Diversified (EUR, Liquid Sovereign Diversified 1-3, Total Gross Return)
Deka iBoxx EUR Liquid Sovereign Diversified 1-3 UCITS ETF
EL4L Deka ETFs Sovereign Europe 325
Markit iBoxx EUR Liquid Sovereigns Diversified (EUR, Liquid Sovereign Diversified 10+, Total Gross Return)
Deka iBoxx EUR Liquid Sovereign Diversified 10+ UCITS ETF
EL4Q Deka ETFs Sovereign Europe 15
Markit iBoxx EUR Liquid Sovereigns Diversified (EUR, Liquid Sovereign Diversified 3-5, Total Gross Return)
Deka iBoxx EUR Liquid Sovereign Diversified 3-5 UCITS ETF
EL4M Deka ETFs Sovereign Europe 15
Markit iBoxx EUR Liquid Sovereigns Diversified (EUR, Liquid Sovereign Diversified 5-7, Total Gross Return)
Deka iBoxx EUR Liquid Sovereign Diversified 5-7 UCITS ETF
EL4N Deka ETFs Sovereign Europe 123
Markit iBoxx EUR Liquid Sovereigns Global (EUR, Total Gross Return)
EasyETF iBoxx Liquid Sovereigns Global
EEIB EasyETF Sovereign Europe 226
Markit iBoxx EUR Sovereigns Indices (EUR, Sovereigns 1-3, Total Gross Return)
iShares Euro Government Bond 1-3 UCITS ETF (Acc)
CSBGE3 iShares - Europe
Sovereign Europe 106
Markit iBoxx EUR Sovereigns Indices (EUR, Sovereigns 3-7, Total Gross Return)
iShares Euro Government Bond 3-7 UCITS ETF (Acc)
CSBGE7 iShares - Europe
Sovereign Europe 123
Markit iBoxx EUR Sovereigns Indices (EUR, Sovereigns 7-10, Total Gross Return)
iShares Euro Government Bond 7-10 UCITS ETF (Acc)
CSBGE0 iShares - Europe
Sovereign Europe 20
Markit iBoxx EUR Liquid Sovereigns Capped (EUR, Liquid Sovereigns Capped 1.5 - 10.5, Total Gross Return)
iShares Euro Government Bond Capped 1.5-10.5yr UCITS ETF (DE)
EXHF iShares - Europe
Sovereign Europe 141
Markit iBoxx EUR Liquid Sovereigns Capped (EUR, Liquid Sovereigns Capped 1.5 - 2.5, Total Gross Return)
iShares Euro Government Bond Capped 1.5-2.5yr UCITS ETF (DE)
EXHG iShares - Europe
Sovereign Europe 76
Markit iBoxx EUR Liquid Sovereigns Capped (EUR, Liquid Sovereigns Capped 10.5+, Total Gross Return)
iShares Euro Government Bond Capped 10.5+yr UCITS ETF (DE)
EXHK iShares - Europe
Sovereign Europe 24
Markit iBoxx EUR Liquid Sovereigns Capped (EUR, Liquid Sovereigns Capped 2.5 - 5.5, Total Gross Return)
iShares Euro Government Bond Capped 2.5-5.5yr UCITS ETF (DE)
EXHH iShares - Europe
Sovereign Europe 85
Markit iBoxx EUR Liquid Sovereigns Capped (EUR, Liquid Sovereigns Capped 5.5 - 10.5, Total Gross Return)
iShares Euro Government Bond Capped 5.5-10.5yr UCITS ETF (DE)
EXHJ iShares - Europe
Sovereign Europe 50
Markit iBoxx USD Liquid Emerging Markets Sovereigns (USD, Liquid Emerging Markets Sovereigns, Total Gross Return)
Lyxor UCITS ETF iBoxx $ Liquid Emerging Markets Sovereigns
LEMB Lyxor Sovereign Europe 138
Markit iBoxx EUR Liquid Sovereigns Diversified (EUR, Liquid Sovereign Diversified 1-10, Total Gross Return)
Think iBoxx Government Bond UCITS ETF
TGBT Think Capital Sovereign Europe 338

Markit iBoxx fixed income monthly market monitor \ June 2014
June 2014 52
Markit iBoxx EUR Sovereigns Indices (EUR, Sovereigns 1-5, Total Gross Return)
UBS ETF - Markit iBoxx € Sovereigns 1-5 UCITS ETF, class (EUR) A-dis
SS1EUA UBS ETC - Swiss
Sovereign Europe 4
Markit iBoxx EUR Germany Indices (EUR, Germany 5-10, Total Gross Return)
UBS ETF Markit iBoxx € Germany 5-10 UCITS ETF (EUR) A-dis
UEFN UBS ETF - Europe
Sovereign Europe 3
Markit iBoxx USD Treasuries (USD, Treasuries 1-3Y, Total Gross Return)
Amundi ETF US Treasury 1-3 UCITS ETF
US1 Amundi ETF Treasury Europe 5
Markit iBoxx $ Treasuries 3-7Y (USD, Total Gross Return)
Amundi ETF US Treasury 3-7 UCITS ETF
US3 Amundi ETF Treasury Europe 4
Markit iBoxx USD Treasuries (USD, Treasuries 7-10Y, Total Gross Return)
Amundi ETF US Treasury 7-10 UCITS ETF
US7 Amundi ETF Treasury Europe 4
Markit iBoxx USD Treasuries (USD, Treasuries 1-3Y, Total Gross Return)
db x-trackers II iBoxx USD Treasuries 1-3 UCITS ETF
XUT3 db x-trackers - Europe
Treasury Europe 12
Markit iBoxx USD Treasuries (USD, Treasuries, Total Gross Return)
db x-trackers II iBoxx USD Treasuries UCITS ETF
XUTD db x-trackers - Europe
Treasury Europe 26
Markit iBoxx USD Treasuries (USD, Treasuries 1-3Y, Total Gross Return)
iShares USD Government Bond 1-3 UCITS ETF (Acc)
CSBGU3 iShares - Europe
Treasury Europe 38
Markit iBoxx $ Treasuries 3-7Y (USD, Total Gross Return)
iShares USD Government Bond 3-7 UCITS ETF (Acc)
CSBGU7 iShares - Europe
Treasury Europe 125
Markit iBoxx USD Treasuries (USD, Treasuries 7-10Y, Total Gross Return)
iShares USD Government Bond 7-10 UCITS ETF (Acc)
CSBGU0 iShares - Europe
Treasury Europe 5
Markit iBoxx USD Treasuries (USD, Treasuries 1-3Y, Total Gross Return)
Lyxor UCITS ETF iBoxx Treasuries 1-3Y
US13 Lyxor Treasury Europe 27
Markit iBoxx USD Treasuries (USD, Treasuries 10Y+, Total Gross Return)
Lyxor UCITS ETF iBoxx Treasuries 10Y+
US10 Lyxor Treasury Europe 21
Markit iBoxx USD Treasuries (USD, Treasuries 5-7Y, Total Gross Return)
Lyxor UCITS ETF iBoxx Treasuries 5-7Y
US57 Lyxor Treasury Europe 8
Corporate indices
Index Name ETP Name ETP Ticker Issuer Type Region AUM
Markit iBoxx EUR Liquid Non-Financials Diversified Index (EUR, Total Gross Return)
Deka iBoxx EUR Liquid Non-Financials Diversified UCITS ETF
EFQ8 Deka ETFs Corporate Europe 628
Markit iBoxx EUR Liquid Non-Financials (EUR, Non-Financials, Total Gross Return)
Amundi ETF Euro Corporate Ex Financial iBoxx UCITS ETF
AXFI Amundi ETF Corporate Europe 8
Markit iBoxx EUR Liquid Financials (EUR, Financials, Total Gross Return)
Amundi ETF Euro Corporate Financials iBoxx UCITS ETF
AFIN Amundi ETF Corporate Europe 146
Markit iBoxx EUR Liquid Corporates (EUR, Liquid Corporates, Total Gross Return)
Amundi ETF Euro Corporates UCITS ETF
CC4 Amundi ETF Corporate Europe 242
Markit iBoxx EUR Liquid Corporates 100 (EUR, 100 Financials Subindex, Total Gross Return)
db x-trackers II iBoxx EUR Liquid Corporate 100 Financials Sub-Index Total Return ETF 2C UCITS ETF
XHCF db x-trackers - Europe
Corporate Europe 2
Markit iBoxx EUR Liquid Corporates 100 (EUR, 100 Financials Subindex, Total Gross Return)
db x-trackers II iBoxx EUR Liquid Corporate 100 Financials Sub-Index Total Return UCITS ETF
XB4F db x-trackers - Europe
Corporate Europe 19
Markit iBoxx EUR Liquid Corporates 100 (EUR, 100 Non-financials Subindex, Total Gross Return)
db x-trackers II iBoxx EUR Liquid Corporate 100 Non-Financials Sub-Index Total Return ETF 2C UCITS E
XHCN db x-trackers - Europe
Corporate Europe 2
Markit iBoxx EUR Liquid Corporates 100 (EUR, 100 Non-financials Subindex, Total Gross Return)
db x-trackers II iBoxx EUR Liquid Corporate 100 Non-Financials Sub-Index Total Return UCITS ETF
XB4N db x-trackers - Europe
Corporate Europe 51
Markit iBoxx EUR Liquid Corporates 100 (EUR, Total Gross Return)
db x-trackers II iBoxx EUR Liquid Corporate UCITS ETF
D5BG db x-trackers - Europe
Corporate Europe 281
Markit iBoxx EUR Liquid Corporates 100 (EUR, Total Gross Return)
db x-trackers II iBoxx EUR Liquid Corporate UCITS ETF 2C
XHCP db x-trackers - Europe
Corporate Europe 2

Markit iBoxx fixed income monthly market monitor \ June 2014
June 2014 53
Markit iBoxx EUR Germany Indices (EUR, Germany, Total Gross Return)
db x-trackers II iBoxx Germany UCITS ETF 4% - D
X03G db x-trackers - Europe
Corporate Europe 1
Markit iBoxx EUR Liquid Corporates Diversified (EUR, Total Gross Return)
Deka iBoxx EUR Liquid Corporates Diversified UCITS ETF
EL49 Deka ETFs Corporate Europe 153
Markit iBoxx $ Liquid Investment Grade Top 30 Index (USD, Total Gross Return)
iShares $ Corporate Bond UCITS ETF
LQDE iShares - Europe
Corporate Europe 1,652
Markit iBoxx GBP Corporates Indices (GBP, Corporates 1-5, Total Gross Return)
iShares £ Corporate Bond 1-5yr UCITS ETF
IS15 iShares - Europe
Corporate Europe 1,007
Markit iBoxx EUR Liquid Corporates (EUR, Liquid Corporates, Total Gross Return)
iShares Euro Corporate Bond Large Cap UCITS ETF
IBXLQ iShares - Europe
Corporate Europe 4,218
Markit iBoxx EUR Liquid Corporates (EUR, Liquid Corporates, Total Gross Return)
Lyxor UCITS ETF Euro Corporate Bond -C- EUR
CRP Lyxor Corporate Europe 855
Markit iBoxx EUR Liquid Non-Financials (EUR, Non-Financials, Total Gross Return)
Lyxor UCITS ETF Euro Corporate Bond Ex-Financials
CNB Lyxor Corporate Europe 226
Markit iBoxx EUR Liquid Corporates (EUR, Liquid Corporates, Total Gross Return)
Think iBoxx Corporate Bond UCITS ETF
TCBT Think Capital Corporate Europe 184
Markit iBoxx EUR Liquid Corporates (EUR, Liquid Corporates, Total Gross Return)
UBS ETF Markit iBoxx € Liquid Corporates UCITS ETF (EUR) A-dis
UEFR UBS ETF - Europe
Corporate Europe 46
Markit iBoxx EUR Liquid Covered Index (EUR, Total Gross Return)
db x-trackers II IBOXX EUR Liquid Covered Index UCITS ETF 1C
XLIQ db x-trackers - Europe
Covered Bond
Europe 10
Markit iBoxx EUR Germany Indices (EUR, Germany 1-3, Total Gross Return)
db x-trackers II iBoxx Germany Covered 1-3 UCITS ETF
X03A db x-trackers - Europe
Covered Bond
Europe 15
Markit iBoxx EUR Germany Covered Indices (EUR, Germany Covered, Total Gross Return)
db x-trackers II iBoxx Germany Covered UCITS ETF
DXSW db x-trackers - Europe
Covered Bond
Europe 372
Markit iBoxx EUR Germany Covered Indices (EUR, Germany Covered, Total Gross Return)
db x-trackers II IBOXX GERMANY COVERED UCITS ETF 1D
XBCD db x-trackers - Europe
Covered Bond
Europe 0
Markit iBoxx EUR Liquid Germany Covered Diversified (EUR, Liquid Germany Covered Diversified, Total Gross Return)
Deka iBoxx EUR Liquid Ger. Covered Diversified UCITS ETF
EL48 Deka ETFs Covered Bond
Europe 234
Markit iBoxx EUR Covered Indices (EUR, Covered, Total Gross Return)
iShares Euro Covered Bond UCITS ETF
ICOV iShares - Europe
Covered Bond
Europe 1,543
Markit iBoxx USD Liquid High Yield 0-5 Index (USD, Total Gross Return)
iShares 0-5 Year High Yield Corporate Bond ETF
SHYG iShares - US High Yield Americas 71
Markit iBoxx Global Developed Markets ex-US High Yield Index (USD, Total Gross Return)
iShares Global ex USD High Yield Corporate Bond ETF
HYXU iShares - US High Yield Americas 175
Markit iBoxx Global Developed Markets High Yield Index (USD, Total Gross Return)
iShares Global High Yield Corporate Bond ETF
GHYG iShares - US High Yield Americas 92
Markit iBoxx USD Liquid High Yield Index (USD, Total Gross Return)
iShares iBoxx $ High Yield Corporate Bond ETF
HYG iShares - US High Yield Americas 13,666
Markit iBoxx USD Liquid High Yield Index (USD, Total Gross Return)
iShares U.S. High Yield Bond Index Fund (CAD-Hedged)
XHY iShares - Canada
High Yield Americas 612
Markit iBoxx USD Liquid High Yield Index (USD, Total Gross Return)
ProShares Short High Yield ETF SJB ProShares ETFs
High Yield Americas 43
Markit iBoxx USD Liquid High Yield Index (USD, Total Gross Return)
ProShares Ultra High Yield ETF UJB ProShares ETFs
High Yield Americas 3
Markit iBoxx USD Liquid High Yield Index (USD, Total Gross Return)
KINDEX SYNTH-iBoxx USD Liquid High Yield ETF
181450 Kindex Korea ETFs
High Yield APAC 6
Markit iBoxx USD Liquid High Yield 0-5 Index (USD, Total Gross Return)
Tiger SYNTH-iBoxx USD Liquid High Yield 0-5Y ETF
182490 Tiger Korea High Yield APAC 30
xxx(ETP) Markit iBoxx EUR Liquid High Yield 30 Ex-Financial index
Amundi Euro High Yield Liquid UCITS
AHYE Amundi ETF High Yield Europe 162

Markit iBoxx fixed income monthly market monitor \ June 2014
June 2014 54
(EUR, Total Gross Return)
xxx(ETP) Markit iBoxx USD Liquid High Yield 0-5 Capped Index (USD, Total Gross Return)
iShares Short Duration High Yield Corporate Bond UCITS
SDHY iShares - Europe
High Yield Europe 97
Markit iBoxx $ Liquid High Yield Capped Index (USD, Total Gross Return)
iShares $ High Yield Corporate Bond UCITS ETF
SHYU iShares - Europe
High Yield Europe 1,077
Markit iBoxx EUR Liquid High Yield (EUR, Total Gross Return)
iShares Euro High Yield Corporate Bond UCITS ETF
IHYG iShares - Europe
High Yield Europe 4,221
Markit iBoxx Global Developed Markets Liquid High Yield Capped Index (GBP, Hedged, Total Gross Return)
iShares Global High Yield Corp Bond GBP Hedged UCITS ETF
GHYS iShares - Europe
High Yield Europe 84
Markit iBoxx Global Developed Markets Liquid High Yield Capped Index (USD, Total Gross Return)
iShares Global High Yield Corp Bond UCITS ETF
HYLD iShares - Europe
High Yield Europe 189
Markit iBoxx EUR Liquid High Yield 30 (EUR, Total Gross Return)
Lyxor UCITS ETF iBoxx EUR High Yield 30
YIEL Lyxor High Yield Europe 400
xxx(ETP) Markit iBoxx USD Liquid Investment Grade 0-5 Index (USD, Total Gross Return)
iShares 0-5 Year Investment Grade Corporate Bond ETF
SLQD iShares - US Investment Grade
Americas 10
Markit iBoxx USD Liquid Investment Grade Index (USD, Total Gross Return)
iShares iBoxx $ Investment Grade Corporate Bond ETF
LQD iShares - US Investment Grade
Americas 17,789
xxx(ETP) Markit iBoxx USD Liquid Investment Grade Interest Rate Hedged Index (USD, Total Gross Return)
iShares Interest Rate Hedged Corporate Bond ETF
LQDH iShares - US Investment Grade
Americas 10
Markit iBoxx USD Liquid Investment Grade Index (USD, Total Gross Return)
iShares U.S. IG Corporate Bond Index Fund (CAD-Hedged)
XIG iShares - Canada
Investment Grade
Americas 62
Markit iBoxx USD Liquid Investment Grade Index (USD, Total Gross Return)
ProShares Short Investment Grade Corporate
IGS ProShares ETFs
Investment Grade
Americas 3
Markit iBoxx USD Liquid Investment Grade Index (USD, Total Gross Return)
ProShares Ultra Investment Grade Corporate ETF
IGU ProShares ETFs
Investment Grade
Americas 3
Markit iBoxx GBP Liquid Corporates 100 Index (GBP, Total Gross Return)
db x-trackers II iBoxx GBP Liquid Corporate UCITS ETF
XG7C db x-trackers - Europe
Investment Grade
Europe 10
xxx(ETP) Markit iBoxx USD Liquid Investment Grade 0-5 Index (USD, Total Gross Return)
iShares Short Duration Corporate Bond UCITS
SDIG iShares - Europe
Investment Grade
Europe 52
xxx(ETP) Markit iBoxx USD Liquid Investment Grade Interest Rate Hedged Index (USD, Total Gross Return)
iShares $ Corporate Bond Interest Rate Hedged UCITS
LQDH iShares - Europe
Investment Grade
Europe 42
xxx(ETP) Markit iBoxx USD Liquid Investment Grade Ultrashort Index (USD, Total Gross Return)
iShares $ Ultrashort Bond UCITS ETF
ERND iShares - Europe
Investment Grade
Europe 26
Markit iBoxx GBP Non-Financials (GBP, Non-Financials, Total Gross Return)
iShares £ Corporate Bond ex-Financials UCITS ETF
SSXF iShares - Europe
Investment Grade
Europe 485
xxx(ETP) Markit iBoxx GBP Liquid Corporates Large Cap Interest Rate Hedged Index (GBP, Total Gross Return)
iShares £ Corporate Bond Interest Rate Hedged UCITS
SLXH iShares - Europe
Investment Grade
Europe 42
Markit iBoxx GBP Liquid Corporates Long Dated (GBP, Liquid Corporates Long Dated, Total Gross Return)
iShares £ Corporate Bond UCITS ETF
SLXX iShares - Europe
Investment Grade
Europe 1,847
xxx(ETP) Markit iBoxx GBP Liquid Investment Grade Ultrashort Index (GBP, Total Gross Return)
iShares £ Ultrashort Bond UCITS ETF
ERNS iShares - Europe
Investment Grade
Europe 114
xxx(ETP) Markit iBoxx EUR Liquid Investment Grade Ultrashort Index (EUR, Total Gross Return)
iShares Euro Ultrashort Bond UCITS ETF
ERNE iShares - Europe
Investment Grade
Europe 27

Markit iBoxx fixed income monthly market monitor \ June 2014
June 2014 55
Markit iBoxx GBP Liquid Corporates Long Dated (GBP, Liquid Corporates Long Dated, Total Gross Return)
Lyxor UCITS ETF iBoxx £ Liquid Corporates Long Dated
COUK Lyxor Investment Grade
Europe 15
Inflation-linked indices
Index Name ETP Name ETP Ticker Issuer Type Region AUM
Markit iBoxx EUR Euro Inflation-Linked (EUR, Nominal, Total Gross Return)
Amundi ETF Euro Inflation UCITS ETF
CI3 Amundi ETF Inflation Europe 11
Markit iBoxx EUR Sovereigns Inflation-Linked Euro-Inflation (EUR, Nominal, Total Gross Return)
ComStage ETF iBoxx Euro Sovereigns Inflation-Linked TR UCITS ETF
8530 ComStage ETFs
Inflation Europe 28
Markit iBoxx Global Inflation-Linked Index All (EUR, EUR Hedged Nominal, Total Gross Return)
db x-trackers II GLOBAL INFLATION-LINKED UCITS ETF
XGIU db x-trackers - Europe
Inflation Europe 1
Markit iBoxx EUR Euro Inflation-Linked (EUR, Nominal, Total Gross Return)
db x-trackers II iBoxx Euro Inflation-Linked UCITS ETF
DBXK db x-trackers - Europe
Inflation Europe 178
Markit iBoxx EUR Global Inflation-Linked Index All (EUR, Hedged Nominal, Total Gross Return)
db x-trackers II iBoxx Global Inflation-Linked UCITS ETF (EUR)
DBXH db x-trackers - Europe
Inflation Europe 737
Markit iBoxx Global Inflation-Linked Index All (GBP, GBP Hedged Nominal, Total Gross Return)
db x-trackers II iBoxx Global Inflation-Linked UCITS ETF (GBP)
XGIG db x-trackers - Europe
Inflation Europe 2
Markit iBoxx Global Inflation-Linked Index All (USD, USD Hedged Nominal, Total Gross Return)
db x-trackers II iBoxx Global Inflation-Linked UCITS ETF (USD)
XG7U db x-trackers - Europe
Inflation Europe 111
Markit iBoxx Global Inflation-Linked Index All (EUR, EUR Hedged Nominal, Total Gross Return)
db x-trackers II IBOXX GLOBAL INFLATION-LINKED UCITS ETF 1D
XGII db x-trackers - Europe
Inflation Europe 4
Markit iBoxx GBP Gilt Inflation Linked (GBP, Gilt Inflation Linked Nominal, Total Gross Return)
db x-trackers II iBoxx UK Gilts Inflation-Linked UCITS ETF
XBUI db x-trackers - Europe
Inflation Europe 8
Markit iBoxx EUR Euro Inflation-Linked (EUR, Nominal, Total Gross Return)
iShares Euro Inflation Link Bond UCITS ETF
CSBILE iShares - Europe
Inflation Europe 46
Markit iBoxx TIPS Inflation-Linked Index (USD, Nominal, Total Gross Return)
iShares USD Inflation Linked Bond UCITS ETF
CSBILU iShares - Europe
Inflation Europe 42
Markit iBoxx GBP Gilt Inflation Linked (GBP, Gilt Inflation Linked Nominal, Total Gross Return)
Lyxor UCITS ETF iBoxx UK Gilt Inflation-Linked Index
GILI Lyxor Inflation Europe 4
Markit iBoxx Target Duration TIPS Index (USD, 3 Year - Nominal, Total Gross Return)
FlexShares iBoxx 3-Year Target Duration TIPS Index Fund
TDTT FlexShares TIPS Americas 2,142
Markit iBoxx Target Duration TIPS Index (USD, 5 Year - Nominal, Total Gross Return)
FlexShares iBoxx 5-Year Target Duration TIPS Index Fund
TDTF FlexShares TIPS Americas 303
Source: Markit ETP Analytics

Markit iBoxx fixed income monthly market monitor \ June 2014
June 2014 56
For further information, please visit www.markit.com
Ivelin Angelov
Associate
Markit Index Research
Tel: +44 20 7064 6207
Email: [email protected]
Jun Qian
Associate VP
Markit Index Research
Tel: +1 212 205 1757
Email: [email protected]