Embed Size (px)
Citation preview
Barry A. KlingerJagadish Shukla
George Mason University (GMU)Institute of Global Environment and Society (IGES)
Global Warming:Global Warming:The known, the unknown, The known, the unknown,
and the unknowableand the unknowable
January, 2008, George Mason University
Center of Ocean-Land-Atmosphere studies
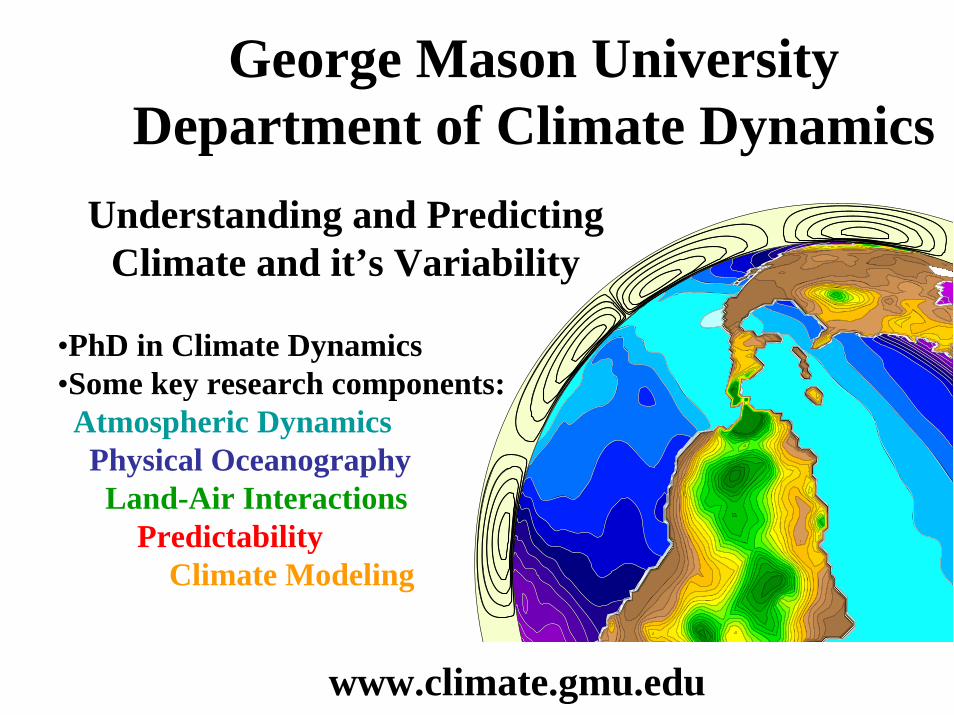
George Mason UniversityDepartment of Climate Dynamics
Understanding and PredictingClimate and it’s Variability
•PhD in Climate Dynamics•Some key research components:Atmospheric DynamicsPhysical OceanographyLand-Air Interactions
PredictabilityClimate Modeling
www.climate.gmu.edu
Want to explore more?
Climate Dynamics classesinclude...
This semester: CLIM 759 Climate Change (graduate course – 14 week version of today’s lecture)7:20-10:00pm, Tue, Innovation Hall rm 338
Fall 2008: NEW COURSECLIM 101: Weather, Climate, and Global Society• Open to all undergraduates• Satisfies General Education Requirement for Science (non-lab)
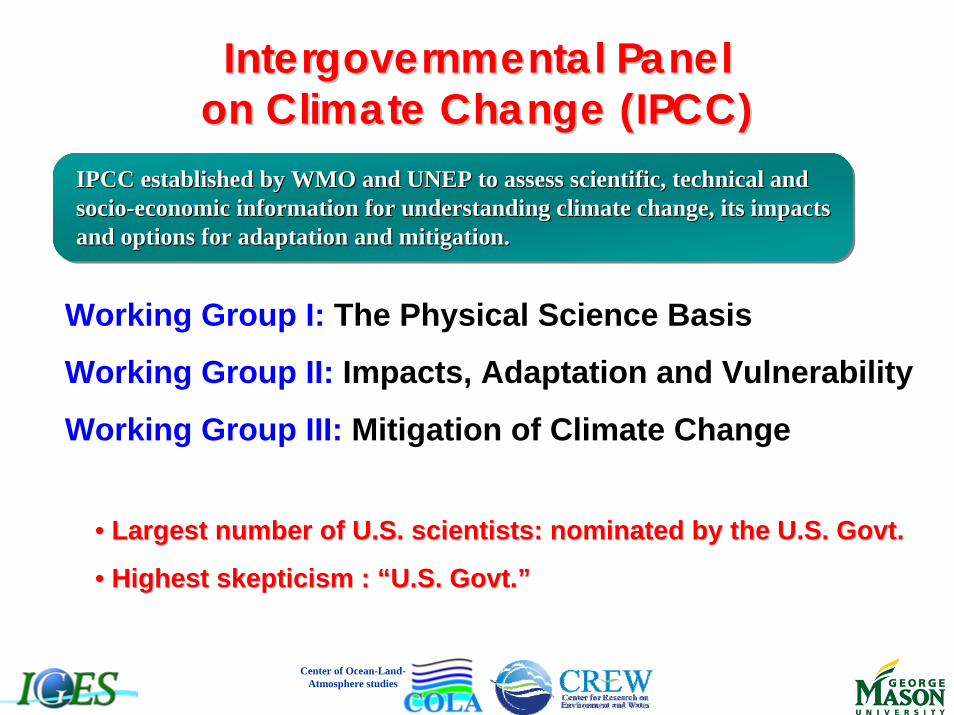
IPCC established by WMO and UNEP to assess scientific, technical and socio-economic information for understanding climate change, its impacts and options for adaptation and mitigation.
IPCC established by WMO and UNEP to assess scientific, technicalIPCC established by WMO and UNEP to assess scientific, technical and and sociosocio--economic information for understanding climate change, its impaceconomic information for understanding climate change, its impacts ts and options for adaptation and mitigation.and options for adaptation and mitigation.
Intergovernmental Panel Intergovernmental Panel on Climate Change (IPCC)on Climate Change (IPCC)
Working Group I: The Physical Science Basis
Working Group II: Impacts, Adaptation and Vulnerability
Working Group III: Mitigation of Climate Change
Center of Ocean-Land-Atmosphere studies
•• Largest number of U.S. scientists: nominated by the U.S. Govt.Largest number of U.S. scientists: nominated by the U.S. Govt.
•• Highest skepticism : Highest skepticism : ““U.S. Govt.U.S. Govt.””
Center of Ocean-Land-Atmosphere studies
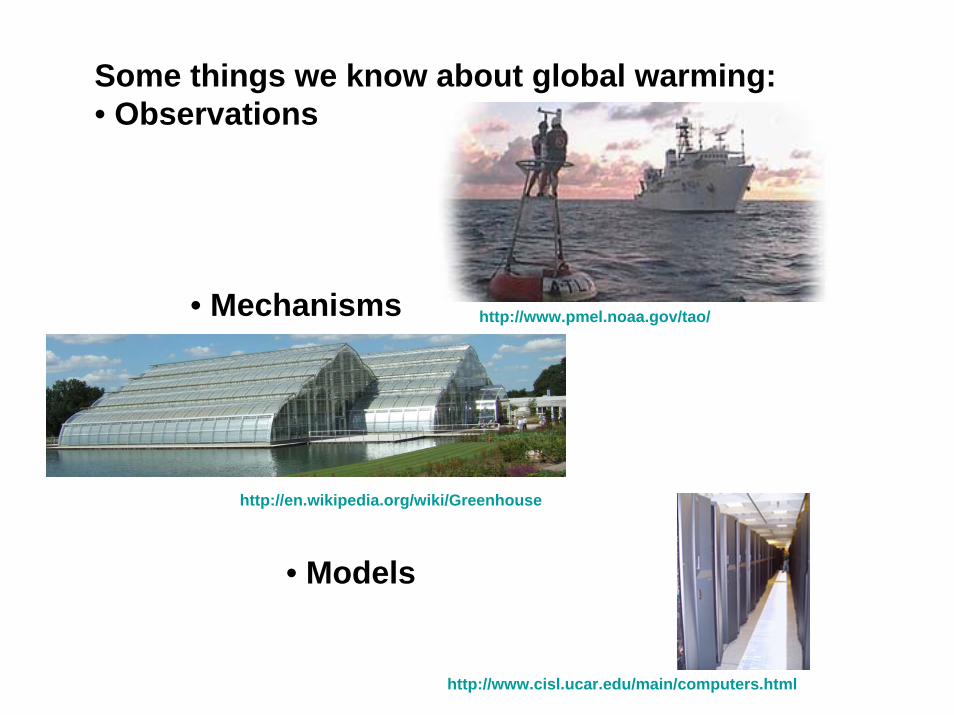
Some things we know about global warming:• Observations
• Mechanisms
• Models
http://en.wikipedia.org/wiki/Greenhouse
http://www.pmel.noaa.gov/tao/
http://www.cisl.ucar.edu/main/computers.html
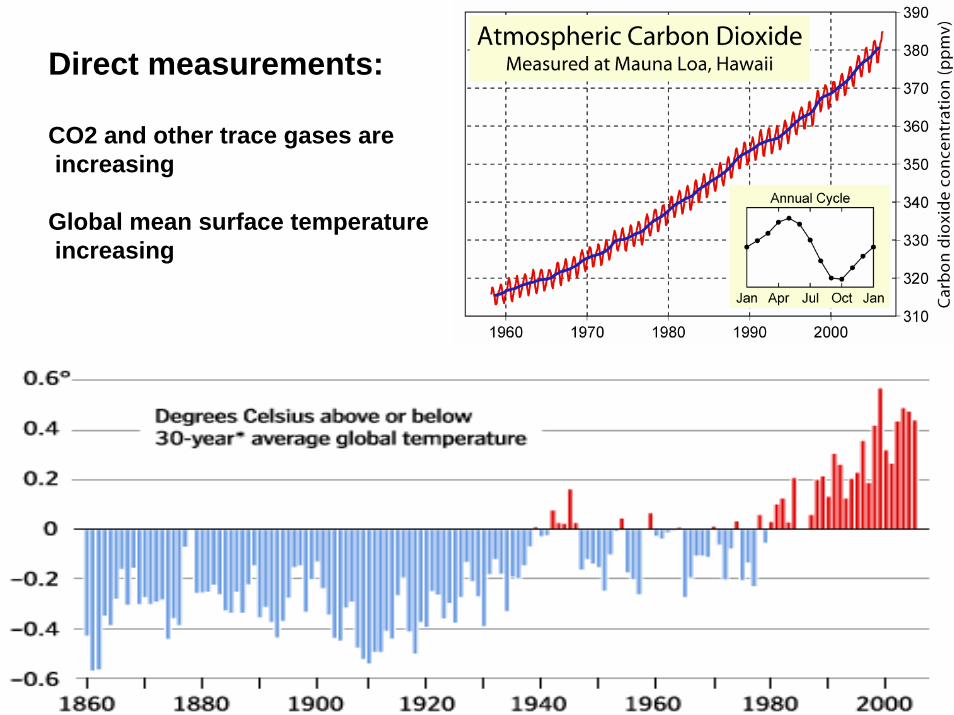
Direct measurements:
CO2 and other trace gases areincreasing
Global mean surface temperatureincreasing
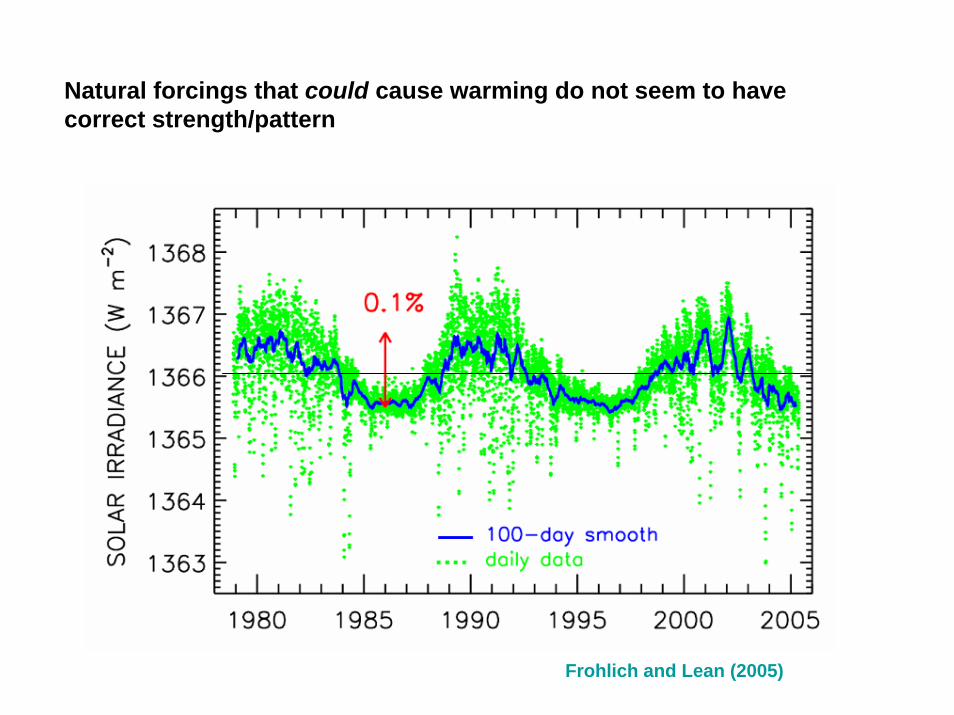
Natural forcings that could cause warming do not seem to havecorrect strength/pattern
Frohlich and Lean (2005)
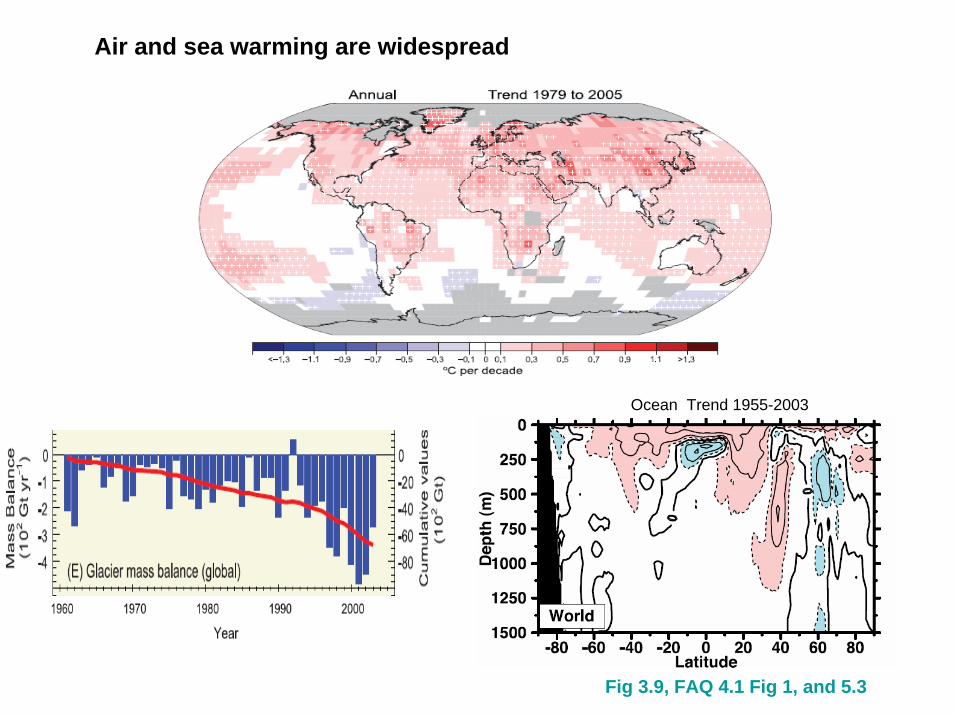
Ocean Trend 1955-2003
Fig 3.9, FAQ 4.1 Fig 1, and 5.3
Air and sea warming are widespread
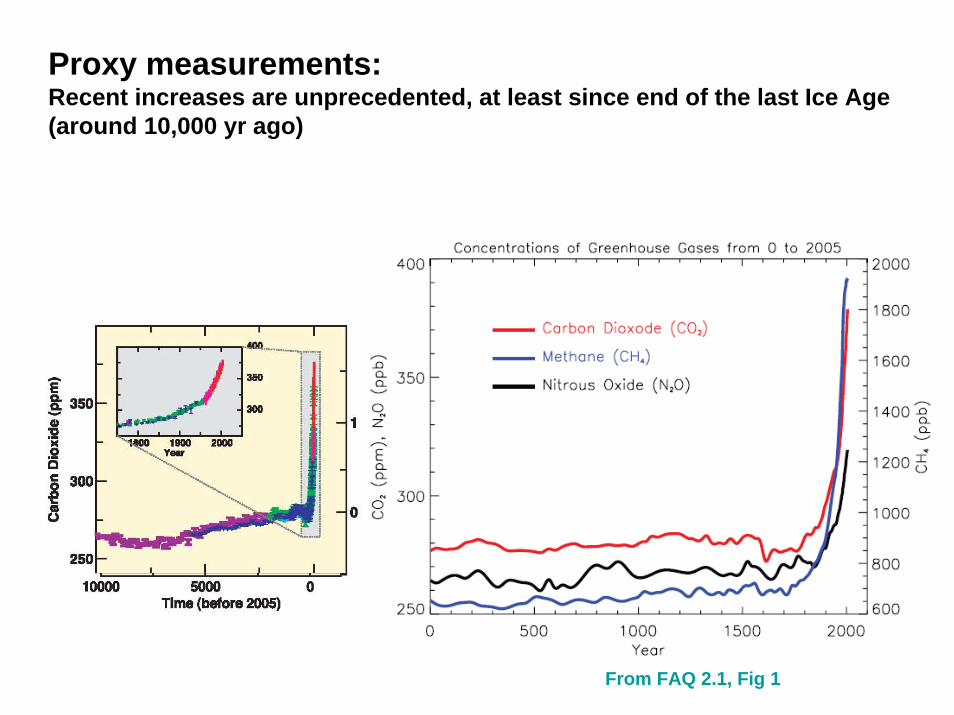
Proxy measurements: Recent increases are unprecedented, at least since end of the last Ice Age (around 10,000 yr ago)
From FAQ 2.1, Fig 1
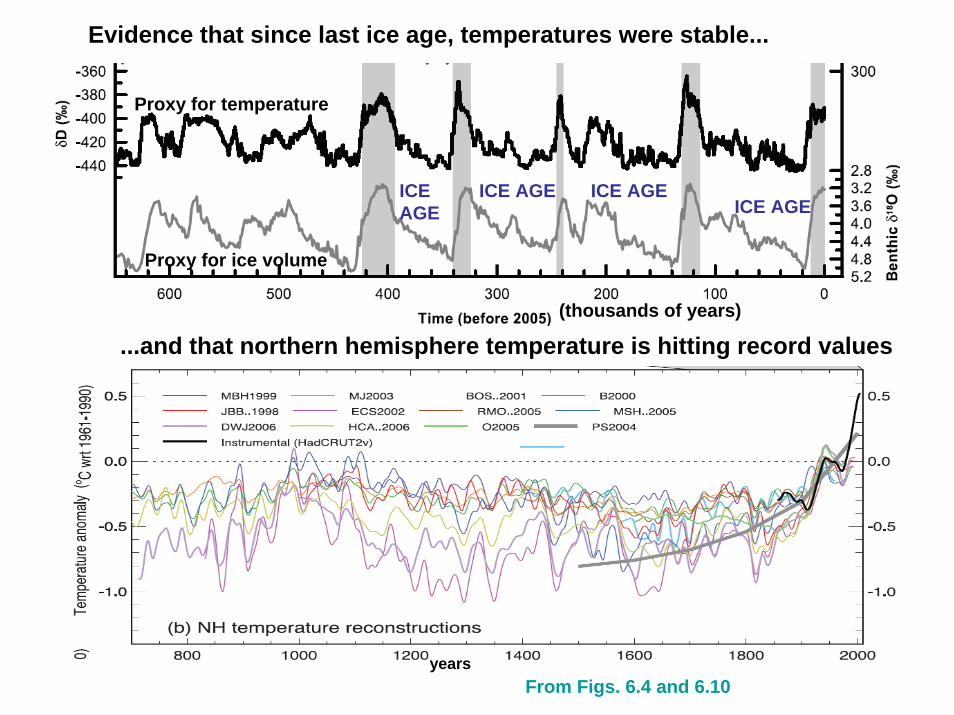
Proxy for temperature
Proxy for ice volume
Evidence that since last ice age, temperatures were stable...
...and that northern hemisphere temperature is hitting record values
From Figs. 6.4 and 6.10
(thousands of years)
ICE AGEICE AGE ICE AGEICE
AGE
years
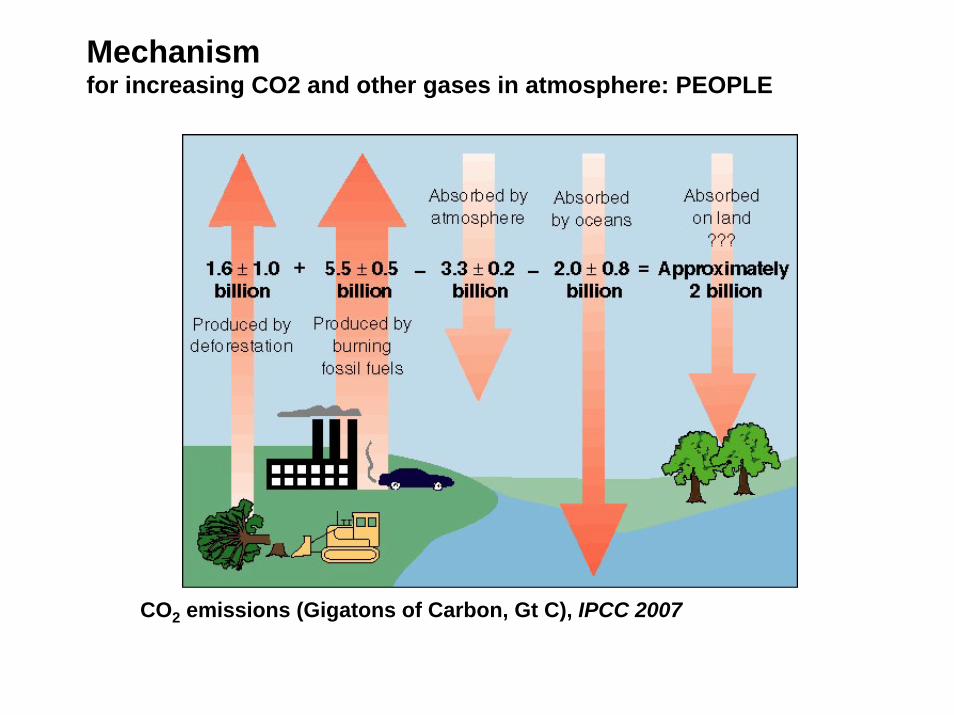
Mechanismfor increasing CO2 and other gases in atmosphere: PEOPLE
CO2 emissions (Gigatons of Carbon, Gt C), IPCC 2007
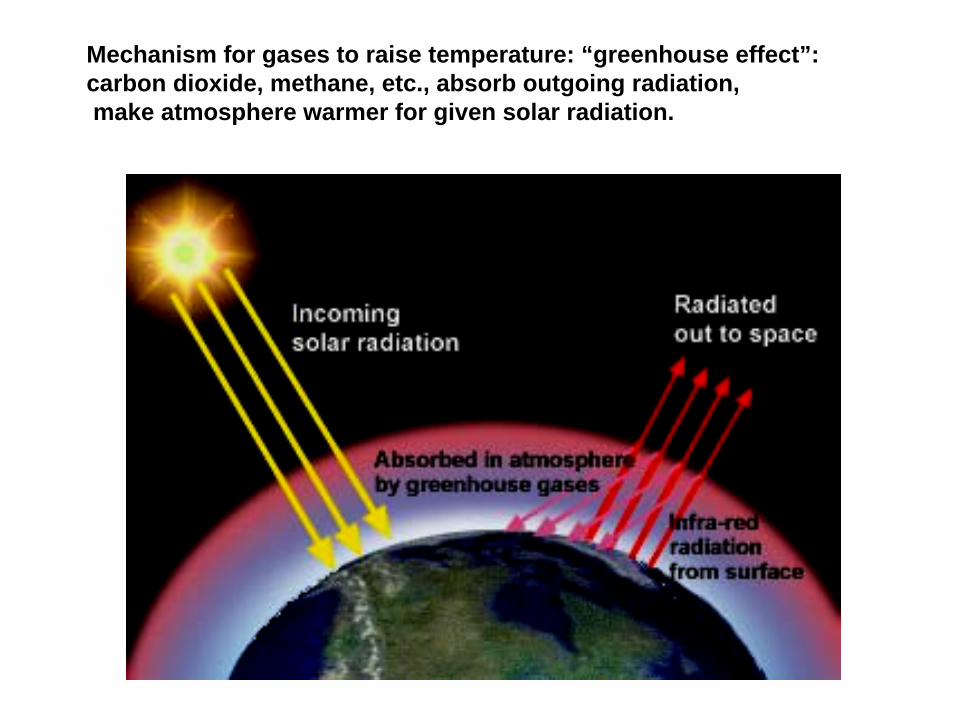
Mechanism for gases to raise temperature: “greenhouse effect”:carbon dioxide, methane, etc., absorb outgoing radiation, make atmosphere warmer for given solar radiation.
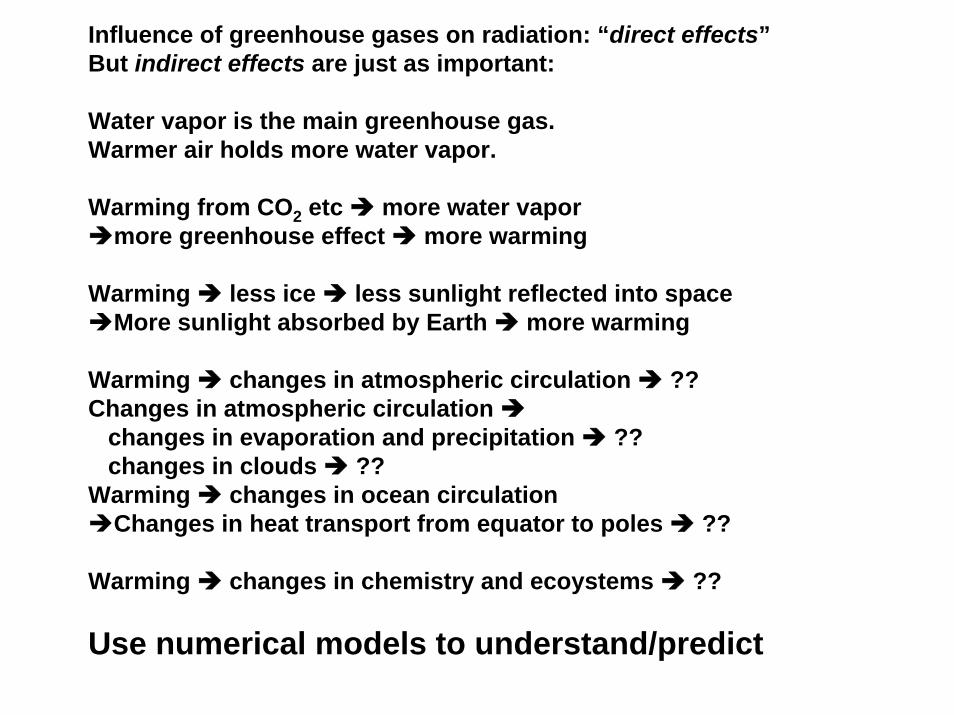
Influence of greenhouse gases on radiation: “direct effects”But indirect effects are just as important:
Water vapor is the main greenhouse gas.Warmer air holds more water vapor.
Warming from CO2 etc more water vapormore greenhouse effect more warming
Warming less ice less sunlight reflected into spaceMore sunlight absorbed by Earth more warming
Warming changes in atmospheric circulation ??Changes in atmospheric circulation
changes in evaporation and precipitation ??changes in clouds ??
Warming changes in ocean circulationChanges in heat transport from equator to poles ??
Warming changes in chemistry and ecoystems ??
Use numerical models to understand/predict
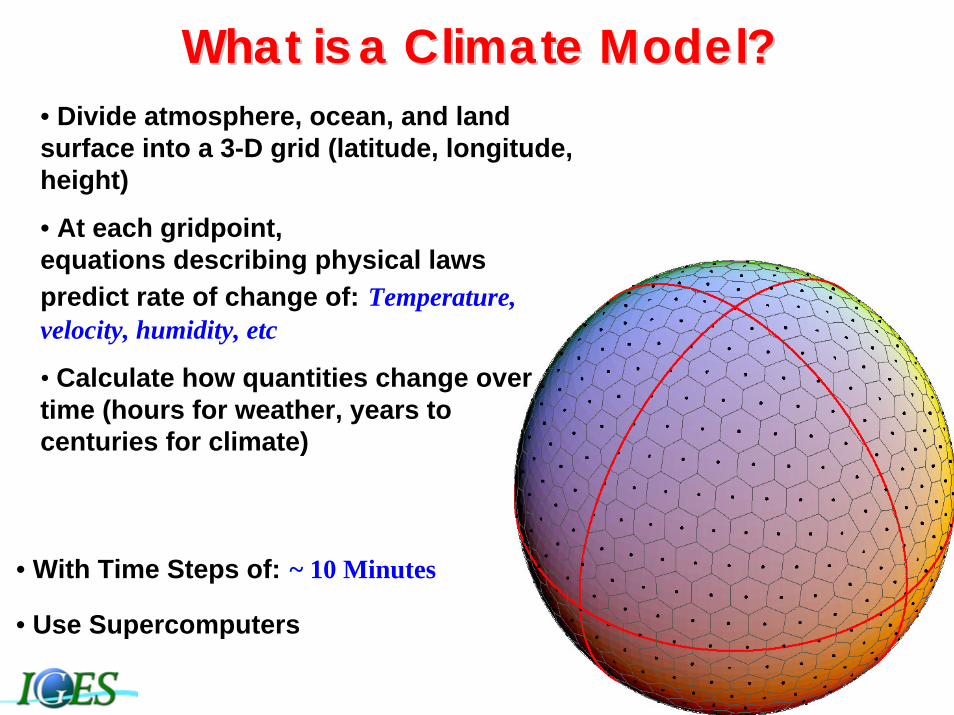
• Divide atmosphere, ocean, and land surface into a 3-D grid (latitude, longitude, height)
• At each gridpoint, equations describing physical laws predict rate of change of: Temperature, velocity, humidity, etc
• Calculate how quantities change over time (hours for weather, years to centuries for climate)
• With Time Steps of: ~ 10 Minutes
• Use Supercomputers
What is a Climate Model?What is a Climate Model?
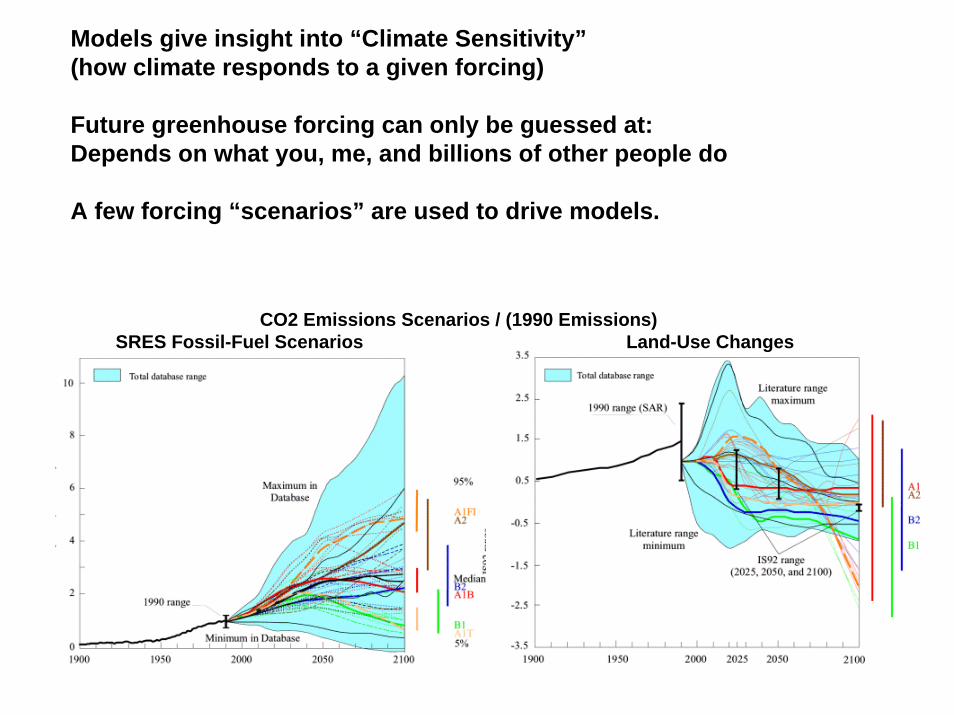
CO2 Emissions Scenarios / (1990 Emissions)SRES Fossil-Fuel Scenarios Land-Use Changes
Models give insight into “Climate Sensitivity”(how climate responds to a given forcing)
Future greenhouse forcing can only be guessed at:Depends on what you, me, and billions of other people do
A few forcing “scenarios” are used to drive models.
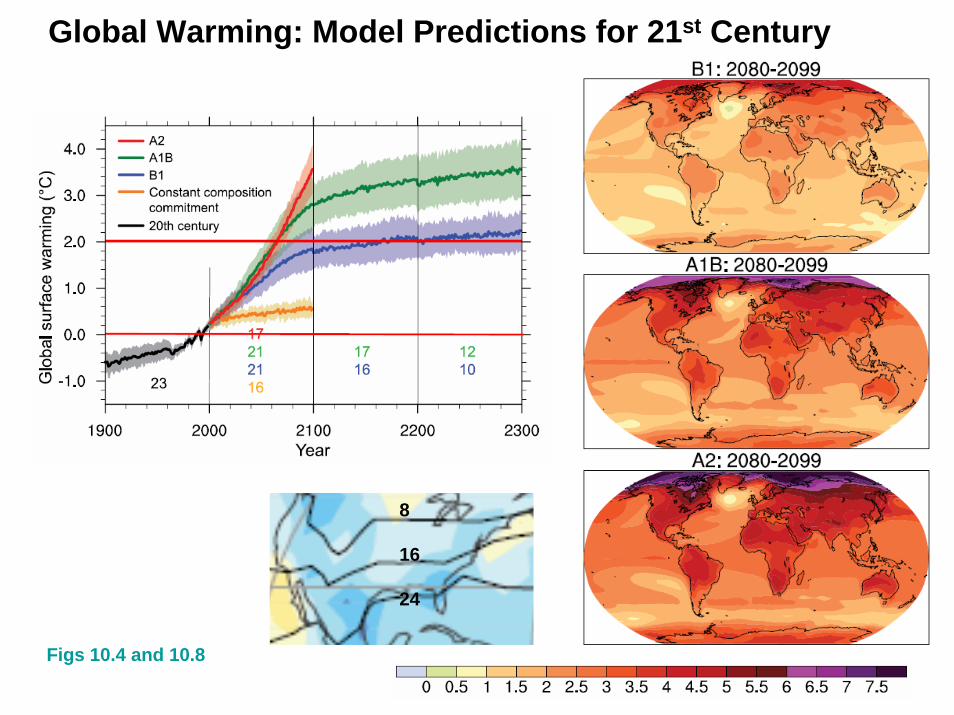
Global Warming: Model Predictions for 21st Century
Figs 10.4 and 10.8
8
16
24
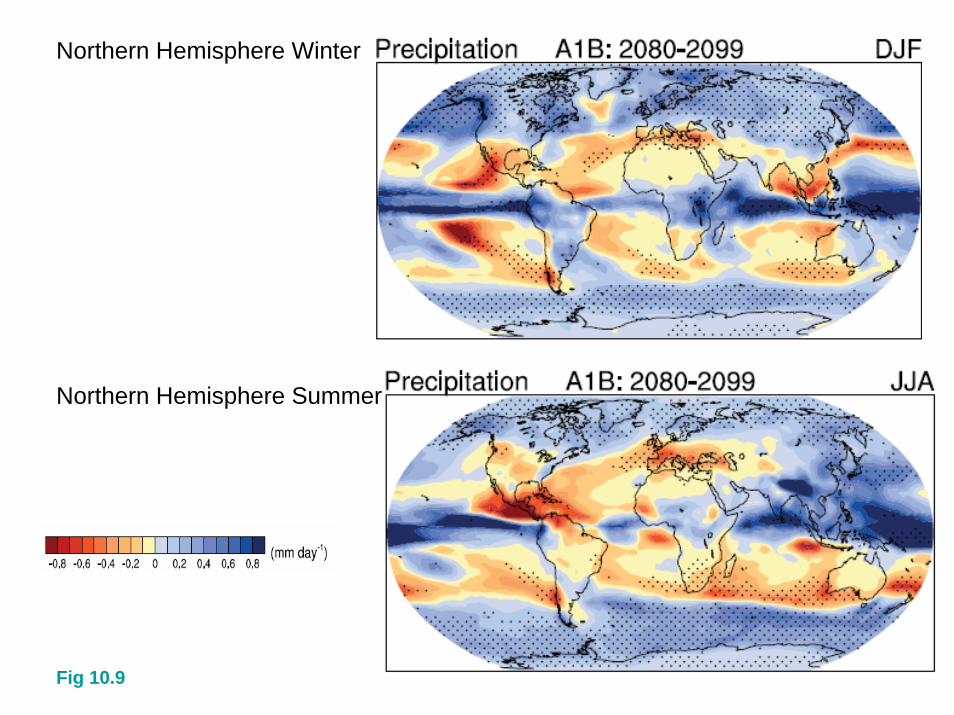
Fig 10.9
Northern Hemisphere Winter
Northern Hemisphere Summer
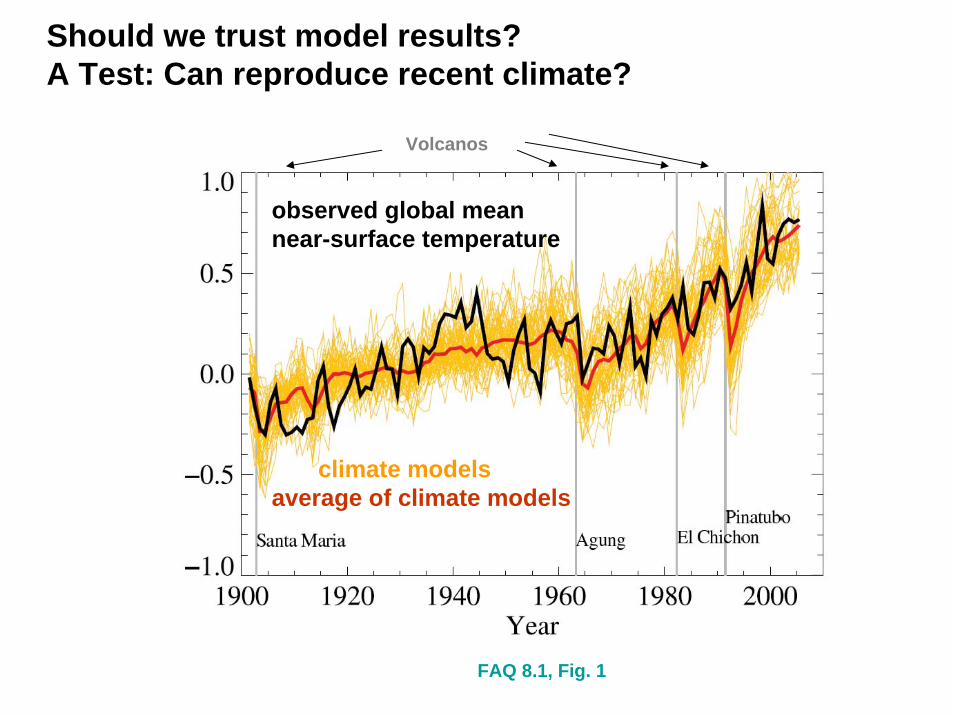
Should we trust model results?A Test: Can reproduce recent climate?
Volcanos
observed global mean near-surface temperature
climate modelsaverage of climate models
FAQ 8.1, Fig. 1
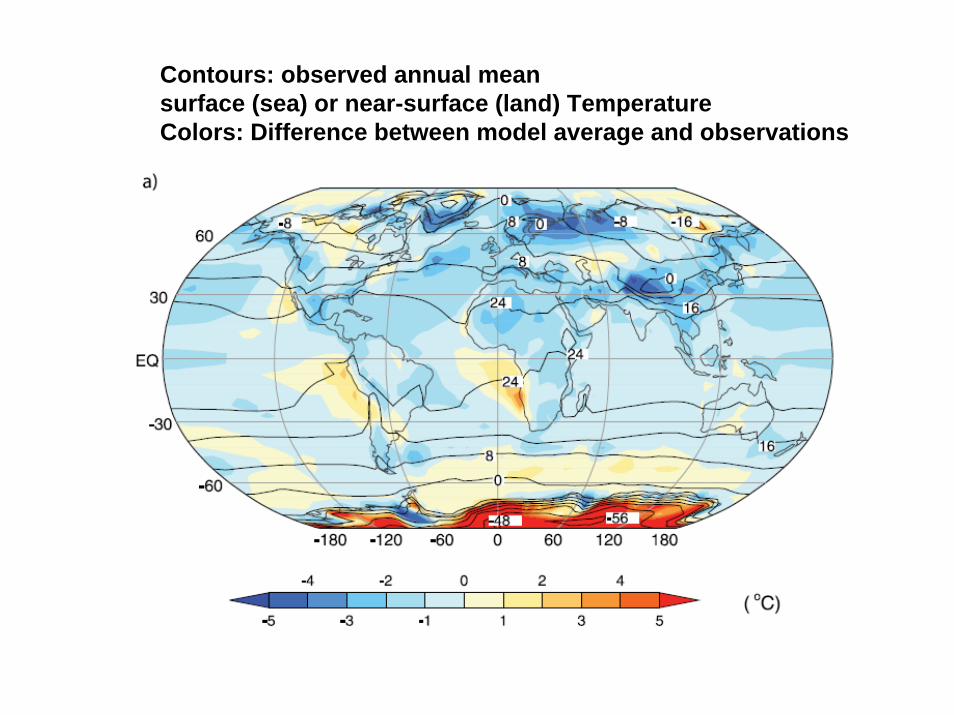
Contours: observed annual mean surface (sea) or near-surface (land) TemperatureColors: Difference between model average and observations
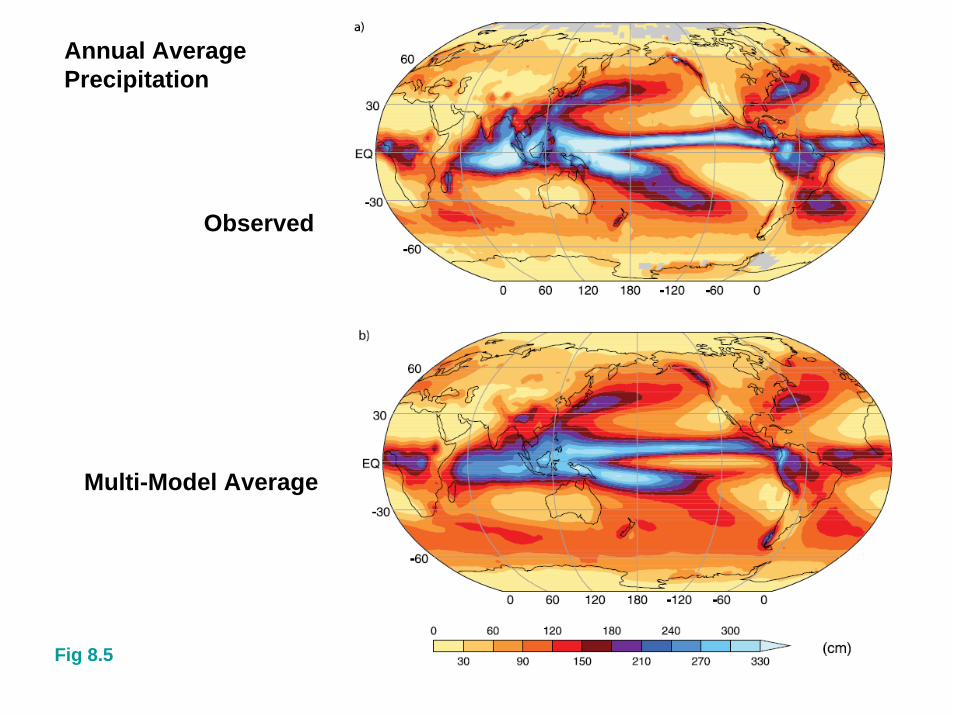
Fig 8.5
Annual AveragePrecipitation
Observed
Multi-Model Average
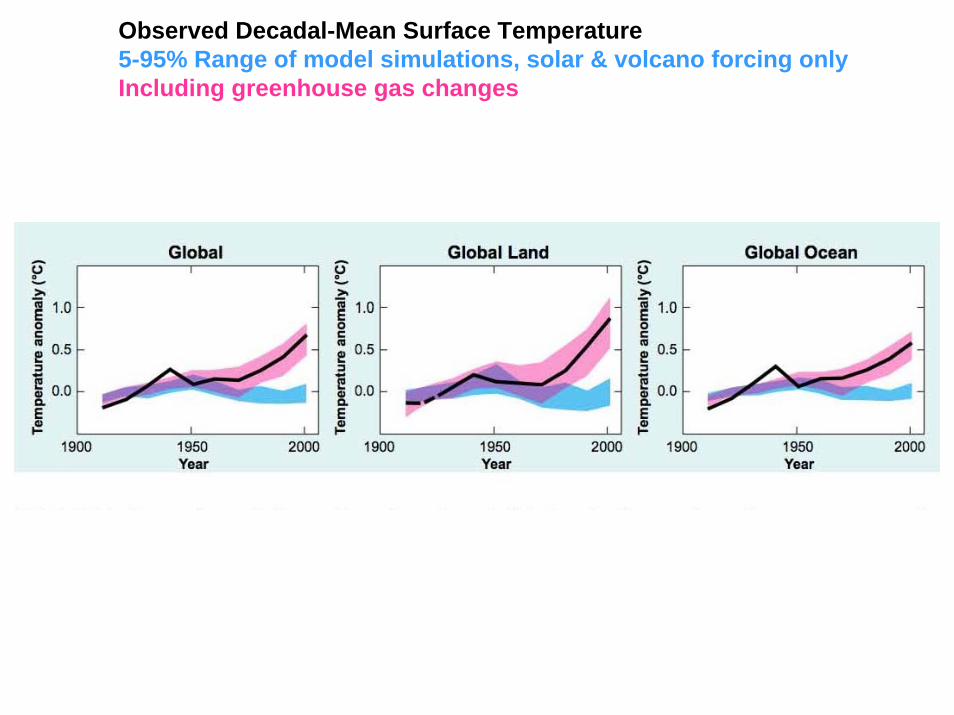
Observed Decadal-Mean Surface Temperature5-95% Range of model simulations, solar & volcano forcing onlyIncluding greenhouse gas changes
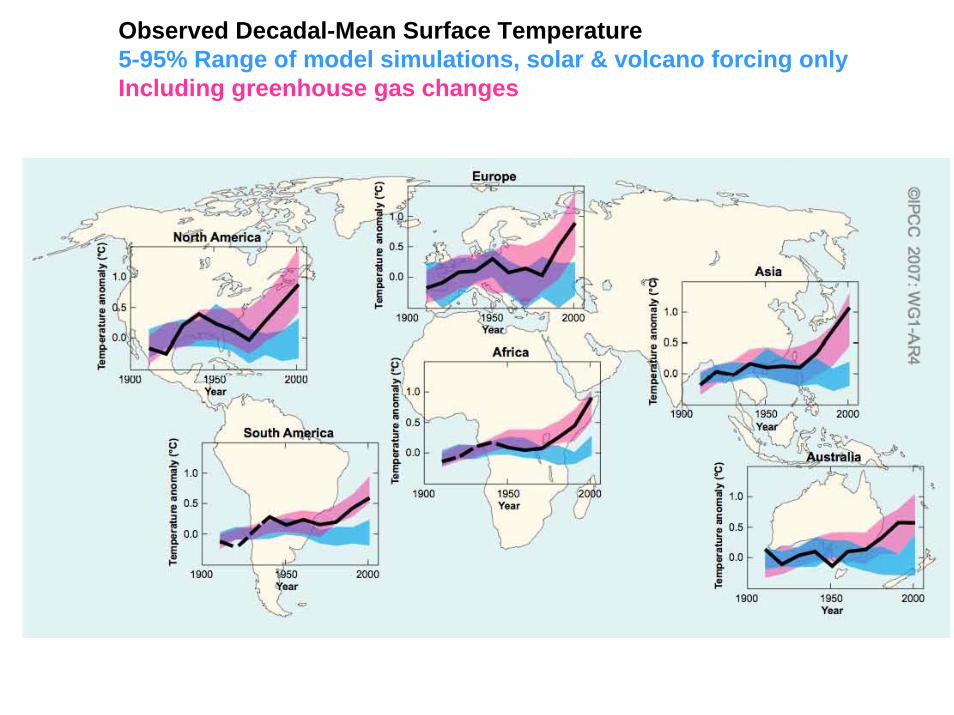
Observed Decadal-Mean Surface Temperature5-95% Range of model simulations, solar & volcano forcing onlyIncluding greenhouse gas changes
Surf
ace
tem
pera
ture
cha
nge
(oC
)
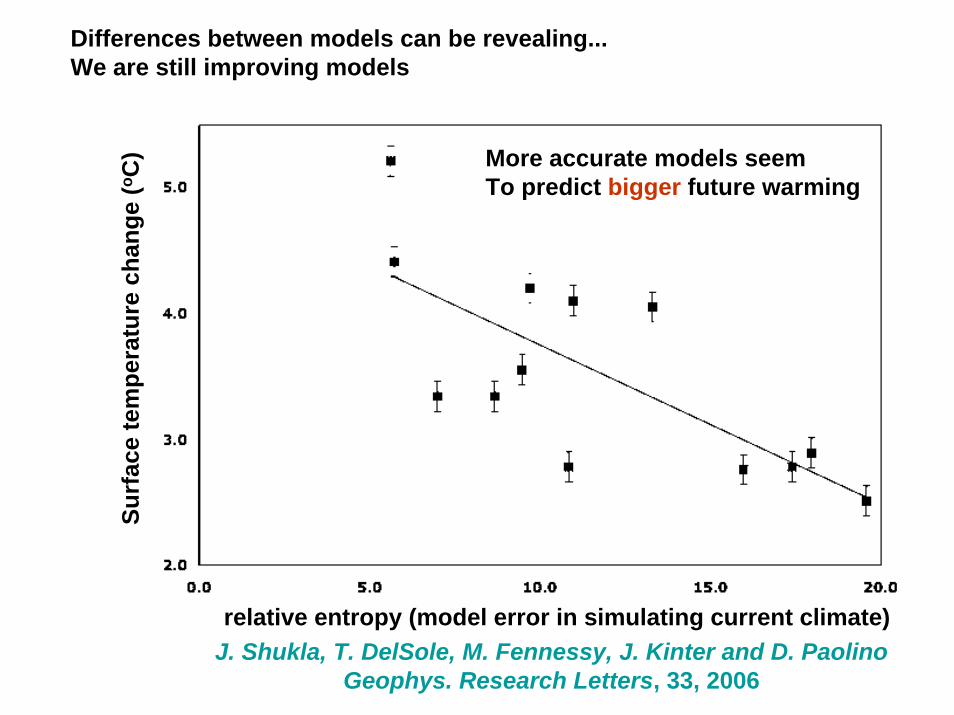
relative entropy (model error in simulating current climate)J. Shukla, T. DelSole, M. Fennessy, J. Kinter and D. Paolino
Geophys. Research Letters, 33, 2006
Differences between models can be revealing...We are still improving models
More accurate models seemTo predict bigger future warming
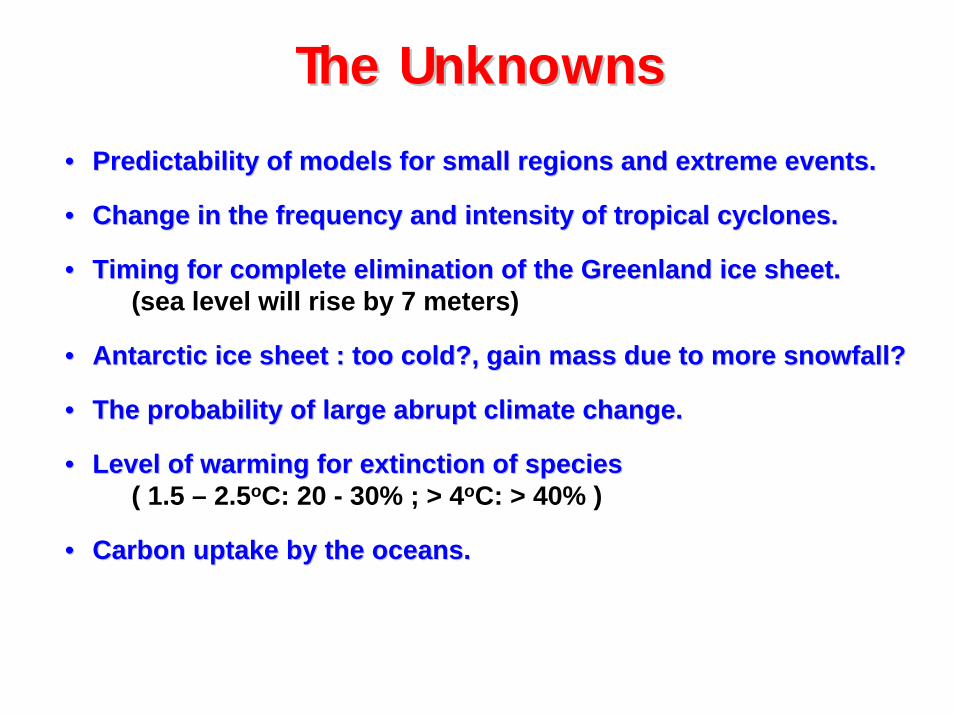
The UnknownsThe Unknowns•• Predictability of models for small regions and extreme events.Predictability of models for small regions and extreme events.
•• Change in the frequency and intensity of tropical cyclones.Change in the frequency and intensity of tropical cyclones.
•• Timing for complete elimination of the Greenland ice sheet.Timing for complete elimination of the Greenland ice sheet.(sea level will rise by 7 meters)
•• Antarctic ice sheet : too cold?, gain mass due to more snowfall?Antarctic ice sheet : too cold?, gain mass due to more snowfall?
•• The probability of large abrupt climate change.The probability of large abrupt climate change.
•• Level of warming for extinction of species Level of warming for extinction of species ( 1.5 – 2.5oC: 20 - 30% ; > 4oC: > 40% )
•• Carbon uptake by the oceans.Carbon uptake by the oceans.
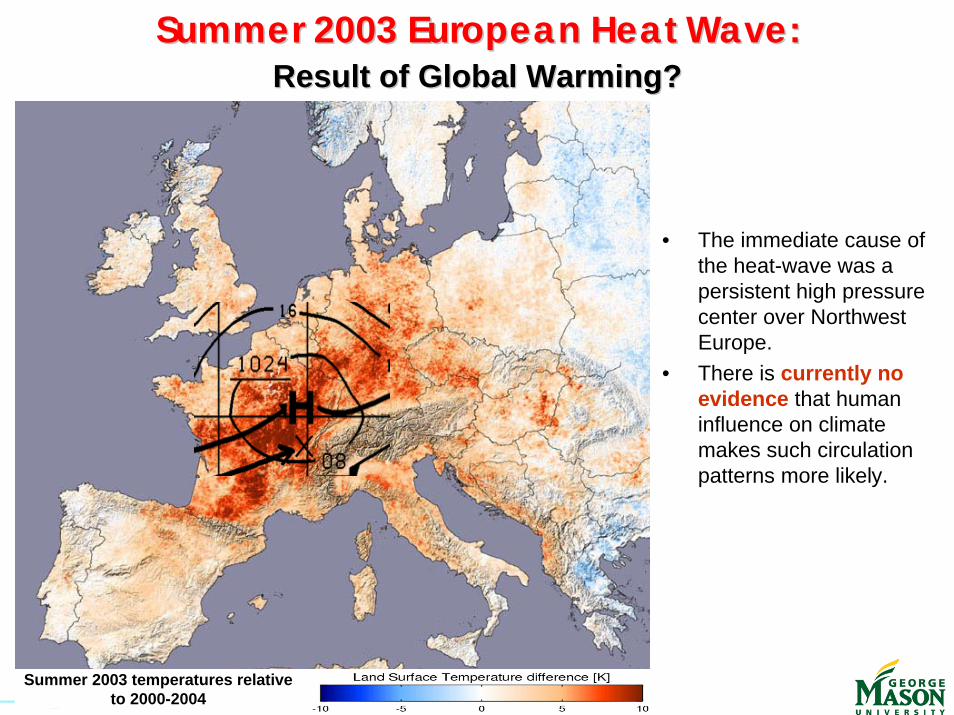
Summer 2003 European Heat Wave: Summer 2003 European Heat Wave: Result of Global Warming?Result of Global Warming?
• The immediate cause of the heat-wave was a persistent high pressure center over Northwest Europe.
• There is currently no evidence that human influence on climate makes such circulation patterns more likely.
Summer 2003 temperatures relative to 2000-2004
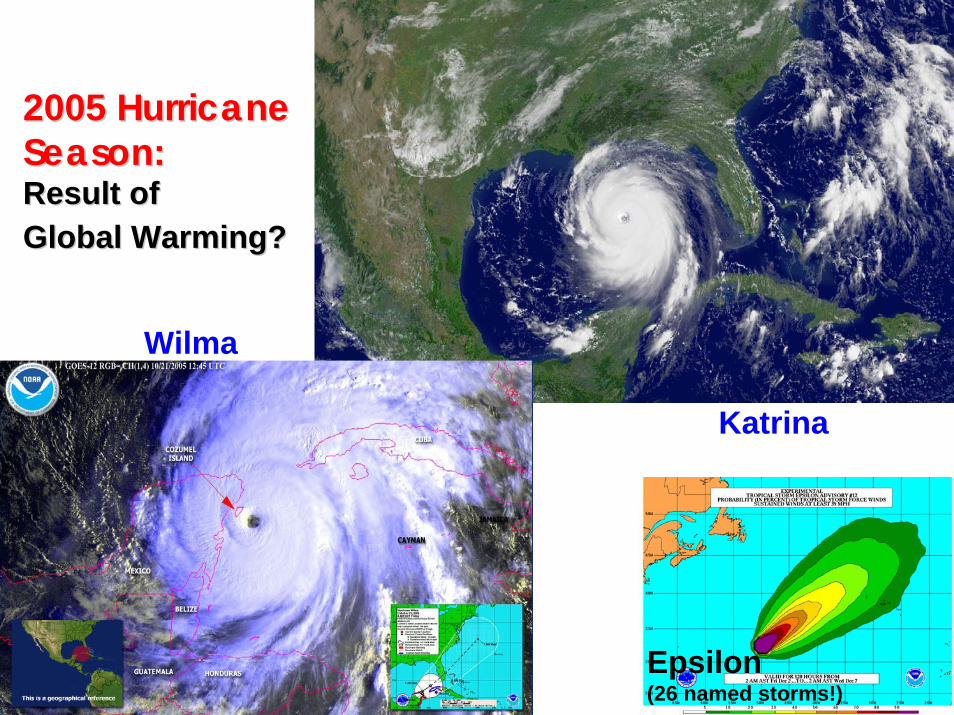
Wilma
2005 Hurricane 2005 Hurricane Season:Season:Result of Result of Global Warming?Global Warming?
Katrina
Epsilon (26 named storms!)
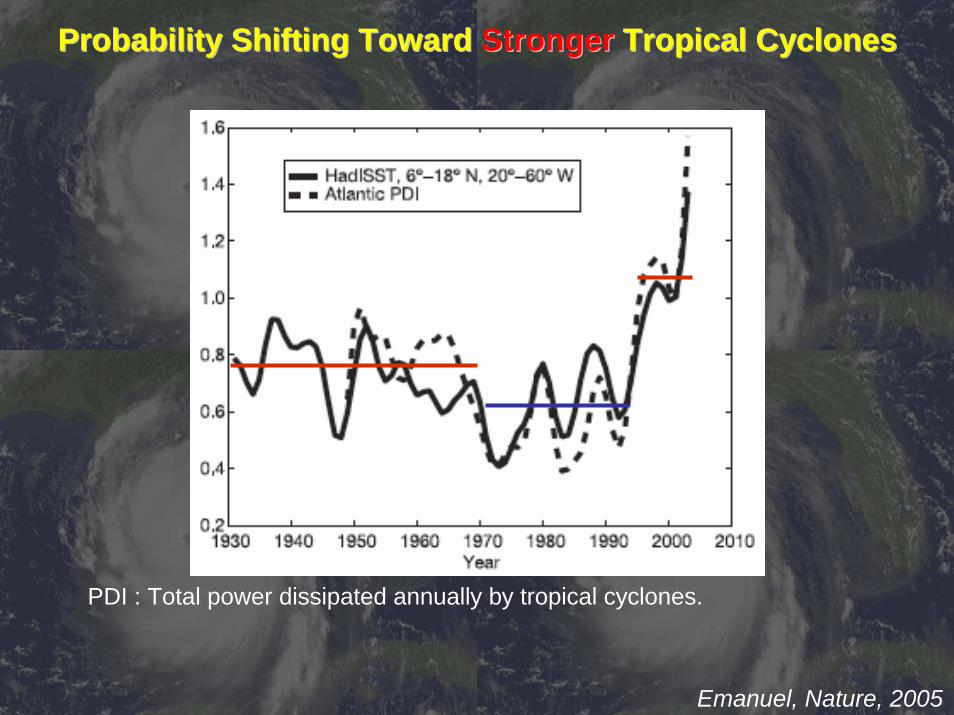
Emanuel, Nature, 2005
Probability Shifting Toward Probability Shifting Toward Stronger Stronger Tropical CyclonesTropical Cyclones
PDI : Total power dissipated annually by tropical cyclones.
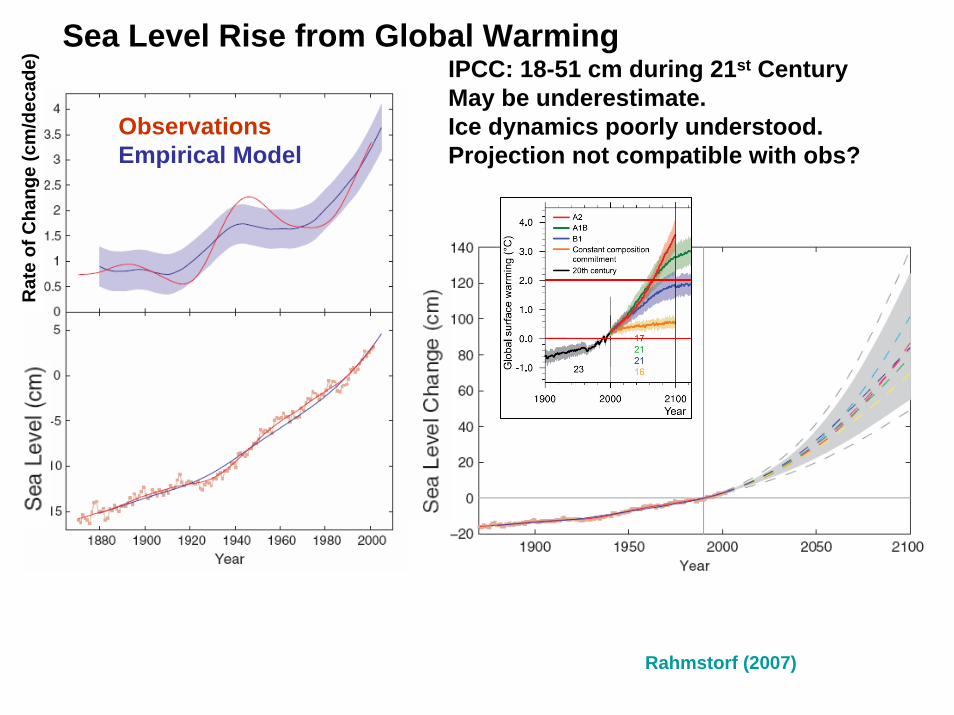
Rahmstorf (2007)
Sea Level Rise from Global WarmingIPCC: 18-51 cm during 21st CenturyMay be underestimate.Ice dynamics poorly understood.Projection not compatible with obs?
Rat
e of
Cha
nge
(cm
/dec
ade)
ObservationsEmpirical Model
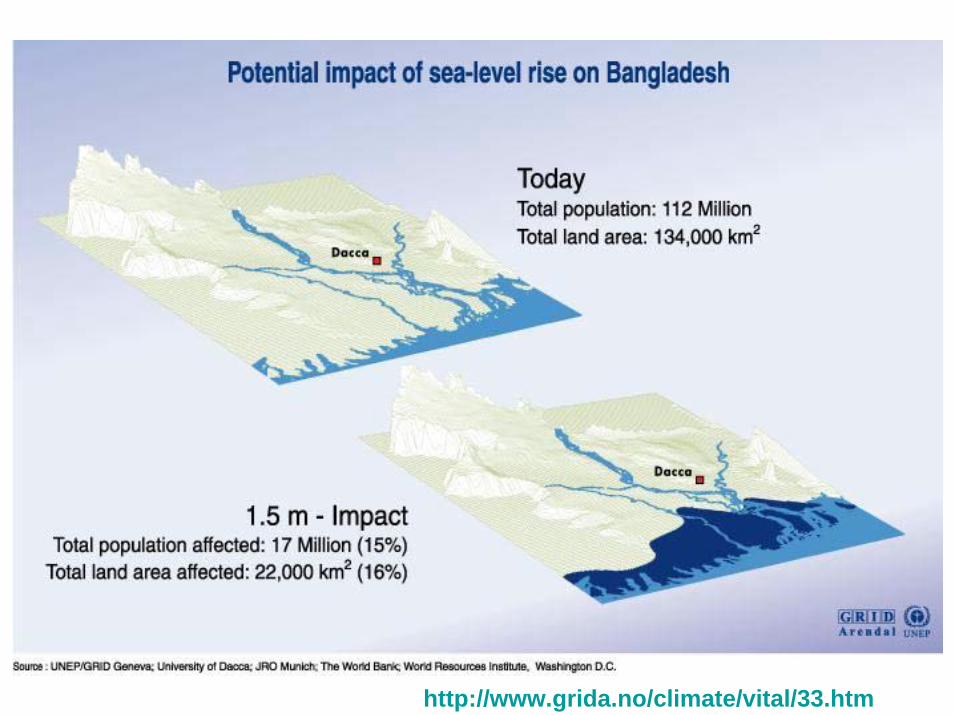
http://www.grida.no/climate/vital/33.htm
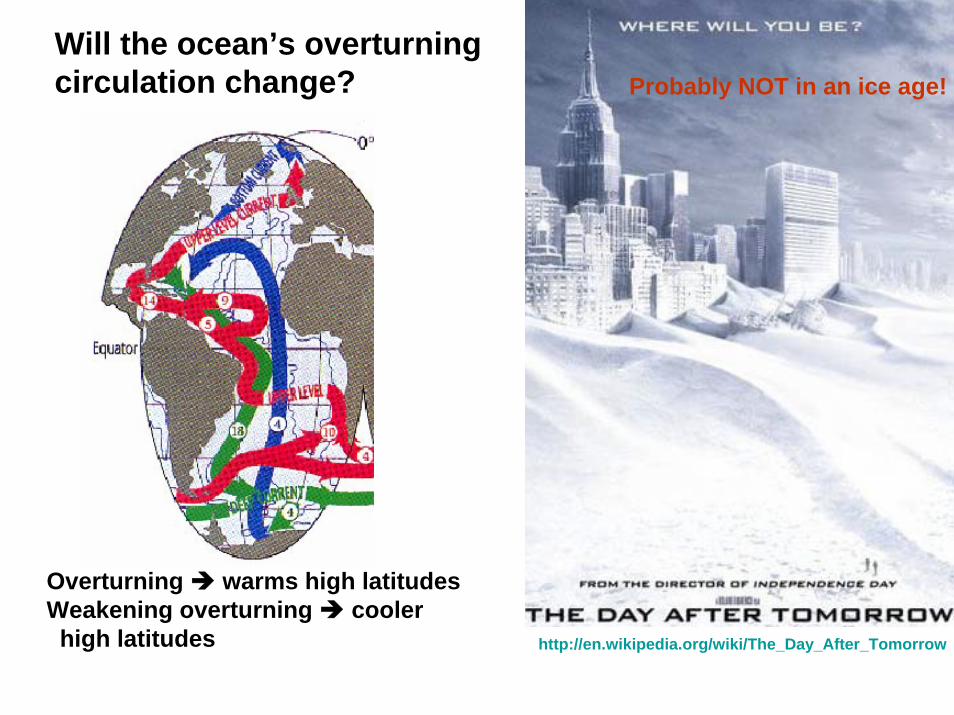
http://en.wikipedia.org/wiki/The_Day_After_Tomorrow
Will the ocean’s overturningcirculation change?
Overturning warms high latitudesWeakening overturning cooler high latitudes
Probably NOT in an ice age!
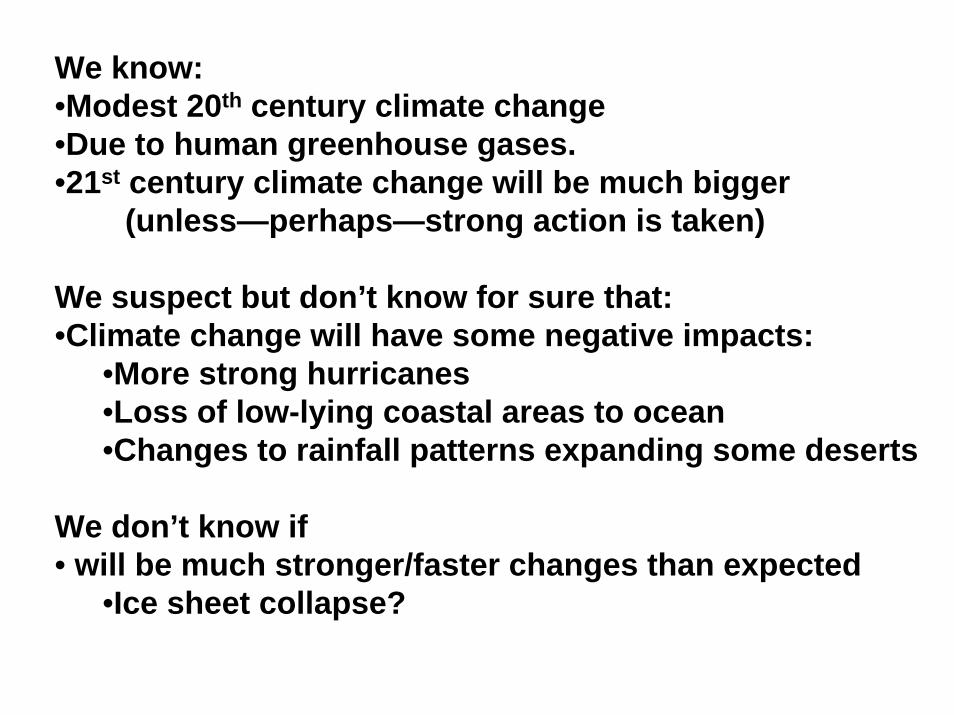
We know:•Modest 20th century climate change •Due to human greenhouse gases.•21st century climate change will be much bigger
(unless—perhaps—strong action is taken)
We suspect but don’t know for sure that:•Climate change will have some negative impacts:
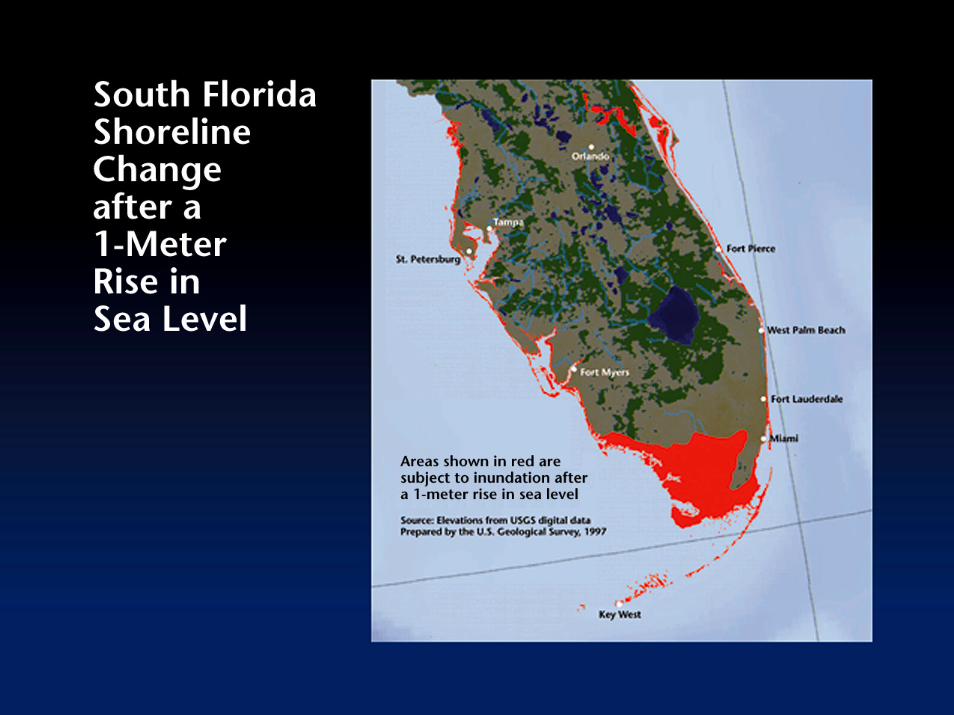
•More strong hurricanes•Loss of low-lying coastal areas to ocean•Changes to rainfall patterns expanding some deserts
We don’t know if• will be much stronger/faster changes than expected
•Ice sheet collapse?
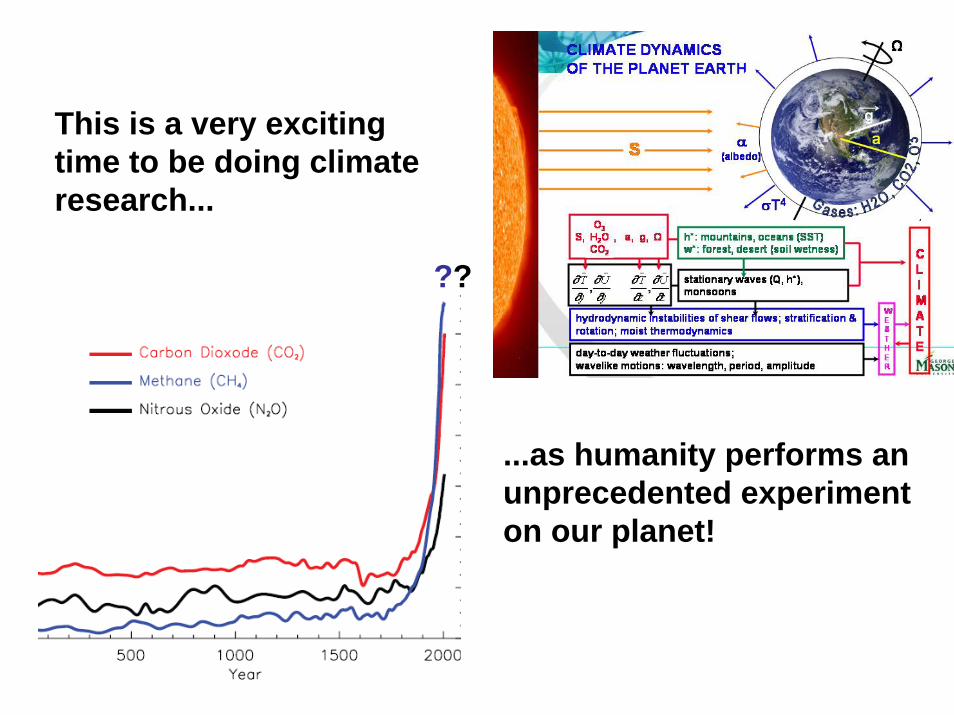
This is a very excitingtime to be doing climateresearch...
??
...as humanity performs anunprecedented experimenton our planet!


![[Magic, Class, Alienist] Gohm'Jha ['the Way of the Unknowable Other,' Enunciator Magic]](https://img.pdfslide.us/doc/110x75/577cc4851a28aba7119995e6/magic-class-alienist-gohmjha-the-way-of-the-unknowable-other.jpg)