Embed Size (px)
Citation preview

GLOBAL BIOPHARMACEUTICAL EXCIPIENTS MARKET ANALYSIS, 2020 – 2028
GLOBAL BIOPHARMACEUTICAL EXCIPIENTS MARKET, 2020 – 2028
PAGE NO. | 2 COPYRIGHT © 2021 ZION MARKET RESEARCH
About Us
Zion Market Research (ZMR) is a market intelligence company providing global business
information reports and services. Our exclusive blend of quantitative forecasting and trends
analysis provides forward-looking insight for thousands of decision makers. ZMR’s
experienced team of Analysts, Researchers, and Consultants uses proprietary data source
and various tools and techniques to gather and analyze information. Our business offerings
represent the latest and the most reliable information indispensable for businesses to
sustain a competitive edge.
Each ZMR research report covers a different sector — such as pharmaceuticals, chemical,
energy, food and beverages, semiconductors, medical devices, consumer goods, and
technology. These reports provide in-depth analysis and deep segmentation to possible
micro levels. With wider scope and stratified research methodology, our syndicated reports
strive to serve the overall research requirement of clients.
Copyright © 2021 Zion Market Research
All Rights Reserved. This document contains highly confidential information and is the sole property of ZMR. No part of it may be
circulated, copied, quoted, or otherwise reproduced without the approval of ZMR
GLOBAL BIOPHARMACEUTICAL EXCIPIENTS MARKET, 2020 – 2028
PAGE NO. | 3 COPYRIGHT © 2021 ZION MARKET RESEARCH
Table of Content
CHAPTER NO. 1 : INTRODUCTION ............................................................................. 14
1.1. Report Description ........................................................................................................ 14
1.1.1. Purpose of the Report ........................................................................................ 14
1.1.2. USP & Key Offerings ........................................................................................... 14
1.2. Key Benefits for Stakeholders ........................................................................................ 14
1.3. Target Audience ............................................................................................................ 15
1.4. Report Scope ................................................................................................................. 15
CHAPTER NO. 2 : EXECUTIVE SUMMARY .................................................................. 17
2.1. Key Findings................................................................................................................... 17
2.1.1. Top Investment Pockets ..................................................................................... 17
2.1.1.1. Market Attractiveness Analysis, By Product ................................................. 17
2.1.1.2. Market Attractiveness Analysis, By Region ................................................... 17
2.2. Market Snapshot ........................................................................................................... 18
2.3. Global Biopharmaceutical Excipients Market, 2016 – 2028 (USD Million) (K Tons)........ 19
2.4. Insights from Primary Respondents ............................................................................... 20
CHAPTER NO. 3 : COVID 19 IMPACT ANALYSIS ......................................................... 21
3.1. Impact Assessment of COVID-19 Pandemic, By Region ................................................. 21
3.1.1. North America ................................................................................................... 21
3.1.2. Europe ............................................................................................................... 21
3.1.3. Asia Pacific ......................................................................................................... 21
3.1.4. Latin America ..................................................................................................... 21
3.1.5. The Middle-East and Africa ................................................................................ 21
3.2. Quarterly Market Revenue & Volume and Forecast by Region 2020 & 2021 ................. 22
3.3. Pre COVID-19 Market Revenue & Volume, By Region, 2016-2019 (USD Million) ........... 24
3.4. Post COVID-19 Market Revenue & Volume, By Region, 2020-2028 (USD Million) ......... 24
3.5. Pre COVID-19 Market Volume, By Region, 2016-2019 (K Tons) ..................................... 25
3.6. Post COVID-19 Market Volume, By Region, 2020-2028 (K Tons) .................................... 25
3.7. Key Strategies Undertaken by Companies to Tackle COVID-19 ...................................... 26
3.8. Short Term Dynamics .................................................................................................... 27
3.9. Long Term Dynamics...................................................................................................... 27
GLOBAL BIOPHARMACEUTICAL EXCIPIENTS MARKET, 2020 – 2028
PAGE NO. | 4 COPYRIGHT © 2021 ZION MARKET RESEARCH
CHAPTER NO. 4 : BIOPHARMACEUTICAL EXCIPIENTS MARKET – PRODUCT SEGMENT ANALYSIS ...................................................................................... 28
4.1. Overview ....................................................................................................................... 28
4.1.1. Market Revenue Share, By Product, 2020 & 2028 .............................................. 28
4.1.2. Market Volume Share, By Product, 2020 & 2028 ................................................ 29
4.2. Specialty Excipients ....................................................................................................... 30
4.2.1. Market Size and Forecast, By Region (USD Million) (K Tons) ............................... 30
4.3. Solubilizers & Surfactants/Emulsifiers ........................................................................... 31
4.3.1. Market Size and Forecast, By Region (USD Million) (K Tons) ............................... 31
4.4. Polyols ........................................................................................................................... 32
4.4.1. Market Size and Forecast, By Region (USD Million) (K Tons) ............................... 32
4.5. Carbohydrates ............................................................................................................... 33
4.5.1. Market Size and Forecast, By Region (USD Million) (K Tons) ............................... 33
CHAPTER NO. 5 : BIOPHARMACEUTICAL EXCIPIENTS MARKET – SOLUBILIZERS & SURFACTANTS/EMULSIFIERS SEGMENT ANALYSIS ....................... 34
5.1. Overview ....................................................................................................................... 34
5.1.1. Market Revenue Share, By Solubilizers & Surfactants/Emulsifiers, 2020 & 2028 ............................................................................................................... 34
5.1.2. Market Volume Share, By Solubilizers & Surfactants/Emulsifiers, 2020 & 2028 ............................................................................................................... 35
5.2. Triglycerides .................................................................................................................. 36
5.2.1. Market Size and Forecast, By Region (USD Million) (K Tons) ............................... 36
5.3. Esters ............................................................................................................................. 37
5.3.1. Market Size and Forecast, By Region (USD Million) (K Tons) ............................... 37
5.4. Others ............................................................................................................................ 38
5.4.1. Market Size and Forecast, By Region (USD Million) (K Tons) ............................... 38
CHAPTER NO. 6 : BIOPHARMACEUTICAL EXCIPIENTS MARKET – POLYOLS SEGMENT ANALYSIS ...................................................................................... 39
6.1. Overview ....................................................................................................................... 39
6.1.1. Market Revenue Share, By Polyols, 2020 & 2028 ............................................... 39
6.1.2. Market Volume Share, By Polyols, 2020 & 2028 ................................................. 40
6.2. Mannitol ........................................................................................................................ 41
6.2.1. Market Size and Forecast, By Region (USD Million) (K Tons) ............................... 41
6.3. Sorbitol .......................................................................................................................... 42
6.3.1. Market Size and Forecast, By Region (USD Million) (K Tons) ............................... 42
GLOBAL BIOPHARMACEUTICAL EXCIPIENTS MARKET, 2020 – 2028
PAGE NO. | 5 COPYRIGHT © 2021 ZION MARKET RESEARCH
6.4. Others ............................................................................................................................ 43
6.4.1. Market Size and Forecast, By Region (USD Million) (K Tons) ............................... 43
CHAPTER NO. 7 : BIOPHARMACEUTICAL EXCIPIENTS MARKET – CARBOHYDRATES SEGMENT ANALYSIS ...................................................................... 44
7.1. Overview ....................................................................................................................... 44
7.1.1. Market Revenue Share, By Carbohydrates, 2020 & 2028 .................................... 44
7.1.2. Market Volume Share, By Carbohydrates, 2020 & 2028 ..................................... 45
7.2. Sucrose .......................................................................................................................... 46
7.2.1. Market Size and Forecast, By Region (USD Million) (K Tons) ............................... 46
7.3. Dextrose ........................................................................................................................ 47
7.3.1. Market Size and Forecast, By Region (USD Million) (K Tons) ............................... 47
7.4. Starch ............................................................................................................................ 48
7.4.1. Market Size and Forecast, By Region (USD Million) (K Tons) ............................... 48
7.5. Others ............................................................................................................................ 49
7.5.1. Market Size and Forecast, By Region (USD Million) (K Tons) ............................... 49
CHAPTER NO. 8 : BIOPHARMACEUTICAL EXCIPIENTS MARKET – REGIONAL ANALYSIS ...................................................................................................... 50
8.1. Overview ....................................................................................................................... 50
8.1.1. Global Market Revenue Share, By Region, 2020 & 2028 ..................................... 50
8.1.2. Global Market Volume Share, By Region, 2020 & 2028 ...................................... 51
8.1.3. Global Market Revenue & Volume, By Region, 2016 – 2028 (USD Million) (K Tons) ............................................................................................................. 52
8.2. North America ............................................................................................................... 52
8.2.1. North America Market Revenue & Volume, By Country, 2016 – 2028 (USD Million) (K Tons)................................................................................................. 53
8.2.2. North America Market Revenue & Volume, By Product, 2016 – 2028................. 53
8.2.3. North America Market Revenue & Volume, By Solubilizers & Surfactants/Emulsifiers, 2016 – 2028 ................................................................. 53
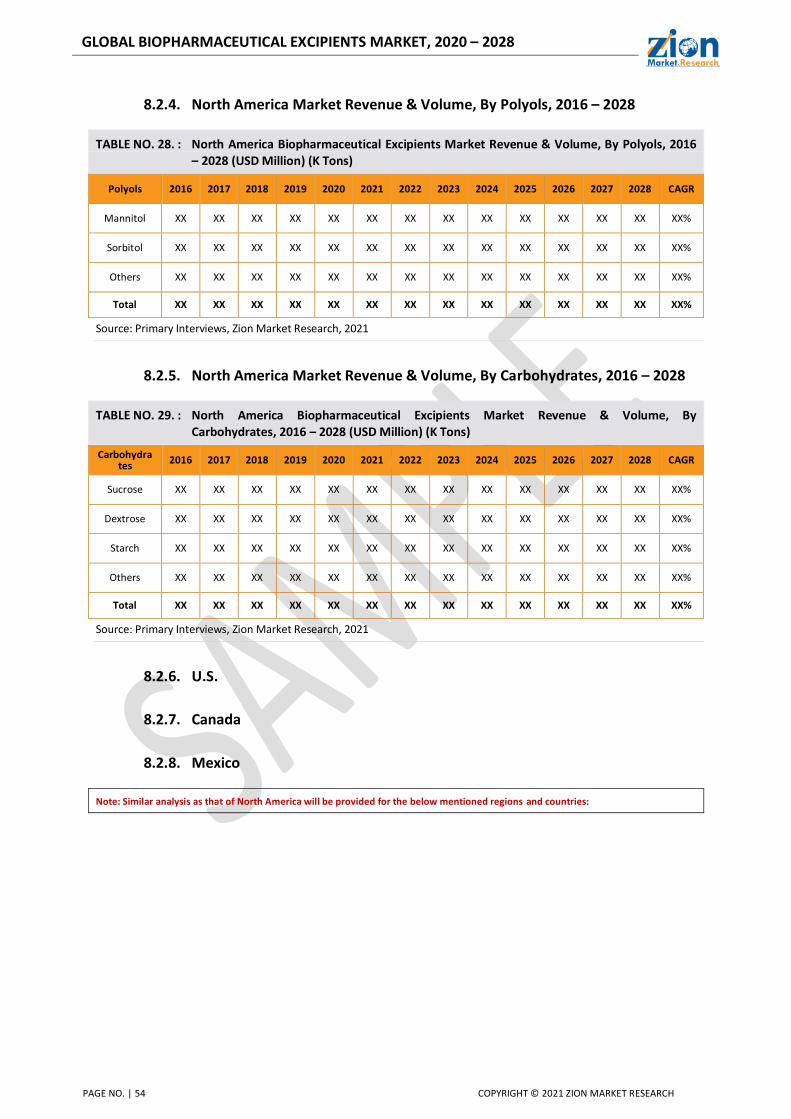
8.2.4. North America Market Revenue & Volume, By Polyols, 2016 – 2028 .................. 54
8.2.5. North America Market Revenue & Volume, By Carbohydrates, 2016 – 2028 ............................................................................................................... 54
8.2.6. U.S. ............................................................................................................... 54
8.2.7. Canada .............................................................................................................. 54
8.2.8. Mexico............................................................................................................... 54
8.3. Europe ........................................................................................................................... 55
GLOBAL BIOPHARMACEUTICAL EXCIPIENTS MARKET, 2020 – 2028
PAGE NO. | 6 COPYRIGHT © 2021 ZION MARKET RESEARCH
8.3.1. Europe Market Revenue & Volume, By Country, 2016 – 2028 (USD Million) (K Tons) ............................................................................................................. 55
8.3.2. Europe Market Revenue & Volume, By Product, 2016 – 2028 ............................ 55
8.3.3. Europe Market Revenue & Volume, By Solubilizers & Surfactants/Emulsifiers, 2016 – 2028 ................................................................. 55
8.3.4. Europe Market Revenue & Volume, By Polyols, 2016 – 2028 ............................. 55
8.3.5. Europe Market Revenue & Volume, By Carbohydrates, 2016 – 2028 .................. 55
8.3.6. Germany ............................................................................................................ 55
8.3.7. France ............................................................................................................... 55
8.3.8. U.K. ............................................................................................................... 55
8.3.9. Italy ............................................................................................................... 55
8.3.10. Spain ............................................................................................................... 55
8.3.11. Rest of Europe ................................................................................................... 55
8.4. Asia Pacific ..................................................................................................................... 56
8.4.1. Asia Pacific Market Revenue & Volume, By Country, 2016 – 2028 (USD Million) (K Tons)................................................................................................. 56
8.4.2. Asia Pacific Market Revenue & Volume, By Product, 2016 – 2028 ...................... 56
8.4.3. Asia Pacific Market Revenue & Volume, By Solubilizers & Surfactants/Emulsifiers, 2016 – 2028 ................................................................. 56
8.4.4. Asia Pacific Market Revenue & Volume, By Polyols, 2016 – 2028 ....................... 56
8.4.5. Asia Pacific Market Revenue & Volume, By Carbohydrates, 2016 – 2028............ 56
8.4.6. China ............................................................................................................... 56
8.4.7. Japan ............................................................................................................... 56
8.4.8. India ............................................................................................................... 56
8.4.9. South Korea ....................................................................................................... 56
8.4.10. South-East Asia .................................................................................................. 56
8.4.11. Rest of Asia Pacific ............................................................................................. 56
8.5. Latin America................................................................................................................. 57
8.5.1. Latin America Market Revenue & Volume, By Country, 2016 – 2028 (USD Million) (K Tons)................................................................................................. 57
8.5.2. Latin America Market Revenue & Volume, By Product, 2016 – 2028 .................. 57
8.5.3. Latin America Market Revenue & Volume, By Solubilizers & Surfactants/Emulsifiers, 2016 – 2028 ................................................................. 57
8.5.4. Latin America Market Revenue & Volume, By Polyols, 2016 – 2028 ................... 57
8.5.5. Latin America Market Revenue & Volume, By Carbohydrates, 2016 – 2028 ....... 57
8.5.6. Brazil ............................................................................................................... 57
8.5.7. Argentina ........................................................................................................... 57
8.5.8. Rest of Latin America ......................................................................................... 57
GLOBAL BIOPHARMACEUTICAL EXCIPIENTS MARKET, 2020 – 2028
PAGE NO. | 7 COPYRIGHT © 2021 ZION MARKET RESEARCH
8.6. The Middle-East and Africa ............................................................................................ 58
8.6.1. The Middle-East and Africa Market Revenue & Volume, By Country, 2016 – 2028 (USD Million) (K Tons)............................................................................. 58
8.6.2. The Middle-East and Africa Market Revenue & Volume, By Product, 2016 – 2028 ............................................................................................................... 58
8.6.3. The Middle-East and Africa Market Revenue & Volume, By Solubilizers & Surfactants/Emulsifiers, 2016 – 2028 ................................................................. 58
8.6.4. The Middle-East and Africa Market Revenue & Volume, By Polyols, 2016 – 2028 ............................................................................................................... 58
8.6.5. The Middle-East and Africa Market Revenue & Volume, By Carbohydrates, 2016 – 2028 ....................................................................................................... 58
8.6.6. GCC Countries .................................................................................................... 58
8.6.7. South Africa ....................................................................................................... 58
8.6.8. Rest of Middle-East Africa .................................................................................. 58
CHAPTER NO. 9 : BIOPHARMACEUTICAL EXCIPIENTS MARKET – INDUSTRY ANALYSIS ...................................................................................................... 59
9.1. Introduction................................................................................................................... 59
9.2. Market Drivers............................................................................................................... 59
9.2.1. Driving Factor 1 Analysis .................................................................................... 59
9.2.2. Driving Factor 2 Analysis .................................................................................... 60
9.3. Market Restraints .......................................................................................................... 60
9.3.1. Restraining Factor Analysis ................................................................................ 60
9.4. Market Opportunities .................................................................................................... 61
9.4.1. Market Opportunity Analysis ............................................................................. 61
9.5. Porter’s Five Forces Analysis .......................................................................................... 61
9.6. PEST Analysis ................................................................................................................. 62
9.7. Regulatory Landscape .................................................................................................... 63
9.8. Technology Landscape ................................................................................................... 63
9.9. Regional Market Trends ................................................................................................ 63
9.9.1. North America ................................................................................................... 63
9.9.2. Europe ............................................................................................................... 63
9.9.3. Asia Pacific ......................................................................................................... 63
9.9.4. Latin America ..................................................................................................... 63
9.9.5. The Middle-East and Africa ................................................................................ 63
9.10. Value Chain Analysis ...................................................................................................... 64
CHAPTER NO. 10 : COMPETITIVE LANDSCAPE ............................................................ 65
GLOBAL BIOPHARMACEUTICAL EXCIPIENTS MARKET, 2020 – 2028
PAGE NO. | 8 COPYRIGHT © 2021 ZION MARKET RESEARCH
10.1. Company Market Share Analysis – 2020 ........................................................................ 65
10.1.1. Global Biopharmaceutical Excipients Market: Company Market Share, 2020 ............................................................................................................... 65
10.2. Strategic Developments................................................................................................. 66
10.2.1. Acquisitions & Mergers ...................................................................................... 66
10.2.2. New Product Launch .......................................................................................... 66
10.2.3. Regional Expansion ............................................................................................ 66
10.3. Company Strategic Developments – Heat Map Analysis ............................................... 66
CHAPTER NO. 11 : COMPANY PROFILES ..................................................................... 67
11.1. Merck KGaA ................................................................................................................... 67
11.1.1. Company Overview ............................................................................................ 67
11.1.2. Key Executives ................................................................................................... 67
11.1.3. Product Portfolio ............................................................................................... 67
11.1.4. Financial Overview ............................................................................................. 67
11.1.5. Operating Business Segments ............................................................................ 68
11.1.6. Business Performance........................................................................................ 68
11.1.7. Recent Developments ........................................................................................ 69
11.2. Signet Chemical Corporation Pvt. Ltd. ........................................................................... 69
11.3. Sigachi Industries Pvt. Ltd. ............................................................................................. 69
11.4. Spectrum Chemical Manufacturing Corp. ...................................................................... 69
11.5. Roquette Frères ............................................................................................................. 69
11.6. IMCD .............................................................................................................................. 69
11.7. Clariant .......................................................................................................................... 69
11.8. DFE Pharma ................................................................................................................... 69
11.9. BASF SE .......................................................................................................................... 69
11.10. Evonik Industries AG ...................................................................................................... 69
11.11. J. RETTENMAIER & SÖHNE GmbH + Co KG ..................................................................... 69
CHAPTER NO. 12 : MARKETING STRATEGY ANALYSIS................................................. 70
12.1. Marketing Channel ........................................................................................................ 70
12.2. Direct Marketing............................................................................................................ 70
12.3. Indirect Marketing ......................................................................................................... 70
12.4. Marketing Channel Development Trends ...................................................................... 71
CHAPTER NO. 13 : RESEARCH METHODOLOGY .......................................................... 72
13.1. Research Methodology .................................................................................................. 72
GLOBAL BIOPHARMACEUTICAL EXCIPIENTS MARKET, 2020 – 2028
PAGE NO. | 9 COPYRIGHT © 2021 ZION MARKET RESEARCH
13.2. Phase I - Secondary Research ........................................................................................ 73
13.3. Phase II - Data Modeling ................................................................................................ 73
13.3.1. Company Share Analysis Model ......................................................................... 74
13.3.2. Revenue Based Modeling ................................................................................... 74
13.4. Phase III - Primary Research .......................................................................................... 75
13.5. Research Limitations ..................................................................................................... 76
13.5.1. Assumptions ...................................................................................................... 76
GLOBAL BIOPHARMACEUTICAL EXCIPIENTS MARKET, 2020 – 2028
PAGE NO. | 10 COPYRIGHT © 2021 ZION MARKET RESEARCH
List of Figures
FIG NO. 1. Market Attractiveness Analysis, By Product ........................................................................ 17
FIG NO. 2. Market Attractiveness Analysis, By Region.......................................................................... 17
FIG NO. 3. Global Biopharmaceutical Excipients Market Revenue & Volume, 2016 – 2028 (USD
Million) (K Tons) ................................................................................................................. 19
FIG NO. 4. Impact of COVID-19 Pandemic in North America Countries ................................................. 21
FIG NO. 5. Market Revenue Share, By Product, 2020 & 2028 ............................................................... 28
FIG NO. 6. Market Volume Share, By Product, 2020 & 2028 ................................................................ 29
FIG NO. 7. Global Biopharmaceutical Excipients Market for Specialty Excipients, Revenue (USD
Million) Volume (K Tons) 2016 – 2028 ................................................................................ 30
FIG NO. 8. Global Biopharmaceutical Excipients Market for Solubilizers & Surfactants/Emulsifiers,
Revenue (USD Million) Volume (K Tons) 2016 – 2028.......................................................... 31
FIG NO. 9. Global Biopharmaceutical Excipients Market for Polyols, Revenue (USD Million) Volume
(K Tons) 2016 – 2028 .......................................................................................................... 32
FIG NO. 10. Global Biopharmaceutical Excipients Market for Carbohydrates, Revenue (USD Million)
Volume (K Tons) 2016 – 2028 ............................................................................................. 33
FIG NO. 11. Market Revenue Share, By Solubilizers & Surfactants/Emulsifiers, 2020 & 2028 .................. 34
FIG NO. 12. Market Volume Share, By Solubilizers & Surfactants/Emulsifiers, 2020 & 2028 ................... 35
FIG NO. 13. Global Biopharmaceutical Excipients Market for Triglycerides, Revenue (USD Million)
Volume (K Tons) 2016 – 2028 ............................................................................................. 36
FIG NO. 14. Global Biopharmaceutical Excipients Market for Esters, Revenue (USD Million) Volume (K
Tons) 2016 – 2028 .............................................................................................................. 37
FIG NO. 15. Global Biopharmaceutical Excipients Market for Others, Revenue (USD Million) Volume (K
Tons) 2016 – 2028 .............................................................................................................. 38
FIG NO. 16. Market Revenue Share, By Polyols, 2020 & 2028 ................................................................ 39
FIG NO. 17. Market Volume Share, By Polyols, 2020 & 2028 .................................................................. 40
FIG NO. 18. Global Biopharmaceutical Excipients Market for Mannitol, Revenue (USD Million) Volume
(K Tons) 2016 – 2028 .......................................................................................................... 41
FIG NO. 19. Global Biopharmaceutical Excipients Market for Sorbitol, Revenue (USD Million) Volume
(K Tons) 2016 – 2028 .......................................................................................................... 42
FIG NO. 20. Global Biopharmaceutical Excipients Market for Others, Revenue (USD Million) Volume (K
Tons) 2016 – 2028 .............................................................................................................. 43
FIG NO. 21. Market Revenue Share, By Carbohydrates, 2020 & 2028 .................................................... 44
FIG NO. 22. Market Volume Share, By Carbohydrates, 2020 & 2028 ...................................................... 45
FIG NO. 23. Global Biopharmaceutical Excipients Market for Sucrose, Revenue (USD Million) Volume
(K Tons) 2016 – 2028 .......................................................................................................... 46
FIG NO. 24. Global Biopharmaceutical Excipients Market for Dextrose, Revenue (USD Million) Volume
(K Tons) 2016 – 2028 .......................................................................................................... 47
FIG NO. 25. Global Biopharmaceutical Excipients Market for Starch, Revenue (USD Million) Volume (K
Tons) 2016 – 2028 .............................................................................................................. 48
FIG NO. 26. Global Biopharmaceutical Excipients Market for Others, Revenue (USD Million) Volume (K
Tons) 2016 – 2028 .............................................................................................................. 49
FIG NO. 27. Global Biopharmaceutical Excipients Market Revenue Share, By Region, 2020 & 2028 ........ 50
GLOBAL BIOPHARMACEUTICAL EXCIPIENTS MARKET, 2020 – 2028
PAGE NO. | 11 COPYRIGHT © 2021 ZION MARKET RESEARCH
FIG NO. 28. Global Biopharmaceutical Excipients Market Volume Share, By Region, 2020 & 2028 ......... 51
FIG NO. 29. North America Biopharmaceutical Excipients Market Revenue & Volume, 2016 - 2028
(USD Million) (K Tons) ........................................................................................................ 52
FIG NO. 30. Porter’s Five Forces Analysis for Global Biopharmaceutical Excipients Market .................... 61
FIG NO. 31. PEST Analysis for Global Biopharmaceutical Excipients Market ........................................... 62
FIG NO. 32. Value Chain Analysis for Global Biopharmaceutical Excipients Market ................................ 64
FIG NO. 33. Company Share Analysis, 2020 ........................................................................................... 65
FIG NO. 34. Company Strategic Developments – Heat Map Analysis ...................................................... 66
FIG NO. 35. Merck KGaA Business Segment Revenue Share, 2020 (%) ................................................... 68
FIG NO. 36. Merck KGaA Geographical Segment Revenue Share, 2020 (%) ............................................ 68
FIG NO. 37. Market Channels ................................................................................................................ 70
FIG NO. 38. Marketing Channel Development Trend ............................................................................. 71
FIG NO. 39. Research Methodology – Detailed View ............................................................................. 72
FIG NO. 40. Research Methodology ...................................................................................................... 73
GLOBAL BIOPHARMACEUTICAL EXCIPIENTS MARKET, 2020 – 2028
PAGE NO. | 12 COPYRIGHT © 2021 ZION MARKET RESEARCH
List of Tables
TABLE NO. 1. : Global Biopharmaceutical Excipients Market: Snapshot ...................................................... 18
TABLE NO. 2. : Quarterly Biopharmaceutical Excipients Market Revenue by Region, 2020 ......................... 22
TABLE NO. 3. : Quarterly Biopharmaceutical Excipients Market Revenue Forecast by Region, 2021............ 22
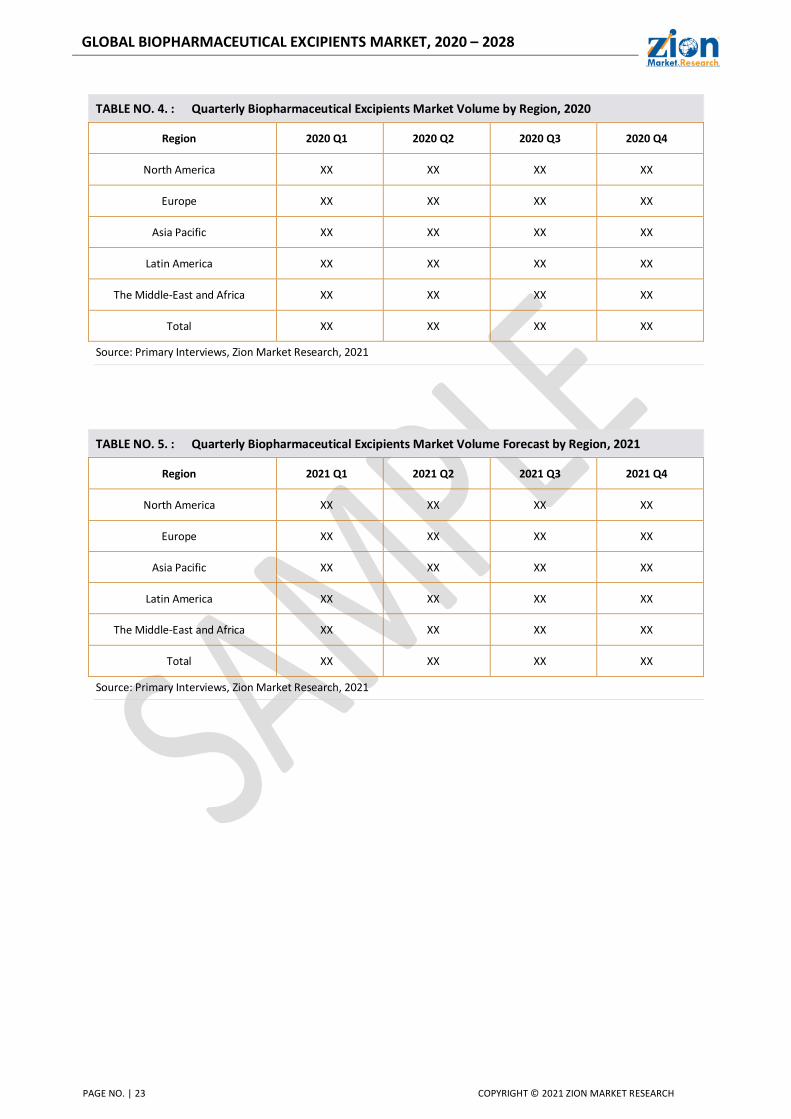
TABLE NO. 4. : Quarterly Biopharmaceutical Excipients Market Volume by Region, 2020 ........................... 23
TABLE NO. 5. : Quarterly Biopharmaceutical Excipients Market Volume Forecast by Region, 2021 ............. 23
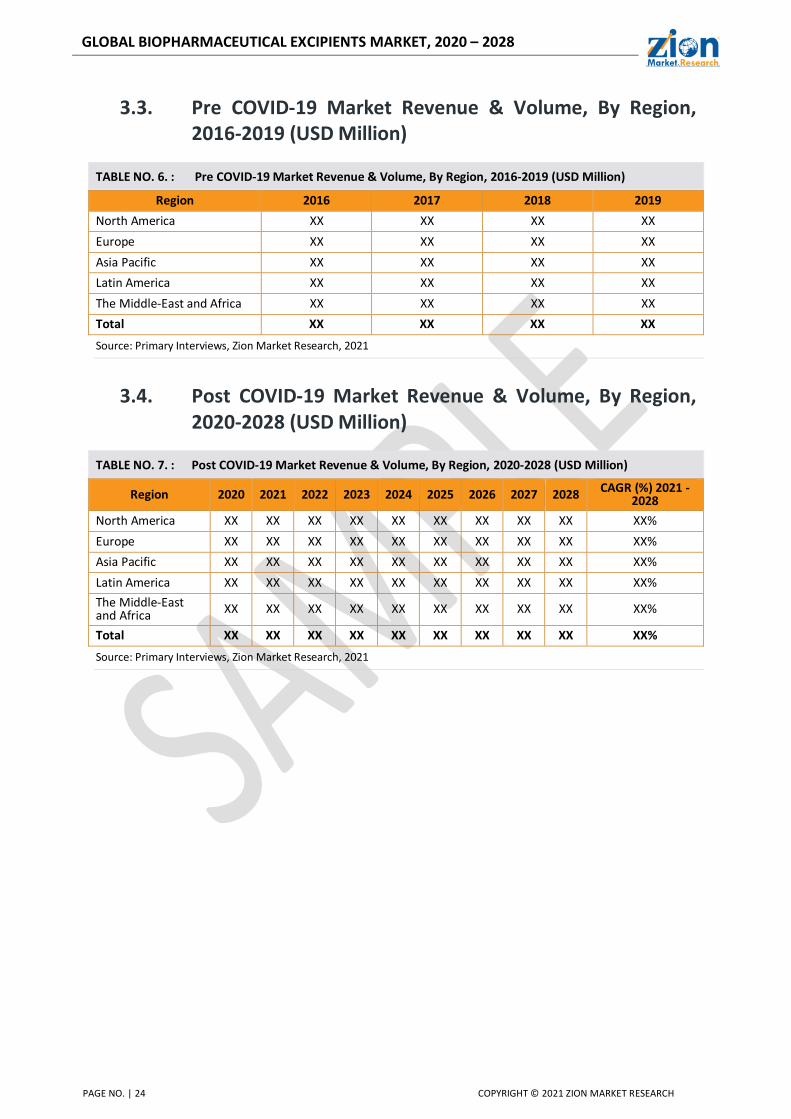
TABLE NO. 6. : Pre COVID-19 Market Revenue & Volume, By Region, 2016-2019 (USD Million) .................. 24
TABLE NO. 7. : Post COVID-19 Market Revenue & Volume, By Region, 2020-2028 (USD Million) ................ 24
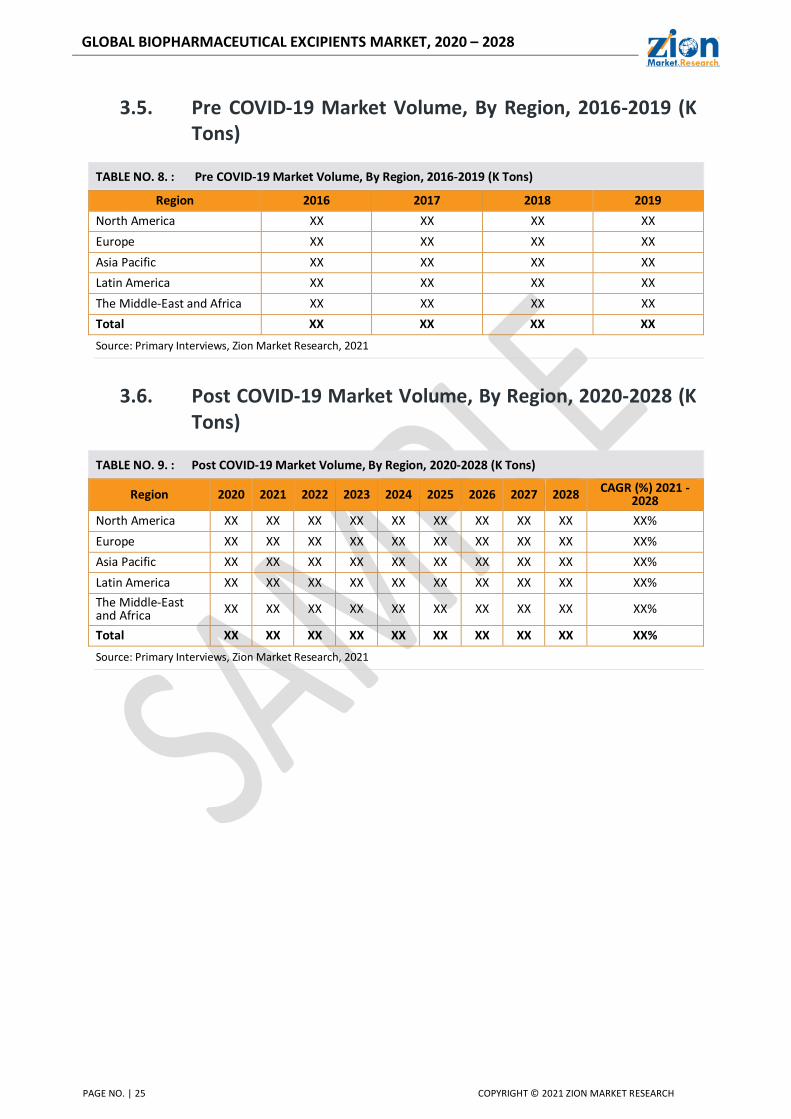
TABLE NO. 8. : Pre COVID-19 Market Volume, By Region, 2016-2019 (K Tons)............................................ 25
TABLE NO. 9. : Post COVID-19 Market Volume, By Region, 2020-2028 (K Tons) .......................................... 25
TABLE NO. 10. : Global Biopharmaceutical Excipients Market for Specialty Excipients, by Region, 2016 –
2028 (USD Million) (K Tons) ................................................................................................ 30
TABLE NO. 11. : Global Biopharmaceutical Excipients Market for Solubilizers & Surfactants/Emulsifiers, by
Region, 2016 – 2028 (USD Million) (K Tons) ........................................................................ 31
TABLE NO. 12. : Global Biopharmaceutical Excipients Market for Polyols, by Region, 2016 – 2028 (USD
Million) (K Tons) ................................................................................................................. 32
TABLE NO. 13. : Global Biopharmaceutical Excipients Market for Carbohydrates, by Region, 2016 – 2028
(USD Million) (K Tons) ........................................................................................................ 33
TABLE NO. 14. : Global Biopharmaceutical Excipients Market for Triglycerides, by Region, 2016 – 2028
(USD Million) (K Tons) ........................................................................................................ 36
TABLE NO. 15. : Global Biopharmaceutical Excipients Market for Esters, by Region, 2016 – 2028 (USD
Million) (K Tons) ................................................................................................................. 37
TABLE NO. 16. : Global Biopharmaceutical Excipients Market for Others, by Region, 2016 – 2028 (USD
Million) (K Tons) ................................................................................................................. 38
TABLE NO. 17. : Global Biopharmaceutical Excipients Market for Mannitol, by Region, 2016 – 2028 (USD
Million) (K Tons) ................................................................................................................. 41
TABLE NO. 18. : Global Biopharmaceutical Excipients Market for Sorbitol, by Region, 2016 – 2028 (USD
Million) (K Tons) ................................................................................................................. 42
TABLE NO. 19. : Global Biopharmaceutical Excipients Market for Others, by Region, 2016 – 2028 (USD
Million) (K Tons) ................................................................................................................. 43
TABLE NO. 20. : Global Biopharmaceutical Excipients Market for Sucrose, by Region, 2016 – 2028 (USD
Million) (K Tons) ................................................................................................................. 46
TABLE NO. 21. : Global Biopharmaceutical Excipients Market for Dextrose, by Region, 2016 – 2028 (USD
Million) (K Tons) ................................................................................................................. 47
TABLE NO. 22. : Global Biopharmaceutical Excipients Market for Starch, by Region, 2016 – 2028 (USD
Million) (K Tons) ................................................................................................................. 48
TABLE NO. 23. : Global Biopharmaceutical Excipients Market for Others, by Region, 2016 – 2028 (USD
Million) (K Tons) ................................................................................................................. 49
TABLE NO. 24. : Global Biopharmaceutical Excipients Market Revenue & Volume, By Region, 2016 – 2028
(USD Million) (K Tons) ........................................................................................................ 52
TABLE NO. 25. : North America Biopharmaceutical Excipients Market Revenue & Volume, By Country,
2016 – 2028 (USD Million) (K Tons)..................................................................................... 53
GLOBAL BIOPHARMACEUTICAL EXCIPIENTS MARKET, 2020 – 2028
PAGE NO. | 13 COPYRIGHT © 2021 ZION MARKET RESEARCH
TABLE NO. 26. : North America Biopharmaceutical Excipients Market Revenue & Volume, By Product,
2016 – 2028 (USD Million) (K Tons)..................................................................................... 53
TABLE NO. 27. : North America Biopharmaceutical Excipients Market Revenue & Volume, By Solubilizers
& Surfactants/Emulsifiers, 2016 – 2028 (USD Million) (K Tons) ............................................ 53
TABLE NO. 28. : North America Biopharmaceutical Excipients Market Revenue & Volume, By Polyols, 2016
– 2028 (USD Million) (K Tons) ............................................................................................. 54
TABLE NO. 29. : North America Biopharmaceutical Excipients Market Revenue & Volume, By
Carbohydrates, 2016 – 2028 (USD Million) (K Tons) ............................................................ 54
TABLE NO. 30. : Drivers for the Biopharmaceutical Excipients Market: Impact Analysis ................................ 59
TABLE NO. 31. : Restraints for the Biopharmaceutical Excipients Market: Impact Analysis ........................... 60
GLOBAL BIOPHARMACEUTICAL EXCIPIENTS MARKET, 2020 – 2028
PAGE NO. | 14 COPYRIGHT © 2021 ZION MARKET RESEARCH
Chapter No. 1 : Introduction
1.1. Report Description
1.1.1. Purpose of the Report
The purpose of the strategic research study titled “Biopharmaceutical Excipients Market -
Global Industry Perspective Comprehensive Analysis and Forecast 2020 - 2028” is to offer
industry investors, company executives, and industry participants with in-depth analysis to
enable them make informed strategic decisions related to the opportunities in the industry.
1.1.2. USP & Key Offerings
Market Size in terms of Revenue (USD Million) and Volume (K Tons) from 2016 to 2028
Historical & Descriptive Analysis from 2016 to 2020
Forecasts & Predictive Analysis from 2021 to 2028
Market Drivers, Restraints, Opportunities, & Regional Market Trends
Market Attractiveness Analysis
Segment Analysis by Region and Country
Competitive Landscape and Company Market Share Analysis
Porter’s Five Forces Analysis
Value Chain Analysis
PEST Analysis
Regulatory Landscape
Technology Landscape
COVID-19 Impact Analysis
1.2. Key Benefits for Stakeholders
The report covers forecast and analysis for the Biopharmaceutical Excipients market
on a global and regional level.
The study provides historic data from 2016 to 2020 along with a forecast from 2021
to 2028 based on revenue (USD Million) and volume (K Tons) to determine the
market potential.
The study includes drivers and restraints of the market along with the impact they
have on the demand over the forecast period.
GLOBAL BIOPHARMACEUTICAL EXCIPIENTS MARKET, 2020 – 2028
PAGE NO. | 15 COPYRIGHT © 2021 ZION MARKET RESEARCH
The report includes the study of potential growth opportunities available in the
Biopharmaceutical Excipients market on a global level.
Porter’s five forces analysis illustrates the degree of competition along with the
potency of buyers and suppliers operating in the industry.
1.3. Target Audience
Industry Investors
Healthcare Organizations
End Users
1.4. Report Scope
This report segments the global Biopharmaceutical Excipients market as follows:
Product Segment Analysis
Specialty Excipients
Solubilizers & Surfactants/Emulsifiers
o Triglycerides
o Esters
o Others
Polyols
o Mannitol
o Sorbitol
o Others
Carbohydrates
o Sucrose
o Dextrose
o Starch
o Others
Regional Segment Analysis
North America
o U.S.
o Canada
GLOBAL BIOPHARMACEUTICAL EXCIPIENTS MARKET, 2020 – 2028
PAGE NO. | 16 COPYRIGHT © 2021 ZION MARKET RESEARCH
o Mexico
Europe
o Germany
o France
o U.K.
o Italy
o Spain
o Rest of Europe
Asia Pacific
o China
o Japan
o India
o South Korea
o South-East Asia
o Rest of Asia Pacific
Latin America
o Brazil
o Argentina
o Rest of Latin America
The Middle-East and Africa
o GCC Countries
o South Africa
o Rest of Middle-East Africa
GLOBAL BIOPHARMACEUTICAL EXCIPIENTS MARKET, 2020 – 2028
PAGE NO. | 17 COPYRIGHT © 2021 ZION MARKET RESEARCH
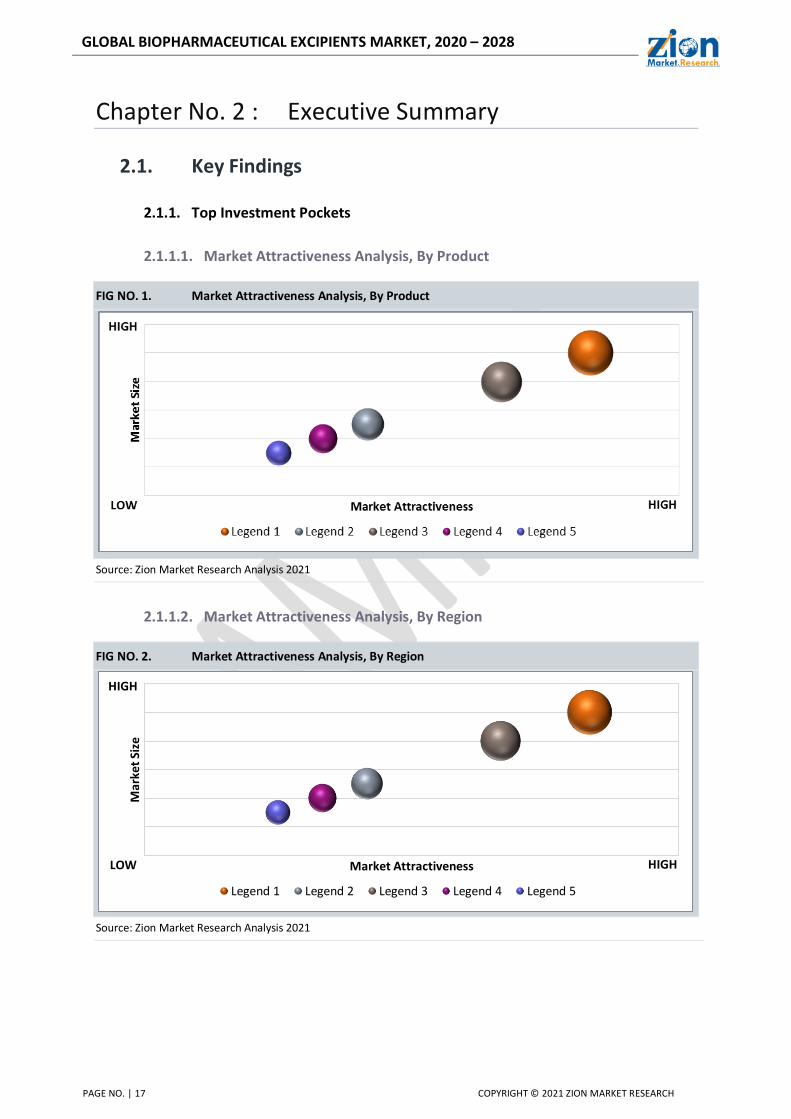
Chapter No. 2 : Executive Summary
2.1. Key Findings
2.1.1. Top Investment Pockets
2.1.1.1. Market Attractiveness Analysis, By Product
FIG NO. 1. Market Attractiveness Analysis, By Product
Source: Zion Market Research Analysis 2021
2.1.1.2. Market Attractiveness Analysis, By Region
FIG NO. 2. Market Attractiveness Analysis, By Region
Source: Zion Market Research Analysis 2021
Mar
ket
Size
Market Attractiveness
Legend 1 Legend 2 Legend 3 Legend 4 Legend 5
HIGH
HIGH
LOW
GLOBAL BIOPHARMACEUTICAL EXCIPIENTS MARKET, 2020 – 2028
PAGE NO. | 18 COPYRIGHT © 2021 ZION MARKET RESEARCH
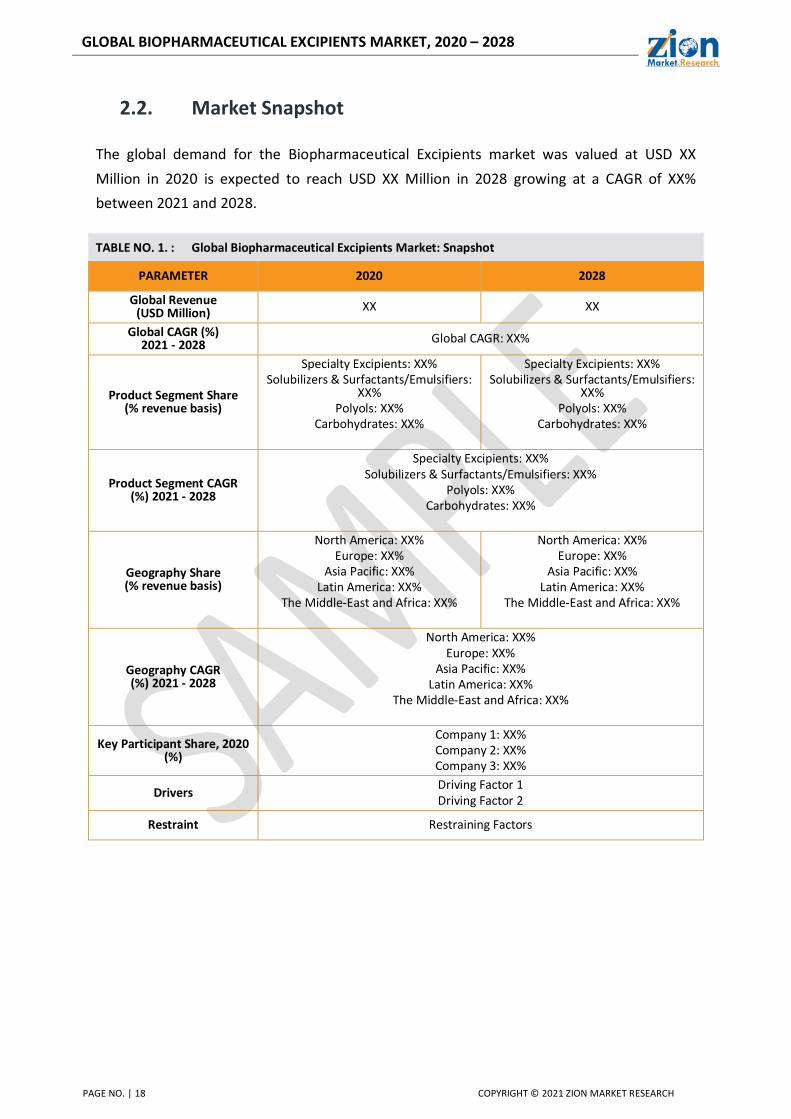
2.2. Market Snapshot
The global demand for the Biopharmaceutical Excipients market was valued at USD XX
Million in 2020 is expected to reach USD XX Million in 2028 growing at a CAGR of XX%
between 2021 and 2028.
TABLE NO. 1. : Global Biopharmaceutical Excipients Market: Snapshot
PARAMETER 2020 2028
Global Revenue (USD Million) XX XX
Global CAGR (%) 2021 - 2028 Global CAGR: XX%
Product Segment Share (% revenue basis)
Specialty Excipients: XX% Solubilizers & Surfactants/Emulsifiers:
XX% Polyols: XX%
Carbohydrates: XX%
Specialty Excipients: XX% Solubilizers & Surfactants/Emulsifiers:
XX% Polyols: XX%
Carbohydrates: XX%
Product Segment CAGR (%) 2021 - 2028
Specialty Excipients: XX% Solubilizers & Surfactants/Emulsifiers: XX%
Polyols: XX% Carbohydrates: XX%
Geography Share (% revenue basis)
North America: XX% Europe: XX%
Asia Pacific: XX% Latin America: XX%
The Middle-East and Africa: XX%
North America: XX% Europe: XX%
Asia Pacific: XX% Latin America: XX%
The Middle-East and Africa: XX%
Geography CAGR (%) 2021 - 2028
North America: XX% Europe: XX%
Asia Pacific: XX% Latin America: XX%
The Middle-East and Africa: XX%
Key Participant Share, 2020 (%)
Company 1: XX% Company 2: XX% Company 3: XX%
Drivers Driving Factor 1 Driving Factor 2
Restraint Restraining Factors
GLOBAL BIOPHARMACEUTICAL EXCIPIENTS MARKET, 2020 – 2028
PAGE NO. | 19 COPYRIGHT © 2021 ZION MARKET RESEARCH
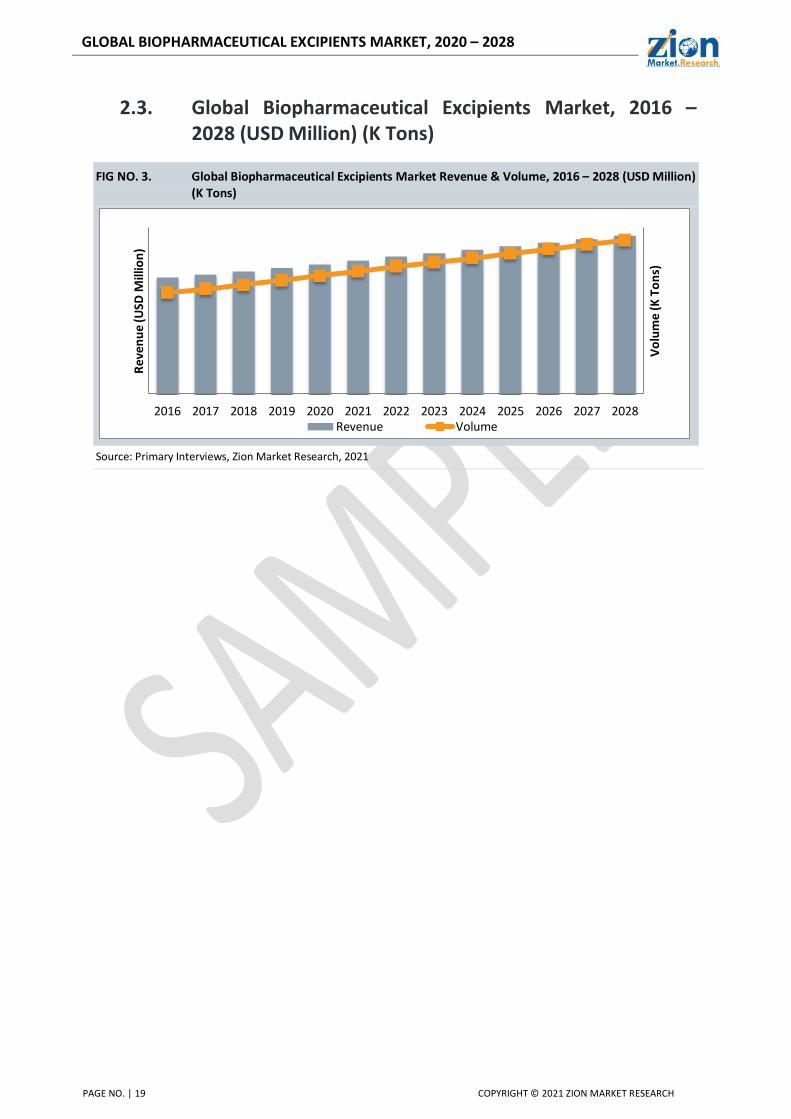
2.3. Global Biopharmaceutical Excipients Market, 2016 – 2028 (USD Million) (K Tons)
FIG NO. 3. Global Biopharmaceutical Excipients Market Revenue & Volume, 2016 – 2028 (USD Million) (K Tons)
Source: Primary Interviews, Zion Market Research, 2021
2016 2017 2018 2019 2020 2021 2022 2023 2024 2025 2026 2027 2028
Vo
lum
e (
K T
on
s)
Rev
en
ue
(USD
Mill
ion
)
Revenue Volume
GLOBAL BIOPHARMACEUTICAL EXCIPIENTS MARKET, 2020 – 2028
PAGE NO. | 20 COPYRIGHT © 2021 ZION MARKET RESEARCH
2.4. Insights from Primary Respondents
GLOBAL BIOPHARMACEUTICAL EXCIPIENTS MARKET, 2020 – 2028
PAGE NO. | 21 COPYRIGHT © 2021 ZION MARKET RESEARCH
Chapter No. 3 : COVID 19 Impact Analysis
3.1. Impact Assessment of COVID-19 Pandemic, By Region
3.1.1. North America
FIG NO. 4. Impact of COVID-19 Pandemic in North America Countries
Country Low Moderate High
U.S.
Canada
Mexico
Source: Primary Interviews, Zion Market Research, 2021
Note: Similar Analysis as that of North America will be provided for all the regions
3.1.2. Europe
3.1.3. Asia Pacific
3.1.4. Latin America
3.1.5. The Middle-East and Africa
GLOBAL BIOPHARMACEUTICAL EXCIPIENTS MARKET, 2020 – 2028
PAGE NO. | 22 COPYRIGHT © 2021 ZION MARKET RESEARCH
3.2. Quarterly Market Revenue & Volume and Forecast by Region 2020 & 2021
TABLE NO. 2. : Quarterly Biopharmaceutical Excipients Market Revenue by Region, 2020
Region 2020 Q1 2020 Q2 2020 Q3 2020 Q4
North America XX XX XX XX
Europe XX XX XX XX
Asia Pacific XX XX XX XX
Latin America XX XX XX XX
The Middle-East and Africa XX XX XX XX
Total XX XX XX XX
Source: Primary Interviews, Zion Market Research, 2021
TABLE NO. 3. : Quarterly Biopharmaceutical Excipients Market Revenue Forecast by Region, 2021
Region 2021 Q1 2021 Q2 2021 Q3 2021 Q4
North America XX XX XX XX
Europe XX XX XX XX
Asia Pacific XX XX XX XX
Latin America XX XX XX XX
The Middle-East and Africa XX XX XX XX
Total XX XX XX XX
Source: Primary Interviews, Zion Market Research, 2021
GLOBAL BIOPHARMACEUTICAL EXCIPIENTS MARKET, 2020 – 2028
PAGE NO. | 23 COPYRIGHT © 2021 ZION MARKET RESEARCH
TABLE NO. 4. : Quarterly Biopharmaceutical Excipients Market Volume by Region, 2020
Region 2020 Q1 2020 Q2 2020 Q3 2020 Q4
North America XX XX XX XX
Europe XX XX XX XX
Asia Pacific XX XX XX XX
Latin America XX XX XX XX
The Middle-East and Africa XX XX XX XX
Total XX XX XX XX
Source: Primary Interviews, Zion Market Research, 2021
TABLE NO. 5. : Quarterly Biopharmaceutical Excipients Market Volume Forecast by Region, 2021
Region 2021 Q1 2021 Q2 2021 Q3 2021 Q4
North America XX XX XX XX
Europe XX XX XX XX
Asia Pacific XX XX XX XX
Latin America XX XX XX XX
The Middle-East and Africa XX XX XX XX
Total XX XX XX XX
Source: Primary Interviews, Zion Market Research, 2021
GLOBAL BIOPHARMACEUTICAL EXCIPIENTS MARKET, 2020 – 2028
PAGE NO. | 24 COPYRIGHT © 2021 ZION MARKET RESEARCH
3.3. Pre COVID-19 Market Revenue & Volume, By Region, 2016-2019 (USD Million)
TABLE NO. 6. : Pre COVID-19 Market Revenue & Volume, By Region, 2016-2019 (USD Million)
Region 2016 2017 2018 2019
North America XX XX XX XX
Europe XX XX XX XX
Asia Pacific XX XX XX XX
Latin America XX XX XX XX
The Middle-East and Africa XX XX XX XX
Total XX XX XX XX
Source: Primary Interviews, Zion Market Research, 2021
3.4. Post COVID-19 Market Revenue & Volume, By Region, 2020-2028 (USD Million)
TABLE NO. 7. : Post COVID-19 Market Revenue & Volume, By Region, 2020-2028 (USD Million)
Region 2020 2021 2022 2023 2024 2025 2026 2027 2028 CAGR (%) 2021 -
2028
North America XX XX XX XX XX XX XX XX XX XX%
Europe XX XX XX XX XX XX XX XX XX XX%
Asia Pacific XX XX XX XX XX XX XX XX XX XX%
Latin America XX XX XX XX XX XX XX XX XX XX%
The Middle-East and Africa XX XX XX XX XX XX XX XX XX XX%
Total XX XX XX XX XX XX XX XX XX XX%
Source: Primary Interviews, Zion Market Research, 2021
GLOBAL BIOPHARMACEUTICAL EXCIPIENTS MARKET, 2020 – 2028
PAGE NO. | 25 COPYRIGHT © 2021 ZION MARKET RESEARCH
3.5. Pre COVID-19 Market Volume, By Region, 2016-2019 (K Tons)
TABLE NO. 8. : Pre COVID-19 Market Volume, By Region, 2016-2019 (K Tons)
Region 2016 2017 2018 2019
North America XX XX XX XX
Europe XX XX XX XX
Asia Pacific XX XX XX XX
Latin America XX XX XX XX
The Middle-East and Africa XX XX XX XX
Total XX XX XX XX
Source: Primary Interviews, Zion Market Research, 2021
3.6. Post COVID-19 Market Volume, By Region, 2020-2028 (K Tons)
TABLE NO. 9. : Post COVID-19 Market Volume, By Region, 2020-2028 (K Tons)
Region 2020 2021 2022 2023 2024 2025 2026 2027 2028 CAGR (%) 2021 -
2028
North America XX XX XX XX XX XX XX XX XX XX%
Europe XX XX XX XX XX XX XX XX XX XX%
Asia Pacific XX XX XX XX XX XX XX XX XX XX%
Latin America XX XX XX XX XX XX XX XX XX XX%
The Middle-East and Africa XX XX XX XX XX XX XX XX XX XX%
Total XX XX XX XX XX XX XX XX XX XX%
Source: Primary Interviews, Zion Market Research, 2021
GLOBAL BIOPHARMACEUTICAL EXCIPIENTS MARKET, 2020 – 2028
PAGE NO. | 26 COPYRIGHT © 2021 ZION MARKET RESEARCH
3.7. Key Strategies Undertaken by Companies to Tackle COVID-19
GLOBAL BIOPHARMACEUTICAL EXCIPIENTS MARKET, 2020 – 2028
PAGE NO. | 27 COPYRIGHT © 2021 ZION MARKET RESEARCH
3.8. Short Term Dynamics
3.9. Long Term Dynamics
GLOBAL BIOPHARMACEUTICAL EXCIPIENTS MARKET, 2020 – 2028
PAGE NO. | 28 COPYRIGHT © 2021 ZION MARKET RESEARCH
Chapter No. 4 : Biopharmaceutical Excipients Market – Product Segment Analysis
4.1. Overview
4.1.1. Market Revenue Share, By Product, 2020 & 2028
FIG NO. 5. Market Revenue Share, By Product, 2020 & 2028
Source: Primary Interviews, Zion Market Research, 2021
GLOBAL BIOPHARMACEUTICAL EXCIPIENTS MARKET, 2020 – 2028
PAGE NO. | 29 COPYRIGHT © 2021 ZION MARKET RESEARCH
4.1.2. Market Volume Share, By Product, 2020 & 2028
FIG NO. 6. Market Volume Share, By Product, 2020 & 2028
Source: Primary Interviews, Zion Market Research, 2021

GLOBAL BIOPHARMACEUTICAL EXCIPIENTS MARKET, 2020 – 2028
PAGE NO. | 30 COPYRIGHT © 2021 ZION MARKET RESEARCH
4.2. Specialty Excipients
FIG NO. 7. Global Biopharmaceutical Excipients Market for Specialty Excipients, Revenue (USD Million) Volume (K Tons) 2016 – 2028
Source: Zion Market Research Analysis 2021
4.2.1. Market Size and Forecast, By Region (USD Million) (K Tons)
TABLE NO. 10. : Global Biopharmaceutical Excipients Market for Specialty Excipients, by Region, 2016 – 2028 (USD Million) (K Tons)
Region 2016 2017 2018 2019 2020 2021 2022 2023 2024 2025 2026 2027 2028 CAGR
North America XX XX XX XX XX XX XX XX XX XX XX XX XX XX%
Europe XX XX XX XX XX XX XX XX XX XX XX XX XX XX%
Asia Pacific
XX XX XX XX XX XX XX XX XX XX XX XX XX XX%
Latin America
XX XX XX XX XX XX XX XX XX XX XX XX XX XX%
The Middle-East and Africa
XX XX XX XX XX XX XX XX XX XX XX XX XX XX%
Total XX XX XX XX XX XX XX XX XX XX XX XX XX XX%
Source: Primary Interviews, Zion Market Research, 2021
GLOBAL BIOPHARMACEUTICAL EXCIPIENTS MARKET, 2020 – 2028
PAGE NO. | 31 COPYRIGHT © 2021 ZION MARKET RESEARCH
4.3. Solubilizers & Surfactants/Emulsifiers
FIG NO. 8. Global Biopharmaceutical Excipients Market for Solubilizers & Surfactants/Emulsifiers, Revenue (USD Million) Volume (K Tons) 2016 – 2028
Source: Zion Market Research Analysis 2021
4.3.1. Market Size and Forecast, By Region (USD Million) (K Tons)
TABLE NO. 11. : Global Biopharmaceutical Excipients Market for Solubilizers & Surfactants/Emulsifiers, by Region, 2016 – 2028 (USD Million) (K Tons)
Region 2016 2017 2018 2019 2020 2021 2022 2023 2024 2025 2026 2027 2028 CAGR
North America XX XX XX XX XX XX XX XX XX XX XX XX XX XX%
Europe XX XX XX XX XX XX XX XX XX XX XX XX XX XX%
Asia Pacific
XX XX XX XX XX XX XX XX XX XX XX XX XX XX%
Latin America
XX XX XX XX XX XX XX XX XX XX XX XX XX XX%
The Middle-East and Africa
XX XX XX XX XX XX XX XX XX XX XX XX XX XX%
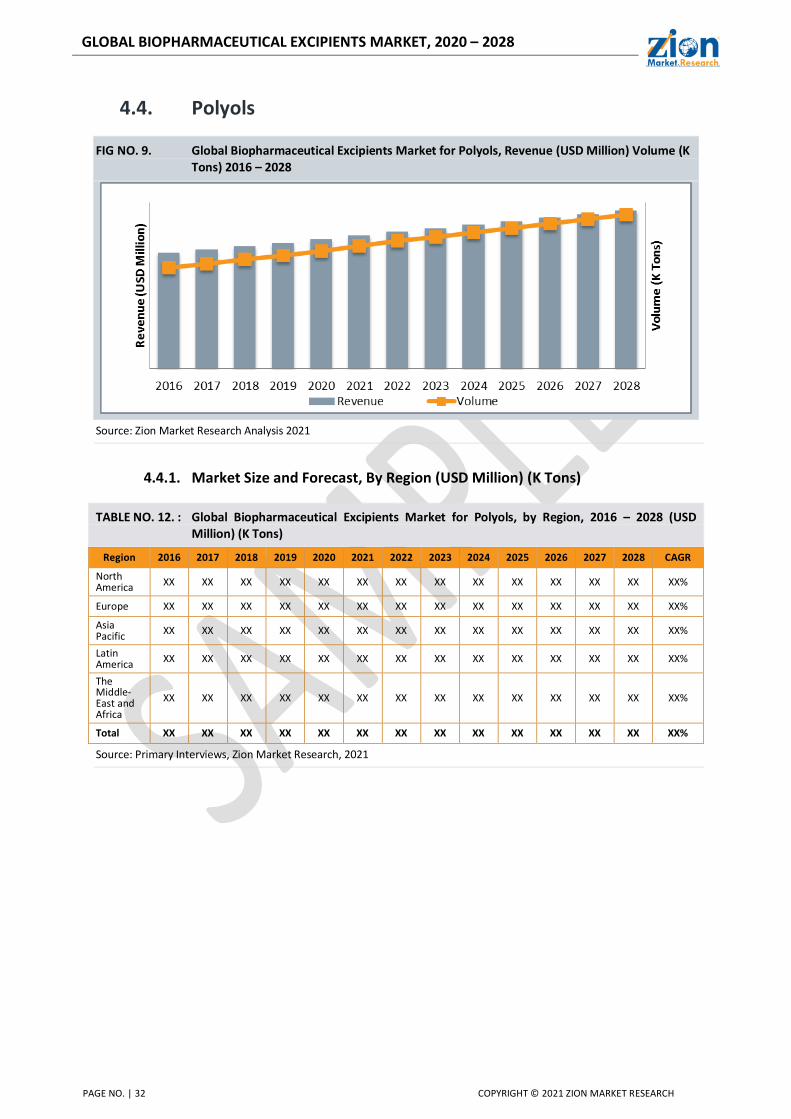
Total XX XX XX XX XX XX XX XX XX XX XX XX XX XX%
Source: Primary Interviews, Zion Market Research, 2021
GLOBAL BIOPHARMACEUTICAL EXCIPIENTS MARKET, 2020 – 2028
PAGE NO. | 32 COPYRIGHT © 2021 ZION MARKET RESEARCH
4.4. Polyols
FIG NO. 9. Global Biopharmaceutical Excipients Market for Polyols, Revenue (USD Million) Volume (K Tons) 2016 – 2028
Source: Zion Market Research Analysis 2021
4.4.1. Market Size and Forecast, By Region (USD Million) (K Tons)
TABLE NO. 12. : Global Biopharmaceutical Excipients Market for Polyols, by Region, 2016 – 2028 (USD Million) (K Tons)
Region 2016 2017 2018 2019 2020 2021 2022 2023 2024 2025 2026 2027 2028 CAGR
North America XX XX XX XX XX XX XX XX XX XX XX XX XX XX%
Europe XX XX XX XX XX XX XX XX XX XX XX XX XX XX%
Asia Pacific
XX XX XX XX XX XX XX XX XX XX XX XX XX XX%
Latin America
XX XX XX XX XX XX XX XX XX XX XX XX XX XX%
The Middle-East and Africa
XX XX XX XX XX XX XX XX XX XX XX XX XX XX%
Total XX XX XX XX XX XX XX XX XX XX XX XX XX XX%
Source: Primary Interviews, Zion Market Research, 2021
GLOBAL BIOPHARMACEUTICAL EXCIPIENTS MARKET, 2020 – 2028
PAGE NO. | 33 COPYRIGHT © 2021 ZION MARKET RESEARCH
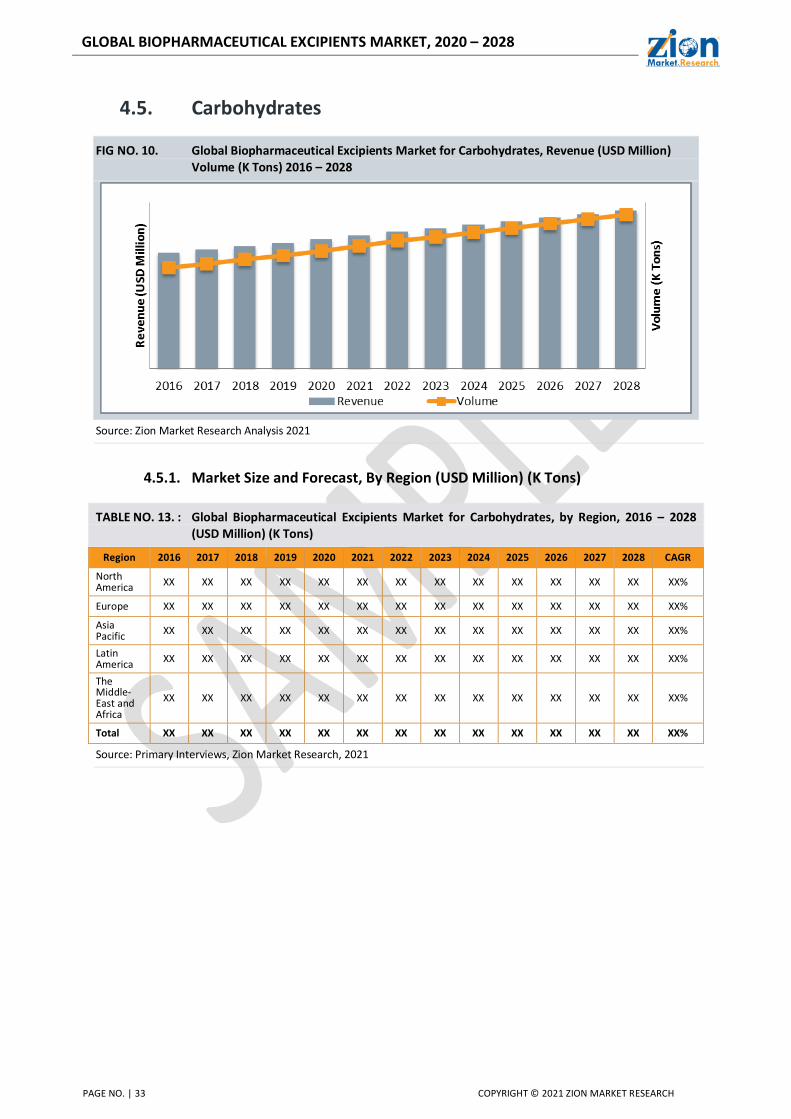
4.5. Carbohydrates
FIG NO. 10. Global Biopharmaceutical Excipients Market for Carbohydrates, Revenue (USD Million) Volume (K Tons) 2016 – 2028
Source: Zion Market Research Analysis 2021
4.5.1. Market Size and Forecast, By Region (USD Million) (K Tons)
TABLE NO. 13. : Global Biopharmaceutical Excipients Market for Carbohydrates, by Region, 2016 – 2028 (USD Million) (K Tons)
Region 2016 2017 2018 2019 2020 2021 2022 2023 2024 2025 2026 2027 2028 CAGR
North America XX XX XX XX XX XX XX XX XX XX XX XX XX XX%
Europe XX XX XX XX XX XX XX XX XX XX XX XX XX XX%
Asia Pacific
XX XX XX XX XX XX XX XX XX XX XX XX XX XX%
Latin America
XX XX XX XX XX XX XX XX XX XX XX XX XX XX%
The Middle-East and Africa
XX XX XX XX XX XX XX XX XX XX XX XX XX XX%
Total XX XX XX XX XX XX XX XX XX XX XX XX XX XX%
Source: Primary Interviews, Zion Market Research, 2021

GLOBAL BIOPHARMACEUTICAL EXCIPIENTS MARKET, 2020 – 2028
PAGE NO. | 34 COPYRIGHT © 2021 ZION MARKET RESEARCH
Chapter No. 5 : Biopharmaceutical Excipients Market – Solubilizers & Surfactants/Emulsifiers Segment Analysis
5.1. Overview
5.1.1. Market Revenue Share, By Solubilizers & Surfactants/Emulsifiers, 2020 & 2028
FIG NO. 11. Market Revenue Share, By Solubilizers & Surfactants/Emulsifiers, 2020 & 2028
Source: Primary Interviews, Zion Market Research, 2021
GLOBAL BIOPHARMACEUTICAL EXCIPIENTS MARKET, 2020 – 2028
PAGE NO. | 35 COPYRIGHT © 2021 ZION MARKET RESEARCH
5.1.2. Market Volume Share, By Solubilizers & Surfactants/Emulsifiers, 2020 & 2028
FIG NO. 12. Market Volume Share, By Solubilizers & Surfactants/Emulsifiers, 2020 & 2028
Source: Primary Interviews, Zion Market Research, 2021
GLOBAL BIOPHARMACEUTICAL EXCIPIENTS MARKET, 2020 – 2028
PAGE NO. | 36 COPYRIGHT © 2021 ZION MARKET RESEARCH
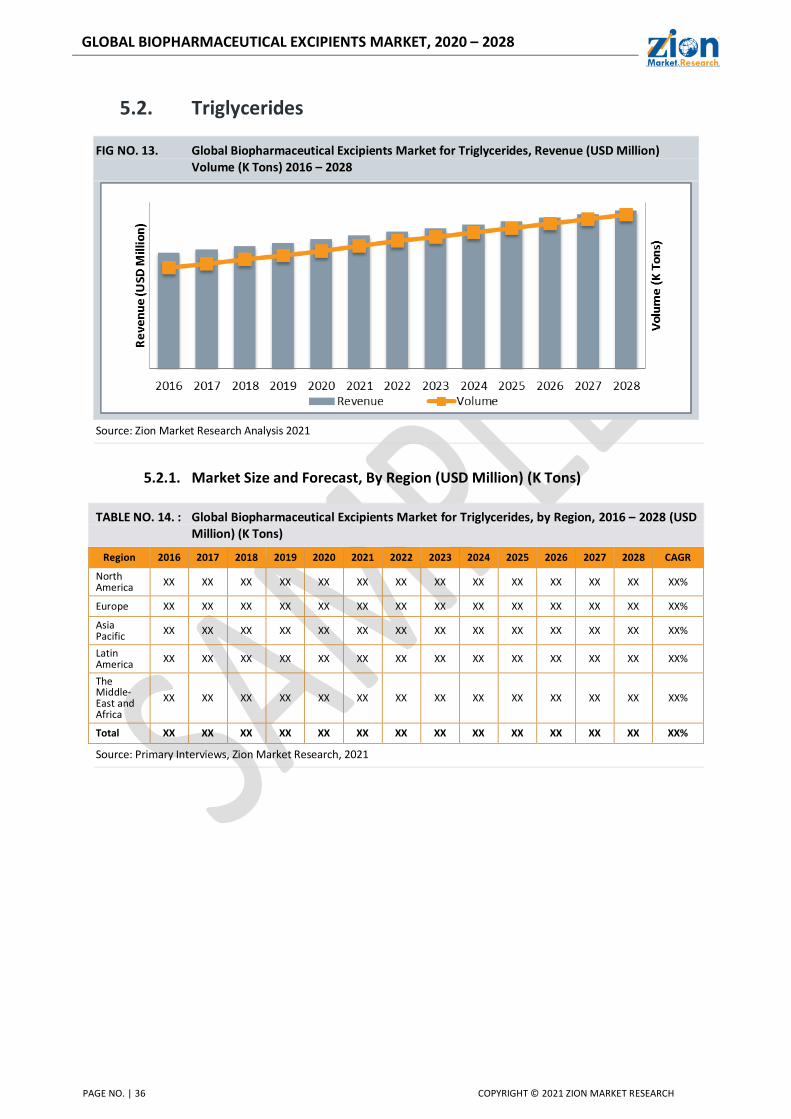
5.2. Triglycerides
FIG NO. 13. Global Biopharmaceutical Excipients Market for Triglycerides, Revenue (USD Million) Volume (K Tons) 2016 – 2028
Source: Zion Market Research Analysis 2021
5.2.1. Market Size and Forecast, By Region (USD Million) (K Tons)
TABLE NO. 14. : Global Biopharmaceutical Excipients Market for Triglycerides, by Region, 2016 – 2028 (USD Million) (K Tons)
Region 2016 2017 2018 2019 2020 2021 2022 2023 2024 2025 2026 2027 2028 CAGR
North America XX XX XX XX XX XX XX XX XX XX XX XX XX XX%
Europe XX XX XX XX XX XX XX XX XX XX XX XX XX XX%
Asia Pacific
XX XX XX XX XX XX XX XX XX XX XX XX XX XX%
Latin America
XX XX XX XX XX XX XX XX XX XX XX XX XX XX%
The Middle-East and Africa
XX XX XX XX XX XX XX XX XX XX XX XX XX XX%
Total XX XX XX XX XX XX XX XX XX XX XX XX XX XX%
Source: Primary Interviews, Zion Market Research, 2021

GLOBAL BIOPHARMACEUTICAL EXCIPIENTS MARKET, 2020 – 2028
PAGE NO. | 37 COPYRIGHT © 2021 ZION MARKET RESEARCH
5.3. Esters
FIG NO. 14. Global Biopharmaceutical Excipients Market for Esters, Revenue (USD Million) Volume (K Tons) 2016 – 2028
Source: Zion Market Research Analysis 2021
5.3.1. Market Size and Forecast, By Region (USD Million) (K Tons)
TABLE NO. 15. : Global Biopharmaceutical Excipients Market for Esters, by Region, 2016 – 2028 (USD Million) (K Tons)
Region 2016 2017 2018 2019 2020 2021 2022 2023 2024 2025 2026 2027 2028 CAGR
North America XX XX XX XX XX XX XX XX XX XX XX XX XX XX%
Europe XX XX XX XX XX XX XX XX XX XX XX XX XX XX%
Asia Pacific
XX XX XX XX XX XX XX XX XX XX XX XX XX XX%
Latin America
XX XX XX XX XX XX XX XX XX XX XX XX XX XX%
The Middle-East and Africa
XX XX XX XX XX XX XX XX XX XX XX XX XX XX%
Total XX XX XX XX XX XX XX XX XX XX XX XX XX XX%
Source: Primary Interviews, Zion Market Research, 2021
GLOBAL BIOPHARMACEUTICAL EXCIPIENTS MARKET, 2020 – 2028
PAGE NO. | 38 COPYRIGHT © 2021 ZION MARKET RESEARCH
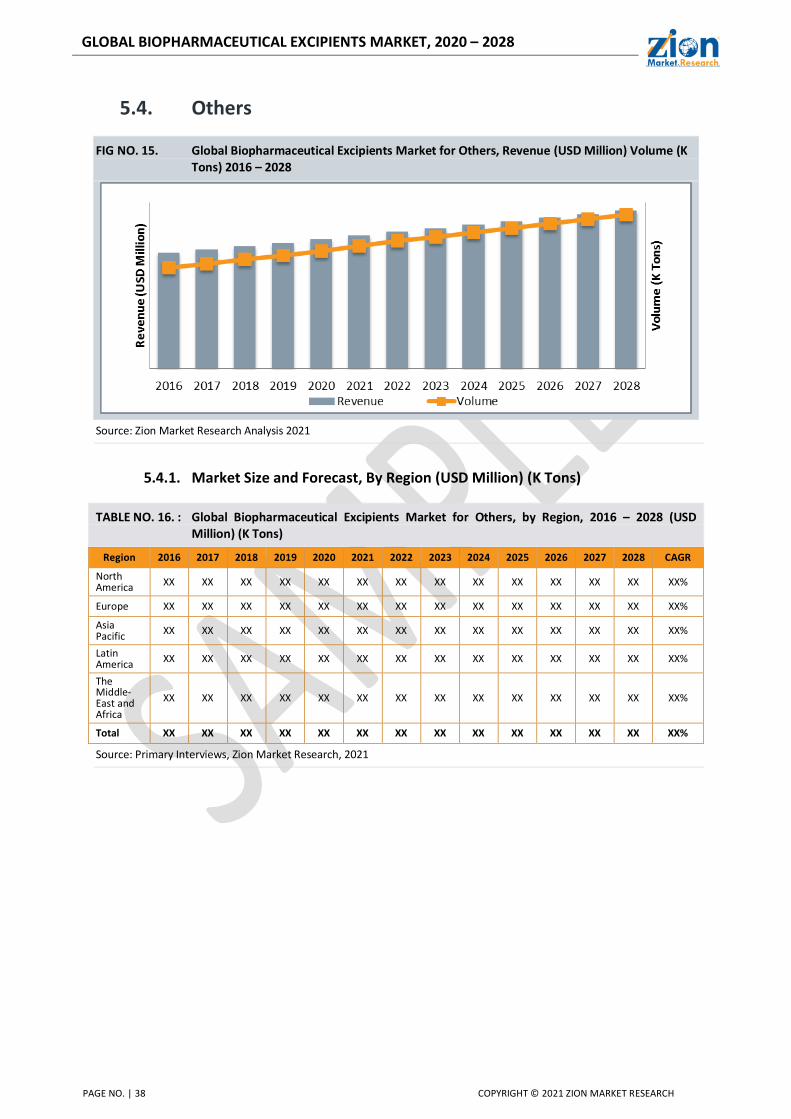
5.4. Others
FIG NO. 15. Global Biopharmaceutical Excipients Market for Others, Revenue (USD Million) Volume (K Tons) 2016 – 2028
Source: Zion Market Research Analysis 2021
5.4.1. Market Size and Forecast, By Region (USD Million) (K Tons)
TABLE NO. 16. : Global Biopharmaceutical Excipients Market for Others, by Region, 2016 – 2028 (USD Million) (K Tons)
Region 2016 2017 2018 2019 2020 2021 2022 2023 2024 2025 2026 2027 2028 CAGR
North America XX XX XX XX XX XX XX XX XX XX XX XX XX XX%
Europe XX XX XX XX XX XX XX XX XX XX XX XX XX XX%
Asia Pacific
XX XX XX XX XX XX XX XX XX XX XX XX XX XX%
Latin America
XX XX XX XX XX XX XX XX XX XX XX XX XX XX%
The Middle-East and Africa
XX XX XX XX XX XX XX XX XX XX XX XX XX XX%
Total XX XX XX XX XX XX XX XX XX XX XX XX XX XX%
Source: Primary Interviews, Zion Market Research, 2021

GLOBAL BIOPHARMACEUTICAL EXCIPIENTS MARKET, 2020 – 2028
PAGE NO. | 39 COPYRIGHT © 2021 ZION MARKET RESEARCH
Chapter No. 6 : Biopharmaceutical Excipients Market – Polyols Segment Analysis
6.1. Overview
6.1.1. Market Revenue Share, By Polyols, 2020 & 2028
FIG NO. 16. Market Revenue Share, By Polyols, 2020 & 2028
Source: Primary Interviews, Zion Market Research, 2021

GLOBAL BIOPHARMACEUTICAL EXCIPIENTS MARKET, 2020 – 2028
PAGE NO. | 40 COPYRIGHT © 2021 ZION MARKET RESEARCH
6.1.2. Market Volume Share, By Polyols, 2020 & 2028
FIG NO. 17. Market Volume Share, By Polyols, 2020 & 2028
Source: Primary Interviews, Zion Market Research, 2021
GLOBAL BIOPHARMACEUTICAL EXCIPIENTS MARKET, 2020 – 2028
PAGE NO. | 41 COPYRIGHT © 2021 ZION MARKET RESEARCH
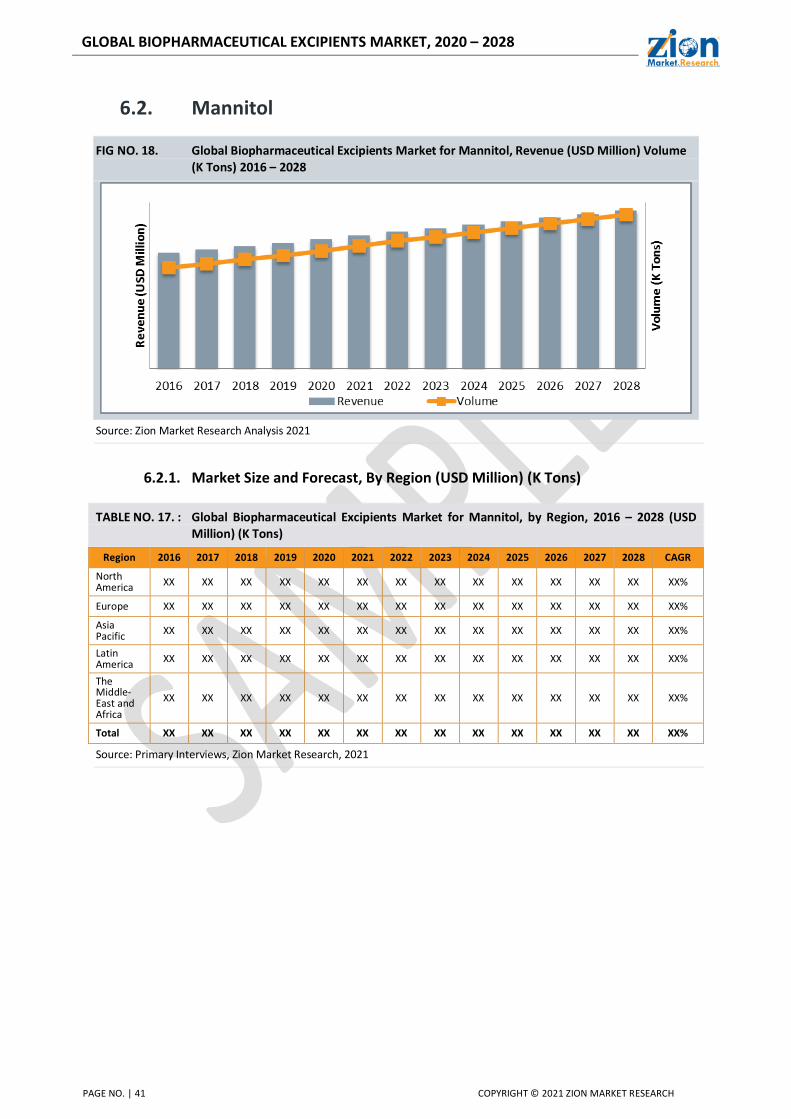
6.2. Mannitol
FIG NO. 18. Global Biopharmaceutical Excipients Market for Mannitol, Revenue (USD Million) Volume (K Tons) 2016 – 2028
Source: Zion Market Research Analysis 2021
6.2.1. Market Size and Forecast, By Region (USD Million) (K Tons)
TABLE NO. 17. : Global Biopharmaceutical Excipients Market for Mannitol, by Region, 2016 – 2028 (USD Million) (K Tons)
Region 2016 2017 2018 2019 2020 2021 2022 2023 2024 2025 2026 2027 2028 CAGR
North America XX XX XX XX XX XX XX XX XX XX XX XX XX XX%
Europe XX XX XX XX XX XX XX XX XX XX XX XX XX XX%
Asia Pacific
XX XX XX XX XX XX XX XX XX XX XX XX XX XX%
Latin America
XX XX XX XX XX XX XX XX XX XX XX XX XX XX%
The Middle-East and Africa
XX XX XX XX XX XX XX XX XX XX XX XX XX XX%
Total XX XX XX XX XX XX XX XX XX XX XX XX XX XX%
Source: Primary Interviews, Zion Market Research, 2021

GLOBAL BIOPHARMACEUTICAL EXCIPIENTS MARKET, 2020 – 2028
PAGE NO. | 42 COPYRIGHT © 2021 ZION MARKET RESEARCH
6.3. Sorbitol
FIG NO. 19. Global Biopharmaceutical Excipients Market for Sorbitol, Revenue (USD Million) Volume (K Tons) 2016 – 2028
Source: Zion Market Research Analysis 2021
6.3.1. Market Size and Forecast, By Region (USD Million) (K Tons)
TABLE NO. 18. : Global Biopharmaceutical Excipients Market for Sorbitol, by Region, 2016 – 2028 (USD Million) (K Tons)
Region 2016 2017 2018 2019 2020 2021 2022 2023 2024 2025 2026 2027 2028 CAGR
North America XX XX XX XX XX XX XX XX XX XX XX XX XX XX%
Europe XX XX XX XX XX XX XX XX XX XX XX XX XX XX%
Asia Pacific
XX XX XX XX XX XX XX XX XX XX XX XX XX XX%
Latin America
XX XX XX XX XX XX XX XX XX XX XX XX XX XX%
The Middle-East and Africa
XX XX XX XX XX XX XX XX XX XX XX XX XX XX%
Total XX XX XX XX XX XX XX XX XX XX XX XX XX XX%
Source: Primary Interviews, Zion Market Research, 2021

GLOBAL BIOPHARMACEUTICAL EXCIPIENTS MARKET, 2020 – 2028
PAGE NO. | 43 COPYRIGHT © 2021 ZION MARKET RESEARCH
6.4. Others
FIG NO. 20. Global Biopharmaceutical Excipients Market for Others, Revenue (USD Million) Volume (K Tons) 2016 – 2028
Source: Zion Market Research Analysis 2021
6.4.1. Market Size and Forecast, By Region (USD Million) (K Tons)
TABLE NO. 19. : Global Biopharmaceutical Excipients Market for Others, by Region, 2016 – 2028 (USD Million) (K Tons)
Region 2016 2017 2018 2019 2020 2021 2022 2023 2024 2025 2026 2027 2028 CAGR
North America XX XX XX XX XX XX XX XX XX XX XX XX XX XX%
Europe XX XX XX XX XX XX XX XX XX XX XX XX XX XX%
Asia Pacific
XX XX XX XX XX XX XX XX XX XX XX XX XX XX%
Latin America
XX XX XX XX XX XX XX XX XX XX XX XX XX XX%
The Middle-East and Africa
XX XX XX XX XX XX XX XX XX XX XX XX XX XX%
Total XX XX XX XX XX XX XX XX XX XX XX XX XX XX%
Source: Primary Interviews, Zion Market Research, 2021
GLOBAL BIOPHARMACEUTICAL EXCIPIENTS MARKET, 2020 – 2028
PAGE NO. | 44 COPYRIGHT © 2021 ZION MARKET RESEARCH
Chapter No. 7 : Biopharmaceutical Excipients Market – Carbohydrates Segment Analysis
7.1. Overview
7.1.1. Market Revenue Share, By Carbohydrates, 2020 & 2028
FIG NO. 21. Market Revenue Share, By Carbohydrates, 2020 & 2028
Source: Primary Interviews, Zion Market Research, 2021
GLOBAL BIOPHARMACEUTICAL EXCIPIENTS MARKET, 2020 – 2028
PAGE NO. | 45 COPYRIGHT © 2021 ZION MARKET RESEARCH
7.1.2. Market Volume Share, By Carbohydrates, 2020 & 2028
FIG NO. 22. Market Volume Share, By Carbohydrates, 2020 & 2028
Source: Primary Interviews, Zion Market Research, 2021

GLOBAL BIOPHARMACEUTICAL EXCIPIENTS MARKET, 2020 – 2028
PAGE NO. | 46 COPYRIGHT © 2021 ZION MARKET RESEARCH
7.2. Sucrose
FIG NO. 23. Global Biopharmaceutical Excipients Market for Sucrose, Revenue (USD Million) Volume (K Tons) 2016 – 2028
Source: Zion Market Research Analysis 2021
7.2.1. Market Size and Forecast, By Region (USD Million) (K Tons)
TABLE NO. 20. : Global Biopharmaceutical Excipients Market for Sucrose, by Region, 2016 – 2028 (USD Million) (K Tons)
Region 2016 2017 2018 2019 2020 2021 2022 2023 2024 2025 2026 2027 2028 CAGR
North America XX XX XX XX XX XX XX XX XX XX XX XX XX XX%
Europe XX XX XX XX XX XX XX XX XX XX XX XX XX XX%
Asia Pacific
XX XX XX XX XX XX XX XX XX XX XX XX XX XX%
Latin America
XX XX XX XX XX XX XX XX XX XX XX XX XX XX%
The Middle-East and Africa
XX XX XX XX XX XX XX XX XX XX XX XX XX XX%
Total XX XX XX XX XX XX XX XX XX XX XX XX XX XX%
Source: Primary Interviews, Zion Market Research, 2021

GLOBAL BIOPHARMACEUTICAL EXCIPIENTS MARKET, 2020 – 2028
PAGE NO. | 47 COPYRIGHT © 2021 ZION MARKET RESEARCH
7.3. Dextrose
FIG NO. 24. Global Biopharmaceutical Excipients Market for Dextrose, Revenue (USD Million) Volume (K Tons) 2016 – 2028
Source: Zion Market Research Analysis 2021
7.3.1. Market Size and Forecast, By Region (USD Million) (K Tons)
TABLE NO. 21. : Global Biopharmaceutical Excipients Market for Dextrose, by Region, 2016 – 2028 (USD Million) (K Tons)
Region 2016 2017 2018 2019 2020 2021 2022 2023 2024 2025 2026 2027 2028 CAGR
North America XX XX XX XX XX XX XX XX XX XX XX XX XX XX%
Europe XX XX XX XX XX XX XX XX XX XX XX XX XX XX%
Asia Pacific
XX XX XX XX XX XX XX XX XX XX XX XX XX XX%
Latin America
XX XX XX XX XX XX XX XX XX XX XX XX XX XX%
The Middle-East and Africa
XX XX XX XX XX XX XX XX XX XX XX XX XX XX%
Total XX XX XX XX XX XX XX XX XX XX XX XX XX XX%
Source: Primary Interviews, Zion Market Research, 2021

GLOBAL BIOPHARMACEUTICAL EXCIPIENTS MARKET, 2020 – 2028
PAGE NO. | 48 COPYRIGHT © 2021 ZION MARKET RESEARCH
7.4. Starch
FIG NO. 25. Global Biopharmaceutical Excipients Market for Starch, Revenue (USD Million) Volume (K Tons) 2016 – 2028
Source: Zion Market Research Analysis 2021
7.4.1. Market Size and Forecast, By Region (USD Million) (K Tons)
TABLE NO. 22. : Global Biopharmaceutical Excipients Market for Starch, by Region, 2016 – 2028 (USD Million) (K Tons)
Region 2016 2017 2018 2019 2020 2021 2022 2023 2024 2025 2026 2027 2028 CAGR
North America XX XX XX XX XX XX XX XX XX XX XX XX XX XX%
Europe XX XX XX XX XX XX XX XX XX XX XX XX XX XX%
Asia Pacific
XX XX XX XX XX XX XX XX XX XX XX XX XX XX%
Latin America
XX XX XX XX XX XX XX XX XX XX XX XX XX XX%
The Middle-East and Africa
XX XX XX XX XX XX XX XX XX XX XX XX XX XX%
Total XX XX XX XX XX XX XX XX XX XX XX XX XX XX%
Source: Primary Interviews, Zion Market Research, 2021

GLOBAL BIOPHARMACEUTICAL EXCIPIENTS MARKET, 2020 – 2028
PAGE NO. | 49 COPYRIGHT © 2021 ZION MARKET RESEARCH
7.5. Others
FIG NO. 26. Global Biopharmaceutical Excipients Market for Others, Revenue (USD Million) Volume (K Tons) 2016 – 2028
Source: Zion Market Research Analysis 2021
7.5.1. Market Size and Forecast, By Region (USD Million) (K Tons)
TABLE NO. 23. : Global Biopharmaceutical Excipients Market for Others, by Region, 2016 – 2028 (USD Million) (K Tons)
Region 2016 2017 2018 2019 2020 2021 2022 2023 2024 2025 2026 2027 2028 CAGR
North America XX XX XX XX XX XX XX XX XX XX XX XX XX XX%
Europe XX XX XX XX XX XX XX XX XX XX XX XX XX XX%
Asia Pacific
XX XX XX XX XX XX XX XX XX XX XX XX XX XX%
Latin America
XX XX XX XX XX XX XX XX XX XX XX XX XX XX%
The Middle-East and Africa
XX XX XX XX XX XX XX XX XX XX XX XX XX XX%
Total XX XX XX XX XX XX XX XX XX XX XX XX XX XX%
Source: Primary Interviews, Zion Market Research, 2021
GLOBAL BIOPHARMACEUTICAL EXCIPIENTS MARKET, 2020 – 2028
PAGE NO. | 50 COPYRIGHT © 2021 ZION MARKET RESEARCH
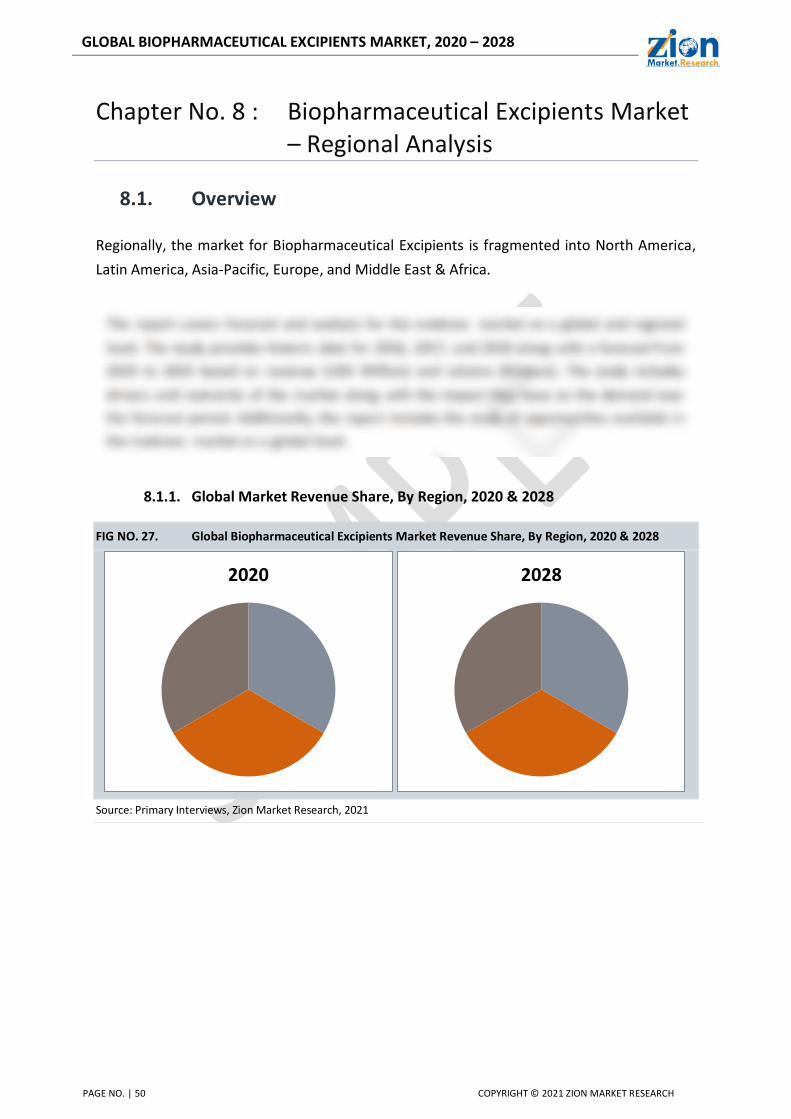
Chapter No. 8 : Biopharmaceutical Excipients Market – Regional Analysis
8.1. Overview
Regionally, the market for Biopharmaceutical Excipients is fragmented into North America,
Latin America, Asia-Pacific, Europe, and Middle East & Africa.
8.1.1. Global Market Revenue Share, By Region, 2020 & 2028
FIG NO. 27. Global Biopharmaceutical Excipients Market Revenue Share, By Region, 2020 & 2028
Source: Primary Interviews, Zion Market Research, 2021
2020 2028
GLOBAL BIOPHARMACEUTICAL EXCIPIENTS MARKET, 2020 – 2028
PAGE NO. | 51 COPYRIGHT © 2021 ZION MARKET RESEARCH
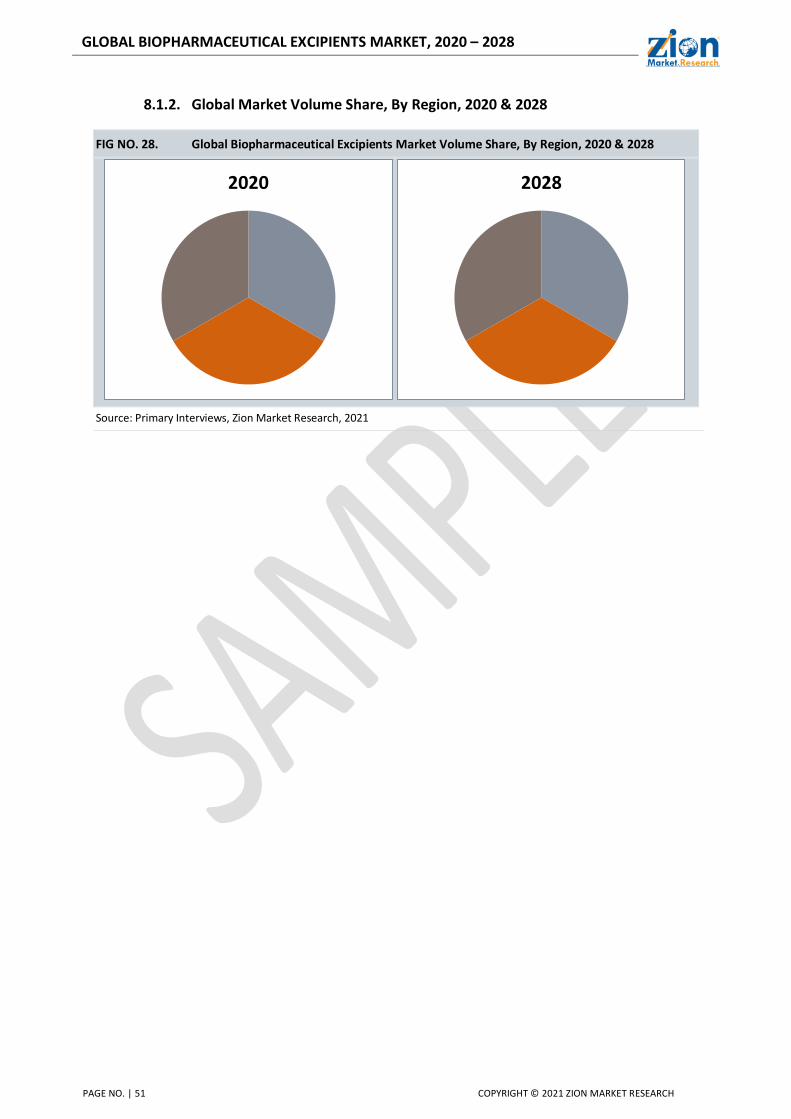
8.1.2. Global Market Volume Share, By Region, 2020 & 2028
FIG NO. 28. Global Biopharmaceutical Excipients Market Volume Share, By Region, 2020 & 2028
Source: Primary Interviews, Zion Market Research, 2021
2020 2028
GLOBAL BIOPHARMACEUTICAL EXCIPIENTS MARKET, 2020 – 2028
PAGE NO. | 52 COPYRIGHT © 2021 ZION MARKET RESEARCH
8.1.3. Global Market Revenue & Volume, By Region, 2016 – 2028 (USD Million) (K Tons)
TABLE NO. 24. : Global Biopharmaceutical Excipients Market Revenue & Volume, By Region, 2016 – 2028 (USD Million) (K Tons)
Region 2016 2017 2018 2019 2020 2021 2022 2023 2024 2025 2026 2027 2028 CAGR
North America
XX XX XX XX XX XX XX XX XX XX XX XX XX XX%
Europe XX XX XX XX XX XX XX XX XX XX XX XX XX XX%
Asia Pacific XX XX XX XX XX XX XX XX XX XX XX XX XX XX%
Latin America XX XX XX XX XX XX XX XX XX XX XX XX XX XX%
The Middle-East and Africa
XX XX XX XX XX XX XX XX XX XX XX XX XX XX%
Total XX XX XX XX XX XX XX XX XX XX XX XX XX XX%
Source: Primary Interviews, Zion Market Research, 2021
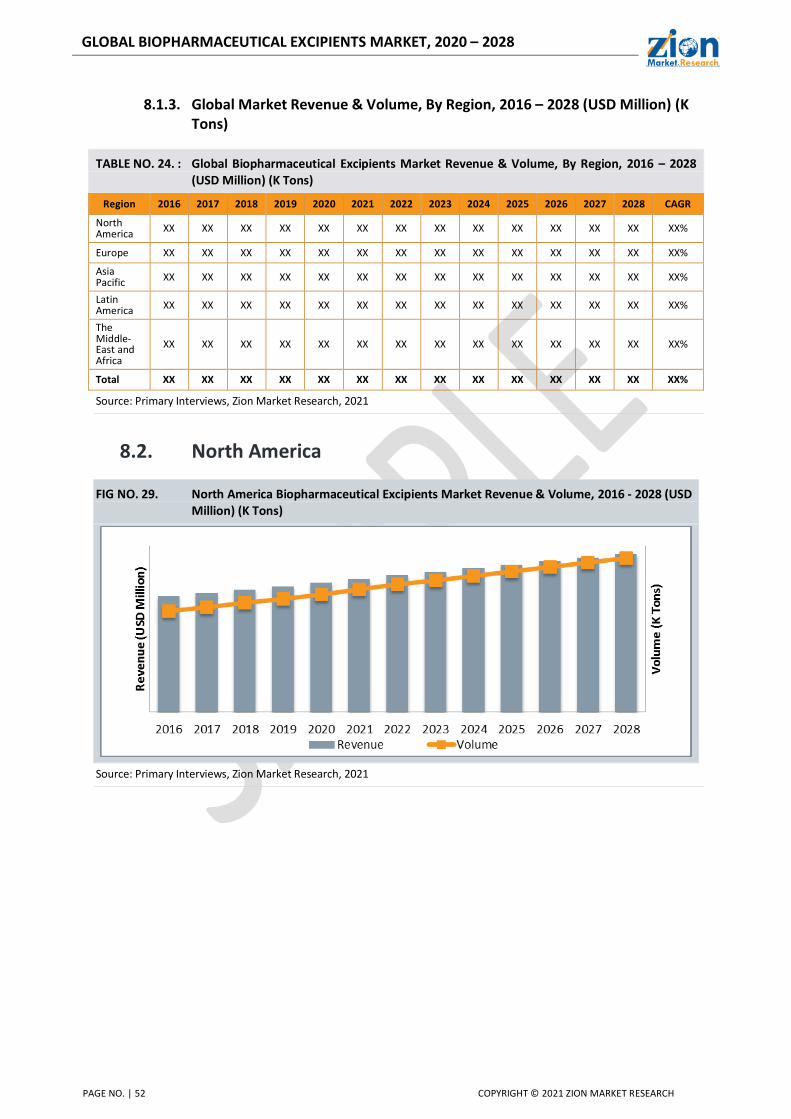
8.2. North America
FIG NO. 29. North America Biopharmaceutical Excipients Market Revenue & Volume, 2016 - 2028 (USD Million) (K Tons)
Source: Primary Interviews, Zion Market Research, 2021
GLOBAL BIOPHARMACEUTICAL EXCIPIENTS MARKET, 2020 – 2028
PAGE NO. | 53 COPYRIGHT © 2021 ZION MARKET RESEARCH
8.2.1. North America Market Revenue & Volume, By Country, 2016 – 2028 (USD Million) (K Tons)
TABLE NO. 25. : North America Biopharmaceutical Excipients Market Revenue & Volume, By Country, 2016 – 2028 (USD Million) (K Tons)
Country 2016 2017 2018 2019 2020 2021 2022 2023 2024 2025 2026 2027 2028 CAGR
U.S. XX XX XX XX XX XX XX XX XX XX XX XX XX XX%
Canada XX XX XX XX XX XX XX XX XX XX XX XX XX XX%
Mexico XX XX XX XX XX XX XX XX XX XX XX XX XX XX%
Total XX XX XX XX XX XX XX XX XX XX XX XX XX XX%
Source: Primary Interviews, Zion Market Research, 2021
8.2.2. North America Market Revenue & Volume, By Product, 2016 – 2028
TABLE NO. 26. : North America Biopharmaceutical Excipients Market Revenue & Volume, By Product, 2016 – 2028 (USD Million) (K Tons)
Product 2016 2017 2018 2019 2020 2021 2022 2023 2024 2025 2026 2027 2028 CAGR
Specialty Excipients
XX XX XX XX XX XX XX XX XX XX XX XX XX XX%
Solubilizers &
Surfactants/Emulsifiers
XX XX XX XX XX XX XX XX XX XX XX XX XX XX%
Polyols XX XX XX XX XX XX XX XX XX XX XX XX XX XX%
Carbohydrates
XX XX XX XX XX XX XX XX XX XX XX XX XX XX%
Total XX XX XX XX XX XX XX XX XX XX XX XX XX XX%
Source: Primary Interviews, Zion Market Research, 2021
8.2.3. North America Market Revenue & Volume, By Solubilizers & Surfactants/Emulsifiers, 2016 – 2028
TABLE NO. 27. : North America Biopharmaceutical Excipients Market Revenue & Volume, By Solubilizers & Surfactants/Emulsifiers, 2016 – 2028 (USD Million) (K Tons)
Solubilizers &
Surfactants/Emulsifiers
2016 2017 2018 2019 2020 2021 2022 2023 2024 2025 2026 2027 2028 CAGR
Triglycerides XX XX XX XX XX XX XX XX XX XX XX XX XX XX%
Esters XX XX XX XX XX XX XX XX XX XX XX XX XX XX%
Others XX XX XX XX XX XX XX XX XX XX XX XX XX XX%
Total XX XX XX XX XX XX XX XX XX XX XX XX XX XX%
Source: Primary Interviews, Zion Market Research, 2021
GLOBAL BIOPHARMACEUTICAL EXCIPIENTS MARKET, 2020 – 2028
PAGE NO. | 54 COPYRIGHT © 2021 ZION MARKET RESEARCH
8.2.4. North America Market Revenue & Volume, By Polyols, 2016 – 2028
TABLE NO. 28. : North America Biopharmaceutical Excipients Market Revenue & Volume, By Polyols, 2016 – 2028 (USD Million) (K Tons)
Polyols 2016 2017 2018 2019 2020 2021 2022 2023 2024 2025 2026 2027 2028 CAGR
Mannitol XX XX XX XX XX XX XX XX XX XX XX XX XX XX%
Sorbitol XX XX XX XX XX XX XX XX XX XX XX XX XX XX%
Others XX XX XX XX XX XX XX XX XX XX XX XX XX XX%
Total XX XX XX XX XX XX XX XX XX XX XX XX XX XX%
Source: Primary Interviews, Zion Market Research, 2021
8.2.5. North America Market Revenue & Volume, By Carbohydrates, 2016 – 2028
TABLE NO. 29. : North America Biopharmaceutical Excipients Market Revenue & Volume, By Carbohydrates, 2016 – 2028 (USD Million) (K Tons)
Carbohydrates
2016 2017 2018 2019 2020 2021 2022 2023 2024 2025 2026 2027 2028 CAGR
Sucrose XX XX XX XX XX XX XX XX XX XX XX XX XX XX%
Dextrose XX XX XX XX XX XX XX XX XX XX XX XX XX XX%
Starch XX XX XX XX XX XX XX XX XX XX XX XX XX XX%
Others XX XX XX XX XX XX XX XX XX XX XX XX XX XX%
Total XX XX XX XX XX XX XX XX XX XX XX XX XX XX%
Source: Primary Interviews, Zion Market Research, 2021
8.2.6. U.S.
8.2.7. Canada
8.2.8. Mexico
Note: Similar analysis as that of North America will be provided for the below mentioned regions and countries:
GLOBAL BIOPHARMACEUTICAL EXCIPIENTS MARKET, 2020 – 2028
PAGE NO. | 55 COPYRIGHT © 2021 ZION MARKET RESEARCH
8.3. Europe
8.3.1. Europe Market Revenue & Volume, By Country, 2016 – 2028 (USD Million) (K Tons)
8.3.2. Europe Market Revenue & Volume, By Product, 2016 – 2028
8.3.3. Europe Market Revenue & Volume, By Solubilizers & Surfactants/Emulsifiers, 2016 – 2028
8.3.4. Europe Market Revenue & Volume, By Polyols, 2016 – 2028
8.3.5. Europe Market Revenue & Volume, By Carbohydrates, 2016 – 2028
8.3.6. Germany
8.3.7. France
8.3.8. U.K.
8.3.9. Italy
8.3.10. Spain
8.3.11. Rest of Europe
GLOBAL BIOPHARMACEUTICAL EXCIPIENTS MARKET, 2020 – 2028
PAGE NO. | 56 COPYRIGHT © 2021 ZION MARKET RESEARCH
8.4. Asia Pacific
8.4.1. Asia Pacific Market Revenue & Volume, By Country, 2016 – 2028 (USD Million) (K Tons)
8.4.2. Asia Pacific Market Revenue & Volume, By Product, 2016 – 2028
8.4.3. Asia Pacific Market Revenue & Volume, By Solubilizers & Surfactants/Emulsifiers, 2016 – 2028
8.4.4. Asia Pacific Market Revenue & Volume, By Polyols, 2016 – 2028
8.4.5. Asia Pacific Market Revenue & Volume, By Carbohydrates, 2016 – 2028
8.4.6. China
8.4.7. Japan
8.4.8. India
8.4.9. South Korea
8.4.10. South-East Asia
8.4.11. Rest of Asia Pacific

GLOBAL BIOPHARMACEUTICAL EXCIPIENTS MARKET, 2020 – 2028
PAGE NO. | 57 COPYRIGHT © 2021 ZION MARKET RESEARCH
8.5. Latin America
8.5.1. Latin America Market Revenue & Volume, By Country, 2016 – 2028 (USD Million) (K Tons)
8.5.2. Latin America Market Revenue & Volume, By Product, 2016 – 2028
8.5.3. Latin America Market Revenue & Volume, By Solubilizers & Surfactants/Emulsifiers, 2016 – 2028
8.5.4. Latin America Market Revenue & Volume, By Polyols, 2016 – 2028
8.5.5. Latin America Market Revenue & Volume, By Carbohydrates, 2016 – 2028
8.5.6. Brazil
8.5.7. Argentina
8.5.8. Rest of Latin America
GLOBAL BIOPHARMACEUTICAL EXCIPIENTS MARKET, 2020 – 2028
PAGE NO. | 58 COPYRIGHT © 2021 ZION MARKET RESEARCH
8.6. The Middle-East and Africa
8.6.1. The Middle-East and Africa Market Revenue & Volume, By Country, 2016 – 2028 (USD Million) (K Tons)
8.6.2. The Middle-East and Africa Market Revenue & Volume, By Product, 2016 – 2028
8.6.3. The Middle-East and Africa Market Revenue & Volume, By Solubilizers & Surfactants/Emulsifiers, 2016 – 2028
8.6.4. The Middle-East and Africa Market Revenue & Volume, By Polyols, 2016 – 2028
8.6.5. The Middle-East and Africa Market Revenue & Volume, By Carbohydrates, 2016 – 2028
8.6.6. GCC Countries
8.6.7. South Africa
8.6.8. Rest of Middle-East Africa
GLOBAL BIOPHARMACEUTICAL EXCIPIENTS MARKET, 2020 – 2028
PAGE NO. | 59 COPYRIGHT © 2021 ZION MARKET RESEARCH
Chapter No. 9 : Biopharmaceutical Excipients Market – Industry Analysis
9.1. Introduction
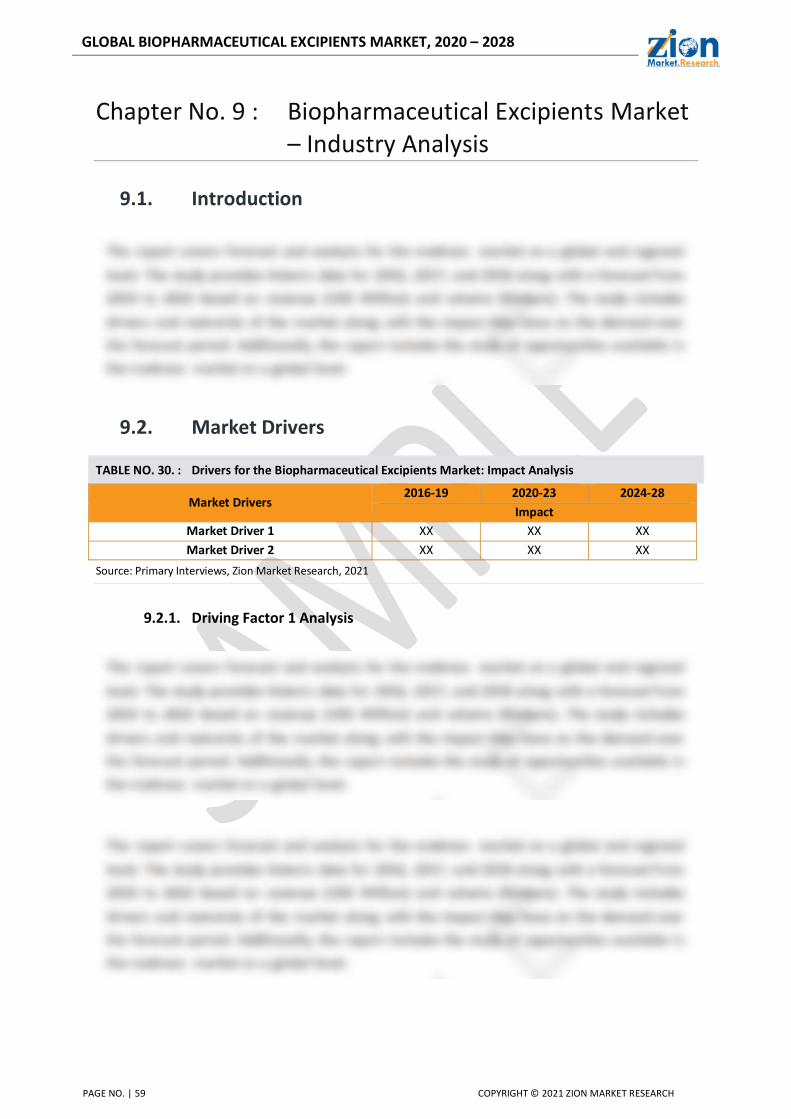
9.2. Market Drivers
TABLE NO. 30. : Drivers for the Biopharmaceutical Excipients Market: Impact Analysis
Market Drivers 2016-19 2020-23 2024-28
Impact
Market Driver 1 XX XX XX
Market Driver 2 XX XX XX
Source: Primary Interviews, Zion Market Research, 2021
9.2.1. Driving Factor 1 Analysis
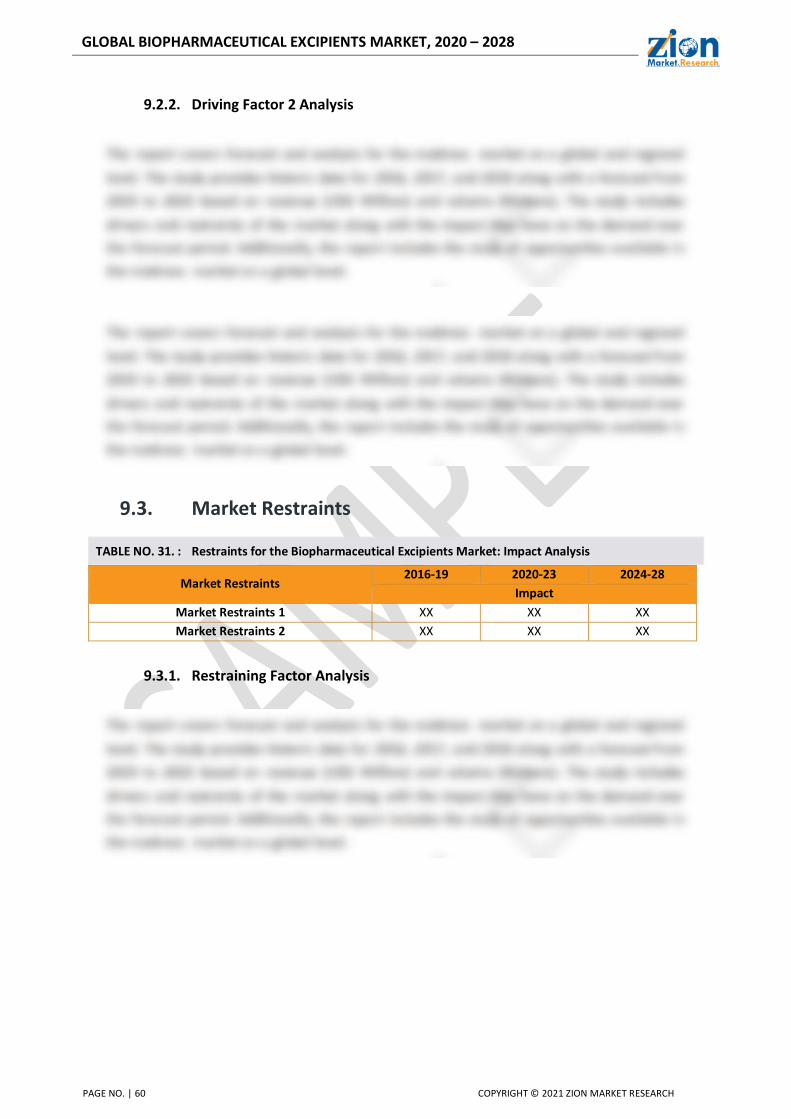
GLOBAL BIOPHARMACEUTICAL EXCIPIENTS MARKET, 2020 – 2028
PAGE NO. | 60 COPYRIGHT © 2021 ZION MARKET RESEARCH
9.2.2. Driving Factor 2 Analysis
9.3. Market Restraints
TABLE NO. 31. : Restraints for the Biopharmaceutical Excipients Market: Impact Analysis
Market Restraints 2016-19 2020-23 2024-28
Impact
Market Restraints 1 XX XX XX
Market Restraints 2 XX XX XX
9.3.1. Restraining Factor Analysis

GLOBAL BIOPHARMACEUTICAL EXCIPIENTS MARKET, 2020 – 2028
PAGE NO. | 61 COPYRIGHT © 2021 ZION MARKET RESEARCH
9.4. Market Opportunities
9.4.1. Market Opportunity Analysis
9.5. Porter’s Five Forces Analysis
FIG NO. 30. Porter’s Five Forces Analysis for Global Biopharmaceutical Excipients Market
Source: Zion Market Research Analysis 2021
XX
DEGREE OF COMPITITION
HIGH XX
SUPPLIER’S POWER
MODERATE XX
BUYER’S POWER
MODERATE XX
TRHEAT OF SUBSTITUTE MODERATE
XX
TRHEAT OF NEW ENTRANTS
MEDIUM
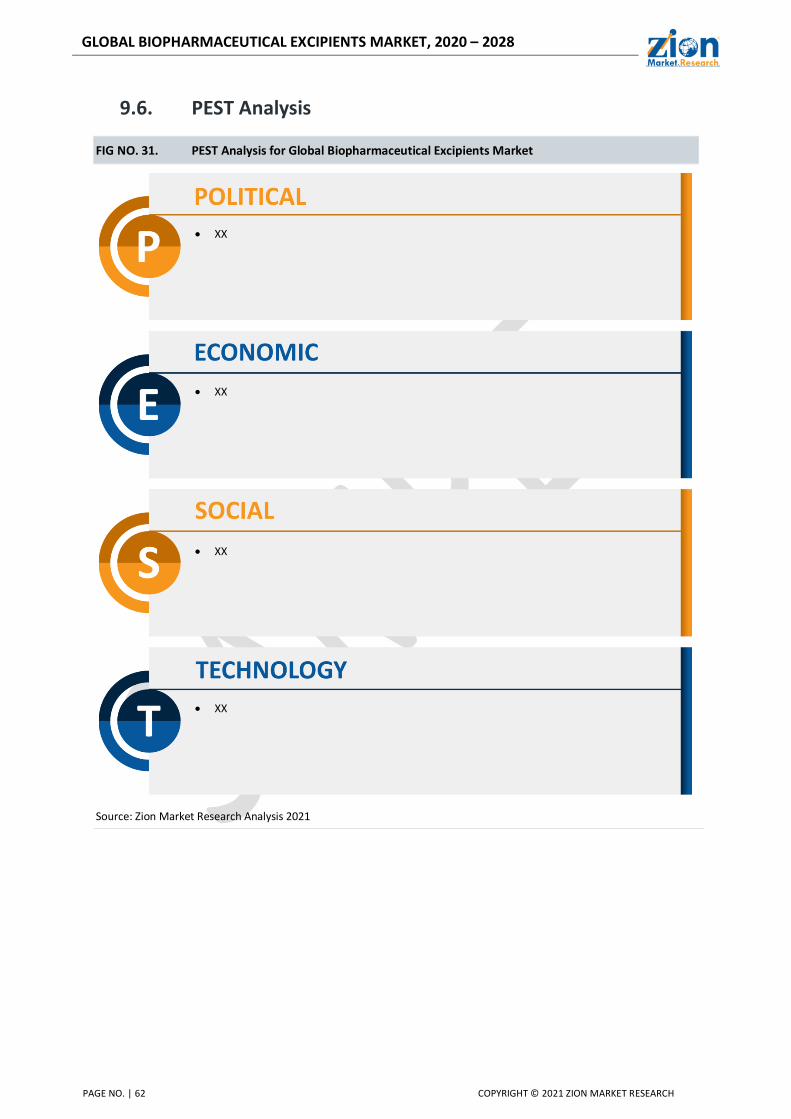
GLOBAL BIOPHARMACEUTICAL EXCIPIENTS MARKET, 2020 – 2028
PAGE NO. | 62 COPYRIGHT © 2021 ZION MARKET RESEARCH
9.6. PEST Analysis
FIG NO. 31. PEST Analysis for Global Biopharmaceutical Excipients Market
Source: Zion Market Research Analysis 2021
XX
XX
XX
XX
GLOBAL BIOPHARMACEUTICAL EXCIPIENTS MARKET, 2020 – 2028
PAGE NO. | 63 COPYRIGHT © 2021 ZION MARKET RESEARCH
9.7. Regulatory Landscape
9.8. Technology Landscape
9.9. Regional Market Trends
9.9.1. North America
9.9.2. Europe
9.9.3. Asia Pacific
9.9.4. Latin America
9.9.5. The Middle-East and Africa
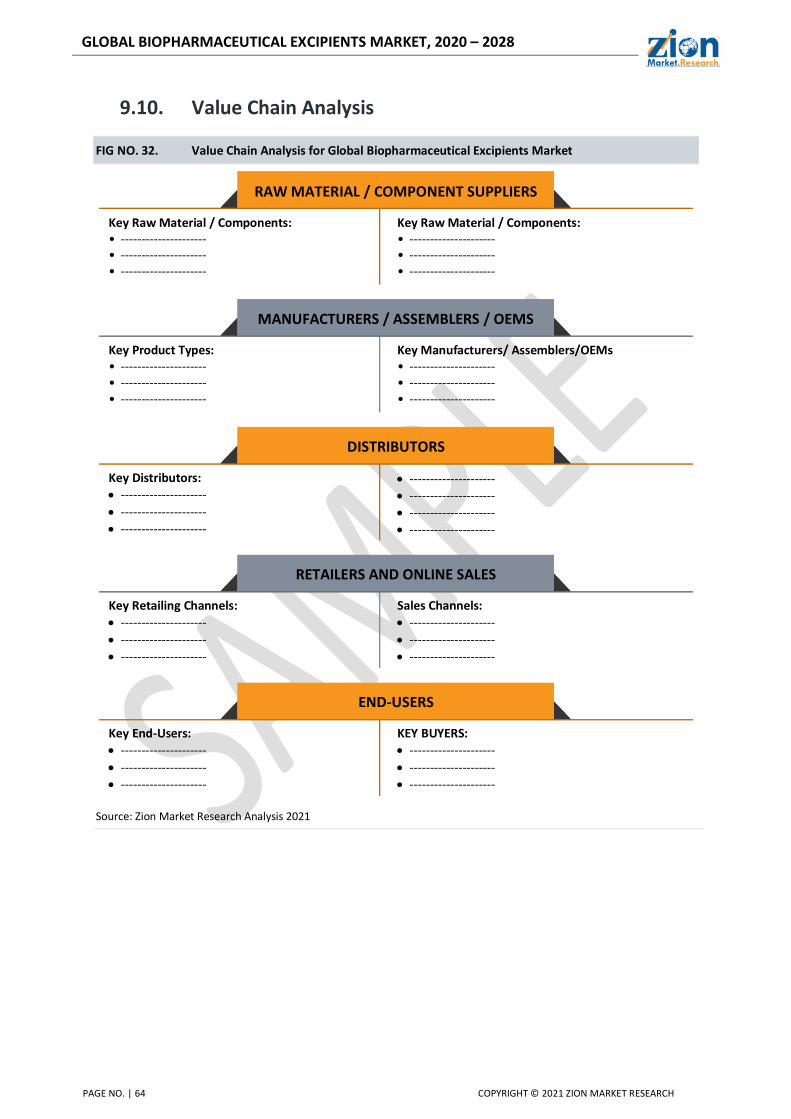
GLOBAL BIOPHARMACEUTICAL EXCIPIENTS MARKET, 2020 – 2028
PAGE NO. | 64 COPYRIGHT © 2021 ZION MARKET RESEARCH
9.10. Value Chain Analysis
FIG NO. 32. Value Chain Analysis for Global Biopharmaceutical Excipients Market
Source: Zion Market Research Analysis 2021
RAW MATERIAL / COMPONENT SUPPLIERS
Key Raw Material / Components: • --------------------- • --------------------- • ---------------------
Key Raw Material / Components: • --------------------- • --------------------- • ---------------------
MANUFACTURERS / ASSEMBLERS / OEMS
Key Product Types: • --------------------- • --------------------- • ---------------------
Key Manufacturers/ Assemblers/OEMs • --------------------- • --------------------- • ---------------------
DISTRIBUTORS
Key Distributors:
---------------------
---------------------
---------------------
---------------------
---------------------
---------------------
---------------------
RETAILERS AND ONLINE SALES
Key Retailing Channels:
---------------------
---------------------
---------------------
Sales Channels:
---------------------
---------------------
---------------------
END-USERS
Key End-Users:
---------------------
---------------------
---------------------
KEY BUYERS:
---------------------
---------------------
---------------------
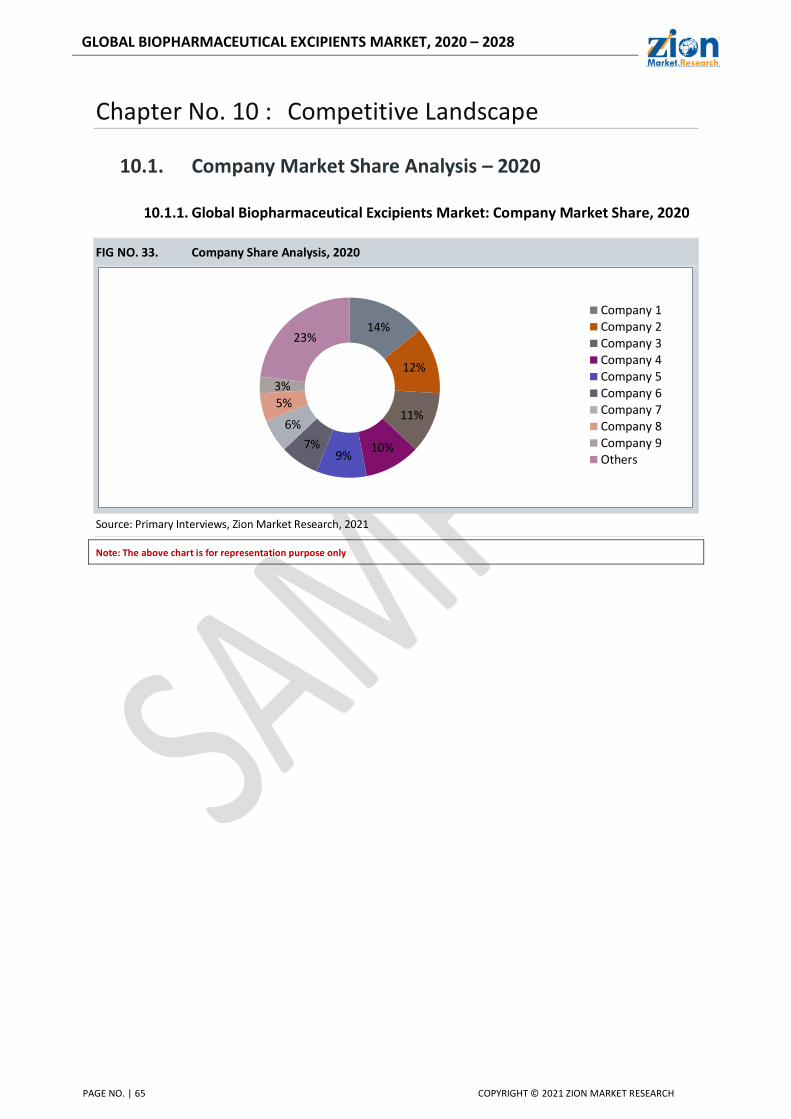
GLOBAL BIOPHARMACEUTICAL EXCIPIENTS MARKET, 2020 – 2028
PAGE NO. | 65 COPYRIGHT © 2021 ZION MARKET RESEARCH
Chapter No. 10 : Competitive Landscape
10.1. Company Market Share Analysis – 2020
10.1.1. Global Biopharmaceutical Excipients Market: Company Market Share, 2020
FIG NO. 33. Company Share Analysis, 2020
Source: Primary Interviews, Zion Market Research, 2021
Note: The above chart is for representation purpose only
14%
12%
11%
10%9%
7%
6%
5%
3%
23%
Company 1Company 2Company 3Company 4Company 5Company 6Company 7Company 8Company 9Others
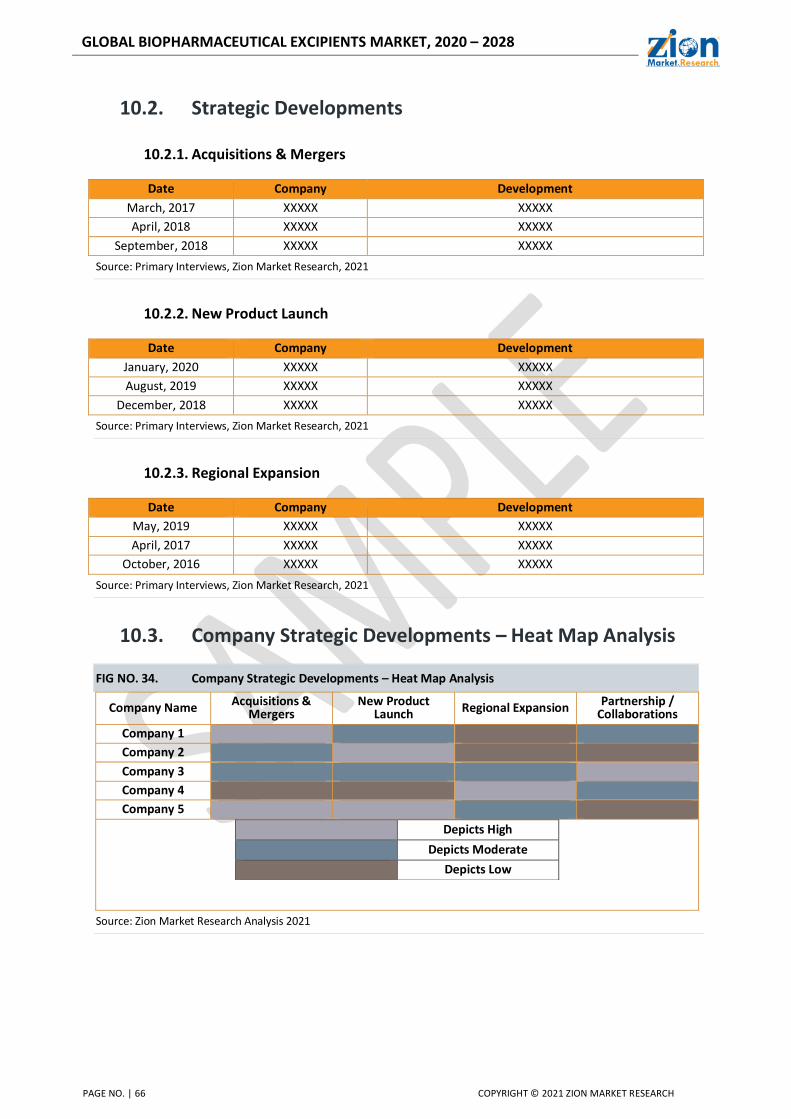
GLOBAL BIOPHARMACEUTICAL EXCIPIENTS MARKET, 2020 – 2028
PAGE NO. | 66 COPYRIGHT © 2021 ZION MARKET RESEARCH
10.2. Strategic Developments
10.2.1. Acquisitions & Mergers
Date Company Development
March, 2017 XXXXX XXXXX
April, 2018 XXXXX XXXXX
September, 2018 XXXXX XXXXX
Source: Primary Interviews, Zion Market Research, 2021
10.2.2. New Product Launch
Date Company Development
January, 2020 XXXXX XXXXX
August, 2019 XXXXX XXXXX
December, 2018 XXXXX XXXXX
Source: Primary Interviews, Zion Market Research, 2021
10.2.3. Regional Expansion
Date Company Development
May, 2019 XXXXX XXXXX
April, 2017 XXXXX XXXXX
October, 2016 XXXXX XXXXX
Source: Primary Interviews, Zion Market Research, 2021
10.3. Company Strategic Developments – Heat Map Analysis
FIG NO. 34. Company Strategic Developments – Heat Map Analysis
Company Name Acquisitions & Mergers
New Product Launch Regional Expansion Partnership /
Collaborations
Company 1
Company 2
Company 3
Company 4
Company 5
Depicts High
Depicts Moderate
Depicts Low
Source: Zion Market Research Analysis 2021
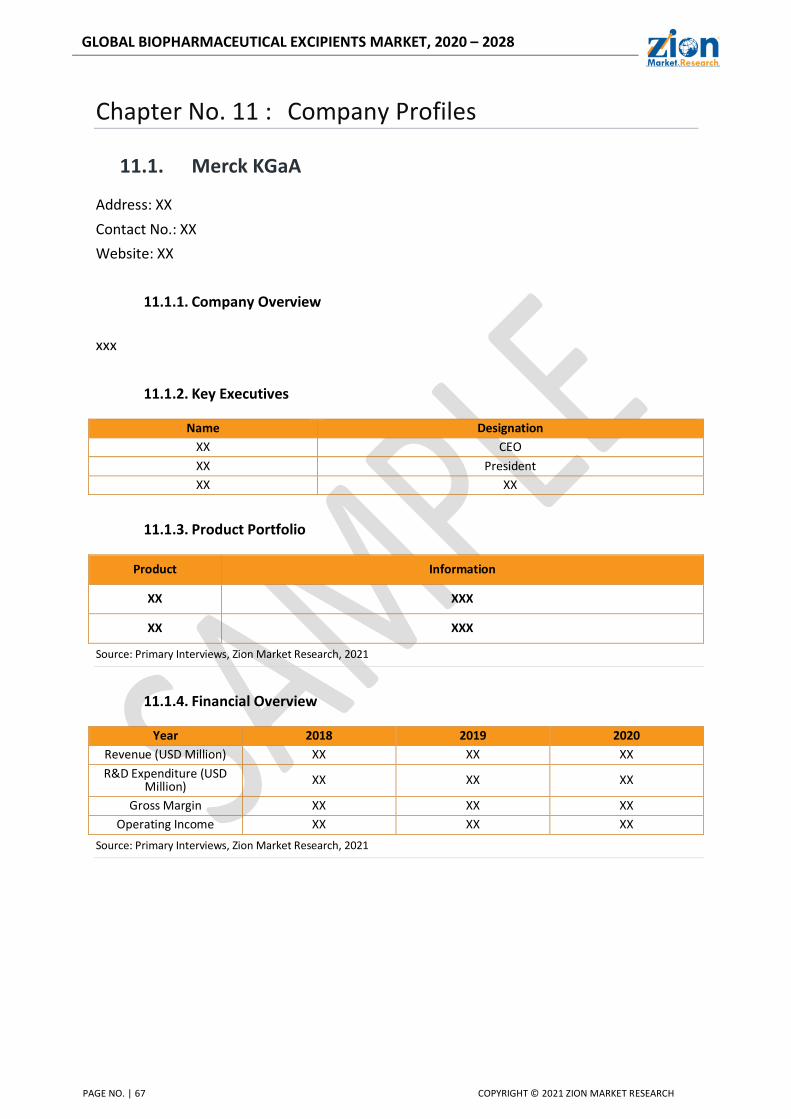
GLOBAL BIOPHARMACEUTICAL EXCIPIENTS MARKET, 2020 – 2028
PAGE NO. | 67 COPYRIGHT © 2021 ZION MARKET RESEARCH
Chapter No. 11 : Company Profiles
11.1. Merck KGaA
Address: XX
Contact No.: XX
Website: XX
11.1.1. Company Overview
xxx
11.1.2. Key Executives
Name Designation
XX CEO
XX President
XX XX
11.1.3. Product Portfolio
Product Information
XX XXX
XX XXX
Source: Primary Interviews, Zion Market Research, 2021
11.1.4. Financial Overview
Year 2018 2019 2020
Revenue (USD Million) XX XX XX
R&D Expenditure (USD Million) XX XX XX
Gross Margin XX XX XX
Operating Income XX XX XX
Source: Primary Interviews, Zion Market Research, 2021

GLOBAL BIOPHARMACEUTICAL EXCIPIENTS MARKET, 2020 – 2028
PAGE NO. | 68 COPYRIGHT © 2021 ZION MARKET RESEARCH
11.1.5. Operating Business Segments
Segment Description
XX XXX
XX XXX
Source: Primary Interviews, Zion Market Research, 2021
11.1.6. Business Performance
FIG NO. 35. Merck KGaA Business Segment Revenue Share, 2020 (%)
Source: Primary Interviews, Zion Market Research, 2021
Note: The above chart is for representation purpose only
FIG NO. 36. Merck KGaA Geographical Segment Revenue Share, 2020 (%)
Source: Primary Interviews, Zion Market Research, 2021
Note: The above chart is for representation purpose only
GLOBAL BIOPHARMACEUTICAL EXCIPIENTS MARKET, 2020 – 2028
PAGE NO. | 69 COPYRIGHT © 2021 ZION MARKET RESEARCH
11.1.7. Recent Developments
Date Development
February, 2019 XXX
July, 2019 XXX
October, 2019 XXX
Source: Primary Interviews, Zion Market Research, 2021
Similar analysis will be provided for the following companies:
11.2. Signet Chemical Corporation Pvt. Ltd.
11.3. Sigachi Industries Pvt. Ltd.
11.4. Spectrum Chemical Manufacturing Corp.
11.5. Roquette Frères
11.6. IMCD
11.7. Clariant
11.8. DFE Pharma
11.9. BASF SE
11.10. Evonik Industries AG
11.11. J. RETTENMAIER & SÖHNE GmbH + Co KG
Note: The number of companies mentioned above are not limited. We can include additional companies of your inter est.
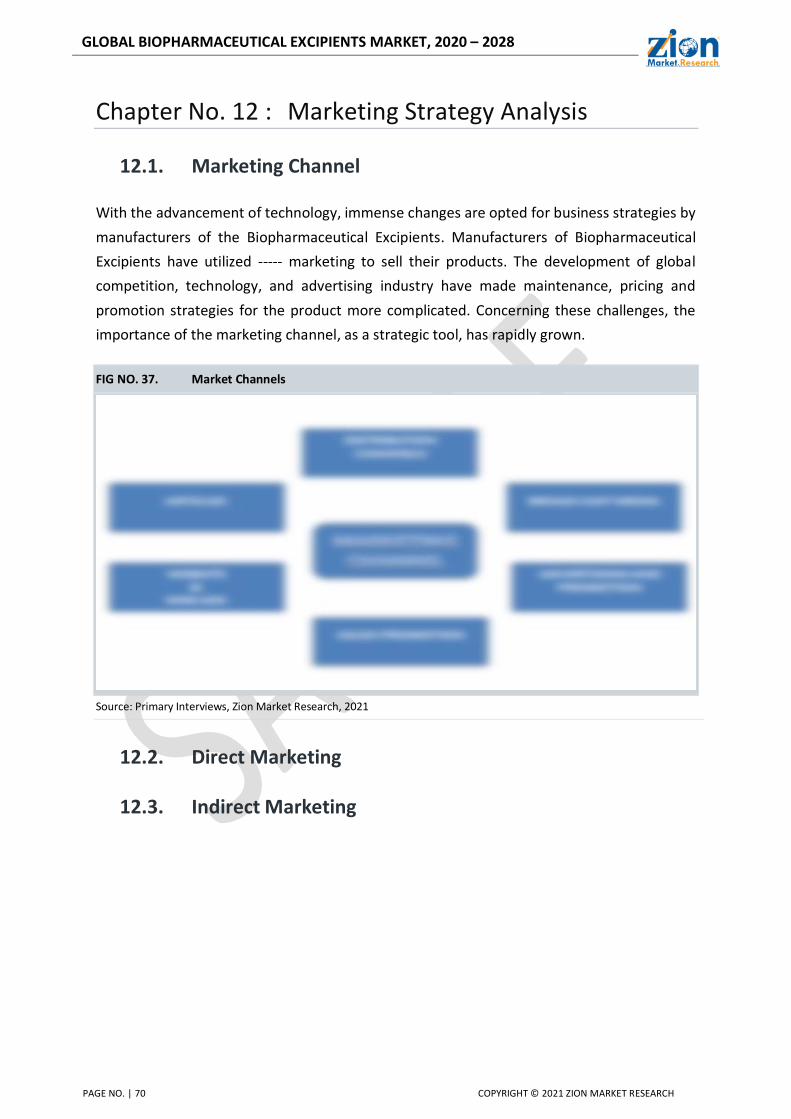
GLOBAL BIOPHARMACEUTICAL EXCIPIENTS MARKET, 2020 – 2028
PAGE NO. | 70 COPYRIGHT © 2021 ZION MARKET RESEARCH
Chapter No. 12 : Marketing Strategy Analysis
12.1. Marketing Channel
With the advancement of technology, immense changes are opted for business strategies by
manufacturers of the Biopharmaceutical Excipients. Manufacturers of Biopharmaceutical
Excipients have utilized ----- marketing to sell their products. The development of global
competition, technology, and advertising industry have made maintenance, pricing and
promotion strategies for the product more complicated. Concerning these challenges, the
importance of the marketing channel, as a strategic tool, has rapidly grown.
FIG NO. 37. Market Channels
Source: Primary Interviews, Zion Market Research, 2021
12.2. Direct Marketing
12.3. Indirect Marketing
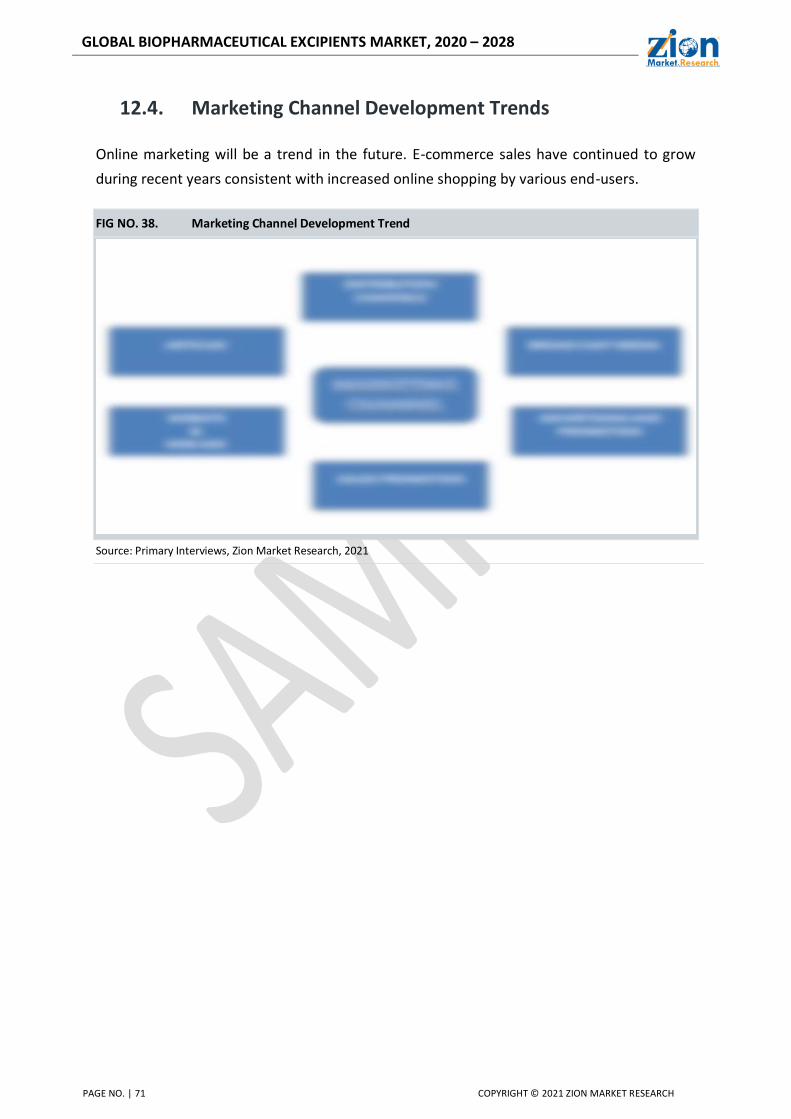
GLOBAL BIOPHARMACEUTICAL EXCIPIENTS MARKET, 2020 – 2028
PAGE NO. | 71 COPYRIGHT © 2021 ZION MARKET RESEARCH
12.4. Marketing Channel Development Trends
Online marketing will be a trend in the future. E-commerce sales have continued to grow
during recent years consistent with increased online shopping by various end-users.
FIG NO. 38. Marketing Channel Development Trend
Source: Primary Interviews, Zion Market Research, 2021

GLOBAL BIOPHARMACEUTICAL EXCIPIENTS MARKET, 2020 – 2028
PAGE NO. | 72 COPYRIGHT © 2021 ZION MARKET RESEARCH
Chapter No. 13 : Research Methodology
13.1. Research Methodology
The research methodology at ZMR is iterative in nature is usually conducted in three phases:
Secondary Research
Data Modeling
Primary Research
FIG NO. 39. Research Methodology – Detailed View
Source: Primary Interviews, Zion Market Research, 2021
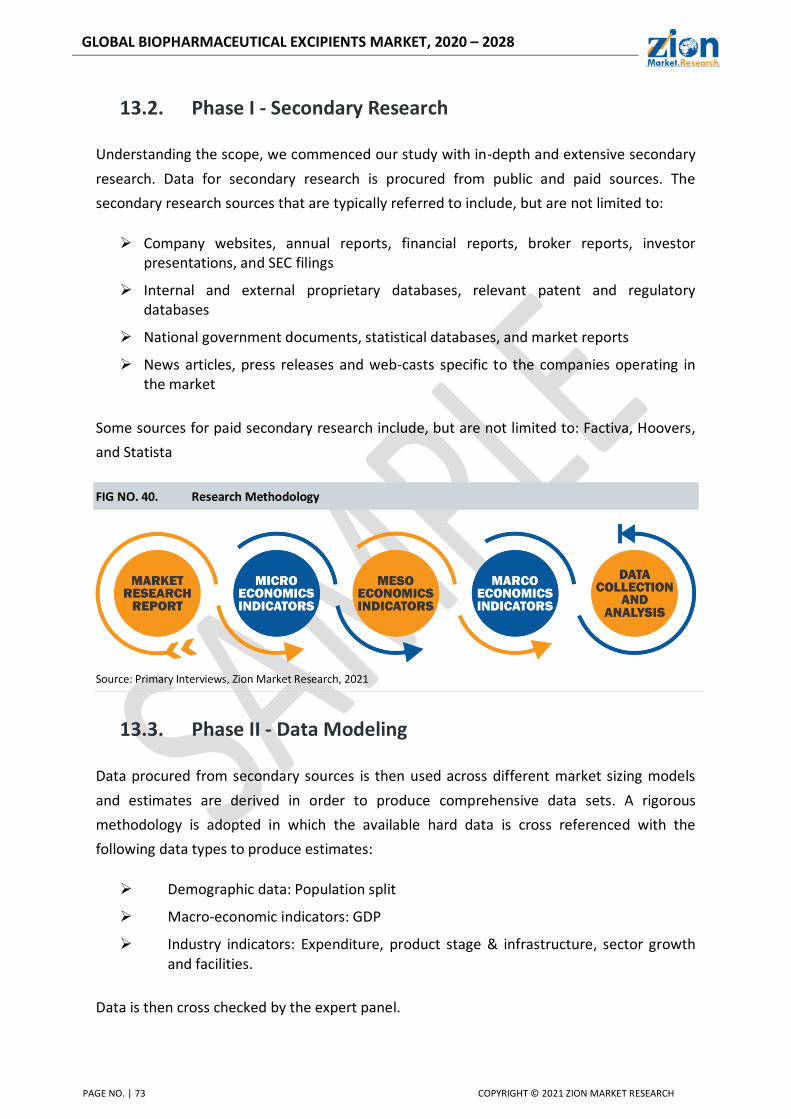
GLOBAL BIOPHARMACEUTICAL EXCIPIENTS MARKET, 2020 – 2028
PAGE NO. | 73 COPYRIGHT © 2021 ZION MARKET RESEARCH
13.2. Phase I - Secondary Research
Understanding the scope, we commenced our study with in-depth and extensive secondary
research. Data for secondary research is procured from public and paid sources. The
secondary research sources that are typically referred to include, but are not limited to:
Company websites, annual reports, financial reports, broker reports, investor presentations, and SEC filings
Internal and external proprietary databases, relevant patent and regulatory databases
National government documents, statistical databases, and market reports
News articles, press releases and web-casts specific to the companies operating in the market
Some sources for paid secondary research include, but are not limited to: Factiva, Hoovers,
and Statista
FIG NO. 40. Research Methodology
Source: Primary Interviews, Zion Market Research, 2021
13.3. Phase II - Data Modeling
Data procured from secondary sources is then used across different market sizing models
and estimates are derived in order to produce comprehensive data sets. A rigorous
methodology is adopted in which the available hard data is cross referenced with the
following data types to produce estimates:
Demographic data: Population split
Macro-economic indicators: GDP
Industry indicators: Expenditure, product stage & infrastructure, sector growth and facilities.
Data is then cross checked by the expert panel.
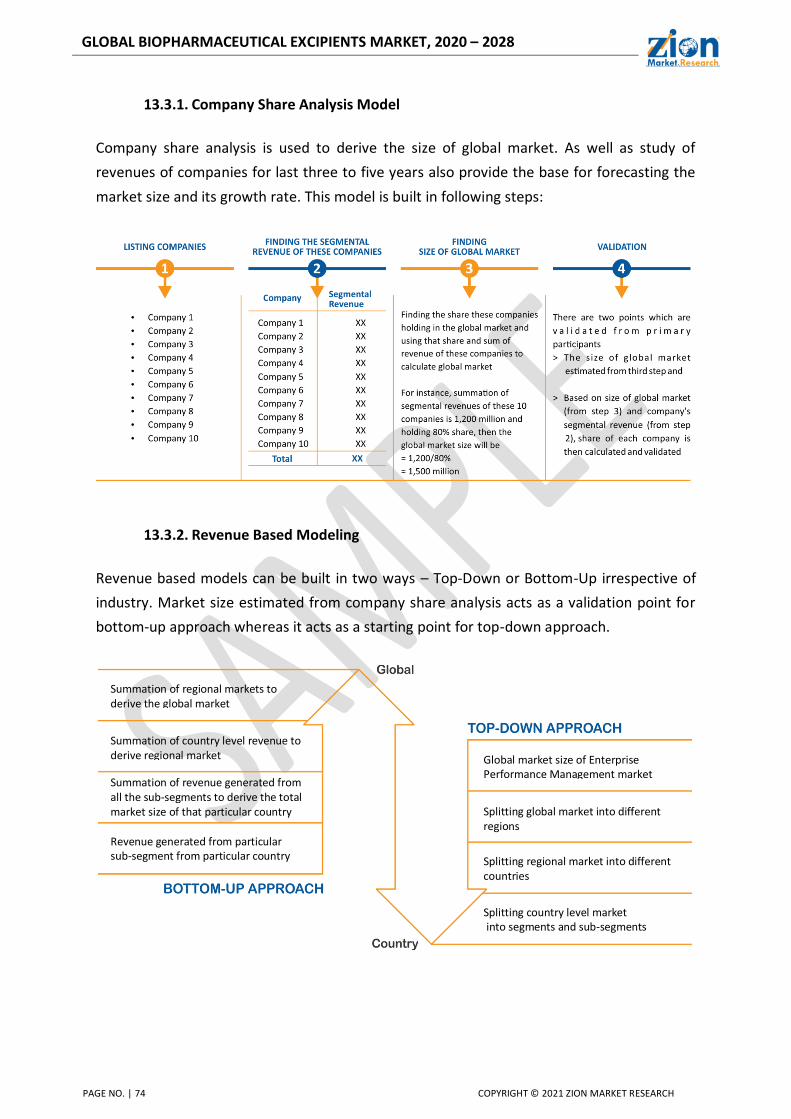
GLOBAL BIOPHARMACEUTICAL EXCIPIENTS MARKET, 2020 – 2028
PAGE NO. | 74 COPYRIGHT © 2021 ZION MARKET RESEARCH
13.3.1. Company Share Analysis Model
Company share analysis is used to derive the size of global market. As well as study of
revenues of companies for last three to five years also provide the base for forecasting the
market size and its growth rate. This model is built in following steps:
13.3.2. Revenue Based Modeling
Revenue based models can be built in two ways – Top-Down or Bottom-Up irrespective of
industry. Market size estimated from company share analysis acts as a validation point for
bottom-up approach whereas it acts as a starting point for top-down approach.
Summation of regional markets to derive the global market
Summation of country level revenue to derive regional market
Summation of revenue generated from all the sub-segments to derive the total market size of that particular country Revenue generated from particular sub-segment from particular country
Global market size of Enterprise Performance Management market
Splitting global market into different regions
Splitting country level market into segments and sub-segments
Splitting regional market into different countries
GLOBAL BIOPHARMACEUTICAL EXCIPIENTS MARKET, 2020 – 2028
PAGE NO. | 75 COPYRIGHT © 2021 ZION MARKET RESEARCH
13.4. Phase III - Primary Research
Information from secondary is used to build data models. The results obtained from data
models are then validated from primary participants. Then cycle repeats where, according
to inputs from primary participants, additional secondary research is done and new
information is again incorporated into the data model. The process continues till the desired
level of information is generated.
We conduct primary interviews on an ongoing basis with industry participants and
commentators in order to validate data and analysis. A typical research interview fulfills the
following functions:
It provides first-hand information on the market size, market trends, growth trends, competitive landscape, and future outlook.
Helps in validating and strengthening the secondary research findings
Further develops the analysis team’s expertise and market understanding
Primary research involves E-mail interactions, telephonic interviews as well as face-to-face interviews for each market, category, segment, and sub-segment across geographies
The participants who typically take part in such a process include, but are not limited to:
Industry participants: CEOs, VPs, marketing/ product managers, market intelligence managers, and national sales managers
Purchasing managers, technical personnel, distributors and resellers
Outside experts: Investors, valuation experts, research analysts specializing in specific markets
Key opinion leaders specializing in different areas corresponding to different industry verticals
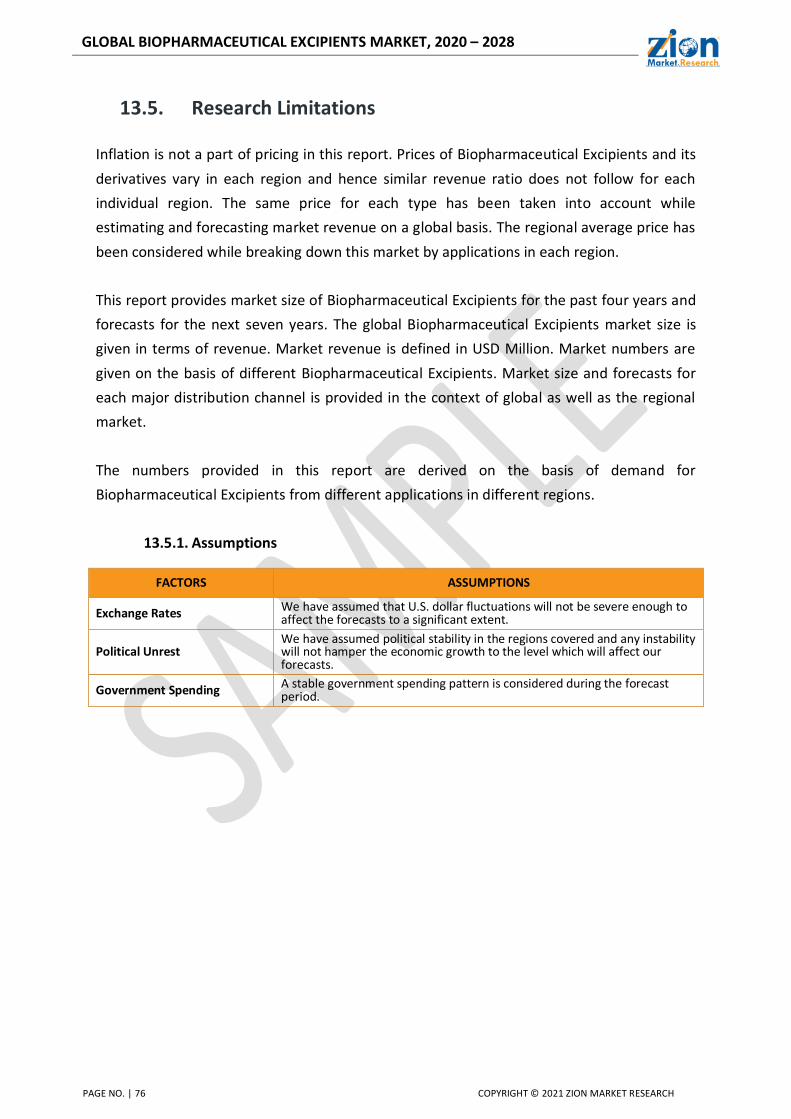
GLOBAL BIOPHARMACEUTICAL EXCIPIENTS MARKET, 2020 – 2028
PAGE NO. | 76 COPYRIGHT © 2021 ZION MARKET RESEARCH
13.5. Research Limitations
Inflation is not a part of pricing in this report. Prices of Biopharmaceutical Excipients and its
derivatives vary in each region and hence similar revenue ratio does not follow for each
individual region. The same price for each type has been taken into account while
estimating and forecasting market revenue on a global basis. The regional average price has
been considered while breaking down this market by applications in each region.
This report provides market size of Biopharmaceutical Excipients for the past four years and
forecasts for the next seven years. The global Biopharmaceutical Excipients market size is
given in terms of revenue. Market revenue is defined in USD Million. Market numbers are
given on the basis of different Biopharmaceutical Excipients. Market size and forecasts for
each major distribution channel is provided in the context of global as well as the regional
market.
The numbers provided in this report are derived on the basis of demand for
Biopharmaceutical Excipients from different applications in different regions.
13.5.1. Assumptions
FACTORS ASSUMPTIONS
Exchange Rates We have assumed that U.S. dollar fluctuations will not be severe enough to affect the forecasts to a significant extent.
Political Unrest We have assumed political stability in the regions covered and any instability will not hamper the economic growth to the level which will affect our forecasts.
Government Spending A stable government spending pattern is considered during the forecast period.
GLOBAL BIOPHARMACEUTICAL EXCIPIENTS MARKET, 2020 – 2028
PAGE NO. | 77 COPYRIGHT © 2021 ZION MARKET RESEARCH
Disclaimer
Any part of this report cannot be reproduced, kept in a retrieval system or transmitted in
any kind by any means, electronic, mechanical, photocopying, recording or otherwise,
without the prior permission of the publisher, Zion Market Research.
The information and opinions in this report were prepared by Zion Market Research. The
information herein is believed to be reliable and has been obtained from public source
believed to be reliable. All info provided in this report is provided for information purposes
solely.
The facts of this report are believed to be correct at the time of publication however cannot
be assured. Please note that the judgments, conclusions and recommendations that Zion
Market Research delivers can be based on information gathered in good faith from each
primary and secondary sources, we have a tendency to be always in a position to ensure.
Research can initiate, update and cease coverage alone at the discretion of Zion Market
Research.
Zion Market Research has no obligation to notify a recipient thereof within the event that
any estimation, forecast, changes or subsequently becomes inaccurate.
As such Zion Market Research will accept no liability whatever for actions taken based
mostly on any information that could subsequently prove to be incorrect.
Asia Pacific Office
3rd Floor, Mrunal Paradise,
Opp. Maharaja Hotel, Pimple Gurav,
Pune 411061,
Maharashtra, India
Phone No 020 -65322355
Corporate Office
244 Fifth Avenue, Suite N202, New York
10001, United States
USA/Canada
Toll Free No.1-855-465-4651
Mail ID: [email protected]