Embed Size (px)
Citation preview

After years of excellent growth, the market environment is getting difficult
August 2019
Global Automotive Supplier Study 2019
2
Contents
© Roland Berger/Lazard
The status
Increasingly difficult environ-ment after record profits until last year
A
Roland Berger and Lazard Automotive teams
The contacts
DThe strategies
Suppliers have different opportunities to prepare for the future
CThe future
The transfor-mation of the automotive industry is well underway
B

3
Executive Summary (1/2)
> After record years, the automotive industry is facing a difficult time with multiple market uncertainties and a global production volume decline by -5% in H1/2019 vs. H1/2018
> Especially the slowdown in the world's largest market, China, since H2/2018 is causing problems for the global suppliers
> As a result – 2019 will not be a year of recovery, but rather stay challenging for automotive suppliers. The average industry margin is expected to fall below 7% for the first time in the last seven years driving sector valuations below 10-year average
> Amidst a weakening market environment some structural changes have taken place:
Profitability of China/NAFTA-based suppliers is shrinking. However, it is still better than that of European peers. Although Japanese suppliers improved in comparison with previous years, they remain well below other regions
Tire and chassis suppliers are leading in margins. Interior players remain at the bottom of the automotive suppliers field
Profitability of product innovators came down to 7.3% EBIT margin in the last year, reducing their relative advantage in comparison with process specialists
> Digitization appears to be one of the most important near-term topics for suppliers as it touches multiple dimensions: the potential to create new business models, offer new products and services, and improve the efficiency of operational and administrative processes
> In the long term the mobility landscape of today will change – especially as new market entrants possess a non-automotive mindset and capture parts of the future automotive business
Source: Roland Berger/Lazard

4
Executive Summary (2/2)
> For traditional automotive suppliers the risks in the market are high: on the one hand, they could potentially miss out on new revenue opportunities, and on the other hand, they face increasing price pressure from the OEM side, who have to deal with increasing capital requirements and declining profit pools themselves
> For traditional suppliers, access to capital may become tougher. Equity investors favor other industries whereas financing banks are becoming more cautious about cyclicality and long-term threats, especially for many small traditional suppliers. In addition, M&A activities in the sector have gone down recently, with Chinese investors, representing an important buyer group, becoming less active
> While many small traditional players will face difficult times, new global entrants and technology system integrators are generally well-positioned for tomorrow's changes. Performance-improvement programs, accelerated capacity adjustments and pro-active portfolio management are recommended countermeasures for most suppliers
Source: Roland Berger/Lazard
5
Contents
© Roland Berger/Lazard
The status
Increasingly difficult environ-ment after record profits until last year
A
Roland Berger and Lazard Automotive teams
The contacts
DThe strategies
Suppliers have different opportunities to prepare for the future
CThe future
The transfor-mation of the automotive industry is well underway
B

6
Within the first half of 2019 the global automotive markets significantly weakened relative to 2018
Recent developments in the automotive industry
12.4
6.0
6.6
1.7
8.7
H1/2018
11.9
5.6
6.5
13.5
1.7
8.6
48.4
11.2
H1/2019
Others
Japan/South Korea
South America
NAFTA
Europe2)
China3)
46.0
-5%
H1/18 vs. H1/19 [m units]1)
Source: IHS May/June 2019, Automotive, Roland Berger/Lazard
Automotive headlines
"Again a Schaeffler profit warning"Handelsblatt Online – 07/19
"Lear 2Q Profit Falls Amid Global Vehicle Production Decline"Dow Jones Institutional News –07/19
"Nissan to Cut 12,500 Jobs as Its Profit Plunges"Dow Jones Newswires Chinese –07/19
"Insolvency of Eisenmann Group – Next large automotive supplier failed"
Wirtschaftswoche Online – 07/19
"Weak automotive economy starting to badger Hella"Reuters – 07/19
"Ford's Shrinking China Business Is Hurting Its Global Ambitions"Dow Jones Institutional News –07/19
"Renault Profit Drops, Hit by Lower Sales, Nissan Payout"Dow Jones Institutional News –07/19
"U.S. auto sales seen slipping in July"ReutersNews – 07/19
"Bosch sees car production falling 5% in 2019"ReutersNews – 07/19
"There is a storm brewing"AUTOMOBIL PRODUKTION –07/19
"Michelin margins hit by auto slump despite price hikes"ReutersNews – 07/19
"Goodyear Tire & Rubber's Profit, Revenue Miss Estimates"Dow Jones Institutional News –07/19
"Slackness in sales –Automotive economy in the downturn"Handelsblatt Online – 07/19
"Due to weakening automotive markets press supplier Schuler cuts 500 jobs"Handelsblatt – 07/19
1) Global light vehicle production volume 2) Excluding CIS and Turkey 3) Greater China

7
2018 production was lower than 2017, driven by weakness in Triad market in H2/2018 – Further decline expected in 2019
World
NAFTA Europe3) China4)
Japan/Korea
CAGR2): -0.1% CAGR2): 2.3% CAGR2): 1.7%
CAGR2): 1.9% CAGR2): -0.9%
201820152014 2016 2017 2019e
17.0 17.5 17.8 17.1 17.0 16.7
-2%
20162014 2018
18.9
2015
18.6
2019e
18.7
2017
16.9 18.1 18.1
-2%
28.0
2014
27.4
2015 2017 2019e2016 2018
23.0 24.0 26.9 25.0
-7%
South America
CAGR2): -2.8%
20182014 2015 2016 2019e2017
3.8 3.1 2.7 3.3 3.4 3.6
+4%
20152014 2016
13.2
2017 2019e2018
13.7 13.2 12.9 13.2 13.1
-1%
20182014 20162015 2017 2019e
87.4 88.8 93.1 95.1 94.2 91.4
-3%
Global light vehicle production volume1) by region, 2014-2019e [m units]
Source: IHS May/June 2019, Roland Berger/Lazard
1) Incl. light commercial vehicles; 2) CAGR 2014-2018; 3) Excluding CIS and Turkey; 4) Greater China
Most recent expectations announced by many large suppliers as part of their H1/2019 earnings even -5%.

8Source: Company information, analyst forecasts, Lazard/Roland Berger supplier database
Growth and profit of previous years come to an end – Average 2019 EBIT margin likely <7% for the first time in the last seven years
Revenue growth EBIT margin [%]
5 7 6 62 3 1
-5
100107
113120 123 126 127
~120–125
2012 20162013 201820172014 2015 2019e
2012
6.87.17.2 7.3
2013 2014 2015
7.1
2016
7.2
2017
7.2
2018
~6.0–6.3
2019e
Key supplier performance indicators, 2012-2019e (n=~600 suppliers)
Indexed [2012=100]
YoY [%]
9
Impacted by the economic crisis
10-y-Ø = 6.0x2)
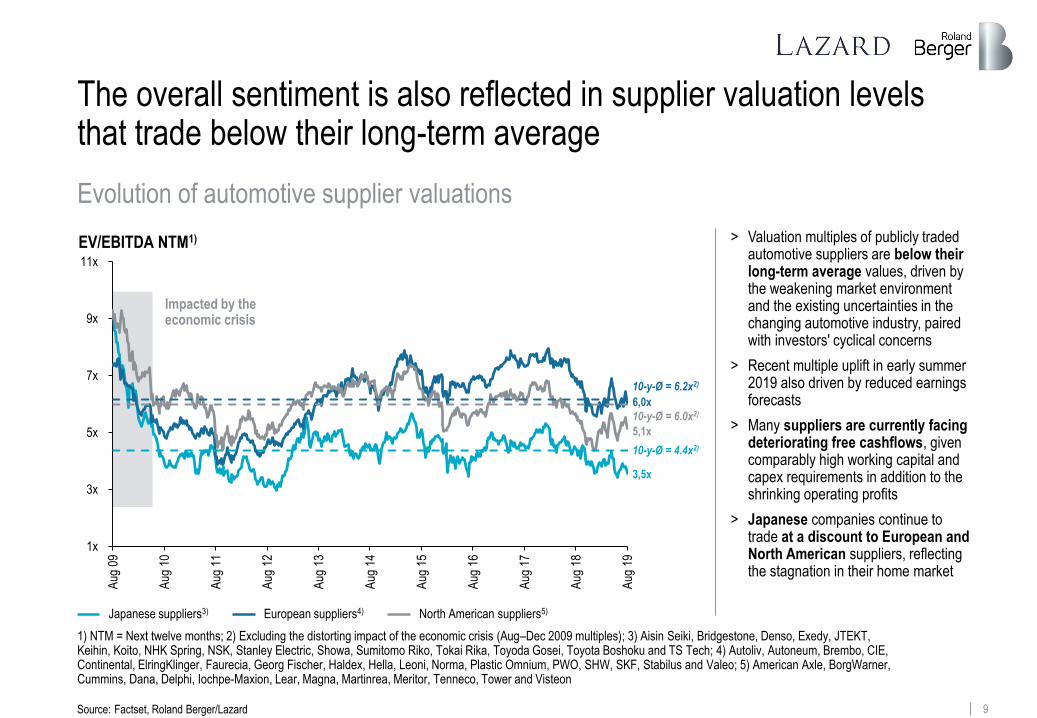
The overall sentiment is also reflected in supplier valuation levels that trade below their long-term average
Source: Factset, Roland Berger/Lazard
EV/EBITDA NTM1)
3,5x
6,0x
5,1x
1x
3x
5x
7x
9x
11x
Aug
09
Aug
10
Aug
11
Aug
12
Aug
13
Aug
14
Aug
15
Aug
16
Aug
17
Aug
18
Aug
19
Japanese suppliers3) European suppliers4) North American suppliers5)
10-y-Ø = 6.2x2)
10-y-Ø = 4.4x2)
Evolution of automotive supplier valuations
1) NTM = Next twelve months; 2) Excluding the distorting impact of the economic crisis (Aug–Dec 2009 multiples); 3) Aisin Seiki, Bridgestone, Denso, Exedy, JTEKT, Keihin, Koito, NHK Spring, NSK, Stanley Electric, Showa, Sumitomo Riko, Tokai Rika, Toyoda Gosei, Toyota Boshoku and TS Tech; 4) Autoliv, Autoneum, Brembo, CIE, Continental, ElringKlinger, Faurecia, Georg Fischer, Haldex, Hella, Leoni, Norma, Plastic Omnium, PWO, SHW, SKF, Stabilus and Valeo; 5) American Axle, BorgWarner, Cummins, Dana, Delphi, Iochpe-Maxion, Lear, Magna, Martinrea, Meritor, Tenneco, Tower and Visteon
> Valuation multiples of publicly traded automotive suppliers are below their long-term average values, driven by the weakening market environment and the existing uncertainties in the changing automotive industry, paired with investors' cyclical concerns
> Recent multiple uplift in early summer 2019 also driven by reduced earnings forecasts
> Many suppliers are currently facing deteriorating free cashflows, given comparably high working capital and capex requirements in addition to the shrinking operating profits
> Japanese companies continue to trade at a discount to European and North American suppliers, reflecting the stagnation in their home market
10
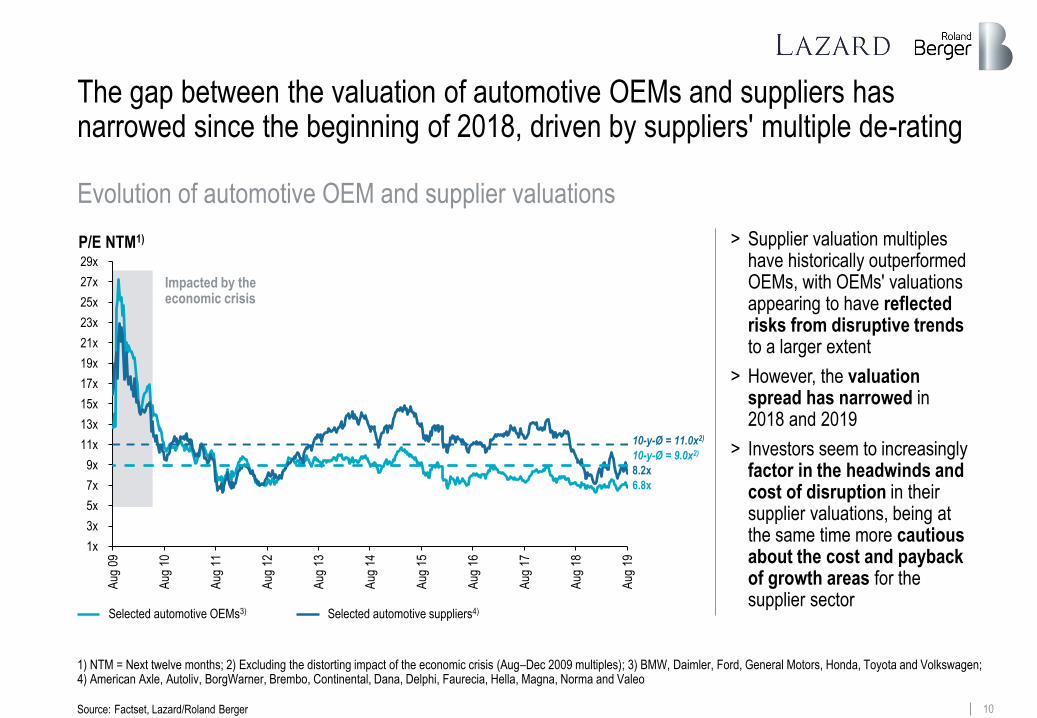
The gap between the valuation of automotive OEMs and suppliers has narrowed since the beginning of 2018, driven by suppliers' multiple de-rating
Source: Factset, Lazard/Roland Berger
P/E NTM1)
1x
3x
5x
7x
9x
11x
13x
15x
17x
19x
21x
23x
25x
27x
29x
Aug
09
Aug
10
Aug
11
Aug
12
Aug
13
Aug
14
Aug
15
Aug
16
Aug
17
Aug
18
Aug
19
Selected automotive OEMs3) Selected automotive suppliers4)
10-y-Ø = 11.0x2)
6.8x
10-y-Ø = 9.0x2)
8.2x
Evolution of automotive OEM and supplier valuations
1) NTM = Next twelve months; 2) Excluding the distorting impact of the economic crisis (Aug–Dec 2009 multiples); 3) BMW, Daimler, Ford, General Motors, Honda, Toyota and Volkswagen; 4) American Axle, Autoliv, BorgWarner, Brembo, Continental, Dana, Delphi, Faurecia, Hella, Magna, Norma and Valeo
Impacted by the economic crisis
> Supplier valuation multiples have historically outperformed OEMs, with OEMs' valuations appearing to have reflected risks from disruptive trends to a larger extent
> However, the valuation spread has narrowed in 2018 and 2019
> Investors seem to increasingly factor in the headwinds and cost of disruption in their supplier valuations, being at the same time more cautious about the cost and payback of growth areas for the supplier sector
11
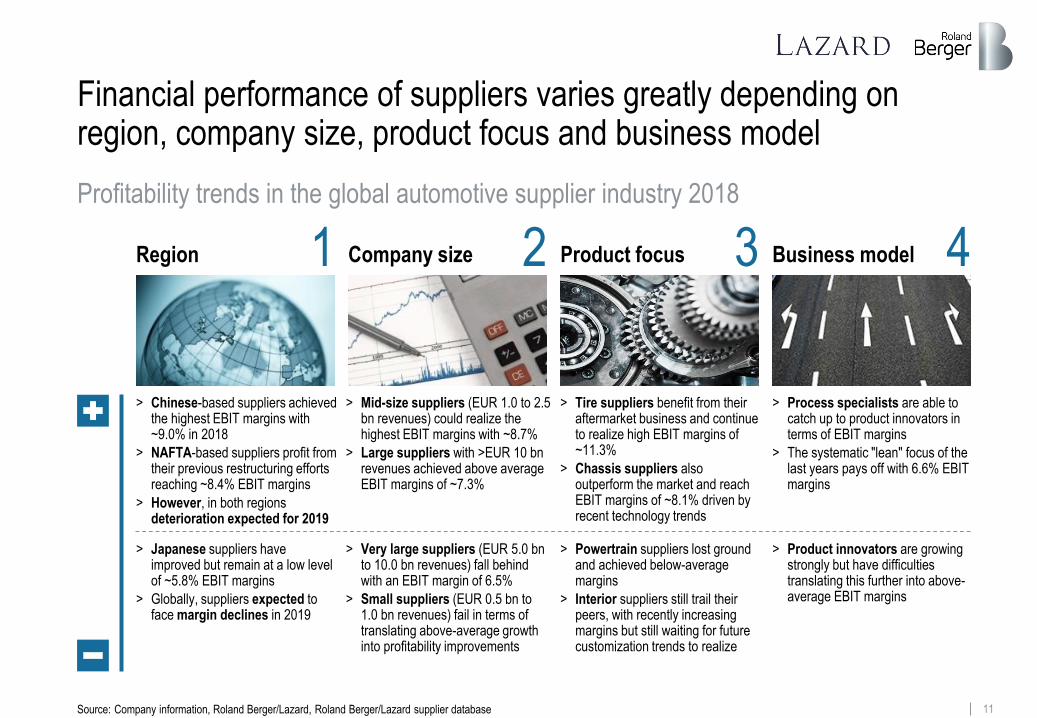
Financial performance of suppliers varies greatly depending on region, company size, product focus and business model
Source: Company information, Roland Berger/Lazard, Roland Berger/Lazard supplier database
> Chinese-based suppliers achieved the highest EBIT margins with ~9.0% in 2018
> NAFTA-based suppliers profit from their previous restructuring efforts reaching ~8.4% EBIT margins
> However, in both regions deterioration expected for 2019
Region Company size Product focus Business model1 2 3 4Profitability trends in the global automotive supplier industry 2018
> Japanese suppliers have improved but remain at a low level of ~5.8% EBIT margins
> Globally, suppliers expected to face margin declines in 2019
> Mid-size suppliers (EUR 1.0 to 2.5 bn revenues) could realize the highest EBIT margins with ~8.7%
> Large suppliers with >EUR 10 bn revenues achieved above average EBIT margins of ~7.3%
> Very large suppliers (EUR 5.0 bn to 10.0 bn revenues) fall behind with an EBIT margin of 6.5%
> Small suppliers (EUR 0.5 bn to 1.0 bn revenues) fail in terms of translating above-average growth into profitability improvements
> Tire suppliers benefit from their aftermarket business and continue to realize high EBIT margins of ~11.3%
> Chassis suppliers also outperform the market and reach EBIT margins of ~8.1% driven by recent technology trends
> Powertrain suppliers lost ground and achieved below-average margins
> Interior suppliers still trail their peers, with recently increasing margins but still waiting for future customization trends to realize
> Product innovators are growing strongly but have difficulties translating this further into above-average EBIT margins
> Process specialists are able to catch up to product innovators in terms of EBIT margins
> The systematic "lean" focus of the last years pays off with 6.6% EBIT margins
12
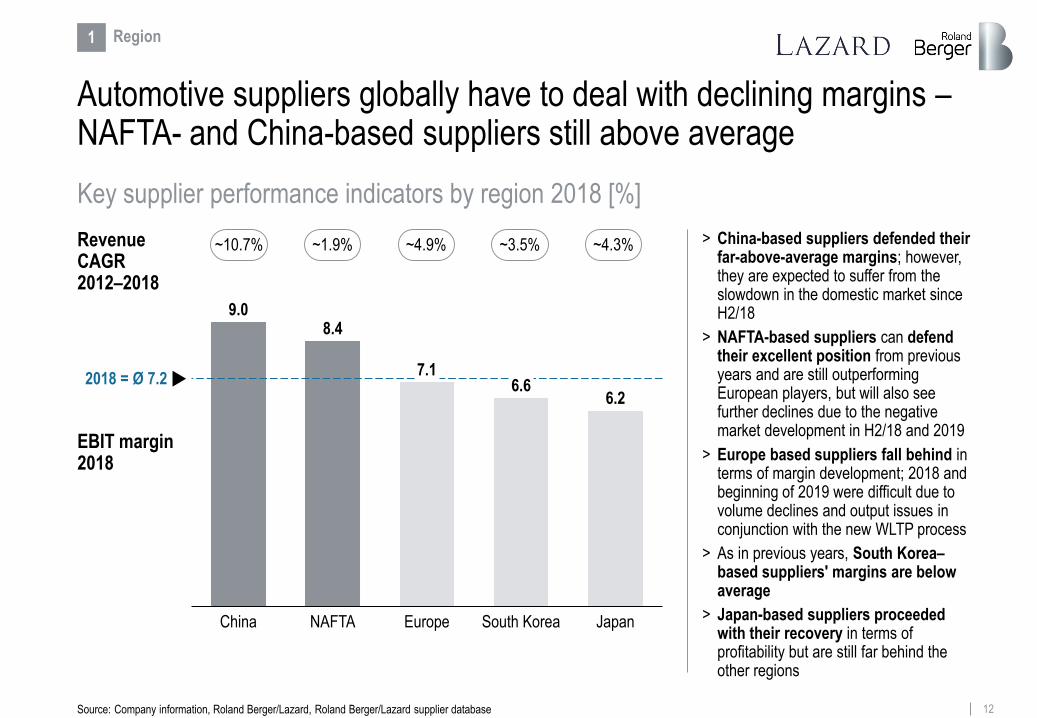
Automotive suppliers globally have to deal with declining margins –NAFTA- and China-based suppliers still above average
Source: Company information, Roland Berger/Lazard, Roland Berger/Lazard supplier database
Revenue CAGR 2012–2018
EBIT margin 2018
~10.7% ~1.9% ~4.9% ~3.5% ~4.3%
Key supplier performance indicators by region 2018 [%]
1 Region
NAFTAChina
2018 = Ø 7.2
Europe JapanSouth Korea
9.08.4
7.16.6
6.2
> China-based suppliers defended their far-above-average margins; however, they are expected to suffer from the slowdown in the domestic market since H2/18
> NAFTA-based suppliers can defend their excellent position from previous years and are still outperforming European players, but will also see further declines due to the negative market development in H2/18 and 2019
> Europe based suppliers fall behind in terms of margin development; 2018 and beginning of 2019 were difficult due to volume declines and output issues in conjunction with the new WLTP process
> As in previous years, South Korea–based suppliers' margins are below average
> Japan-based suppliers proceeded with their recovery in terms of profitability but are still far behind the other regions

13Source: Company information, Roland Berger/Lazard, Roland Berger/Lazard supplier database
Financially strong multinational suppliers as well as mostly technology-focused mid-size suppliers achieve the highest margins
Revenue CAGR 2012–2018
EBIT margin 2018
~4.3% ~6.5% ~3.4% ~1.2% ~5.3% ~4.6%
Key supplier performance indicators by company size (EUR bn sales) 2018 [%]
2 Company size
2.5-5.0<0.5 0.5-1.0 1.0-2.5
6.5
5.0-10.0
2018 = 7.2
>10.0
7.0
5.7
8.7
7.07.3
> Large multinational suppliers (above EUR 10 bn revenues) can leverage scale effects and benefit from additional business potentials due to new technologies or digital business models
> Very large suppliers (EUR 5 bn to 10 bn revenues) are in a sandwich position between OEM price pressure and high capital requirements for new technologies and further growth
> Large suppliers (EUR 2.5 bn to 5 bn revenues) achieve industry-average values for revenue growth and margins
> Mid-size suppliers (EUR 1.0 bn to 2.5 bn revenues) achieve above-average profitability, mostly on the back of a very focused and technology-enabled product portfolio
> Small suppliers (EUR 0.5 bn to 1.0 bn)seem to have difficulties translating growth into margin improvement

14
Tire suppliers benefit from favorable raw material costs & business model – Chassis suppliers well positioned for future technologies
Source: Company information, Roland Berger/Lazard, Roland Berger/Lazard supplier database
Revenue CAGR 2012–2018
EBIT margin 2018
Key supplier performance indicators by product focus 2018 [%]
3 Product focus
5.6
Electrics/Infotainm.
ChassisTires Power-train
Exterior
7.4
Interior
2018 = 7.2
11.3
8.1
6.46.9
> Tire suppliers can benefit from their aftermarket business; favorable raw materials price developments in the past helped to achieve far-above-average margins
> Chassis suppliers achieve above-average margins due to advanced driver assistance and active safety
> Powertrain margins further pressurized by intensified competition, the cost of (multiple) innovations and the rise of electric vehicles
> Exterior suppliers have been growing strongly. Margins benefited from raw materials price developments and increasing importance of light weight with high-quality material
> Electrics/infotainment suppliers still below average although importance of components is increasing – intensified competition
> Interior suppliers don't see a recovery
~0.4% ~2.7% ~4.5% ~5.4% ~3.3% ~3.6%

15
Product innovators have not kept the high margin levels of the previous years and have to focus on process efficiency in the future
Source: Company information, Roland Berger/Lazard, Roland Berger/Lazard supplier database
~5.4% ~3.8%Revenue CAGR 2012–2018
EBIT margin 2018
Key supplier performance indicators by business model 2018 [%]
Note: Analysis excludes tire suppliers. 1) Business model based on innovative products with differentiation potential; 2) Business model based on process expertise (while product differentiation potential is limited)3) M = Mobility A = Autonomous D = Digitization E = Electrification
4 Business model
Product innovator1) Process specialist2)
7.3
6.6
> On average, innovative products feature higher differentiation potential and greater OEM willingness to pay higher prices
> But overall profit margins of product innovators came under pressure due to increasing OEM price pressure and intensified competition
> Efficiency improvements, e.g. subsequent to Industry 4.0 opportunities and lean approaches seem to pay off for process specialists
> Gap between process specialists and product innovators reduced over the last years; reason to be seen in the MADE3) trends and the resulting financial/operational challenges, especially for product innovators

16
However, the top performers in terms of average margins are still among the product innovators
Source: Company information, Roland Berger/Lazard, Roland Berger/Lazard supplier database
Rev
enu
es C
AG
R 2
012–
2018
Low product
innovators
Top process
specialists
Low process
specialists
Top product
innovators
Avg. EBIT2) margin 2018
Ø 4.6%
Ø 7.2%
Key performance indicators of top vs. low-performing suppliers1)
1) Top (low) performance based on above-average (below-average) revenue growth 2012–2018, ROCE 2012–2018 and ROCE 2018; 2) EBIT after restructuring items
4 Business model
0
1
2
3
4
5
6
7
8
9
10
11
12
13
14
0 1 2 3 4 5 6 7 8 9 10 11 12 13
> Product innovators outperform process specialists in terms of average profitability
> Top process specialists, though, achieve average revenue growth that is above the top product innovators
> Top process specialist growthis also accelerated by M&Aactivities of several players
> Large difference in growth rates between top and low-performing process specialists indicates the relevance of scale economies

17
Contents
© Roland Berger/Lazard
The status
Increasingly difficult environ-ment after record profits until last year
A
Roland Berger and Lazard Automotive teams
The contacts
DThe strategies
Suppliers have different opportunities to prepare for the future
CThe future
The transfor-mation of the automotive industry is well underway.
B
18
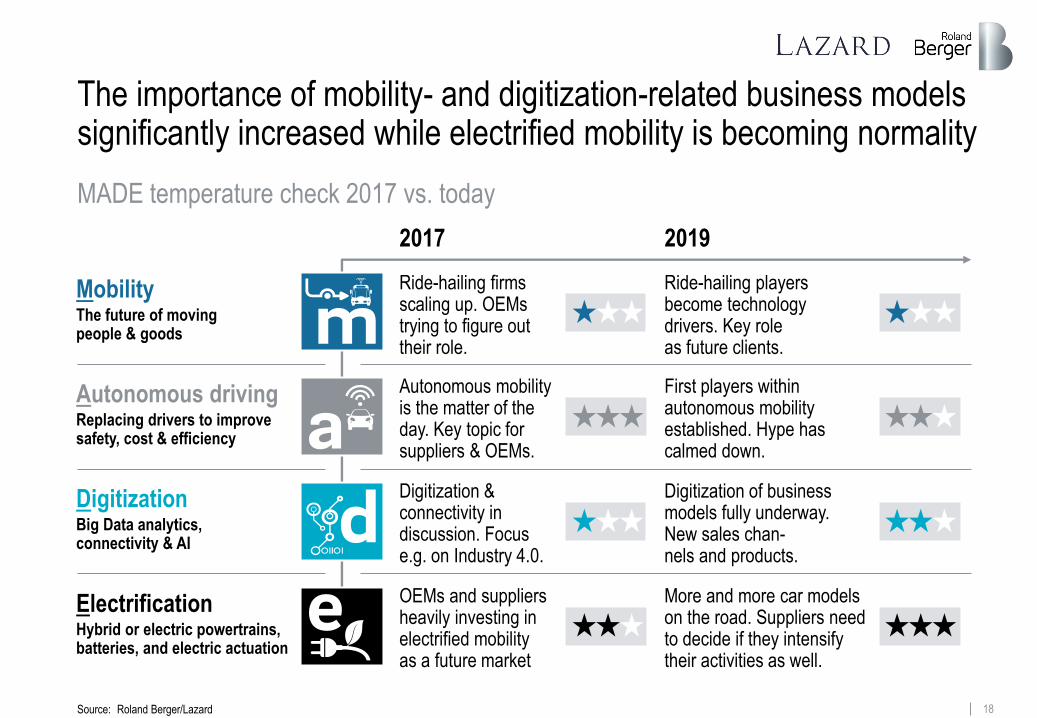
The importance of mobility- and digitization-related business models significantly increased while electrified mobility is becoming normality
MADE temperature check 2017 vs. today
2017 2019
Ride-hailing playersbecome technologydrivers. Key roleas future clients.
Ride-hailing firms scaling up. OEMs trying to figure out their role.
First players within autonomous mobility established. Hype has calmed down.
Autonomous mobility is the matter of the day. Key topic for suppliers & OEMs.
Digitization of businessmodels fully underway.New sales chan-nels and products.
Digitization & connectivity in discussion. Focus e.g. on Industry 4.0.
More and more car models on the road. Suppliers need to decide if they intensify their activities as well.
OEMs and suppliersheavily investing inelectrified mobilityas a future market
MobilityThe future of moving people & goods
Autonomous drivingReplacing drivers to improve safety, cost & efficiency
DigitizationBig Data analytics, connectivity & AI
ElectrificationHybrid or electric powertrains, batteries, and electric actuation
Source: Roland Berger/Lazard

19
The change in the automotive industry is gaining speed, affecting the market landscape, product portfolios and required employee skills
Current developments within the automotive industry
Prerequisites for electric vehicles constantly getting better, e.g. further emission regulations and ICE city bans, decreasing battery costs or improving infrastructure
Source: Roland Berger/Lazard
Impacts
1
Beside new forms of mobility also the mobility mix itself is changing2
Uncertainty remains over technical development path and legal framework for autonomous driving
3
Data-based and digital business models enable new business potential 4
5 Sales potential for certain products likely to fall dramatically
6 Customers continue to push suppliers for cost reductions
New players enter the automotive business across the entirevalue chain
7
Required employee skill-set is changing dramatically8
Access to capital is expected to become tougher given a shrinking relative attractiveness of the automotive sector
9
Market trends
20
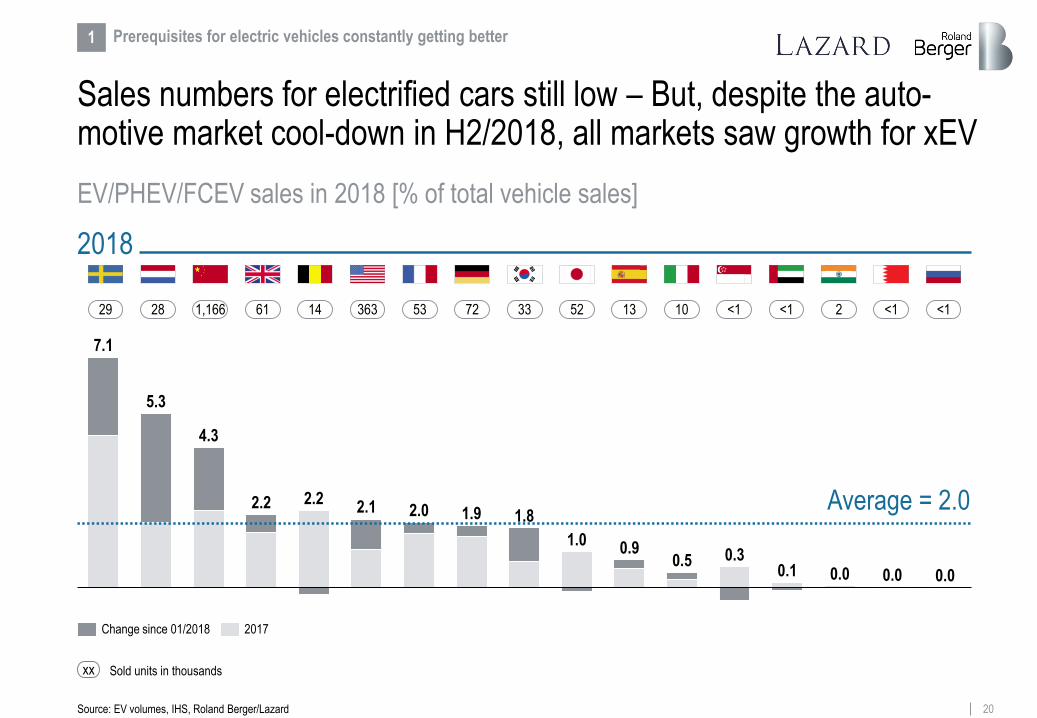
Sales numbers for electrified cars still low – But, despite the auto-motive market cool-down in H2/2018, all markets saw growth for xEV
Source: EV volumes, IHS, Roland Berger/Lazard
EV/PHEV/FCEV sales in 2018 [% of total vehicle sales]
2018
2.12.2
5.3
7.1
4.3
2.2 2.0 1.9 1.8
0.0
1.00.9
0.5 0.30.1 0.0 0.0
Average = 2.0
29 28 1,166 61 1333 5236314 53 72 <1<110 <1 <1 2
1 Prerequisites for electric vehicles constantly getting better
Change since 01/2018 2017
xx Sold units in thousands

21
The charging infrastructure for electrified cars is gradually getting better – But still many countries have a long way to go
Infrastructure: Charging infrastructure [charging stations per 100 km roadways]
Source: EV Volumes, Desk research, Roland Berger/Lazard
21,0
5,1
2,50,9 1,3
2,91,6 1,1 0,6 0,3 0,3
24,4
8,8
5,7
2,92,9
2,3 1,3
1,1 1,0 0,60,4
0,3
29,3
17,5
8,27,0
4,32,9 2,3 2,3 1,9 1,4 1,0 0,9 0,5 0,3 0,1
Dubai SingaporeNetherlands China South Korea
Japan UKFrance Germany Belgium Sweden Italy USA Spain
1,3
Russia India Bahrain
July 2017 July 2019July 2018
1 Prerequisites for electric vehicles constantly getting better
Jul -17 / Jul -19
41 0.2 401 8 216 2380 26 9 004 22 5 1
xx : # charging stations ('000)

22
Especially in Asia the majority of people already have the opportunity to decide between different mobility modes – Limitations in EU/US
60% 60%50% 50% 50%
40% 40% 40% 35% 30% 30% 30% 25% 20% 20% 20%
40% 40%50% 50% 50%
60% 60% 60% 65% 70% 70% 70% 75% 80% 80% 80%
Choice of mode in less than 40% of trips Choice of mode in more than 40% of trips
On all the trips you took, how often did you have the choice for a different mode of travel?
Multimodal mobility – Offer in terms of transportation modes
2 Beside new forms of mobility also the mobility mix itself is changing
Source: RB online survey Jan 2019: 16,180 participants - Participants by country: Belgium 1,004; China 1,006; France 1,006; Germany 1,004; India 1,008; Italy 1,012; Japan 1,060; Netherlands 1,001; Russia 1,011; Singapore 1,004; South Korea 1,009; Spain 1,009; Sweden 1,001; UAE 1,009; UK 1,036; USA 1,01; Lazard

23
The legislative framework for autonomous mobility gets better –However, L5 blanket coverage still has a long way to go
Evolution of approval process for autonomous driving levels L4 & L5
Edition 1 (Jan 17) Edition 5 (Jan 19)
Step 1 Step 2 Step 3 Step 4 Step 5
Source: Roland Berger Automotive Disruption Radar, Lazard
Germany
Belgium
United States
France
UK
NA
Singapore
Netherlands
Japan
China
Italy
NA
South Korea
NASpain
Russia
NASweden
Dubai
NAIndia
NABahrain
NA
Russia
United States
UK
Germany
France
Singapore
Netherlands
Dubai
Japan
China
Italy
South Korea
Spain
Sweden
India
Bahrain
Belgium
3 Uncertainty remains over technical development path
Indicator Rating: Progress regarding type approval progress forautonomous vehicles
Nodiscussion
Initialdiscussions
Basic regulatoryset
Regulation in progress
Regulation in decision phase
No limitationfor approval
> Legislation still a limiting factor for automated driving
> UK with the biggest development step during the last 2 years
> USA the only country globally without limitations for type approval process, hence most leading players for automated mobility out of the US
> Ethical discussions often hampering the legislation process
> In addition, increasing awareness of massive capital requirements with uncertain payback periods to achieve L5
Step 1 Step 2 Step 3 Step 4 Step 5
Changes since January 2017
24
Accessibility for automotive suppliers
Technological sophistication
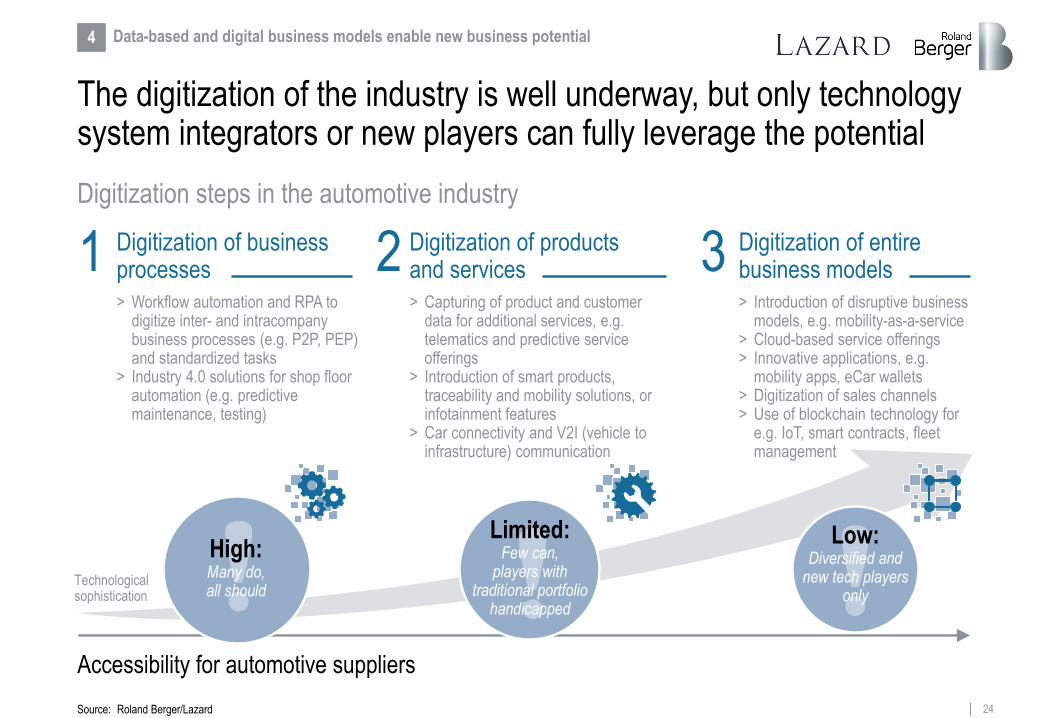
The digitization of the industry is well underway, but only technology system integrators or new players can fully leverage the potential
Digitization steps in the automotive industry
> Workflow automation and RPA to digitize inter- and intracompany business processes (e.g. P2P, PEP) and standardized tasks
> Industry 4.0 solutions for shop floor automation (e.g. predictive maintenance, testing)
> Introduction of disruptive business models, e.g. mobility-as-a-service
> Cloud-based service offerings> Innovative applications, e.g.
mobility apps, eCar wallets> Digitization of sales channels> Use of blockchain technology for
e.g. IoT, smart contracts, fleet management
1 Digitization of business processes 3 Digitization of entire
business models
Limited:Few can,
players with traditional portfolio
handicapped
Low:Diversified and
new tech players only
High:Many do,all should
> Capturing of product and customer data for additional services, e.g. telematics and predictive service offerings
> Introduction of smart products, traceability and mobility solutions, or infotainment features
> Car connectivity and V2I (vehicle to infrastructure) communication
2 Digitization of products and services
4 Data-based and digital business models enable new business potential
Source: Roland Berger/Lazard

25
Invest in venture capital1): Mobility and artificial intelligence [USD m]
Since 2015 more than EUR 60 bn of venture capital has been invested into new automotive technologies and players
Source: Tracxn, Roland Berger/Lazard
Total VC invest –
Mobility
20173)2015
9,328
21,427
2016
10,210
2018
12,977
2017 20182015
6,537
2016
6521,558
3,432
Total VC invest –
Artificial intelligence2)
5 Sales potential for certain products likely to fall dramatically
> VC funding of new automotive technologies is extremely high
> While investments in mobility themes have been high for a few years, artificial intelligence is becoming the hot topic in terms of technology recently
> With external financing, new players can catch up with large established players in the market
1) Analysis on disclosed amounts2) Including investments in smart cars, AI in transportation and autonomous vehicle technologies, and AI infrastructures (natural language processing, computer vision, etc.)3) Fueled by several large funding rounds (e.g. Didi, Lift, Grab, et al.)
x10

26
Traditional OEMs are facing pressure from many sides, not only in new expansion areas but also in their core business
New MaaS
business
Tradi-tionalcore
business
Pressure on traditional OEMs
OEM/OES business 2019
New mobility concepts 2025
Electric mobility2025
6 Customers continue to push suppliers for cost reductions
Source: Roland Berger/Lazard
Fierce competition due to new entrants with advantages over established players
Late to follow-up: Traditionally leading OEMs in follower position
Strong need for investment into automated driving and artificial intelligence and to scale up
Decreasing brand loyalty and design relevance
More intensive competition due to new entrants with advan-tages over established players
Falling margins due to electri-fied vehicles either because of simplified (BEV) or more cost intensive (HEV) powertrain
Lower EBIT due to rising costs and portfolio shifts
High investments in powertrain electrification and new technologies
High costs associated withpersonnel transformation
> High pressure on OEM margins frome-mobility and new-mobility concepts
> In addition, further pressure from emission regulations and potential fines
> OEMs will try to, at least partially, passnegative effects on their earnings to theirsupply base
NeutralNegative impact on businessPositive impact on business
New Maas business slower than expected to ramp up
27
6 Customers continue to push suppliers for cost reductions
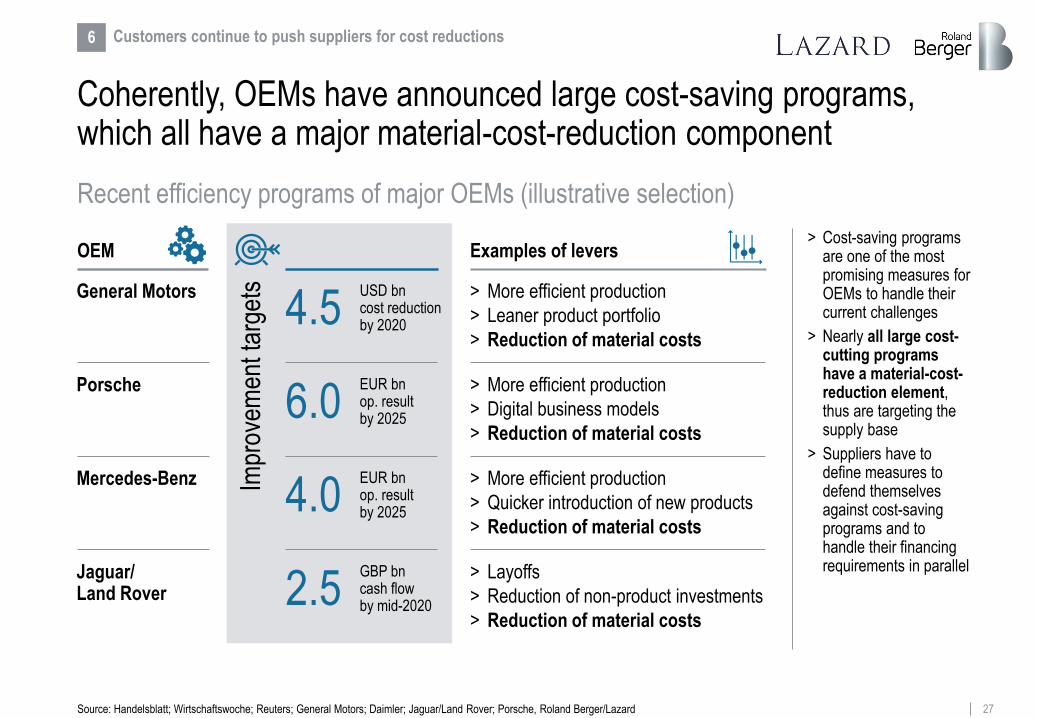
Coherently, OEMs have announced large cost-saving programs, which all have a major material-cost-reduction component
Recent efficiency programs of major OEMs (illustrative selection)
Source: Handelsblatt; Wirtschaftswoche; Reuters; General Motors; Daimler; Jaguar/Land Rover; Porsche, Roland Berger/Lazard
> More efficient production
> Leaner product portfolio
> Reduction of material costs
> More efficient production
> Quicker introduction of new products
> Reduction of material costs
> More efficient production
> Digital business models
> Reduction of material costs
> Layoffs
> Reduction of non-product investments
> Reduction of material costs
4.5USD bncost reductionby 2020
4.0EUR bnop. resultby 2025
6.0EUR bnop. result by 2025
2.5GBP bncash flowby mid-2020
Impr
ovem
ent t
arge
ts> Cost-saving programs
are one of the most promising measures for OEMs to handle their current challenges
> Nearly all large cost-cutting programs have a material-cost-reduction element, thus are targeting the supply base
> Suppliers have to define measures to defend themselves against cost-saving programs and to handle their financing requirements in parallel
OEM Examples of levers
General Motors
Mercedes-Benz
Porsche
Jaguar/ Land Rover
28
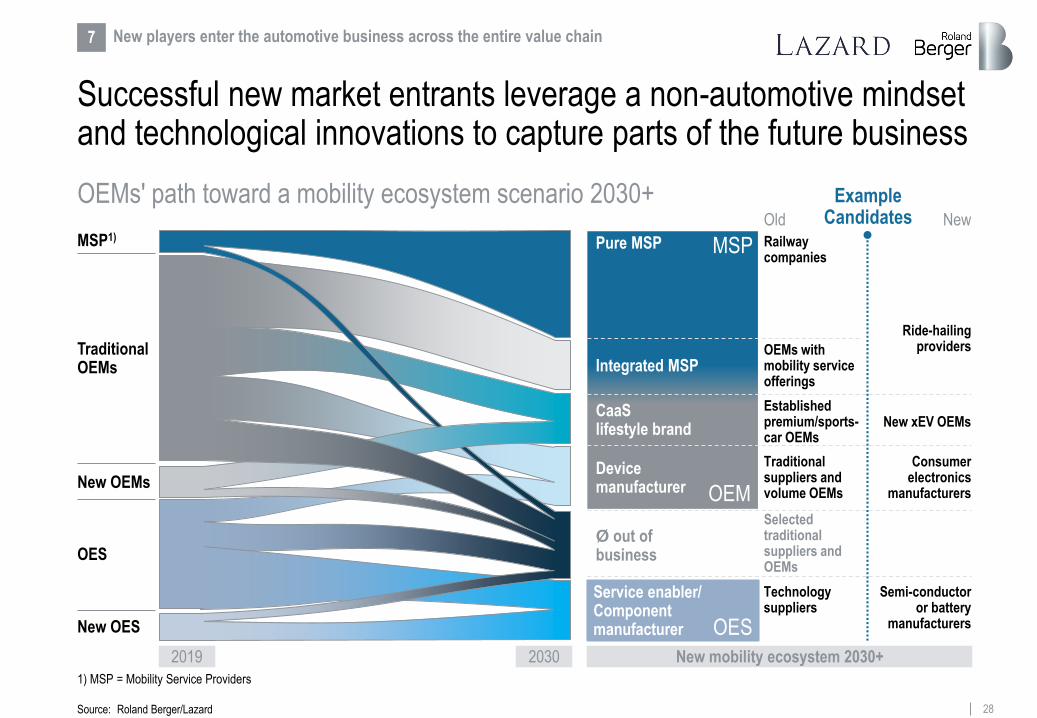
Successful new market entrants leverage a non-automotive mindset and technological innovations to capture parts of the future business
OEMs' path toward a mobility ecosystem scenario 2030+
7 New players enter the automotive business across the entire value chain
Source: Roland Berger/Lazard
1) MSP = Mobility Service Providers
MSP1)
New OEMs
OES
New OES
Traditional OEMs
Ø out of business
Pure MSP
Device manufacturer
Service enabler/ Component manufacturer
CaaSlifestyle brand
MSP
OEM
OES
Example CandidatesOld New
Railway companies
Ride-hailing providersOEMs with
mobility service offerings
Established premium/sports-car OEMs
New xEV OEMs
Traditional suppliers and volume OEMs
Consumer electronics
manufacturers
Selectedtraditionalsuppliers and OEMs
Technology suppliers
Semi-conductor or battery
manufacturers
2019 2030 New mobility ecosystem 2030+
Integrated MSP

29
01.15 01.16 01.17 01.18 01.19
O’Reilly , 96%
AAP, -9%
GPC, -14%
AutoZone, 76%
S&P 500, 42%
Large portfolio Cost-efficient Fast delivery (still gap)
> Pressure on speed of delivery: Same day in certain cities, 1–2 days in most cities and aiming for delivery within 1 hour by 2025
> Economies of scope and scale across product categories to move parts from warehouses to fulfillment centers near customers
2–4%3%
15%
10–15%
4–6%
6–11%
Traditional
2–3%
5–10%
6–8%
Amazon
∑ = 15–20%
∑ = 20–32%
(500–1,200) bps
Wholesale Stocker
Last miledelivery
Amazon Fulfillment
center
Stock price [USD]1)
Focus trend: E-commerce players' positioning in automotive aftermarket in the USA
Players like Amazon enter different areas of the market and win on scale, coverage or pricing, and even offer better user experience
> Amazon sales in the automotive aftermarket already passed the USD 1 bn milestone
> Amazon not only offers parts for Do-It-Yourself but also services for Do-It-For-Me
> Amazon leverages its sales channels for B2C as well as for B2B
> Except body parts and software, the portfolio already covers the whole aftermarket bandwidth
> Differentiation factor is a better service ex-perience for the clients (delivery time, all out of one hand, etc.)
7 New players enter the automotive business across the entire value chain
1) Stock price information as of Aug 9, 2019
Number of SKUs ranked by customer demand
100,000
1,000
2,000
0
0 175,000 400,000 3 m 6 m
Number of SKUs offered by regional aftermarket retailers across their network
Number of SKUs Amazon auto after-market has access to
Number of SKUs offered by national aftermarket retailers or WDs across their network
Ord
ers/
day
fo
r ea
ch S
KU
Source: Roland Berger/Lazard
Amazon, 482%
Op Margin Tgt
Local platform
Admin costs
Regional platform
Customer service
Supernationalplatform
30
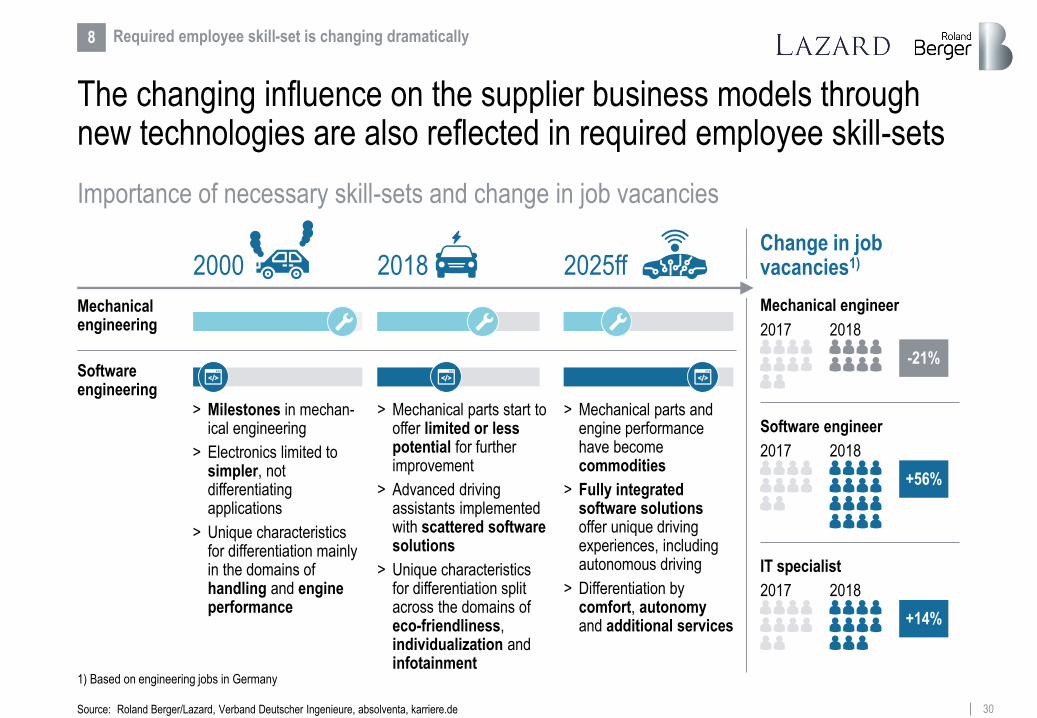
The changing influence on the supplier business models through new technologies are also reflected in required employee skill-sets
Importance of necessary skill-sets and change in job vacancies
2000
Mechanical engineering
Software engineering
2025ff2018
8 Required employee skill-set is changing dramatically
> Milestones in mechan-ical engineering
> Electronics limited to simpler, not differentiating applications
> Unique characteristics for differentiation mainly in the domains of handling and engine performance
> Mechanical parts start to offer limited or less potential for further improvement
> Advanced driving assistants implemented with scattered software solutions
> Unique characteristics for differentiation split across the domains of eco-friendliness, individualization and infotainment
> Mechanical parts and engine performance have become commodities
> Fully integrated software solutions offer unique driving experiences, including autonomous driving
> Differentiation by comfort, autonomyand additional services
Change in job vacancies1)
Mechanical engineer
2017 2018
-21%
Software engineer
2017
+56%
2018
IT specialist
2017
+14%
2018
Source: Roland Berger/Lazard, Verband Deutscher Ingenieure, absolventa, karriere.de
1) Based on engineering jobs in Germany

31
The relative sentiment of the automotive sector vs. other industries has been deteriorating in the last decade
Source: Bloomberg, Roland Berger/Lazard
P/E NTM1)
3x
5x
7x
9x
11x
13x
15x
17x
19x
21x
23x
Aug
10
Aug
11
Aug
12
Aug
13
Aug
14
Aug
15
Aug
16
Aug
17
Aug
18
Aug
19
Evolution of sector P/E valuations in equity capital markets
1) NTM = Next twelve months
Technology
AutoComponents
Automobiles
ChemicalsIndustrials
9 Access to capital is expected to become tougher
> Equity capital markets valuation levels of the automotive sector have been close to other industries a decade ago
> However, over the past years, the gap has widened – equity investors have increasingly been willing to pay higher prices for other sectors
> Whereas other industries benefited from the generally positive macroeconomic and capital markets environment, automotive companies saw rising concerns on their industry

32
Automotive M&A activity has slowed down substantially – Especially Chinese acquirers as important buyer group have become less active
Source: Dealogic, Roland Berger/Lazard
Share of Chinese M&A activity in the supplier space# of automotive supplier M&A transactions
Note: Transactions considered: announced/completed, >75% stake, automotive suppliers, worldwide
Environment becomes more difficult – especially for smaller suppliers looking for a sale or merger
9 Access to capital is expected to become tougher
11%
20%
17%
13%12%
2015 20172016 2018 H1 2019
252
232
183 178
66
H1 20192015 2016 2017 2018

33
Especially smaller suppliers are faced with comparably limited access to private equity capital and rising cautiousness on the credit side
Source: Dealogic, Roland Berger/Lazard, Press1) Deal value between EUR 100 m and EUR 500 m; i.e. 13% of buyers were private equity buyers, while 87% were strategic acquirers 2) Translated
9 Access to capital is expected to become tougher
Share of private equity buyers in mid-cap M&A transactions (2018)1) Selected debt capital and rating views
Note: Transactions considered: announced/completed, >75% stake, worldwide with disclosed deal value
"New technologies require automotive suppliers to make a
substantial investment resulting in an additional need for financing.
However, simultaneously banks are becoming more cautious with
regards to traditional lending in the automotive sector, as the
industry and corresponding rating recently have come under
pressure. Some banks even indicated their general reluctance to
increase the exposure in the automotive sector."
DR. WIESELHUBER & PARTNER – APR-20192)
"Weakening demand for cars and trucks has pushed credit rating
company Moody's to cut its outlook for the auto industry from stable
to negative. Slowing economic growth, a better-than-expected end
to 2018 and a host of potential political pitfalls are all expected to
dampen global auto sales in 2019, Moody's said in a research note
Monday."
CNBC – MAR-2019
"We expect a further increase in receivable risk in the automotive
industry, especially driven by vanishing liquidity levels of small and
mid-size automotive suppliers. The current level of risk is the
highest since the financial crisis and we expect an increasing
number of insolvencies and payment defaults (increase of up to
30%) in the automotive supplier industry in the medium term."
ATRADIUS – APR-20192)
24%
19%
16%
ChemicalsAutomotivesuppliers
Healthcare Industrials(ex. auto)
13%1)
34
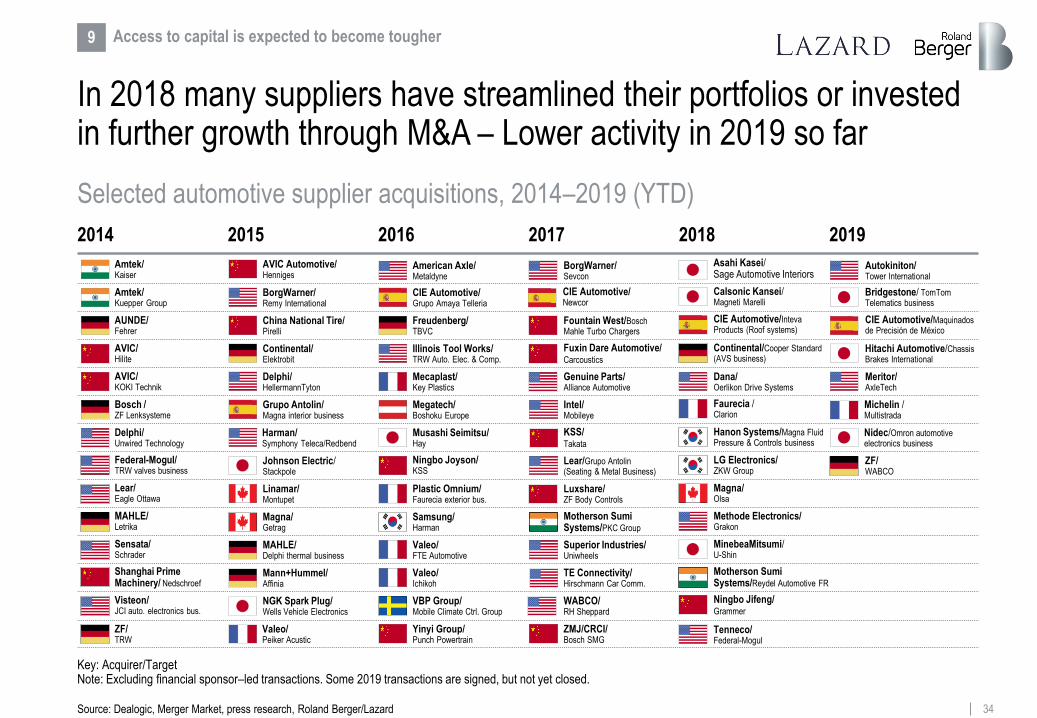
2014
In 2018 many suppliers have streamlined their portfolios or invested in further growth through M&A – Lower activity in 2019 so far
2015 2016
Amtek/Kuepper Group
AVIC/Hilite
AVIC/KOKI Technik
AUNDE/Fehrer
Amtek/Kaiser
Bosch /ZF Lenksysteme
Shanghai PrimeMachinery/ Nedschroef
MAHLE/Letrika
ZF/TRW
Lear/Eagle Ottawa
Visteon/JCI auto. electronics bus.
Sensata/Schrader
Delphi/Unwired Technology
Federal-Mogul/TRW valves business
2017
AVIC Automotive/Henniges
China National Tire/Pirelli
Delphi/HellermannTyton
Continental/Elektrobit
BorgWarner/Remy International
Grupo Antolin/Magna interior business
Mann+Hummel/Affinia
Magna/Getrag
Linamar/Montupet
Johnson Electric/Stackpole
MAHLE/Delphi thermal business
NGK Spark Plug/Wells Vehicle Electronics
Valeo/Peiker Acustic
Harman/Symphony Teleca/Redbend
2018
Samsung/Harman
Valeo/Ichikoh
American Axle/Metaldyne
Mecaplast/Key Plastics
2019
VBP Group/Mobile Climate Ctrl. Group
CIE Automotive/Grupo Amaya Telleria
Key: Acquirer/TargetNote: Excluding financial sponsor–led transactions. Some 2019 transactions are signed, but not yet closed.
Source: Dealogic, Merger Market, press research, Roland Berger/Lazard
Calsonic Kansei/Magneti Marelli
CIE Automotive/Inteva Products (Roof systems)
Ningbo Jifeng/Grammer
Tenneco/Federal-Mogul
Dana/ Oerlikon Drive Systems
Continental/Cooper Standard (AVS business)
MinebeaMitsumi/U-Shin
Hanon Systems/Magna Fluid Pressure & Controls business
Magna/Olsa
Motherson Sumi Systems/Reydel Automotive FR
LG Electronics/ZKW Group
Methode Electronics/ Grakon
Freudenberg/TBVC
Illinois Tool Works/TRW Auto. Elec. & Comp.
Musashi Seimitsu/Hay
Megatech/Boshoku Europe
Ningbo Joyson/KSS
Plastic Omnium/Faurecia exterior bus.
Valeo/FTE Automotive
Yinyi Group/Punch Powertrain
CIE Automotive/Newcor
BorgWarner/Sevcon
Fountain West/Bosch Mahle Turbo Chargers
Fuxin Dare Automotive/Carcoustics
Intel/Mobileye
Genuine Parts/Alliance Automotive
KSS/Takata
Lear/Grupo Antolin (Seating & Metal Business)
Luxshare/ZF Body Controls
Motherson Sumi Systems/PKC Group
Superior Industries/Uniwheels
TE Connectivity/Hirschmann Car Comm.
WABCO/RH Sheppard
ZMJ/CRCI/Bosch SMG
Faurecia /Clarion
ZF/WABCO
Bridgestone/ TomTom Telematics business
Nidec/Omron automotive electronics business
CIE Automotive/Maquinados de Precisión de México
Hitachi Automotive/Chassis Brakes International
Meritor/AxleTech
Michelin /Multistrada
Asahi Kasei/Sage Automotive Interiors
Autokiniton/Tower International
9 Access to capital is expected to become tougher
Selected automotive supplier acquisitions, 2014–2019 (YTD)

35
In the medium term, focus is shifting toward challenges like digital business models, required R&D financing and availability of talent
Mid-term supplier CEO radar screen
Car buyers
Competition Supply base
Attractiveness of equity story
Light-weightNew mobility
concepts
New market entrants Growing importance of
software and electronics
Capital markets/financing
Price pressure on suppliers
Digital business models
Stagnation/potential decline of volumes
Reduced importance of high end variant
New car concepts
ReducedICE share
Market consolidation
Type approval process
Smart products &New components
Increasing quality/durability requirements
Customization of interior
Outsourcing of non-differentiating parts
Availability of skilled workforce
Digital business
models
High capital requirements for R&D
OEMs Technology/legislation
New customers
Mobility Autonomous ElectrificationDigitization
Source: Roland Berger/Lazard
Trade wars
Secure financing to master disruption

36
Contents
© Roland Berger/Lazard
The status
Increasingly difficult environ-ment after record profits until last year
A
Roland Berger and Lazard Automotive teams
The contacts
DThe strategies
Suppliers have different opportunities to prepare for the future
CThe future
The transfor-mation of the automotive industry is well underway
B

37
The predicted transformation of the automotive industry becomes reality – Suppliers have to find their individual strategy to deal with it
Current situation for automotive suppliers
1 The automotive industry is at the edge –Projected changes are becoming reality at high speed
4Automotive suppliers have to identify which market changes are most relevant for them
2 The changes affect the clients, the products, the employees and the legislative framework
3 The time to act and to prepare for the future is running out quickly
5
All suppliers have to deal with the same market situation but need to find individual answers
Source: Roland Berger/Lazard
38
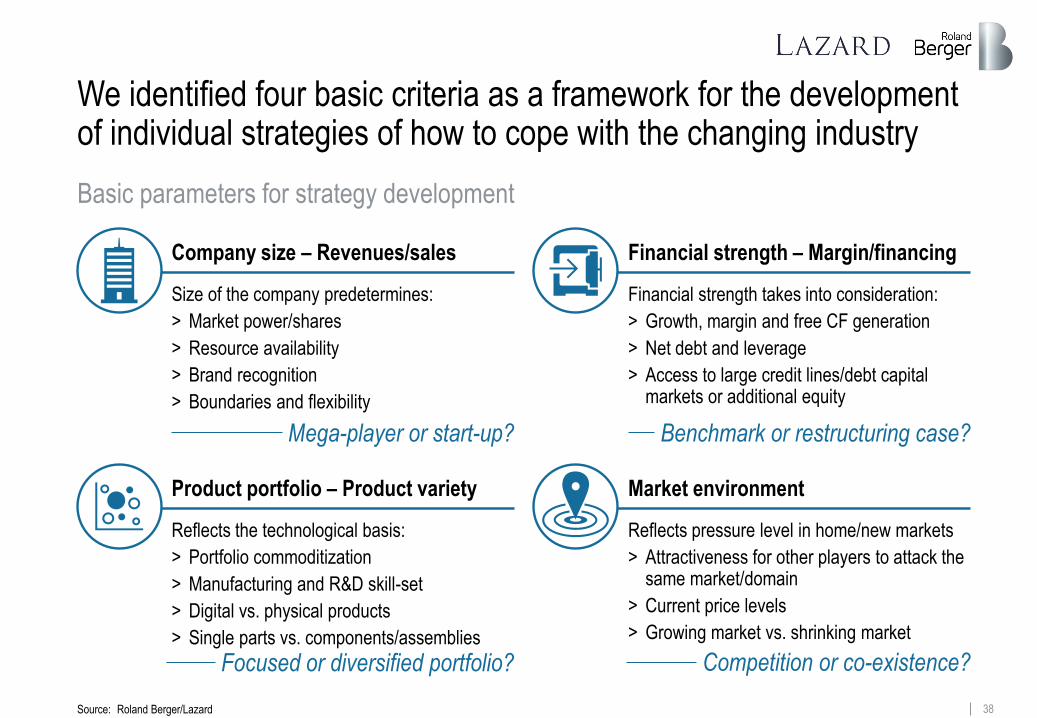
We identified four basic criteria as a framework for the development of individual strategies of how to cope with the changing industry
Basic parameters for strategy development
Company size – Revenues/sales
Size of the company predetermines:
> Market power/shares
> Resource availability
> Brand recognition
> Boundaries and flexibility
Financial strength – Margin/financing
Financial strength takes into consideration:
> Growth, margin and free CF generation
> Net debt and leverage
> Access to large credit lines/debt capital markets or additional equity
Product portfolio – Product variety
Reflects the technological basis:
> Portfolio commoditization
> Manufacturing and R&D skill-set
> Digital vs. physical products
> Single parts vs. components/assemblies
Market environment
Reflects pressure level in home/new markets
> Attractiveness for other players to attack the same market/domain
> Current price levels
> Growing market vs. shrinking market
Mega-player or start-up? Benchmark or restructuring case?
Competition or co-existence?Focused or diversified portfolio?
Source: Roland Berger/Lazard

39
To point out differences in strategy approaches we have clustered suppliers by size, financial strength, portfolio and market environment
Supplier archetype1) categorization – Methodology
Cluster
Archetype assessment criteria
Product portfolio
Focus on one commodity
Diversifiedportfolio
Marketenvironment
Shrinking/threatened segment
Strong growthsegment
Company size
Small Large
Financialstrength
Weak Strong
Financial strength
Product portfolio
Company size
Large company
Weak/under-financed
Commod-itized
Market environment
Shrinking/ threatened
1) Archetypes are not all-encompassing, attribution can be ambiguous
Source: Roland Berger/Lazard
Company represents a larger commodity player, e.g. a die-casting supplier or a body-parts supplier with sales of more than EUR 1 bn p.a., which is fully focused on traditional ICE automotive business

40
Six supplier archetypes represent the most common players within the automotive supplier industry
Supplier archetypes
Product portfolio
Company size
Financial strength
Market environment
> Portfolio of single parts or simple components
> Commoditized portfolio
> Business model under pressure
> Limited ability to leverage scales
> Broad portfolio of single parts and components
> OEM customers as well as direct sales
> Market consoli-dation ongoing
> Portfolio of complex parts or modules
> Commoditized portfolio
> Among the market leaders
> Sizes allows for scale effects
> Portfolio focus on innovation/ new technologies
> Technology leader/disruptor
> Limited OEM access
> Agile organizations
> Broad portfolio, also for growing segments
> High capital requirements for new tech-nologies
Small traditional player
Aftermarket player
Global commodity leader
Global new entrant
Traditional di-versified player
Technology sys-tem integrator
> Large integrators with broad portfolio
> System-relevant as of today
> Attacked from multiple sides
> Financially strong
How to survive despite strong headwinds?
How to position in a consolidating and digitizing market?
How to secure profitability in an adverse market?
How to enter/disrupt the automotive
market?
How to identify the right innovations for
the future?
How to participate in future growth
segments?
Small/weak/threatened Large/strong/growing
General characteristics
Strategicquestions
Ass
essm
ent
crit
eria / / /
/
Source: Roland Berger/Lazard

41
Exemplary strategic mission statements for the archetypes show that suppliers should adjust strategies to their specific situations
Top challenges per supplier archetype
> Price pressure> Potential volume decline> Electrification and digitization
Smalltraditional player
> Secure long-term funding> Scale effects & Industry 4.0> Attracting talent
> Automotive standards> Customer access> Established competitors
Global newentrant
> R&D expenses> Workforce availability> Technology acceptance
> Electric vehicles> Market consolidation> Low-cost competitors
Aftermarketplayer
> Client structure (end client, OEM, mobility provider)
> Upcoming digital products
> Price pressure> Potential volume decline> Electrification and digitization
Globalcommodity leader
> Industry 4.0> Capital requirements> Platform projects
> Price pressure> R&D expense allocation> Portfolio commoditization
Traditionaldiversified player
> Internal cultural change> Increasing competition
for growth segments
> Electrification and digitization> Autonomous driving> Breaking up of systems
Technologysystem integrator
> Increasing competition> Financing needs> Internal cultural change
Selected top challenges Strategic mission statement
Survival of the fittest – Cost optimization throughout the entire organization is key
Eat or be eaten – Compensate for negative business implications from e-mobility trend
Defend current positioning – Process excellence is the basis to generate capital and to ensure long-term success
If you can think it, you can do it –Leverage existing know-how to generate new business within automotive industry
Offense is the best defense – Focus on cost-efficiency or proactive portfolio transition to future growth segments
Remain system-relevant – Make the company irreplaceable for OEMs and leverage positioning into new fields
Archetype
Source: Roland Berger/Lazard

42
Overall impact
Light weight
Increasing quality/durability requirements
Type approval process autonomous driving
Investors/creditors view on automotive
Smart products/new components
High capital requirements
– 0 + +–– 0 + +–
– 0 + +–– 0 + +–– 0 + +–– 0 + +–– 0 + +–
– 0 + +–– 0 + +–– 0 + +–
– 0 + +–– 0 + +–– 0 + +–– 0 + +–
– 0 + +–– 0 + +–– 0 + +–
– 0 + +–– 0 + +–– 0 + +–– 0 + +–
– 0 + +–– 0 + +–– 0 + +–
– 0 + +–– 0 + +–– 0 + +–– 0 + +–
– 0 + +–– 0 + +–– 0 + +–
– 0 + +–– 0 + +–– 0 + +–– 0 + +–
– 0 + +–– 0 + +–– 0 + +–
– 0 + +–– 0 + +–– 0 + +–– 0 + +–
Technol-ogy/Leg-islation
Higher importance of software/electronics
Capital markets
– 0 + +––
– 0 + +– – 0 + +– – 0 + +– – 0 + +– – 0 + +–– 0 + +
The business models of many automotive suppliers appear to be at risk
Impact2) for most suppliers
MADE1) impacts by supplier archetype
Digital business models
Economic downturn
Reduced ICE share
Stagnation/decline of volumes
New market entrants
Outsourcing of non-differentiating parts
New mobility concepts
New customers
New car concepts
Availability of skilled workforce
– 0 + +–– 0 + +–– 0 + +–– 0 + +–
– 0 + +–
– 0 + +–– 0 + +–– 0 + +–
– 0 + +–– 0 + +–
– 0 + +–– 0 + +–– 0 + +–– 0 + +–
– 0 + +–
– 0 + +–– 0 + +–– 0 + +–
– 0 + +–– 0 + +–
– 0 + +–– 0 + +–– 0 + +–– 0 + +–
– 0 + +–
– 0 + +–– 0 + +–– 0 + +–
– 0 + +–– 0 + +–
– 0 + +–– 0 + +–– 0 + +–– 0 + +–
– 0 + +–
– 0 + +–– 0 + +–– 0 + +–
– 0 + +–– 0 + +–
– 0 + +–– 0 + +–– 0 + +–– 0 + +–
– 0 + +–
– 0 + +–– 0 + +–– 0 + +–
– 0 + +–– 0 + +–
– 0 + +–– 0 + +–– 0 + +–– 0 + +–
– 0 + +–
– 0 + +–– 0 + +–– 0 + +–
– 0 + +–– 0 + +–
Trade wars/Brexit
Reduced importance of high-end variants
Price pressure on suppliers
Market consolidation
Car buyers
OEMs
Compe-tition
Supply base
– 0 + +–
– 0 + +–– 0 + +–
–
Small traditional player
Global commod-ity leader
Global new entrant
Traditional di-versified player
Technology sys-tem integrator
Aftermarket player
– 0 + +– – 0 + +– – 0 + +– – 0 + +– – 0 + +–
– 0 + +– – 0 + +– – 0 + +– – 0 + +– – 0 + +–– 0 + +– – 0 + +– – 0 + +– – 0 + +– – 0 + +–
– 0 + + – 0 + +– – 0 + +– – 0 + +– – 0 + +– – 0 + +–
– 0 + +– Impact on supplier business: (strongly) negative, no impact, (strongly) positive 1) M = Mobility A = Autonomous D = Digitization E = Electrification 2) Relative to each other
Source: Roland Berger/Lazard
Summary
1 2 3 4 5 6

43
Small traditional players have to find answers for the increasing price pressure and potential volume downturns
Top challenges and rationales for most small traditional players
> Major OEMs have issued performance-improvement programs> High capital requirements on OEM side to finance R&D expenses or
potential fines for exceeded emission limits> Low manufacturing volumes, small client base and sometimes limited global
presence aggravate realization of scale effects> Digitization and automation in operations required to maximize performance> Industry 4.0 solutions require substantial investments
Price pressure, missing scale effects and Industry 4.0
> Creditors more cautious with long-term commitments especially for small suppliers in domains at risk
> Difficult to find equity investors at the same time
Securing long-term funding
> Possible economic downturn in the short term/mid term> Higher car utilization ratio due to shared mobility concepts and autonomous
driving in the long term
Decliningvolumes
> Changing car concepts require a different product portfolio from suppliers > Increasing importance of lightweight solutions to increase EV range> Car-as-a-service trend causes shift away from lucrative high-end variants
as not-owned cars become less of a status symbol
Electrification and digitization
Need for action
Low High
Attracting talent
> Small companies struggle to attract the right talent due to limited brand recognition or unfavorable location
How to survive despite strong headwinds?
1 Small traditional player
Source: Roland Berger/Lazard

44
Do nothing, because changes seem to be far away
Develop portfolio toward non-automotive, if time-/resource-intensive or experience is missing
Develop capital-intense growth areas where no expertise is in-house
Build-up FTE in traditional functions and worsen cost structures
Focus on product portfolio diversification, if it is time-/capital-intensive
Adverse actions
Free up cash with efficiency program
Re-think/adjust geographical footprint
Outsource non-core competencies
Set up a holistic performance excellence/improve-ment program for overhead, operations and R&D
Program to automate shop-floor processes
Favorable actions
Actively consider merger/disposal options
Strategic mission statementSurvival of the fittest – Cost optimization throughout the entire organization is key
A promising way for most small traditional suppliers is to fully focus on performance improvement
Strategic direction of most small traditional players
✓ ✗
1 Small traditional player
Source: Roland Berger/Lazard
Secure long-term funding flexibility and sufficient equity ratio

45
Most aftermarket players have to deal with strong market consoli-dation and electric cars as a threat to their business in the long run
Top challenges and rationales for most aftermarket players
> In the independent aftermarket, strong industry consolidation is underway> Small aftermarket companies might be swallowed by industry giants> Market already partly dominated by large, multinational parts distribution
groups
IAM1) Industryconsolidation
> Electric vehicles consist of far fewer parts than traditional ICE vehicles> Durability of electric powertrain components considered higher than that of
ICE components> Risk of obsolete production capacities for aftermarket part manufacturers in
the long term
Electricvehicles Need
for action
Low High
> Very different client groups (end customers vs. OEMs) to be handled> New client groups evolving, e.g. global mobility providers
Clientstructure
> Increasing importance of online sales channel> New online players evolving> Service-focused and customer-oriented business models gain importance
Online salesand upcomingdigital products
How to position in a consolidating and digitizing
market?
2 Aftermarket player
Source: Roland Berger/Lazard
> Aftermarket is attractive for either low-cost suppliers, especially from Asia or global online marketplaces, due to relatively low entry barriers
> Overall very price-sensitive client base due to higher vehicle age –risk of being substituted because of lower client loyalty
Newcompetitorsfor commodities
1) IAM = independent aftermarket
46
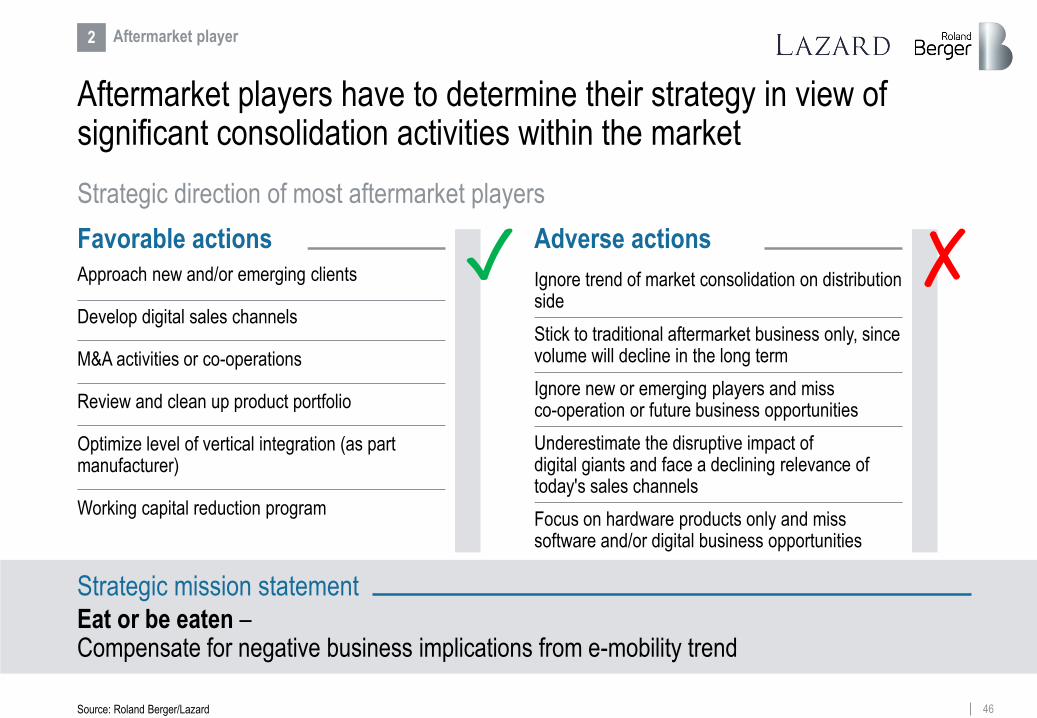
Strategic mission statementEat or be eaten –Compensate for negative business implications from e-mobility trend
Aftermarket players have to determine their strategy in view of significant consolidation activities within the market
Strategic direction of most aftermarket players
2 Aftermarket player
Source: Roland Berger/Lazard
Ignore trend of market consolidation on distribution side
Stick to traditional aftermarket business only, since volume will decline in the long term
Underestimate the disruptive impact ofdigital giants and face a declining relevance of today's sales channels
Focus on hardware products only and miss software and/or digital business opportunities
Ignore new or emerging players and miss co-operation or future business opportunities
Adverse actions
Develop digital sales channels
Review and clean up product portfolio
M&A activities or co-operations
Working capital reduction program
Optimize level of vertical integration (as part manufacturer)
Favorable actions
Approach new and/or emerging clients ✓ ✗

47
Most global commodity leaders need to optimize their cost struc-tures and adjust their portfolio for future requirements in parallel
Top challenges for most global commodity leaders
> Industry 4.0 requires substantial investments> Digitization and automation in operations required to maximize performance
Industry 4.0
Need for action
Low High
> Major OEMs have all issued performance-improvement programs> High capital requirements on OEM side to finance R&D expenses or
potential fines for exceeded emission limits
Price pressure
> Possible economic downturn in the short term/mid term> Higher car utilization ratio due to shared mobility concepts and autonomous
driving in the long term
Potential volume decline
> Changing car concepts require different product portfolio from suppliers > Increasing importance of lightweight solutions to increase EV range> Car-as-a-service trend causes shift away from lucrative high-end variants
as not-owned cars become less of a status symbol
Electrificationand digitization
> R&D spending for lightweight solutions and advanced engineering due to new car concepts
> Transformation process within operations needs to be financed
Capitalrequirements
> Purchasing co-operations on OEM side as well as further efforts to leverage scale effects based on car platforms
> Losing platform projects can become a serious issue for a supplier
Platformprojects
How to secure profitability in an
adverse market?
3 Global commodity leader
Source: Roland Berger/Lazard
48
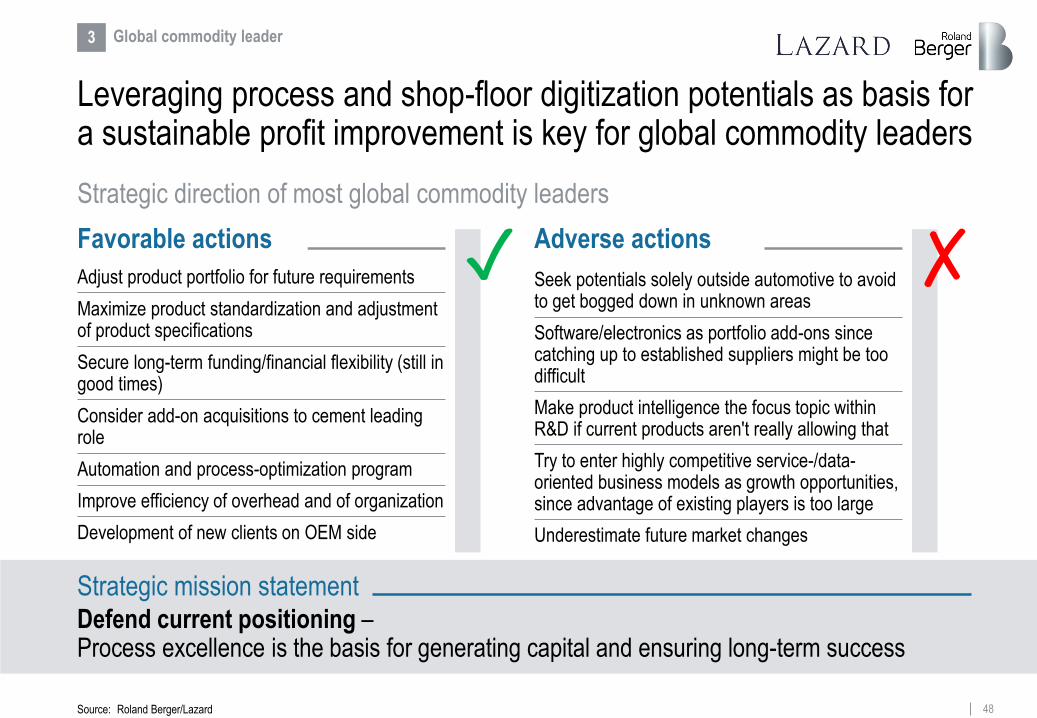
Strategic mission statementDefend current positioning –Process excellence is the basis for generating capital and ensuring long-term success
Leveraging process and shop-floor digitization potentials as basis for a sustainable profit improvement is key for global commodity leaders
Strategic direction of most global commodity leaders
3 Global commodity leader
Source: Roland Berger/Lazard
Seek potentials solely outside automotive to avoid to get bogged down in unknown areas
Software/electronics as portfolio add-ons since catching up to established suppliers might be too difficult
Underestimate future market changes
Make product intelligence the focus topic withinR&D if current products aren't really allowing that
Adverse actions
Maximize product standardization and adjustment of product specifications
Consider add-on acquisitions to cement leading role
Adjust product portfolio for future requirements
Automation and process-optimization program
Improve efficiency of overhead and of organization
Favorable actions
Development of new clients on OEM side
✓ ✗
Try to enter highly competitive service-/data-oriented business models as growth opportunities, since advantage of existing players is too large
Secure long-term funding/financial flexibility (still in good times)
49
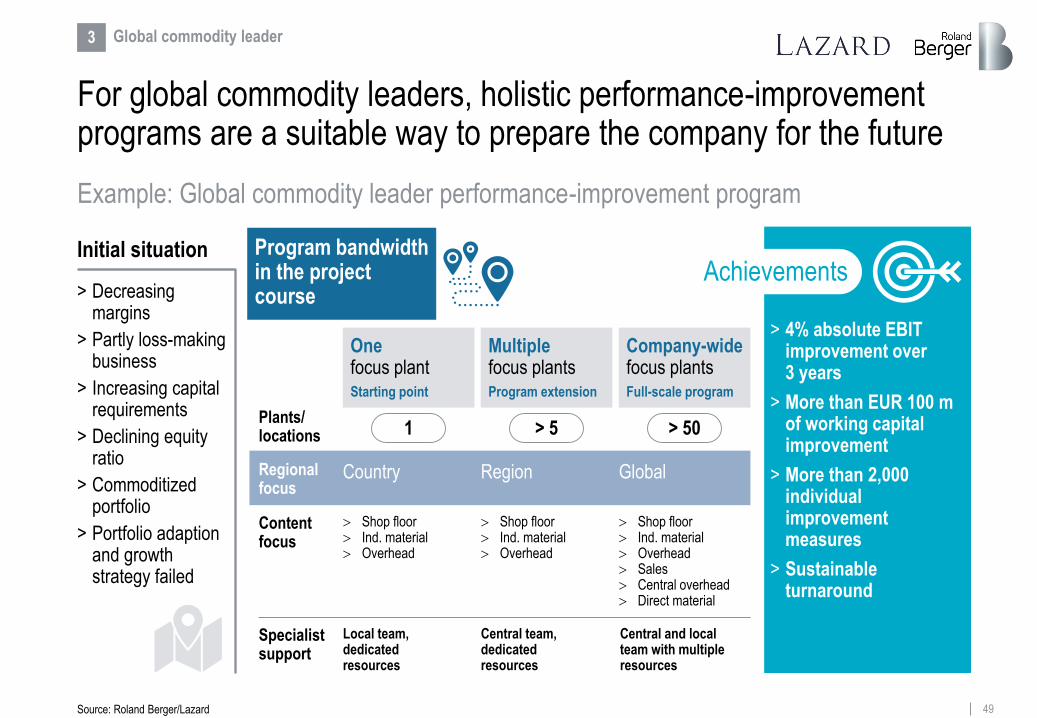
Program bandwidth in the project course
For global commodity leaders, holistic performance-improvement programs are a suitable way to prepare the company for the future
Example: Global commodity leader performance-improvement program
Initial situation
> Decreasing margins
> Partly loss-making business
> Increasing capital requirements
> Declining equity ratio
> Commoditized portfolio
> Portfolio adaption and growth strategy failed
> 4% absolute EBIT improvement over 3 years
> More than EUR 100 m of working capital improvement
> More than 2,000 individual improvement measures
> Sustainable turnaround
Achievements
Source: Roland Berger/Lazard
Plants/ locations
Regionalfocus
Contentfocus
Specialistsupport
Central and local team with multiple resources
Onefocus plantStarting point
Multiplefocus plantsProgram extension
Company-widefocus plantsFull-scale program
Shop floor Ind. material Overhead
Shop floor Ind. material Overhead
Shop floor Ind. material Overhead Sales Central overhead Direct material
1 > 5 > 50
Country Region Global
Local team, dedicated resources
Central team, dedicated resources
3 Global commodity leader

50
Despite a leading-edge product, global new entrants have to deal with technological constraints and missing access to OEMs
Top challenges for most global new entrants
> Fierce competition for talent especially in software development> Automotive hubs and new-technology hubs differ significantly
Workforceavailability
> No familiarity with safety and traceability requirements> Product life cycles and business understanding differ significantly between
automotive and other industries
Automotivestandards
> No access to OEM purchasing or R&D organization> RFQs are only sent out to established suppliers> In terms of digital players, automotive OEMs are not only potential clients
but also potential competitors
Customeraccess
> New technologies require companies to invest heavily in R&D during a time of an uncertain automotive future
> Besides R&D expenses, lobbying also partially required
R&Dexpenses
Need for action
Low High> Certain fields, e.g. battery or electronics, are attacked by multiple suppliers> Many new entrants with strong financial background
Competition
> Mistrust of end customers especially with regard to automated technologies or data security
> Data privacy scandals and fraud are a burden for new technologies> Legal framework is more often than not the limiting factor
Technologyacceptance
How to enter/disrupt
the automotive market?
4 Global new entrant
Source: Roland Berger/Lazard

51
Strategic mission statementIf you can think it, you can do it – Leverage existing know-how to generate new business within automotive industry
For global new entrants it is key to leverage their non-automotive innovations within automotive and to keep their innovation speed
Strategic direction of most global new entrants
4 Global new entrant
Source: Roland Berger/Lazard
Slow down R&D efforts and innovation speed and lose the technological advance as a consequence
M&A to acquire established automotive players to avoid adapting to traditional, long-cycle automotive processes (losing "can-do/let's-try" attitude)
Transform into a traditional automotive supplier and become slower
Adverse actions
Co-operate with automotive OEMs
Build up presence in today's automotive hubs
Bring the product technology on the road by outpacing traditional automotive players
Hire automotive-experienced staff ("buy teams")
Leverage non-automotive innovation for automotive applications
Favorable actions ✓ ✗

52
Top challenges for traditional diversified players are the ongoing commoditization of parts of their portfolios and high R&D expenses
Top challenges for most traditional diversified players
> Major OEMs have all started performance-improvement programs> OEMs pass on reduced margins as well as increasing capital requirements
to their suppliers> OEMs will further use platform concepts to increase volumes for purchased
parts and to leverage scale effects
Price pressure Need
for action
Low High
> New technologies require heavy investment in R&D> Transformation within manufacturing processes needs to be financed
(Industry 4.0 potentials)
R&Dexpenses
> Autonomous driving and car-as-a-service will decrease importance of traditional car characteristics – hardware might become pure commodity
> Car becomes less of a status symbol, hence shift away from lucrative variants
Portfolio com-moditization
> Many suppliers try to enter the same growth segments, e.g. for battery thermal management or interior functions
> Established suppliers are being attacked by new entrants
Increasingcompetition for growthsector
> Employees are used to success of the past years> Future changes and negative implications seem to be far off
Culturalchange How to identify
the right innovations
for the future?
5 Traditional diversified player
Source: Roland Berger/Lazard

53
Strategic mission statementOffense is the best defense – Focus on cost-efficiency or proactive portfolio transition to future growth segments
Most important task for traditional diversified players is the trans-formation of their product portfolios toward future growth segments
Strategic direction of most traditional diversified players
5 Traditional diversified player
Source: Roland Berger/Lazard
Ignore the upcoming changes
Focus on traditional OEMs as clients only and miss chance with new players
Consider starting margin declines as a temporary effect and not as indicator for the industry change
Focus solely on non-automotive as future growth opportunity to avoid getting bogged down in unknown areas
Spread resources across too many growth areas
Adverse actions
Holistic performance improvement project for overhead and operations
Divest areas without sufficient growth potential
M&A activities to speed up portfolio transformation with acquisitions in promising areas
Develop a long-term portfolio strategy
Facilitate a cultural mindset change
Favorable actions
Identify future core competencies and hire employees with the right skill-set
✓ ✗
Rely on current culture and skill-set only, since the right to play in automotive might change in future

54
Technology system integrators will be facing new players as well as automotive OEMs defending their margin potentials
Top challenges for most technology system integrators
Need for action
Low High
> As the competition for future core technologies is in full force, auton-omous driving has the potential to re-shuffle the automotive value chain – however, there are large capex requirements, with uncertain payback
Autonomousdriving
> Traditional and new technologies require R&D investments in parallel> Pre-financing of manufacturing equipment for new technologies> Financing of M&A activities (market shares and/or new technologies)
Financingneeds
> Changing car concepts and changing mobility behavior require product portfolio adaptions
> Increasing importance of lightweight solutions to increase EV range> Car-as-a-service trend causes shift away from lucrative high-end variants as
car becomes less of a status symbol but also opens up new opportunities
Electrification and digitization
> OEMs defend their margin potential and may manufacture future key technologies in-house, stepping away from complete system outsourcing
Breaking up of systems
> New players, e.g. for automated driving or BEV1), push into the market> Digital players have identified automotive as a future growth segment
Increasing competition
> Software and electronics specialists become employee target group, bringing a different cultural mindset into the company
> Organizations need to become more flexible and agile> Employees expect an innovation-friendly environment
Internal cultural change
How to participate in future growth segments?
6 Technology system integrator
Source: Roland Berger/Lazard
1) BEV – Battery electric vehicle
55
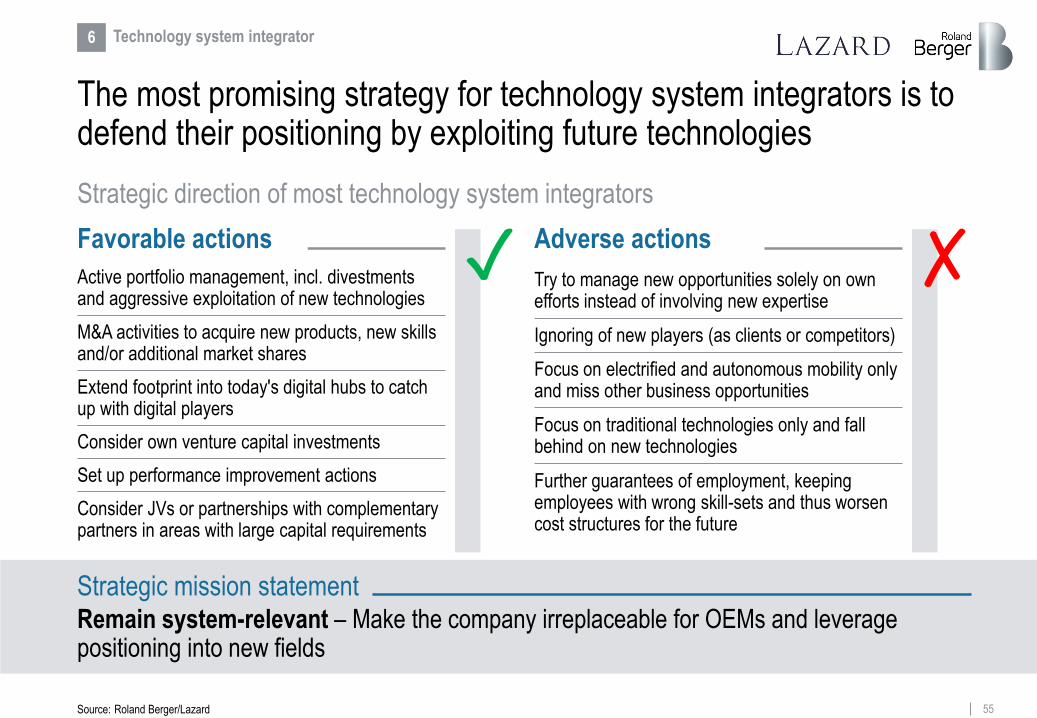
Strategic mission statementRemain system-relevant – Make the company irreplaceable for OEMs and leverage positioning into new fields
The most promising strategy for technology system integrators is to defend their positioning by exploiting future technologies
Strategic direction of most technology system integrators
6 Technology system integrator
Source: Roland Berger/Lazard
Try to manage new opportunities solely on own efforts instead of involving new expertise
Ignoring of new players (as clients or competitors)
Further guarantees of employment, keeping employees with wrong skill-sets and thus worsen cost structures for the future
Focus on electrified and autonomous mobility only and miss other business opportunities
Adverse actions
M&A activities to acquire new products, new skills and/or additional market shares
Extend footprint into today's digital hubs to catch up with digital players
Active portfolio management, incl. divestments and aggressive exploitation of new technologies
Consider own venture capital investments
Favorable actions
Set up performance improvement actions
✓ ✗
Focus on traditional technologies only and fall behind on new technologies
Consider JVs or partnerships with complementary partners in areas with large capital requirements
56
✓
✓
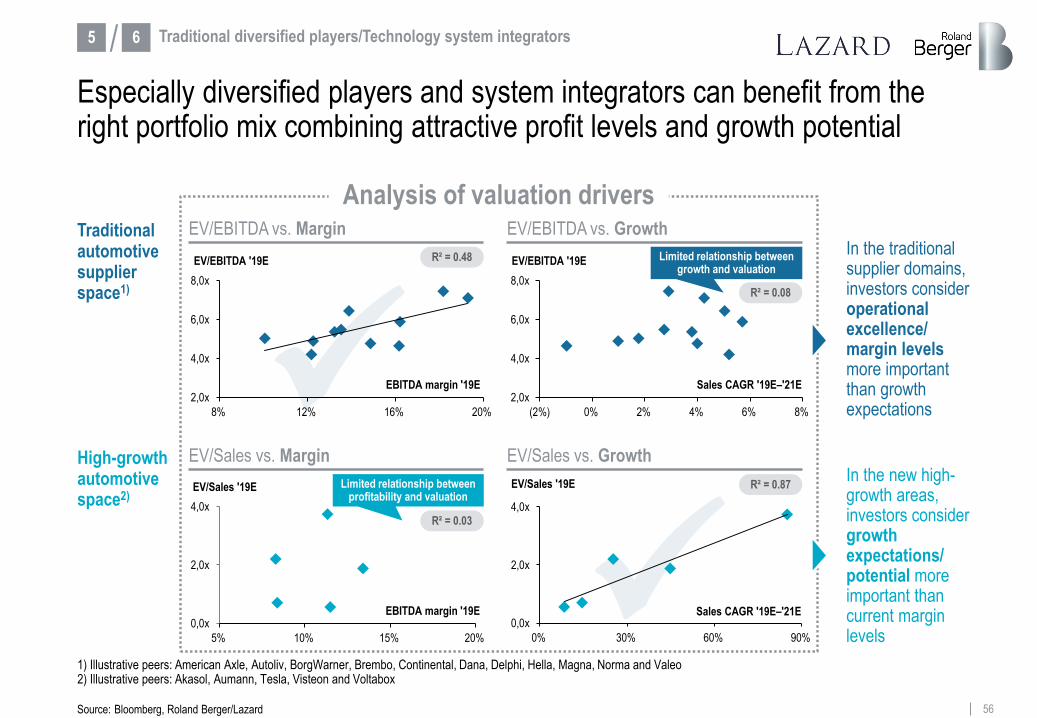
Especially diversified players and system integrators can benefit from the right portfolio mix combining attractive profit levels and growth potential
Source: Bloomberg, Roland Berger/Lazard
5 Traditional diversified players/Technology system integrators6/
Traditional automotive supplier space1)
High-growth automotive space2)
1) Illustrative peers: American Axle, Autoliv, BorgWarner, Brembo, Continental, Dana, Delphi, Hella, Magna, Norma and Valeo2) Illustrative peers: Akasol, Aumann, Tesla, Visteon and Voltabox
2,0x
4,0x
6,0x
8,0x
8% 12% 16% 20%
EV/EBITDA '19E
EBITDA margin '19E
EV/EBITDA vs. Margin EV/EBITDA vs. Growth
EV/Sales vs. Margin EV/Sales vs. Growth
0,0x
2,0x
4,0x
5% 10% 15% 20%
EV/Sales '19E
EBITDA margin '19E0,0x
2,0x
4,0x
0% 30% 60% 90%
EV/Sales '19E
Sales CAGR '19E–'21E
2,0x
4,0x
6,0x
8,0x
(2%) 0% 2% 4% 6% 8%
EV/EBITDA '19E
Sales CAGR '19E–'21E
R² = 0.87
Limited relationship between growth and valuation
Limited relationship between profitability and valuation
R² = 0.48In the traditional supplier domains, investors consider operational excellence/ margin levels more important than growth expectations
In the new high-growth areas, investors consider growth expectations/ potential more important than current margin levels
Analysis of valuation drivers
R² = 0.08
R² = 0.03

57
Suppliers have to act now in order to remain successful in the future
Key takeaways for automotive suppliers
Suppliers with a broad product portfolio are best positioned for upcoming challenges
Structural measures will be essential for suppliers to cope with the growing pressure on margins through 2025
Performance programs are a must for basically all established suppliers – For small suppliers with commoditized portfolio they are vital
Suppliers should not ignore the current technological and economic changes in the market
Expensive cash acquisitions are primarily recommended for larger, financially strong suppliers –Smaller/weaker suppliers should actively consider a disposal, merger or equity raise
Suppliers should proactively ensure mid-term/long-term financial flexibility
In the future, the right employee skill-set becomes one of the most important assets
A universal "one-size-fits-all" strategy does not exist – but it is time to act now
Source: Roland Berger/Lazard
In new, high-growth areas requiring massive R&D/upfront investments, established suppliers should consider adapting VC investments or co-operations/JVs to share the burden
Suppliers should accelerate consolidation/capacity adjustments in the traditional domains and run those as "cash cows"

58
Contents
© Roland Berger/Lazard
The status
Increasingly difficult environ-ment after record profits until last year
A
Roland Berger and Lazard Automotive teams
The contacts
DThe strategies
Suppliers have different opportunities to prepare for the future
CThe future
The transfor-mation of the automotive industry is well underway
B
59
Please contact us for further information
Authors of this study
Ken Oliver FritzManaging Director
+49 69 [email protected]
Christof SöndermannManaging Director
+49 69 [email protected]
Florian DanielPrincipal
+49 89 [email protected]
Felix MoggeSenior Partner
+49 89 [email protected]
Thomas SchlickSenior Partner
+49 69 [email protected]
Source: Roland Berger/Lazard
60
This presentation was prepared by Lazard & Co. GmbH ("Lazard") and Roland Berger GmbH ("RB") exclusively for the benefit and internal use of our clients and solely
as a basis for discussion of certain topics related to the automotive supplier industry described herein. This presentation is strictly confidential and may not be
reproduced, summarized or disclosed, in whole or in part, without the prior written authorization both of Lazard and RB, and by accepting this presentation you hereby
agree to be bound by the restrictions contained herein.
This presentation is based on publicly available information that has not been independently verified by Lazard or RB. Any estimates and projections contained herein
involve significant elements of subjective judgment and analysis, which may or may not be correct. Neither Lazard, nor any of its affiliates, nor any of its direct or indirect
shareholders, nor any of its or their respective members, employees or agents, nor RB provides any guarantee or warranty (express or implied) or assumes any
responsibility with respect to the authenticity, origin, validity, accuracy or completeness of the information and data contained herein or assumes any obligation for
damages, losses or costs (including, without limitation, any direct or consequential losses) resulting from any errors or omissions in this presentation.
The economic estimates, projections and valuations contained in this presentation are necessarily based on current market conditions, which may change significantly
over a short period of time. In addition, this presentation contains certain forward-looking statements regarding, among other things, the future financial performance of
automotive suppliers, which may include projections based on growth strategies, business plans and trends in the automotive sector and global markets. These
forward-looking statements are only predictions based on current expectations; the actual future results, levels of activity and/or financial performance of automotive
suppliers may differ materially from the predictions contained in this presentation. Changes and events occurring after the date hereof may, therefore, affect the validity
of the statements contained in this presentation, and neither Lazard nor RB assumes any obligation to update and/or revise this presentation or the information and
data upon which it has been based.