Embed Size (px)
Citation preview
Foreign Agricultural Service
GAIN ReportGlobal Agriculture Information Network
Required Report - public distribution Date: 11/30/2001
GAIN Report #NL1081
The Netherlands
Retail Food Sector
Report
2001
Approved by:Phil LetarteU.S. Embassy, The HaguePrepared by:Wendalin Kolkman
Report Highlights: Dutch eating habits are changing, with consumers demanding convenience productssuch as ready-to-eat-meals, prepacked fresh foods, more variety, and more specialtyfood items. Product quality is as important as taste and health characteristics. Also,sustainability, environmental and animal welfare play an increasingly importantrole in marketing. While consumer interest in organic food, functional food, Kosherfood, Halal food, and private labels is growing, they are expected to remain nichemarkets.
Includes PSD changes: NoIncludes Trade Matrix: No
Annual ReportThe Hague [NL1], NL

GAIN Report #NL1081
Table of ContentsSummary . . . . . . . . . . . . . . . . . . . . . . . . . . . . . . . . . . . . . . . . . . . . . . . . . . . . . . . . . . . . . . 1Section I. Market Summary . . . . . . . . . . . . . . . . . . . . . . . . . . . . . . . . . . . . . . . . . . . . 3
Demographic Characteristics . . . . . . . . . . . . . . . . . . . . . . . . . . . . . . . . . . . . . . . . . 3Economic Development . . . . . . . . . . . . . . . . . . . . . . . . . . . . . . . . . . . . . . . . . . . . . 3
Transition to Euro Currency . . . . . . . . . . . . . . . . . . . . . . . . . . . . . . . . . . . 5Dutch Food Purchasing Attributes . . . . . . . . . . . . . . . . . . . . . . . . . . . . . . . . . . . . . 6Opportunities for U.S. Products . . . . . . . . . . . . . . . . . . . . . . . . . . . . . . . . . . . . . . . 9Food Safety Policy . . . . . . . . . . . . . . . . . . . . . . . . . . . . . . . . . . . . . . . . . . . . . . . . . 9
The Netherlands Food Authority . . . . . . . . . . . . . . . . . . . . . . . . . . . . . . . . 9Dutch Commodities Act . . . . . . . . . . . . . . . . . . . . . . . . . . . . . . . . . . . . . . 9Improved GMO Labeling . . . . . . . . . . . . . . . . . . . . . . . . . . . . . . . . . . . . . 10Voluntary Functional Foods Code . . . . . . . . . . . . . . . . . . . . . . . . . . . . . . 10CBL-BRC-code . . . . . . . . . . . . . . . . . . . . . . . . . . . . . . . . . . . . . . . . . . . . 10EUREP-GAP . . . . . . . . . . . . . . . . . . . . . . . . . . . . . . . . . . . . . . . . . . . . . . 10Global Food Safety Initiative . . . . . . . . . . . . . . . . . . . . . . . . . . . . . . . . . . 11
Section II. Road Map for Market Entry . . . . . . . . . . . . . . . . . . . . . . . . . . . . . . . . . . . 12Entry Strategy . . . . . . . . . . . . . . . . . . . . . . . . . . . . . . . . . . . . . . . . . . . . . . . . . . . . 12Market Structure . . . . . . . . . . . . . . . . . . . . . . . . . . . . . . . . . . . . . . . . . . . . . . . . . 13
Discounters . . . . . . . . . . . . . . . . . . . . . . . . . . . . . . . . . . . . . . . . . . . . . . . 15Ethnic Food Stores . . . . . . . . . . . . . . . . . . . . . . . . . . . . . . . . . . . . . . . . . . 16Online Shopping . . . . . . . . . . . . . . . . . . . . . . . . . . . . . . . . . . . . . . . . . . . 16Private Labels . . . . . . . . . . . . . . . . . . . . . . . . . . . . . . . . . . . . . . . . . . . . . . 17
Company Profiles . . . . . . . . . . . . . . . . . . . . . . . . . . . . . . . . . . . . . . . . . . . . . . . . . 18Buying Procedures . . . . . . . . . . . . . . . . . . . . . . . . . . . . . . . . . . . . . . . . . . . . . . . . 20Evaluating Importers . . . . . . . . . . . . . . . . . . . . . . . . . . . . . . . . . . . . . . . . . . . . . . 20
General profile of the Dutch Businessman/woman . . . . . . . . . . . . . . . . . 21Section III. Competition . . . . . . . . . . . . . . . . . . . . . . . . . . . . . . . . . . . . . . . . . . . . . . . 21Section IV. Best Products Prospects . . . . . . . . . . . . . . . . . . . . . . . . . . . . . . . . . . . . . . 22Section V. Post Contact and Further Information . . . . . . . . . . . . . . . . . . . . . . . . . . . 27
Annex 1. . . . . . . . . . . . . . . . . . . . . . . . . . . . . . . . . . . . . . . . . . . . . . . . . . . . . . . . 28Annex 2. . . . . . . . . . . . . . . . . . . . . . . . . . . . . . . . . . . . . . . . . . . . . . . . . . . . . . . . 29Annex 3. . . . . . . . . . . . . . . . . . . . . . . . . . . . . . . . . . . . . . . . . . . . . . . . . . . . . . . . 30Annex 4. . . . . . . . . . . . . . . . . . . . . . . . . . . . . . . . . . . . . . . . . . . . . . . . . . . . . . . . 31

GAIN Report #NL1081 Page 1 of 37
UNCLASSIFIED Foreign Agricultural Service/USDA
SummaryThe Netherlands has a highly developed and competitive food market. The Dutch food retail sector ischaracterized by a high number of supermarkets with a relatively small floor-space. There are only a few“hypermarkets” or superstores. Large Dutch supermarket chains account for about 65 percent of total sales,while specialty stores, open air markets, department stores, convenience stores in gas station, etc., make up thebalance. Specialty stores, like butchers, greengrocers and fishmongers, are losing market shares to supermarketsbecause of their lack of economies of scale. Although the market share of Dutch supermarket chains is growing,the classic supermarket is expected to evolve into a combination supermarket/catering service. Relatively newfood retailers in the Dutch market are convenience stores in gas stations, food stores at railway stations andairports, and small convenience food retailers in the inner cities.
As a result of changing demographics and increased wealth, Dutch eating habits are changing, with consumersdemanding convenience products such as ready-to-eat-meals, prepacked fresh foods, more variety, and morespecialty food items. Product quality is as important as taste and health characteristics. Also, sustainability,environmental and animal welfare play an increasingly important role in marketing. While consumer interest inorganic food, functional food, Kosher food, Halal food, and private labels is growing, they are expected toremain niche markets.
In 2000, total supermarket sales were US$ 19.9 billion. The Dutch food retail industry is dominated by theworld’s 4th largest food retail organization Ahold/Albert Heijn with a market share of 28 percent. Food retailerAhold/Albert Heijn purchases food for its own Albert Heijn supermarket chain. Because of the relatively smallmarket shares of some Dutch food retailers, many of them are members of large food buying groups to gainmass and synergies. In The Netherlands, food buying groups Laurus (26% market share), TSN (24%) andSuperunie (12%) sell to various supermarket chains directly, or through wholesalers. Albert Heijn, Laurus, TSNand Superunie control 90 percent of the Dutch food retail market. It is forecast that in 10 years the majority ofDutch food products will be sold through international buying alliances, like AMS and Europartners.
Dutch food retail organizations (like Albert Heijn, Aldi, Lidl) and food buying groups (like Laurus, TSN,Superunie) almost never import food products directly because they are generally low volume, specialtyproducts. Food retailers and food buying groups often refer U.S. exporters to Dutch specialty food importers,which already import for them and are better equipped to introduce U.S. products. A U.S. product will be ofinterest if it is innovative and is profitable. Most popular products are those which are new, have a higher thanaverage trade margin, and have a promotional support plan.
The Netherlands has a large food production and processing industry, which employs about 17 percent of thepopulation and contributes 6 percent of the gross domestic product. The food processing industry providesapproximately 25 percent of total Dutch industrial output, of which about 50 percent is exported. The Dutchfood processing industry is led by Unilever, the world’s 3rd largest food company. EU countries also supplyfoods and beverages to the Dutch market. These foreign suppliers operate with relatively low transportationcosts and fast delivery times. Also, their products are not subject to import duties nor do they face majoringredient or labeling requirements. Therefore, U.S. food products must be highly competitive, and specialty orniche items to sell in the Dutch food market.

GAIN Report #NL1081 Page 2 of 37
UNCLASSIFIED Foreign Agricultural Service/USDA
Exchange Rate
Year U.S. $ Euro Dutch Florin (guilder)
1996 1 - 1.68
1997 1 - 1.95
1998 1 - 1.98
1999 1 0.94 2.07
2000 1 1.09 2.39
2001* 1 1.14 2.45*Note: Exchange rate for the first six months
GAIN Report #NL1081 Page 3 of 37
UNCLASSIFIED Foreign Agricultural Service/USDA
Section I. Market Summary
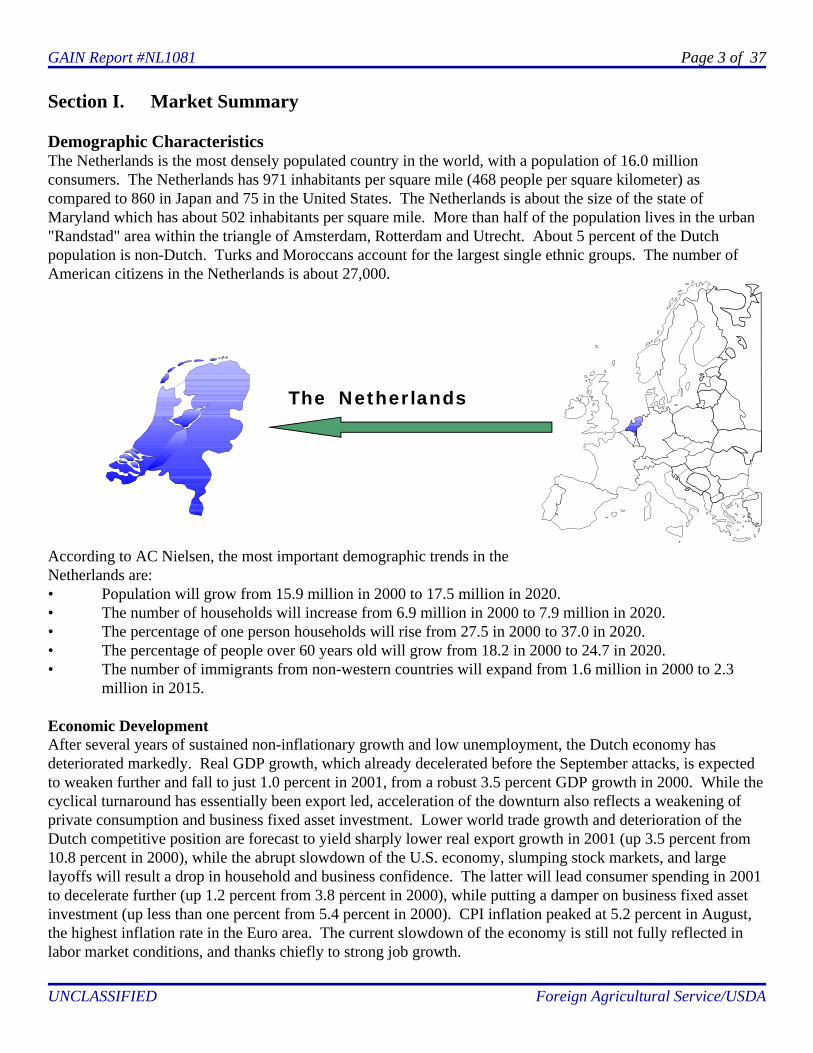
Demographic CharacteristicsThe Netherlands is the most densely populated country in the world, with a population of 16.0 millionconsumers. The Netherlands has 971 inhabitants per square mile (468 people per square kilometer) ascompared to 860 in Japan and 75 in the United States. The Netherlands is about the size of the state ofMaryland which has about 502 inhabitants per square mile. More than half of the population lives in the urban"Randstad" area within the triangle of Amsterdam, Rotterdam and Utrecht. About 5 percent of the Dutchpopulation is non-Dutch. Turks and Moroccans account for the largest single ethnic groups. The number ofAmerican citizens in the Netherlands is about 27,000.
According to AC Nielsen, the most important demographic trends in theNetherlands are:• Population will grow from 15.9 million in 2000 to 17.5 million in 2020.• The number of households will increase from 6.9 million in 2000 to 7.9 million in 2020.• The percentage of one person households will rise from 27.5 in 2000 to 37.0 in 2020.• The percentage of people over 60 years old will grow from 18.2 in 2000 to 24.7 in 2020.• The number of immigrants from non-western countries will expand from 1.6 million in 2000 to 2.3
million in 2015.
Economic DevelopmentAfter several years of sustained non-inflationary growth and low unemployment, the Dutch economy hasdeteriorated markedly. Real GDP growth, which already decelerated before the September attacks, is expectedto weaken further and fall to just 1.0 percent in 2001, from a robust 3.5 percent GDP growth in 2000. While thecyclical turnaround has essentially been export led, acceleration of the downturn also reflects a weakening ofprivate consumption and business fixed asset investment. Lower world trade growth and deterioration of theDutch competitive position are forecast to yield sharply lower real export growth in 2001 (up 3.5 percent from10.8 percent in 2000), while the abrupt slowdown of the U.S. economy, slumping stock markets, and largelayoffs will result a drop in household and business confidence. The latter will lead consumer spending in 2001to decelerate further (up 1.2 percent from 3.8 percent in 2000), while putting a damper on business fixed assetinvestment (up less than one percent from 5.4 percent in 2000). CPI inflation peaked at 5.2 percent in August,the highest inflation rate in the Euro area. The current slowdown of the economy is still not fully reflected inlabor market conditions, and thanks chiefly to strong job growth.
The Netherlands

GAIN Report #NL1081 Page 4 of 37
UNCLASSIFIED Foreign Agricultural Service/USDA
GAIN Report #NL1081 Page 5 of 37
UNCLASSIFIED Foreign Agricultural Service/USDA
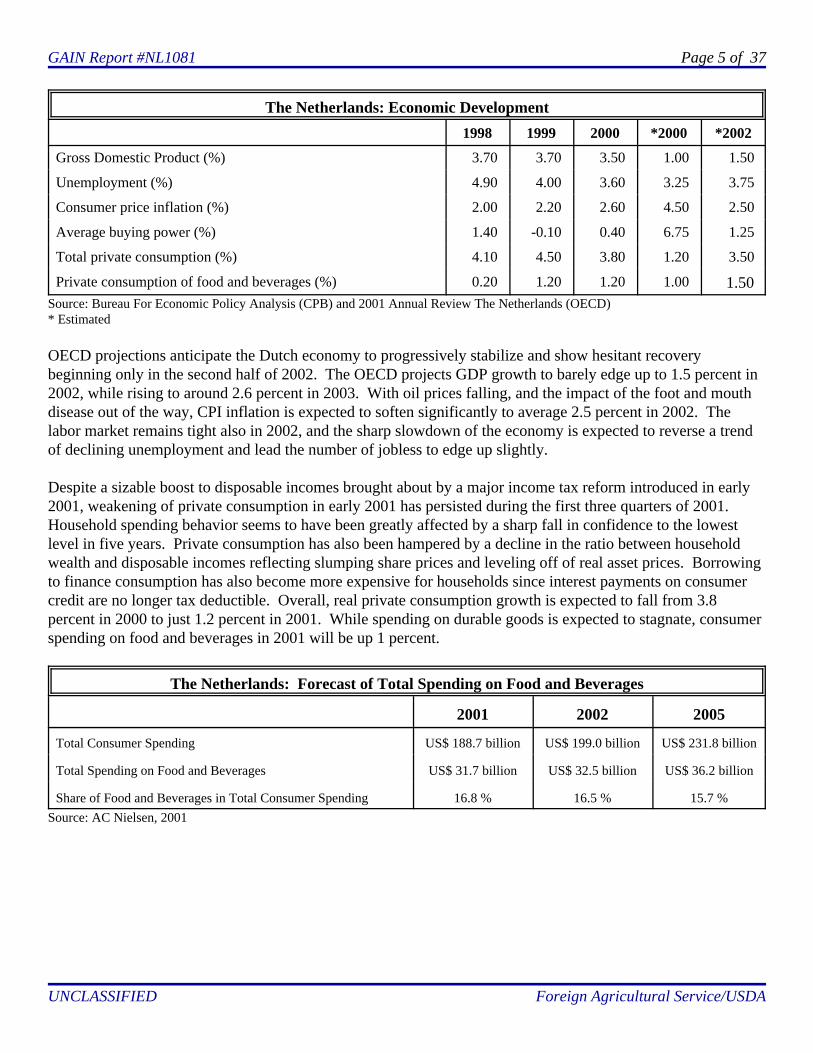
The Netherlands: Economic Development
1998 1999 2000 *2000 *2002
Gross Domestic Product (%) 3.70 3.70 3.50 1.00 1.50
Unemployment (%) 4.90 4.00 3.60 3.25 3.75
Consumer price inflation (%) 2.00 2.20 2.60 4.50 2.50
Average buying power (%) 1.40 -0.10 0.40 6.75 1.25
Total private consumption (%) 4.10 4.50 3.80 1.20 3.50
Private consumption of food and beverages (%) 0.20 1.20 1.20 1.00 1.50Source: Bureau For Economic Policy Analysis (CPB) and 2001 Annual Review The Netherlands (OECD)* Estimated
OECD projections anticipate the Dutch economy to progressively stabilize and show hesitant recoverybeginning only in the second half of 2002. The OECD projects GDP growth to barely edge up to 1.5 percent in2002, while rising to around 2.6 percent in 2003. With oil prices falling, and the impact of the foot and mouthdisease out of the way, CPI inflation is expected to soften significantly to average 2.5 percent in 2002. Thelabor market remains tight also in 2002, and the sharp slowdown of the economy is expected to reverse a trendof declining unemployment and lead the number of jobless to edge up slightly.
Despite a sizable boost to disposable incomes brought about by a major income tax reform introduced in early2001, weakening of private consumption in early 2001 has persisted during the first three quarters of 2001. Household spending behavior seems to have been greatly affected by a sharp fall in confidence to the lowestlevel in five years. Private consumption has also been hampered by a decline in the ratio between householdwealth and disposable incomes reflecting slumping share prices and leveling off of real asset prices. Borrowingto finance consumption has also become more expensive for households since interest payments on consumercredit are no longer tax deductible. Overall, real private consumption growth is expected to fall from 3.8percent in 2000 to just 1.2 percent in 2001. While spending on durable goods is expected to stagnate, consumerspending on food and beverages in 2001 will be up 1 percent.
The Netherlands: Forecast of Total Spending on Food and Beverages
2001 2002 2005
Total Consumer Spending US$ 188.7 billion US$ 199.0 billion US$ 231.8 billion
Total Spending on Food and Beverages US$ 31.7 billion US$ 32.5 billion US$ 36.2 billion
Share of Food and Beverages in Total Consumer Spending 16.8 % 16.5 % 15.7 %Source: AC Nielsen, 2001
GAIN Report #NL1081 Page 6 of 37
UNCLASSIFIED Foreign Agricultural Service/USDA
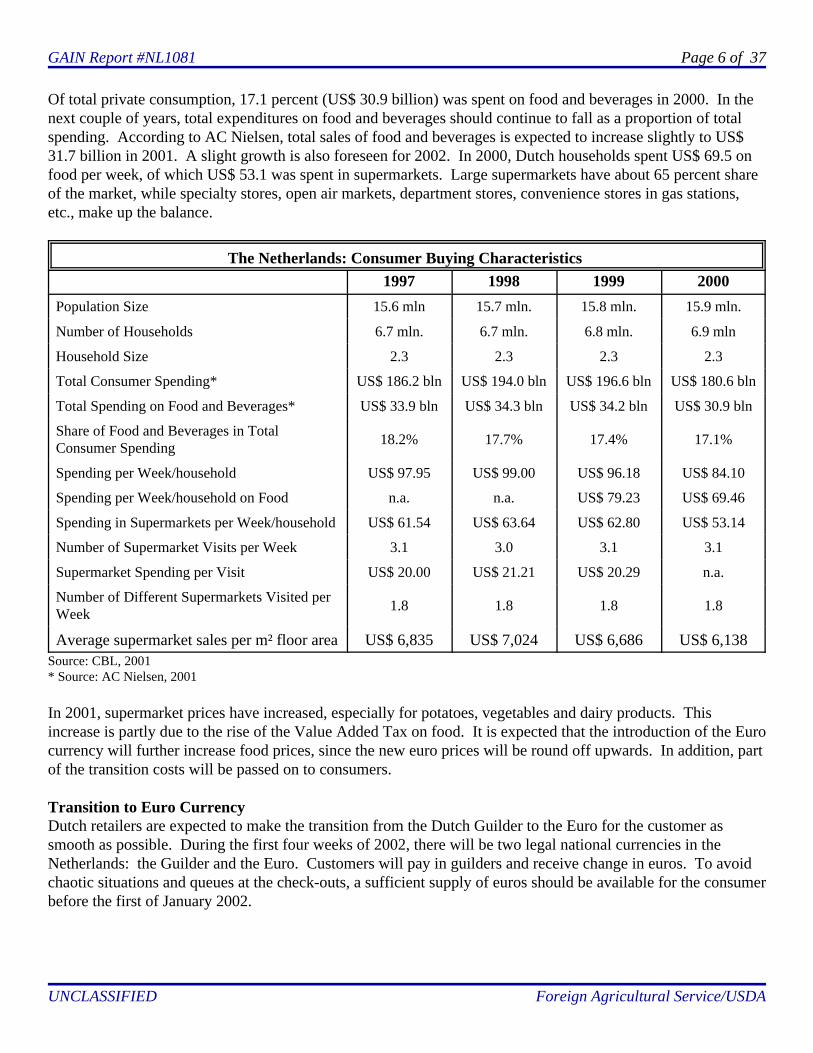
Of total private consumption, 17.1 percent (US$ 30.9 billion) was spent on food and beverages in 2000. In thenext couple of years, total expenditures on food and beverages should continue to fall as a proportion of totalspending. According to AC Nielsen, total sales of food and beverages is expected to increase slightly to US$31.7 billion in 2001. A slight growth is also foreseen for 2002. In 2000, Dutch households spent US$ 69.5 onfood per week, of which US$ 53.1 was spent in supermarkets. Large supermarkets have about 65 percent shareof the market, while specialty stores, open air markets, department stores, convenience stores in gas stations,etc., make up the balance.
The Netherlands: Consumer Buying Characteristics 1997 1998 1999 2000
Population Size 15.6 mln 15.7 mln. 15.8 mln. 15.9 mln.
Number of Households 6.7 mln. 6.7 mln. 6.8 mln. 6.9 mln
Household Size 2.3 2.3 2.3 2.3
Total Consumer Spending* US$ 186.2 bln US$ 194.0 bln US$ 196.6 bln US$ 180.6 bln
Total Spending on Food and Beverages* US$ 33.9 bln US$ 34.3 bln US$ 34.2 bln US$ 30.9 bln
Share of Food and Beverages in TotalConsumer Spending 18.2% 17.7% 17.4% 17.1%
Spending per Week/household US$ 97.95 US$ 99.00 US$ 96.18 US$ 84.10
Spending per Week/household on Food n.a. n.a. US$ 79.23 US$ 69.46
Spending in Supermarkets per Week/household US$ 61.54 US$ 63.64 US$ 62.80 US$ 53.14
Number of Supermarket Visits per Week 3.1 3.0 3.1 3.1
Supermarket Spending per Visit US$ 20.00 US$ 21.21 US$ 20.29 n.a.
Number of Different Supermarkets Visited perWeek 1.8 1.8 1.8 1.8
Average supermarket sales per m² floor area US$ 6,835 US$ 7,024 US$ 6,686 US$ 6,138Source: CBL, 2001 * Source: AC Nielsen, 2001
In 2001, supermarket prices have increased, especially for potatoes, vegetables and dairy products. Thisincrease is partly due to the rise of the Value Added Tax on food. It is expected that the introduction of the Eurocurrency will further increase food prices, since the new euro prices will be round off upwards. In addition, partof the transition costs will be passed on to consumers.
Transition to Euro CurrencyDutch retailers are expected to make the transition from the Dutch Guilder to the Euro for the customer assmooth as possible. During the first four weeks of 2002, there will be two legal national currencies in theNetherlands: the Guilder and the Euro. Customers will pay in guilders and receive change in euros. To avoidchaotic situations and queues at the check-outs, a sufficient supply of euros should be available for the consumerbefore the first of January 2002.

GAIN Report #NL1081 Page 7 of 37
UNCLASSIFIED Foreign Agricultural Service/USDA
Dutch Food Purchasing AttributesAccording to the Dutch Food Retail Association CBL, consumers prefer to shop in supermarkets. More than 4million consumers shop daily in the 5,100 Dutch supermarkets. In 2000, total supermarket sales amounted toUS$ 19.9 billion. Since consumers prefer one-stop shopping, supermarkets expand their services andassortments with non-food products such as personal computers, crockery, textiles, books, CD’s, and servicessuch as photo development and shoe repair. In 2000, sales of these articles and services was US$ 888.7 million. At the moment, non-food products have a 5 percent share of total supermarket sales. A rapid increase by 25percent per year is expected. In 2001, one major supermarket chain replaced more than 1,000 food productswith higher margin non-food products.
As a result of changing demographics and increased wealth, Dutch eating habits are changing. Consumers aredemanding convenience products such as ready-to-eat-meals, prepacked fresh foods, more variety, and morespecialty food items. For the modern consumer, product quality is as important as taste and healthcharacteristics. Also, sustainability, environmental and animal welfare play an increasingly important role inmarketing and consumer relations. In addition, consumer interest in organic food, functional food, Kosher food,Halal food, and private labels is growing, albeit slowly. In 2000, sales increases occurred in ready-to-eat meals,organic food and meat substitutes. Sales increases were also recorded for non-food and fresh foods. The freshproduce departments are still gaining in importance for supermarkets. At the moment, the fresh producedepartments account for almost the half of total supermarket sales (US$ 9.5 billion).
A Brief Description of the Dutch Consumer
The Consumer in the Drivers Seat: internet, large amount of choices, price-sensitive
Multi-channel: increasing distribution channels food, 24-hour economy, catering
Food-trends: health, functional food, snacks, convenience foods, nutritionalawareness, increase of fresh products
Brands in the Future: pillars of trust, confidenceSource: NFO Trendbox, 2000
Current consumer trends are:
• Most consumers (53 percent) visit the supermarket by car, 29 percent use the bicycle and 18 percent of consumers go by foot. On average, traveling time to the supermarket is about nine minutes.
• More than 80 percent of the Dutch, especially younger people, are confident that the food supply in theNetherlands is safe. They also believe that the supermarket is a place where safe food is sold, comparedto 45 percent in other Western European countries. A sizeable group has serious doubts regarding foodsafety for specific sectors. Most of the concerns are regarding the safety of convenience foods, meatand delicatessen, chicken, eggs and GMO foods. About 20 percent of the population no longer trust theinformation that is released about health risks, quality and origin of meat, due to the recent meat crises(BSE, FMD, Swine fever etc.). More than 60 percent of the Dutch think that Dutch food products aresafer than foreign products. In general, Dutch consumers have very limited knowledge of foodproduction. Survey responses indicate that one-third of the Dutch population is willing to pay a higherprice for food which is guaranteed safe.

GAIN Report #NL1081 Page 8 of 37
UNCLASSIFIED Foreign Agricultural Service/USDA
• Good quality is rated as the most important reason for choosing a supermarket, followed by a pleasantshopping atmosphere. Low prices are rated sixth. Supermarkets offer weekly specials for owners ofclient cards. Almost 80 percent of all consumers have a client card for at least one supermarket.
• Supermarkets have the highest market share for all fresh food products. The number of consumers whobuy their fresh food products prepackaged is rapidly increasing. The trend toward prepacked fresh foodproducts is irreversible, with the demand for convenience playing an important role. Young householdswith children buy prepacked fresh food more often than other households.
• Consumer preference for branded products has generally increased or remained stable. The highestincrease in preference for branded products is in pet food, and coffee. Consumers appreciate privatelabel products most because they offer good quality for attractive prices. Therefore, price consciousconsumers favor private label products. In 2000, private label products volume decreased by 0.1 percentto a 20.5 percent of the market, but increased 0.2 percent in value to an 18.6 market share.
• In an increasing number of households less time, or very little time, is spent on preparing meals. This ispartly due to the rise of one person households. In more than one out of ten households, warm mealsare often or always consumed out of the home. The percentage of consumers that eat ready-to-eatmeals has increased from 19 percent in 1995 to 25 percent in 2000. Main reasons to choose ready-to-eat meals are lack of time to cook. Particularly on weekends less meals are cooked at home. Almost 75percent of Dutch households own a microwave oven, compared to 49 percent in 1995. It is expectedthat the convenience market will increase by 50 percent to US$ 1.2 billion in 2005.
• Customers are seeking a wider product range and better service. In particular younger consumers liketo be surprised with new products in the supermarket. Almost 70 percent of all households like findingnew products in the supermarket and 45 percent indicate that cooking demonstrations and tasting newproducts make shopping more fun. Sales of medicines in a supermarket drugstore-department aregreatly appreciated by customers. More and more Dutch consumers decide what they want to purchaseduring their supermarket visit rather than using shopping lists.
• The demographic make-up of the Dutch population is changing rapidly. Although the Netherlands stillhas a relatively young population, the growth-rate of the older generation is accelerating. This is due tofalling birth rates and rising life expectancy. Within 20 years, one out of five people will be over 65years old. Therefore, a sharp rise can be expected in sales of food products that prevent age-relateddiseases. Consequently, functional foods and nutraceuticals may fulfill an increasingly important rolein the average diet. However, potential barriers to this growth include regulations, confusion over themeaning of the term "functional food", complicated health information and the negative perception ofGMO’s in food. In the Netherlands, the leading segment in functional foods is dairy. In 1999, the salesof dairy products with health claims amounted to US$ 165.1 million. Total sales of functional dairyfoods has been increasing by 20 percent per year.
• Product quality exceeds being tasteful and healthy. Sustainability, environmental and animal care playan increasingly important role. In addition, people get more attached to durable and sociallyresponsible production methods as they age. Therefore, the rise of elderly people in the Netherlandswill increase consumer interest in production methods and the origin of products (tracing & tracking). As a result, the demand for organic foods may grow, although many believe that organic products areexpensive. On average, organic foods are regarded as healthier. Total Dutch sales of organic foods areestimated to be US$ 293 million in 2001. Supermarkets account for 45 percent of total organic food

GAIN Report #NL1081 Page 9 of 37
UNCLASSIFIED Foreign Agricultural Service/USDA
sales and their market share is increasing.
• About 1.5 million Muslims live in the Netherlands. Many are from Turkey and Morocco. In 2001, thisgroup will spend about US$ 2.4 billion on food and beverages, partly on Halal food. ApproximatelyUS$ 0.6 billion of the total is spent in Dutch supermarkets. Because of their expected populationgrowth, the demand for Halal food and Kosher food is increasing. Non-Jewish consumers, likeMuslims, vegetarians, and consumers intolerant to lactose, represent 40 to 50 percent of the consumersof Kosher food. The same can be said about Halal food. Non-Muslim and non-Jewish consumersbelieve that Halal and Kosher food are very pure. In addition, because of its traceability consumershave the feeling that the food is very safe to consume.
• About 70 percent of the population states in surveys that they are concerned about genetically modifiedorganisms (GMO’s) in food. But still, GMO’s are generally less of an issue with the consumer thenwith food producers, importer/wholesalers and retailers. Consumer organizations usually have abalanced opinion, while environment groups are against the use of GMO’s in food. Producers andretailers are sometimes targeted by anti GMO pressure groups and therefore fear consumer scares andconsequent loss of market share. Therefore, the use of GMO ingredients in food products is decreasing. If more than 1 percent of GMO’s are used in food, EU regulations specify that it is clearly specified onthe label.
• The Dutch consumer is spending more and more money on food, mainly due to increasing out-of-homeconsumption. Total sales of the Dutch hotel, restaurant and institution sector is increasing twice as fastas total supermarket sales. Sales of snacks and desserts in company cafetarias are increasing rapidly. Consequently, the hotel, restaurant and institution sector has become the biggest competitor to Dutchsupermarkets. In 1999, total food sales of the Dutch hotel, restaurant and institution sector grew by 7percent to US$ 4.6 billion. Convenience shops in gas station are another threat to the supermarketindustry. In 1999, total food sales at gas stations increased 15 percent to US$ 0.8 billion. It is expectedthat total food sales at gas stations will grow to US$ 1.3 billion in 2005. The sales of soft drinks, sportdrinks, prepacked sandwiches and dairy drinks show the strongest growth. Shell and BP havecombined a market share of 50 percent, while Total, Fina and Esso account for 40 percent.
Trends in the Dutch Food Market
Health natural ingredients - low calories - no sugar - fresh - organic
Convenience frozen foods - fresh, prepacked - take-away - easy to prepare
Price special offers - shop-around
Winners fish - meals - petfood
Distribution more power to the supermarket - fewer specialty stores - more shopping at the gas andrailway station
Stores more personal service - wider assortment - more fresh and non-food - convenience foods -more exotic products - environmental friendly products
Opportunities for U.S. ProductsU.S. food products must be highly competitive or differentiated to sell in the Dutch food market. At the

GAIN Report #NL1081 Page 10 of 37
UNCLASSIFIED Foreign Agricultural Service/USDA
moment, the main trade barriers for U.S. food products are high freight costs, and in particular the high USdollar. However, some continue to be successful (see Annex: 1.).
Advantages Challenges
Sophisticated market, good buying power Markets are saturated, competition is fierce
Well organized trading system, many speak English Transportation costs, import duties
Favorable image of American products Label & ingredient requirements
Strong interest with buyers in unique and innovativeproducts
Difficult to attract the attention of the large food buyingorganizations
Food Safety Policy
The Netherlands Food AuthorityThe Netherlands Food Authority (NVA), which is currently being set up, will be responsible for communicatinginformation regarding food and production methods, as well as conducting research and carry out qualitychecks. Deliberations are still going on as to the final structure and authority of the NVA. The NVA willattempt to integrate the food safety-related regulatory functions previously performed separately by the Ministryof Agriculture (for food production) and Ministry of Health (for post-production food safety). In October 2001,the Dutch Cabinet decided that the NVA will continue to report to both the Health and Agriculture Ministers. Therefore, both Ministers will keep their responsibility regarding to food safety issues. The NVA itself mayevaluate quality control organizations, but will mainly play an advisory role. According to the Dutch food retailindustry, however, it is crucial for the NVA to operate independently of politics, similar to the U.S. Food andDrug Administration. They state that without the power to define its own policy, the Netherlands FoodAuthority can never actually become an authoritative body.
Dutch Commodities ActIn general, The Netherlands follows EU policies regarding labeling and ingredient requirements. The DutchCommodities Act (Warenwet) provides general guidelines and requirements for foods. The basic objectives ofthis law are health protection, product safety and labeling. Besides the Dutch Commodities Act, general aspectsof some primary foods are regulated by two other laws: the Agricultural Quality Act (Landbouwkwaliteitswet)and the Meat Inspection Act (Vleeskeuringswet).
The Agricultural Quality Act concerns primary agricultural products, while the Meat Inspection Act concernsslaughterhouses. These three Acts are basic laws and provide a basis for setting standards but do not specifyparticular standards themselves. Standards concerning specific products or subjects (e.g. labeling and hygienicproduction) are the domain of individual implementing decrees (Royal decrees), based on the Commodities Actor one of the two other Acts mentioned above.

GAIN Report #NL1081 Page 11 of 37
UNCLASSIFIED Foreign Agricultural Service/USDA
Improved GMO LabelingAt the moment, Dutch consumers are reportedly not satisfied with information about GMO ingredients on foodpackaging. According to the Dutch Food Retail Association (CBL), current labeling is insufficient and labelingrequirements should be made more stringent. Detection of genetically modified ingredients should no longer bethe basis for labeling, since the detection methods are not covering all the ingredients. All ingredients processedat any stage of production should be included.
Voluntary Functional Foods CodeThe Dutch Nutrition Center (Voedingscentrum) currently regulates a voluntary code for functional food healthclaims, while the Control Board for the Recommendation of Functional Foods (Keuringsraad AanprijzingGezondheidsproducten) checks label and advertising claims on about 1,000 health products per year. At themoment, only a small number of manufacturers conform to the Nutrition Center’s code, which is widelyregarded as too strict to be practical.
CBL-BRC-codeIn 2001, CBL launched the Dutch version of the British Retail Consortium (BRC) code, a food safety standardfor companies supplying private labels to supermarket chains. In addition to hygiene, the CBL-BRC-code alsopays attention to quality and the production process. After the United Kingdom, The Netherlands is the secondcountry in Europe with such a code. It is expected that other EU member-countries will follow. Currently,every food retail organization in the Netherlands has its own control standard for food and beverages.
EUREP-GAPAs a consequence of BSE, FMD, Swine Fever and other widely publicized food safety problems, 22 leadingEuropean food retailers have recently launched a harmonized third-party certification scheme for their suppliersof fresh produce. Dutch members are the retail organization Ahold/Albert Heijn and the food buying groupsLaurus, TSN and Superunie. These four buying organizations control 90 percent of the Dutch food retailmarket. The 22 food retailers created the Euro Retailer Producer Working Group (EUREP) in 1997. EUREPhas worked with producer and certification groups to establish a standard for "Good Agricultural Practices"(GAP) for fresh produce. The final standard was presented at the EUREP-GAP 2001 conference in Bologna,Italy on October 10-12, 2001, along with a list of accredited certifiers. Retailers present at the conferenceindicated that they have started working with suppliers to ensure their produce is EUREP-GAP certified by 2003or 2004.
The EUREP-GAP standard is being published as the world’s first recognized, harmonized standard for freshproduce production. Retailers, consultants and verification bodies from the agricultural sector all over Europeare involved in the EUREP-GAP process. Until now, total membership has risen to more than 120organizations. EUREP-GAP standards apply to all agricultural sectors: growers of vegetables and fruit,livestock farmers, and farmers of arable crops. In addition to food safety, EUREP-GAP is also focusing onanimal welfare, environmental issues and health conditions for workers.
All food producers/wholesalers which deliver supermarket chain Albert Heijn have to be certified according tothe CBL-CBR-code at the end of 2001. In 2002, these food producers/wholesalers have to meet the EUREP-GAP standards. Albert Heijn has announced that these standards will result in full traceability of food productsand their ingredients.

GAIN Report #NL1081 Page 12 of 37
UNCLASSIFIED Foreign Agricultural Service/USDA
Global Food Safety InitiativeIn addition to EUREP-GAP, 38 food retailers have created the Global Food Safety Initiative (GFSI), whichwould address standards throughout the rest of the distribution channel. EUREP-GAP only covers up to thefarm gate. GFSI was set up in April 2000 and includes food retailers Ahold/Albert Heijn, Tesco, Sainsbury,Walmart, Carrefour, Casino, Aucham and Metro. Rather than developing its own standard, GFSI will insteadprovide a set of "key elements" against which other standards can be benchmarked and approved. The finalizedbenchmark model for food safety standards has to replace the 135 different supplier standards that are nowbeing used worldwide. Implementation of the model would generate considerable cost savings for suppliers. Aiming to speed up reforms to give the appearance of improved food safety in all segments of the distributionchannel, retailers are reportedly seeking support from other parties in the sector.

GAIN Report #NL1081 Page 13 of 37
UNCLASSIFIED Foreign Agricultural Service/USDA
Section II. Road Map for Market Entry
Entry Strategy
• Due to the concentration of buying power in Europe U.S. exporters will have to consider supplyinglarger quantities and dealing with fewer buyers. The introduction of the euro currency is likely tofacilitate trade. Prices should be more uniform due to the euro and to sophisticated electronic purchasingand distribution systems. To develop ties with European retailers, U.S. firms should use distributorswhich have a warehouse and/or distribution facility in Europe to handle the small and frequent ordersfrom retailers.
• There is fierce price competition among food retailers in order to maintain or enlarge their market share. The Netherlands has a large food production industry and nearby EU countries as Germany, Belgium,France and the U.K. are supplying sophisticated foods and beverages to the Dutch market. These foreignsuppliers operate with relatively low transportation costs and their products are not subject to importduties. Therefore, U.S. food product must be highly competitive or differentiated to sell in the Dutchfood market.
• In Europe, the United States enjoys a positive image, particularly among the younger generation. Although, the American colors (red, white and blue) are a draw and can help marketing andpromotional efforts, they may also “color” consumer expectations. American foods do not always enjoya “fine cooking” or “haute cuisine” reputation. In addition, American manufacturers may face somesubtle or implied biases. Europeans are more disposed to buying their own products, believing them tobe of higher quality than American foods.
• Start testing the Dutch market by sending your product- and price information to importers. Includelabels and provide harmonized tariff numbers. Ask importers for their frank opinion on themarketability of your product and, ask if they want to receive samples. Make it easy for them to reply, use a preprinted fax form which they can fill out and fax-return to you. Request a list of importers andavailable market information from OAA/The Hague. Suggestion: send a copy of your mailing toimporters to AgAffairs Office The Hague, enclose your mailing list. Contact info * see Section V.
• Consider the range of trade shows and exhibit your product in the most relevant show, like the SIAL inParis, October 20 - 24, 2002 (even years) or the ANUGA in Cologne, October 11-15, 2003 (odd years). These food shows are the world’s largest of their kind and visited by Dutch and other European foodbuyers. Also, participate in the U.S. Food Export Showcase (USFES) at the Food Marketing Institute(FMI) Convention in Chicago, May 5 - 7, 2002. The USFES is visited by Dutch and other internationalbuyers. See Annex 2.
• Once you have established contact with an interested importer, visit the person and the company andtogether formulate a plan of action. Be patient, show perseverance and involvement. In the Dutch foodretail market, listing fees do not exist. However, a Dutch company usually expects your financialinvolvement in a promotional plan. Contact your State Department of Agriculture and/or your StateInternational Marketing Office and Trade Association. Seek their assistance and find out if you canparticipate in the Market Access Program (MAP).
• Dutch food retail organizations (like Albert Heijn, Aldi, Lidl) and food buying groups (like Laurus, TSN,

GAIN Report #NL1081 Page 14 of 37
UNCLASSIFIED Foreign Agricultural Service/USDA
Superunie) almost never import directly, because of the lower volume of most foreign products. Foodretailers and food buying groups often refer U.S. exporters to Dutch specialty food importers. Theseimporters are well equipped to sell to food retailers and food buying groups and are able to introduceU.S. products. A specialty food importer will “test market” your product with retailers. Their negativeor positive reply weighs heavily on the importers’ decision to import your product. A U.S. product willbe of interest if it is innovative and will produce a profit. Innovation can be the product itself, thepackaging or the pricing. Most popular products are those which are new (and therefore have addedvalue), have a higher than average trade margin, and have a professional support plan. See Annex 3.
• Logistics are a very important issue. Dutch supermarket outlets are usually located in the inner cities anddifficult to reach by truck. They are supplied daily and often even twice a day. Supermarkets want smallstocks, which means frequent and fast delivery to their distribution centers by foodproducers/wholesalers. The fact that specialty food importers are already supplying products toparticular supermarket outlets, makes the logistics much easier.
Success Factors for U.S. Products in the Dutch Market
Brand Private Label
' price/quality ' distribution
' emotion ' power of trade
' advertising ' shelf space
' added value promotions ' price/quality
' product-innovationsSource: ACNielsen, 2000
Market StructureThe Netherlands is a highly developed and competitive market for food. There is fierce price competitionbetween food retailers in order to maintain or enlarge their market share. The Dutch food retail industry ischaracterized by a high number of supermarkets with a relatively small floor-space. There are only a few“hypermarkets” or superstores. Therefore, the average size of a Dutch supermarket is small compared to thosein the U.S. “Large” Dutch supermarkets have about 65 percent of the market, while specialty stores, open airmarkets, department stores, convenience stores, etc., make up the balance. Increasing competition is met fromcompany cafeterias and 24 hour convenience stores in gas stations. Specialty stores, like butchers, greengrocers,fishmongers, etc., are losing market share to supermarkets because of their lack of economies of scale. Thelonger opening hours also create problems for the specialty store, which is often operated by family members. Since 1996, most Dutch supermarkets have been open in the evening until 08:00 P.M. In addition, an increasingnumber of supermarkets are open till 10:00 P.M. About 11 percent of total supermarket sales take place after06:00 P.M.
The Netherlands: Development of Market Shares in Turnover

GAIN Report #NL1081 Page 15 of 37
UNCLASSIFIED Foreign Agricultural Service/USDA
2000 2001 2005
Number Share (%) Number Share (%) Number Share ( %)
Hypermarkets (> 2,500 m²) 49 5 50 5 60 7
Large Supermarkets (1,000 - 2,500 m²) 826 36 838 38 1,000 42
Supermarkets (700 - 1,000 m²) 1,070 28 1,033 27 1,000 26
Small Supermarkets (400 - 700 m²) 1,286 21 1,194 20 940 18
Small Stores (< 400 m²) 2,352 10 2,114 10 1,500 7
Total 5,583 100 5,229 100 4,500 100Source: AC Nielsen, 2001
The Netherlands: Changes in Numbers of Stores per Format
Store formats 1981 1991 1998 2010
Mobile/driving storesNeighborhood stores < 150 m2Service supermarkets < 900 m2Service supermarkets < 2,000 m2Soft discountersHard discountersSuperstores < 6,000 m2Hypermarkets > 6,000 m2Quality discountingNon retail*Multi-cultural immigrant shopsSuperconvenience shops**
Total
4,8604,6841,871
8209761432817
-3
25210
13,637
3,5102,0651,2221,303
746440519-1
45510
9,902
1,1311,2091,0201,427
64363830722
3251,120
7,554
250120550
1,550230920555
404
6501,600
5,974Source: Cap Gemini Ernst & Young, 2000* including homeshopping-systems** including evening shops, petrol shops, railway-shops, camping-shops and excluding delicatessen shops

GAIN Report #NL1081 Page 16 of 37
UNCLASSIFIED Foreign Agricultural Service/USDA
Relatively new food retailers in the Dutch market are food stores at railway stations/airports, small conveniencefood stores in the inner cities and 24 hour convenience stores in gas stations. In 2000, total food sales at gasstations increased about 10 percent. To an increasing extent, large retailers supply to, or own many of theseconvenience outlets. In addition, the wine, liquor, and drug chain-stores are practically all owned by the largefood retail organizations and are growing in importance at the expense of privately owned stores in this marketsector. Although the market share of Dutch supermarket chains is growing, the classic supermarket is expectedto evolve into a combination supermarket/catering service because of:• a 10 percent annual increase of out-of-home consumption • an increasing number of restaurants which sell ready-made meals• upcoming Dining & Meal-shops (something in between restaurant, catering and supermarket)• tighter cooperation between the food industry and wholesalers/retailers• use of e-commerce (by the food industry, the wholesalers and the retailers)
The Dutch food retail industry is dominated by Dutch supermarket chains. The only foreign supermarket chainsare the German volume discounters Aldi and Lidl. French based Metro is only active in its Makro cash & carrybusiness in the Netherlands.
The Netherlands: Shares in Turnover by Product Segments
1999 2000
GroceryConfectioneryDrinksDairy ChilledFrozenCigarettesPersonal CareHousehold
18.818.816.428.421.55.0
15.616.8
18.618.915.027.620.74.6
15.116.4
Source: AC Nielsen, 2000
DiscountersIn the last couple of years, price has become more important to the Dutch consumer. However, in the Dutchfood retail industry, the market share of discounters is still limited. This is mainly due to the relatively lowprices of food and beverages in the Netherlands. The market leader in this segment is Aldi (364 outlets) with atwo-thirds market share, followed by the discounters Basismarkt (187 outlets) and Lidl (82 outlets). It is clearthat the appearance of these discounters has increased the price-consciousness in the Dutch food market. According to AC Nielsen, the market share of discounters in the Dutch food retail industry increased from 7.3percent in 1994 to 9.4 percent in 2000. The average growth of market share is about 0.4 percent per year.
GAIN Report #NL1081 Page 17 of 37
UNCLASSIFIED Foreign Agricultural Service/USDA
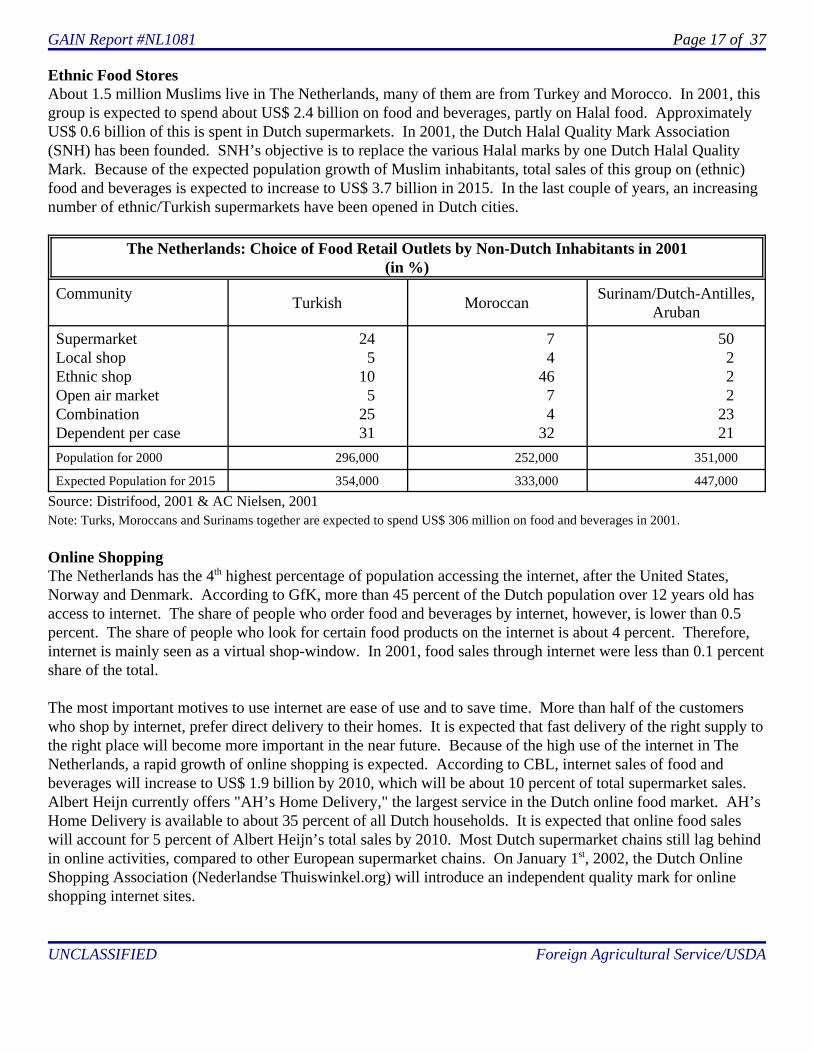
Ethnic Food StoresAbout 1.5 million Muslims live in The Netherlands, many of them are from Turkey and Morocco. In 2001, thisgroup is expected to spend about US$ 2.4 billion on food and beverages, partly on Halal food. ApproximatelyUS$ 0.6 billion of this is spent in Dutch supermarkets. In 2001, the Dutch Halal Quality Mark Association(SNH) has been founded. SNH’s objective is to replace the various Halal marks by one Dutch Halal QualityMark. Because of the expected population growth of Muslim inhabitants, total sales of this group on (ethnic)food and beverages is expected to increase to US$ 3.7 billion in 2015. In the last couple of years, an increasingnumber of ethnic/Turkish supermarkets have been opened in Dutch cities.
The Netherlands: Choice of Food Retail Outlets by Non-Dutch Inhabitants in 2001(in %)
Community Turkish Moroccan Surinam/Dutch-Antilles,Aruban
SupermarketLocal shopEthnic shopOpen air marketCombinationDependent per case
245
105
2531
74
4674
32
50222
2321
Population for 2000 296,000 252,000 351,000
Expected Population for 2015 354,000 333,000 447,000
Source: Distrifood, 2001 & AC Nielsen, 2001Note: Turks, Moroccans and Surinams together are expected to spend US$ 306 million on food and beverages in 2001.
Online ShoppingThe Netherlands has the 4th highest percentage of population accessing the internet, after the United States,Norway and Denmark. According to GfK, more than 45 percent of the Dutch population over 12 years old hasaccess to internet. The share of people who order food and beverages by internet, however, is lower than 0.5percent. The share of people who look for certain food products on the internet is about 4 percent. Therefore,internet is mainly seen as a virtual shop-window. In 2001, food sales through internet were less than 0.1 percentshare of the total.
The most important motives to use internet are ease of use and to save time. More than half of the customerswho shop by internet, prefer direct delivery to their homes. It is expected that fast delivery of the right supply tothe right place will become more important in the near future. Because of the high use of the internet in TheNetherlands, a rapid growth of online shopping is expected. According to CBL, internet sales of food andbeverages will increase to US$ 1.9 billion by 2010, which will be about 10 percent of total supermarket sales. Albert Heijn currently offers "AH’s Home Delivery," the largest service in the Dutch online food market. AH’sHome Delivery is available to about 35 percent of all Dutch households. It is expected that online food saleswill account for 5 percent of Albert Heijn’s total sales by 2010. Most Dutch supermarket chains still lag behindin online activities, compared to other European supermarket chains. On January 1st, 2002, the Dutch OnlineShopping Association (Nederlandse Thuiswinkel.org) will introduce an independent quality mark for onlineshopping internet sites.

GAIN Report #NL1081 Page 18 of 37
UNCLASSIFIED Foreign Agricultural Service/USDA
Private LabelsIn 2000, the market share for private label sales in the Netherlands decreased by 0.1 percent to 20.5 percent involume, but increased 0.2 percent in value to 18.6 percent. Private labels account for one in five products sold. While neighboring markets have experienced a dramatic expansion of private labels over the last few years,sales in the Netherlands have decreased for the third consecutive year.
According to Erasmus Food Management Institute (EFMI), the market share of private labels in TheNetherlands is higher than reported. EFMT notes that not all fresh products are included and that Dutchretailers have invested heavily in private labels for fresh food. EFMI gives three reasons why private labels infresh produce are increasingly popular with retailers:• Lower competition by premium name brands• High gross margins • More possibilities to establish the retailer’s “cachet” to attract consumers
Private Label Market Share by Country (%)Volume Value
1999 2000 Diff. 1999 2000 Diff.
United Kingdom 45.4 44.8 -0.6 43.5 43.1 -0.4
Belgium 34.7 35.9 1.2 26.0 26.6 0.6
Germany 33.2 29.0 -4.2 27.4 22.5 -4.9
France 22.1 23.6 1.5 19.1 20.1 1.0
The Netherlands 20.6 20.5 -0.1 18.4 18.6 0.2Source: PLMA, 2001
The Netherlands: Gainers in Private Label Market Share in 2000 (in %)
Volume Value
Product Share Product Share
Frozen Meat, Game, Poultry 5.2 Frozen Meat, Game, Poultry 3.9
Beer 4.9 Biscuits/pastry 3.3
Biscuits/pastry 3.3 Frozen Vegetables, Herbs 3.2
Frozen Vegetables, Herbs 2.9 Vinegar 3.2
Vinegar 2.5 Oils 2.8
Frozen Fish 2.2 Canned Fruit 2.2
Fresh Liver Sausages 1.5
Source: PMLA, 2001

GAIN Report #NL1081 Page 19 of 37
UNCLASSIFIED Foreign Agricultural Service/USDA
The private label market in The Netherlands is expected to grow, with consumers seeking a wider variety ofprivate label products, higher quality goods and more value for the money. At the moment, the fresh producedepartments lead private label performance in the Netherlands. In 2000, delicatessens had the highest valueshare with 27.7 percent, while dairy posted the greatest volume share with 31.5 percent. In general, privatelabels compete in particular with lower quality brands. Albert Heijn, with its "AH-Huismerk," label is theoverall market leader in private label sales in The Netherlands, with about 2,300 products.
OrganicsWorried by a series of food scares, Dutch consumers are increasingly turning to organic food. Sales of organicfoods are estimated to be US$ 293 million in 2001. The total turnover for organic food in natural food shops isestimated at US$ 147 million. At the moment, there are about 200 natural food stores in The Netherlands. Only25 stores are larger than 200m². In 2000, there was a big boost in the number of organic food stores, most ofthem under the name "Natuurwinkel," a franchising system for Dutch natural food shops. However,supermarkets already account for 45 percent of total organic food sales and their market share is still increasing. Like pastry and meat shops, natural food shops will increasingly be affected by the trend of one-stop shopping. However, apart from supermarket chains Albert Heijn, Konmar and Nieuwe Weme, most Dutch supermarketshave not changed their marketing and product mixes to feature more organics. Albert Heijn’s "AH Bio" privatelabel organic foods constitutes 78 percent of total retail organic food sales.
According to AC Nielsen, total supermarket sales of organic food products rose 40 percent in 2000. Organicpotatoes, vegetables, fruit, milk and buttermilk are the most popular products. Organic food products sell atabout a 25 percent premium than conventional products. The main consumers are higher income shoppers.According to Erik Hemmes, independent Dutch retail consultant, the total supermarket turnover in organic foodis expected to be US$ 132 million in 2001, which is about the same as total supermarket sales of magazines. By2010, organic foods are expected account for 2.4 percent of supermarket sales on average, up from 0.6 in 2001. Supermarkets which actively promote organic products could boost that share to 5 percent of total sales. Withinten years, organic food supermarkets with a floor space of 500-1000m² are predicted to appear in theNetherlands.
The Dutch Food Retail Organization (CBL) is encouraging organic agriculture, which means that organicproducts get priority in Dutch supermarkets. The Dutch Ministry of Agriculture, Nature Management andFisheries is also promoting organic agriculture. CBL participates in the Taskforce Organics initiated by theMinistry of Agriculture.
Company ProfilesIn 2000, total supermarket sales were US$ 19.9 billion. The Dutch food retail industry is dominated by theworld’s 4th largest food retail organization Ahold/Albert Heijn with a market share of 28 percent. Food retailerAhold/Albert Heijn purchases food for its own Albert Heijn supermarket chain. Because of the relatively smallmarket shares of some Dutch food retailers, many of them are members of large food buying groups to gainmass and synergies. In The Netherlands, food buying groups Laurus (26% market share), TSN (24%) andSuperunie (12%) sell to various supermarket chains directly, or through wholesalers. Albert Heijn, Laurus, TSNand Superunie control 90 percent of the Dutch food retail market.
It is expected that in 10 years the majority of Dutch food will be bought by centralized buying offices of large

GAIN Report #NL1081 Page 20 of 37
UNCLASSIFIED Foreign Agricultural Service/USDA
food retailers or by buying offices of cooperating smaller retailers throughout Europe, like the Swiss-basedAMS (Associated Marketing Services AG). This international buying alliance buys for different European foodretail organizations, like Ahold (holding company of Albert Heijn), in different countries. In 1996, AMSbought over US$ 96 billion of food products which were sold under the private label “Euroshopper.” Thestrategic alliance AMS is just one of the about a dozen European buying alliances for food retailers, although itis one of the largest. The Dutch food buying group, Superunie, is a member of the international buying alliance,Europartners. Ahold is combining its European buying expertise in Ahold European Sourcing (AES).
The Netherlands: Market Shares of the Top Four Supermarket Chains
1980 1999 2000
Albert HeijnC1000Super de BoerEdahAldi
13.25.25.06.2-
27.710.69.06.96.3
27.611.2
9.17.06.2
Total 29.6 60.5 61.1Source: AC Nielsen, 2001
The Netherlands: The Six Largest Buying Organizations (Food Retailers and Food Buying Groups) in 2001
Retailer/Wholesaler - type of outlet
Sales/Market share
Number ofOutlets
Purchasing
Albert Heijn, Food retail organization/food retailer, national multiple US$ 5.5 billion 27.6 percent
744nation wide
Direct, Imp./ wholesaler
Laurus Group, Food buying group for supermarket chains Super DeBoer, Edah, Konmar, Spar Convencience, Groenwoudt Supermarkten,Basismarkt and ZHM
US$ 5.2 billion26.0 percent
2,418 nation wide
Direct, Imp./ wholesaler
Trade Service Nederland (TSN), Food buying group for wholesalersSchuitema, A&P Holding and Codis
US$ 4.7 billion23.6 percent
871nation wide and regional
Direct, Imp./ wholesaler
Superunie, Food buying group for 18, usually family owned, regionalsupermarket chains
US$ 2.4 billion11.9 percent
1,948regional
Direct, Imp./wholesaler
Aldi, Food retail organization/food retailer, national multiple US$ 1.2 billion6.2 percent
370 nation wide
Direct, Imp./wholesaler
Koopconsult*, Food buying group for the regional wholesalerSamenwerkende Dirk van den Broek Bedrijven
US$ 0.7 billion3.7 percent
176 regional
Direct, Imp./wholesaler
IN TOTAL US$ 19.7 billion99.0 percent
7,200 Direct, Imp./wholesaler
Source: AC Nielsen, 2001and Information Resources, 2001 (*) Note: Supermarket chains could be divided by:national coverage: Albert Heijn and the members of the Laurus Group (like Edah and Super de Boer); regional coverage: members ofSuperunie; independent supermarkets: who buy through Trade Service Nederland (like C1000)Buying ProceduresUsually the purchasing department of a Dutch food retail organization or food buying group is divided into
GAIN Report #NL1081 Page 21 of 37
UNCLASSIFIED Foreign Agricultural Service/USDA
several units headed by a Unit Manager. Each unit has several Category- or Product Managers who have fullprofit responsibility. Consequently, managers are careful to purchase products which are profitable. Thepurchasing departments of the main food buying organizations in the Netherlands are organized as follows:
• Albert Heijn’s buying department consists of seven separate units, headed by a Unit manager whosupervises various Category managers (± 40 in total). Category managers are responsible for one ormore products and they handle buying, sales, logistics and all merchandising activities. Categorymanagers have profit-responsibility for their own products.
• Laurus buys for member retailers, Super De Boer, Edah, Konmar and the Basismarkt all having nationwide representation. The Central Buying Department of Laurus negotiates and receives offers from foodsellers. The Laurus buyers, about 25 in total, present the offers to the buyers of the various memberchains.
• Superunie has about 25 buyers who buy on behalf of its 18 members. These are mostly family owned,regional supermarket chains. After the central buying department of Superunie accepts the offer of thesupplier, the product is offered to all members of Superunie during regularly held buying meetings.
• Trade Service Nederland (TSN) buys among others for the wholesale organizations Schuitema andSperwer. TSN is a fully owned subsidiary of Schuitema. Ahold (holding company of Albert Heijn)owns 73 percent of Schuitema shares. TSN has about 30 Assortment managers/buyers, each responsiblefor their own products and profits.
Dutch food retailers (like Albert Heijn, Aldi, Lidl) and food buying groups (like Laurus, TSN, Superunie)almost never import directly, because of the lower volume of most foreign products. They often refer U.S.exporters to Dutch specialty food importers. These importers already are well-equipped to introduce U.S.products.
Contact a Dutch specialty food importer or Category- or Product Manager by writing him a short personal letter,and follow up by a telephone call to make an appointment. Before visiting the specialty food importer orCategory- or Product Manager, make sure you are informed about the company. In case of a food retailer, likeAlbert Heijn, visit a few of their stores in advance.
Evaluating ImportersFor a U.S. exporter it is important to select a Dutch specialty food importer who has an excellent network ofcontacts within the Dutch retail industry. In addition, an importer with nationwide distribution gives a U.S.exporter access to many Dutch supermarket outlets along with valuable expertise. In return, a Dutch specialtyfood importer expects loyalty and promotional support from the U.S. exporter, as well as an exclusive contractfor the Netherlands. As a rule of thumb, the specialty food importer expects a margin of 23 to 24 percent of theCIF price, including costs. The supermarkets’s margin is generally a minimum of 30 percent. These marginsare representative of the specialty foods typically imported from the United States.
For a partial listing of Dutch Specialty food Importers/Wholesalers see Annex: 3.

GAIN Report #NL1081 Page 22 of 37
UNCLASSIFIED Foreign Agricultural Service/USDA
General profile of the Dutch Businessman/woman
These are some generalities often heard about Dutch businessmen or women:• Practically all speak English. • They usually have no time for business lunches or dinners.• After brief introductions, they expect you to come straight to the point. They give you their frank
opinion and let you know if you offer them something they don’t want.• Dutch food buyers, the category managers and/or product managers, are fully responsible for the buying
process and profits the product will bring. They are only interested to speak to decision makers.• The Dutch businessman is looking for a relationship, almost a partnership. Once you start doing
business with him, he expects continued support from you. • The Dutch usually know their business and know what your competition is doing. The Dutch
businessman understands that you need to make a profit. He is a tough but fair negotiator.
Section III. CompetitionThe EU produces a large variety of foods at competitive prices. This is partly due to the fact that almost allEuropean firms pay with the euro currency instead of US dollars. Therefore, they do not suffer from the highUS dollar rate. At January 1, 2002, the Dutch guilder will be, like the other currencies of EU-member states,replaced by the euro. In addition, EU food producers and exporters have the advantage of relative lowtransportation cost and fast delivery times. Their product is not charged with import duties nor do they facemajor ingredient or labeling requirements.

GAIN Report #NL1081 Page 23 of 37
UNCLASSIFIED Foreign Agricultural Service/USDA
Section IV. Best Products Prospects
The Netherlands: SWOT - Analysis of Product Groups, 2000
Food category Strong Weak Opportunities Threats Change 1999/00
(%)
Sales mln US$
Groceries n.a. n.a.
- Cereals- Prepacked Bread- Bread Replacers- Baking Products- Sandwich Filling- Snacks- Preserves- Rice- Pasta’s
noyesyesyesnoyesnoyesno
yesnononoyesnoyesnoyes
Crunchy Muesli, Variation VariationRoasted Bread, Crackers, Waffles Piquant MixesVariationCup-a-soup, Noodles, Wrappers, ToastsCanned Tuna in Water, Vegetables(Int.) Rice Dishes (Paella)Special Dough, Organic
saturation
saturation
saturationhealth trendsaturation
Greek andSpanishdishes, rice,wrappers,saturation
1.59.0
+11.2
2.87.7
+5.63.4
65.3407.1
86.032.8
203.233.5n.a.
55.660.8
Fresh n.a. n.a.
- Vegetables and Fruit- Seafood- Meat- Dairy- Bread- Eggs
noyesnonoyesyes
yesnoyesyesnono
Small Sized Packages, OrganicFish Filets, Quality, ExoticPoultry, Meat Replacers, OrganicInt. Cheeses, Herbs ButterSandwiches, Variation, Bake offOrganic
grazingtrendbad catchhealth trendsaturationsaturation
2.010.0
3.30.1
+20.2
1,589.7161.1
1,482.31,336.7
308.8119.2
Chilled n.a. n.a.
- Ready-to-eat Meals- Prepared Vegetables- Pizza’s- Sauces- Juices- Rice and Pasta’s- Potato Products- Fish Products- Pancakes- Snacks- Soups
yesyesnonoyesyesyesyesyesyesno
nonoyesyesnonononononoyes
Cook & Steam, Day FreshSalad & Dressing, Components American Style, Wood OvenBrandsMixed Fruit, Breakfast JuicesComponents, QualityPotato Pieces & Herbs, Variation MusselsVariationSandwiches, BreadQuality
frozendried
bad cropbad catchfrozenhealth trendcanned
15.114.0-3.0
+14.023.0 6.2
11.8 23.0
+-
104.6230.0
n.a.9.6
71.13.9
56.881.014.219.2
2.5
Frozen 4.0 669.5
- Ready-to-eat Meals- Pizza’s- Potato Products- Vegetables- Fish - Frozen Pastry- Ice Creams- Meat- Snacks
noyesnoyesyesnonoyesyes
yesnoyesnonoyesyesnono
Components, Quality, MicrowaveAmerican Style, Wood OvenPotato Dishes, Variation(Int.) Stir-fry Mixes, QualityFish DishesQuality, VariationMulti Packs, American StylePoultry Products, QualitySoft Bread, Pistolets, Wrappers, ChickenSnacks, Fish Snacks, Microwave
chilled
saturationsaturationbad catchfreshbad summer
health trend
-23.0-4.07.66.9
-0.9-4.2
+7.4
15.579.588.453.861.438.2
141.517.6
149.0

GAIN Report #NL1081 Page 24 of 37
UNCLASSIFIED Foreign Agricultural Service/USDA
Snacks & Confectionery 4.7 n.a.
- Biscuits, Cakes, Pastry - Chocolate- Candies- Salted Snacks
yesyesyesyes
nononono
Children Cakes, Fruit & GrainsBite Sizes, Dragees, FilledFresh Breath, Dental Care Chewing GumPopcorn, Corn Chips, Light Chips, MultiPacks, Specialty Nuts, Quality
saturationsaturation
saturation,health trend
4.64.36.0
+
508.9284.1318.0502.1
Meal Decorators 4.0 512.1
- Taste Makers - Oils, Vinegar and Acids- Sauces and Mixes
yesyesyes
nonono
Italian (Pesto), Eastern, Mexican Olive Oil, Vegetables in AcidBarbecue, Gourmet, Fondue, SaladDressings, Pinch Bottle with Gravy orBouillon, (Int.) Ready-to-prepare HerbsMixes, Quality
"back tobasics" trendsaturation,bad summer,ready-to-preparemeals
++
9.0
83.783.7
340.2
Beverages n.a. n.a.
- Coffee- Tea- Chocolate Drinks- Premixes- Beer- Wine- Soft Drinks- Lemon Cordial- Water- Juices
noyesnoyesnoyesyesnonoyes
yesnoyesnoyesnonoyesyesno
Instant Coffee, Coffee Pads, VariationGreen Tea, Mate, Variation
VariationFresh & Fruity Tastes (Lemon)New World Wines, QualityIce Tea, Sport Drinks, Light DrinksReady-to-drink PackagingLess Sparkling, Plain WaterChilled Juices, Breakfast Drinks, MixedFruit, Sparkling Juices, Quality
teasaturation
saturation
premixes premixesbad summer
4.47.5
-0.492.9-1.44.43.30.4
-3.36.1
448.589.651.414.2
594.6409.7716.0
81.8n.a.
285.9
Tobacco n.a. n.a.
- Cigarettes- Cigars- Roll-your-own
yesyesno
nonoyes Good Re-closing Packaging cigarettes
5.011.4
2.0
617.412.2
332.7
Petfood no yes saturation 1.0 203.5
Food Supplements yes no Vitamins and Minerals Together governmentregulations
11.5 101.7
Source: Elsevier Food Business Information (Category Food Magazine and Distrifood ) and AC Nielsen, 2001Note: This table should be seen as indicative, since the figures are calculated by different methods by different organizations and,therefor, are not really comparable. The figures deal mainly with supermarkets, which account for about 65 percent of the total Dutchfood market.

GAIN Report #NL1081 Page 25 of 37
UNCLASSIFIED Foreign Agricultural Service/USDA
The Netherlands: Top Food Product Groups, 2000Product groups 2000 Sales
(in million US$)Growth 2000/99(in million US$)
Growth 2000/99(in %)
Share in TotalFood Sales
Total Food Sales 19070.6 701.6 3.8 100
1. Potatoes, vegetables and fruit2. Fresh meat3. Soft drinks (incl. sport drinks)4. Thick liquid milk products5. Cigarettes6. Dutch cheese7. Beer8. Biscuits and cakes9. Milk and buttermilk10. Coffee11. Plain wines12. Prepacked bread13. Roll-your-own tobacco 14. Meal decorators15. Dry snacks16. Yellow fat17. Fruit juices, dinks and dairy18. Chocolate products19. Ready-to-eat meals20. Confectionary21. Soups22. Pet food23. Groceries sandwich filling24. Foreign cheese25. Salads26. Frozen snacks27. Peanuts and tree nuts
1,589.71,482.3
716.0617.6617.4599.0594.6508.9449.6448.5409.7407.1332.7328.2318.4316.2285.9284.1234.5230.0207.8203.5203.2159.4156.4149.0145.7
31.947.223.032.529.214.1-1.422.3-9.318.918.433.5
6.614.818.214.116.411.730.810.4
7.82.05.46.39.5
10.37.0
2.03.33.35.65.02.4
-0.24.6
-2.04.44.79.02.04.76.14.76.14.3
15.14.73.91.02.84.16.47.45.1
8.37.83.83.23.23.13.12.72.42.42.12.11.71.71.71.71.51.51.21.21.11.11.10.80.80.80.8
Source: AC Nielsen, 2001Note: AC Nielsen’s figure of total sales in 2000 (US$ 19.1 billion) differs considerably from CBL’s figure of total sales in 2001 (US$19.9 billion). This difference is probably due to the use of different measurement methods.

GAIN Report #NL1081 Page 26 of 37
UNCLASSIFIED Foreign Agricultural Service/USDA
The Netherlands: Strongest Growing Food Product Groups (%), 2000
Product groups 2000 Sales(in mln US$)
Growth 2000/99(in mln US$)
Growth 2000/99(in %)
Share in TotalFood Sales
Total Food Sales 19,071 702 4.0 100
1. Premixes2. Frozen meat, game and poultry3. Eggs4. Ready-to-eat meals5. Chilled fish products6. Cigars7. Baking products8. Oils9. Prepacked bread10. Packed smoked sausage11. Chewing gum12. Snack bases (toasts)13. Frozen vegetables and herbs14. Tea15. Frozen snacks16. Packed dry sausage
14.217.7
119.2234.5
81.012.232.841.2
407.152.659.433.553.889.6
149.045.8
6.85.4
20.030.8
8.51.33.33.4
33.54.14.52.43.86.2
10.33.1
92.944.120.215.111.811.411.2
9.09.08.68.27.77.67.57.47.2
0.10.10.61.20.40.10.20.22.10.30.30.20.30.50.80.2
Source: AC Nielsen, 2001Note: AC Nielsen’s figure of total sales in 2000 (US$ 19.1 billion) differs considerably from CBL’s figure of total sales in 2001 (US$19.9 billion). This difference is probably due to the use of different measurement methods.

GAIN Report #NL1081 Page 27 of 37
UNCLASSIFIED Foreign Agricultural Service/USDA
The Netherlands: Strongest Declining Food Product Groups (%), 2000
Product groups 2000 Sales(in million
US$)
Growth2000/99
(in million US$)
Growth2000/99(in %)
Share in TotalFood Sales
Total Food Sales 19070.6 701.6 3.8 100
1. Frozen ice creams2. Frozen potato products3. Sherry4. Sugar products5. Milk and buttermilk6. Vermouth7. Sour milk products8. Frozen cakes9. Apple sauce10. Chocolate drinks11. Beer12. Lemon cordial13. Petfood14. Table acids15. Cereals16. Cakes17. Preserved meat18. Roll-your-own tobacco19. Potatoes, vegetables and fruit20. Dutch cheese21. Packed liver sausage and paste22. Preserved fish
141.588.466.277.3
449.616.3
122.338.237.651.4
594.681.8
203.532.265.352.573.0
332.71,589.7
599.040.537.0
-6.3-3.7-2.3-1.9-9.3-0.3-1.6-0.4-0.2-0.2-1.40.32.00.31.00.91.26.6
31.914.1
1.01.0
-4.2-4.0-3.4-2.4-2.0-2.0-1.3-0.9-0.4-0.4-0.20.41.01.01.51.71.72.02.02.42.62.6
0.70.50.30.42.40.10.60.20.20.33.10.41.10.20.30.30.41.78.33.10.20.2
Source: AC Nielsen, 2001Note: AC Nielsen’s figure of total sales in 2000 (US$ 19.1 billion) differs considerably from CBL’s figure of total sales in 2001 (US$19.9 billion). This difference is probably due to the use of different measurement methods.
A. Popular U.S. Food Products in the Dutch Market • Texmex foods• Snack foods• Fruit and vegetables juices• Processed fruit and vegetables• Fresh fruit (grapefruit)• Nuts• Wine• Pet food• Canned salmon

GAIN Report #NL1081 Page 28 of 37
UNCLASSIFIED Foreign Agricultural Service/USDA
B. U.S. Food Products not present in significant quantities, but which have good sales potential,include:
• A variety of grocery items, from peanut butter to Pringle chips, from sport drinks to cheese balls, etc.• Red apples• Fresh fruit juices• American cheeses• Organic foods, like organic apples and pears• Halal foods• Kosher foods• Functional foods• Etnic foods• Natural food supplements
C. U.S. Food Products not present because they face significant barriers• Canned fruits (high tariffs)• Frozen whole turkeys and parts (high tariffs)• Fresh pork (high tariffs)• Poultry meat (phytosanitary)• Fresh beef (phytosanitary)
Section V. Post Contact and Further Information
Post Contact:Office of Agricultural Affairs (O.A.A.) American EmbassyPostal Address: U.S. Embassy-AGR, Unit 6707, Box 038, APO AE 09715Visitor Address: Lange Voorhout 102, 2514 EJ The Hague, the NetherlandsPhone: 31-70-3109299, Fax: 31-70-3657681, E-mail: [email protected], Internet: Http://www.usemb.nl
Further Information:In general, The Netherlands follows EU policies in regard to labeling and ingredient requirements. The DutchCommodities Act (Warenwet) supplies general guidelines and requirements for foods. The basic objectives ofthis law are health protection, product safety and labeling. A detailed report which specifically addresseslabeling and ingredient requirements in the Dutch market entitled, The Netherlands: Food and AgriculturalImport Regulations & Standards (FAIRS) Report can be obtained from the FAS homepage:http://www.fas.usda.gov

GAIN Report #NL1081 Page 29 of 37
UNCLASSIFIED Foreign Agricultural Service/USDA
Annex 1.
U.S. Exports of Consumer-Oriented Products to the Netherlands (US$ 1,000)
1996 1997 1998 1999 2000
Consumer-Oriented Products TOTAL 346,881 351,907 404,676 466,897 461,570
Snack Foods (ex nuts) 6,924 6,068 7,595 8,374 6,908
Breakfast Cereal & Pancake mix 572 547 375 220 689
Red Meats, Fresh/Chilled/Frozen 14,581 15,492 16,284 12,031 6,890
Red Meats, Prepared/Preserved 717 926 1,775 818 568
Poultry Meat 17,542 9,039 1,616 3,869 2,905
Dairy Products 9,941 8,083 11,821 5,938 9,577
Eggs & Products 8,902 5,857 5,318 1,442 2,961
Fresh Fruit 31,429 26,681 24,649 23,684 20,012
Fresh Vegetables 1,843 3,867 2,999 2,681 2,164
Processed Fruit & Vegetables 43,170 40,823 59,314 60,522 46,145
Fruit & Vegetables Juices 32,267 50,816 47,451 58,718 84,815
Tree nuts 96,495 77,111 80,990 67,340 62,476
Wine & Beer 10,598 17,097 47,712 78,905 77,527
Nursery Products & Cut Flowers 37,951 42,851 42,574 42,574 38,963
Pet Food (dog & cat) 13,156 17,610 12,397 16,546 25,005
Other Consumer-Oriented Products 21,115 28,956 42,305 83,234 73,964
Source: BICO

GAIN Report #NL1081 Page 30 of 37
UNCLASSIFIED Foreign Agricultural Service/USDA
Annex 2.
Food Shows Frequently Visited by Dutch Food Buyers
Show When Show Organizers
HORECAVA, Amsterdam, the Netherlands (Hotel, Restaurant Show)
January 07 - 10, 2002 tel: + (31) 20 575 30 32fax: + (31) 20 575 30 93http://www.horecava.nl
ROKA, Utrecht, the Netherlands March 10 - 13, 2002 tel: + (31) 30 295 59 11fax: + (31) 30 294 03 79http://www.rokafoodfair.nl
FMI, Chicago, United States< Participation in U.S. Food Export Showcase tel: + (1) 202 296 9680 fax: + (1) 202 296 9686
May 05 - 07, 2002 tel: + (1) 202 452 8444fax + (1) 202 429 4559http://www.fmi.org
World of Private Label (PLMA),Amsterdam, the Netherlands< U.S. Participation USDA/FAS, Washington Trade Show Office tel: + (1)202 720 3623 fax + (1)202 690 4374
May 28 - 29, 2002 tel: + (31) 20 575 30 32fax: + (31) 20 575 30 93http://www.plmainternational.com
SIAL, Paris, France < U.S. Participation: USDA/FAS, Paris, France tel: + (33) 1 431 222 77 fax + (33) 1 431 226 62
October 20 - 24 2002
Bi-Annual Show
tel: + (33) 149 68 54 99 fax: + (33) 147 31 37 75http://www.sial.fr
ANUGA, Cologne, Germany< U.S. Participation: USDA/FAS/ATO Hamburg, Germany tel: + (49) 40 414 6070 fax: + (49) 40 414 60720
October 11 - 15, 2003 tel: + (49) 221 82 10fax: + (49) 821 34 10http://www.koelmesse.de/anuga/english/index.html
Or contact the International Marketing Section of your State Department of Agriculture.

GAIN Report #NL1081 Page 31 of 37
UNCLASSIFIED Foreign Agricultural Service/USDA
Annex 3.Partial Listing of Dutch Specialty Food Importers/Wholesalers
American Food ServiceGageldijk 13602 AG Maarssen
Ph. 030-2613604fax. 030-2613624
Contact: Mr. G. Chin A. Kwie
BOAS b.v.Stephensonstraat 402723 RN Zoetermeer
Ph. 079-3442600fax. 079-3421722
Contact: Mr. Th. van Ham
Bruce Foods Europe b.v.Klarenanstelerweg 256468 EP Kerkrade
Ph. 045-546 5700fax. 045-546 5777
Contact: Mr. Henk Pelzer
GranFood b.v.Saturnusstraat 432516 AE Den Haag
Ph. 070-3815007fax. 070-3815013
Contact: Mr. Onno Brokke
International Food & Gourmet Products b.v.IFGPDe Lasso Zuid 172371 EV Roelofarendsveen
Ph: 071-331 6450fax: 071-331 6440
Contact: Mr. W. de Wit
De KwekerCentrale Groothandelsmarkt S11051 KL Amsterdam
Ph. 020-6828866fax. 020-6827366
Contact: Mr. P.F. Poelstra
Lusto b.v.Vareseweg 1153047 AT Rotterdam
Ph. 010-4621233fax. 010-4621270
Contact: Mr. W. Storm Mr. F.M.J.W. Luijk
Pietercil Barends b.v.Bleiswijkseweg 512712 PB Zoetermeer
Ph. 079-3441100fax. 079-3420831
Contact: Mr. J. Hoop Mrs.. R. Andreoli
Sligro b.v.Corridor 115466 RB Veghel
Ph. 0413-343500fax 0413-341520
Contact: Mr. G. van de Ven
Suncomex b.v.Vanadiumweg 153812 PX Amersfoort
Ph. 033-4659075fax 033-4651449
Contact: Mr. B.E. Boerema

GAIN Report #NL1081 Page 32 of 37
UNCLASSIFIED Foreign Agricultural Service/USDA
Annex 4.
The Netherlands : Buying Association / Supermarket
Organization Chain/Supermarket No. ofOutlets
Retailsurface in
sq. m.*
Location
Albert Heijn
Albert Heijn B.V.HQ : ZaandamTel: 31-75-659 9111Fax: 31-75-631 3030Internet: www.ah.nl HQ: ZaandamMother Co.Koninlijke Ahold N.V.
Albert Heijnfranchise
506200
1,127874
Nation Wide
PrimaktHQ:BredaTel:31-76-579 8888Fax::31-76-571 6167
Primakt
Liquor Stores
24
13
1,350
60
South-Holland,North-Brabant &
Limburg
Den ToomHQ:RotterdamTel:31-10-433 1777Fax::31-10-413 5646
Den Toom (incl Liquor Stores)
1 2,300 Rotterdam
Laurus N.V.Tel: 31-73-622 3622Fax: 31-73-622 3636
Internet: www.laurus.nlHQ: ‘s-Hertogenbosch
BasismarktHQ: ZaltbommelTel: 31-418-574 444Fax: 31-418-514 580
Basismarkt 183 450 Nation Wide
EdahHQ: HelmondTel: 31-492-571 911Fax: 31-492-571 388Internet: www.edah.nl
Edah 229 900
Nation Widefranchise 84

GAIN Report #NL1081 Page 33 of 37
UNCLASSIFIED Foreign Agricultural Service/USDA
Groenwoudt GroepHQ : RenswoudeTel: 31-318-579 911Fax: 31-318-579 242Internet: www.groenwoudt.nl www.lekkerenlaag.nl
Groenwoudt Supermarkets 62 1,050 Overijssel, Gelderland,Flevoland, Utrecht,North Brabant, &
South-Holland
Nieuwe Weme Supermarket 36 1,105 m2 Groningen, FrieslandDrenthe, Overijssel &
Flevoland
Lekker & Laag 3 1,700 Tilburg & Boxtel
KonmarHQ: The HagueTel: 31-70-321 5121Fax: 31-70-329 1174Internet: www.konmar.nl
Konmar 29 3,500 Nation Wide
Spar ConvenienceHQ: ZevenbergenTel: 31-168-357 900Fax: 31-168-357 999
Spar 275 <500 Nation Wide
Independent Supermarkets 200 <150 Nation Wide
Mobile Shops 400 <150 Nation Wide
Super de BoerHQ: AmersfoortTel: 31-33-454 7777Fax: 31-33-454 7454
Super de Boer(Incl 260 franchise)
410 825 Nation Wide
ZHMZuivel Handels-Maatschappij HQ : OosterwoldeTel: 31-516-568 600Fax: 31-516-520 691
Mobile shops of The Netherlands 227 25 Nation Wide
Springer & Partners 91 25 Nation Wide
Melk & Meer 30 10 Nation Wide
PRO Markt 39 150 Nation Wide
Others 79
SuperunieHQ Beesd.
Tel : 31-345-686 666Fax : 31-345-686 600
Internet: www.superuni.nl
Boni-MarktenHQ: NijkerkTel: 31-33-247 3131Fax:: 31-33-247 3141
Boni-Markten 32 750 Overijssel, Gelderland,Utrecht, ‘t Gooi,
Drenthe & Friesland
Boon SliedrechtHQ : SliedrechtTel: 31-184-418 500Fax: 31-184-412 159Mother Co.Boon Beheer b.v.
M.C.D. 29 500-1,200
Utrecht, South-HollandNorth Brabant &
GelderlandOwn Brand & Formula Shops 18 2500
Wine & Liquor Store 5

GAIN Report #NL1081 Page 34 of 37
UNCLASSIFIED Foreign Agricultural Service/USDA
Coop NederlandHQ : ArnhemTel: 31-26-384 3900Fax: 31-26-384 3999
Coop(Including 3 franchises)
55 665 Gelderland, Overijssel,Utrecht & Zaanstreek
Deen Supermarket B.V.HQ : HoornTel: 31-299-252 100Fax: 31-299-252 102Internet: www.deen.nl
Deen 26 829
North Holland
Dekamarkt B.V.HQ : Velsen Noord/BeverwijkTel: 31-251-276 666Fax: 31-251-276 600
Dekamarkt 62 850-875
North & South Hollandand
Flevoland
Wine & Liquor Store 28 83
Drug Store Bubbles 4 200
Dekamarkt Gas Station 1 60
GekomaHQ : ApeldoornTel: 31-55-599 8499Fax: 31-55-599 8490Email: [email protected]: www.komart.com
Komart Wine & Liquor Store
166
85065
Apeldoorn andsurrounding area
Van Eerd Food Groep B.V.HQ :VeghelTel: 31-413-380 200Fax: 31-413-343 634Email: [email protected]
Jumbo (incl. franchisers)
52 780 North-Brabant,Limburg, Gelderland
& Zeeland
Pryma(franchise)
17 280 South-Holland, North-Brabant, Zeeland &
Limburg
Others 20
EM-TÉ SupermarketsHQ :KaatsheuvelTel: 31-416-542 500Fax: 31-416-542 519Internet: www.em-te.nl
EM-TELiquor Stores
1111
1,01570
North Brabant
Hoogvliet B.V.HQ : Alphen a/d RijnTel: 31-172-418 218Fax: 31-172-421 074
HoogvlietLiquor Stores
3118
1,00035 Utrecht, South-Holland
& Gelderland
Jan LindersHQ : Nieuw Bergen (L)Tel: 31-485-349 911Fax: 31-485-342 284Email: [email protected] Internet: www.janlinders.nl
Jan Linders 43 690 South East-Gelderland,East Brabant &
Limburg
Kluft DistrifoodHQ : BeverwijkTel: 31-251-275 700Fax: 31-251-226 969
Komart Wine & Liquor Store
2515
78071
Utrecht & NorthHolland

GAIN Report #NL1081 Page 35 of 37
UNCLASSIFIED Foreign Agricultural Service/USDA
Nettorama Distributie B.V.HQ : OosterhoutTel: 31-162-455 950Fax: 31-162-456 520
Nettorama Verbruikersmarkten 20 1,125 Overijssel, Utrecht,South-Holland, North-
Brabant Drenthe &Limburg
Poiesz Supermarkten B.V.HQ : SneekTel: 31-515-428 800Fax: 31-515-428 801
Poiesz SupermarktWine & Liquor Store
3330
67530
Friesland, Groningen,Flevoland &
Drenthe
Sanders Supermarkt B.V.HQ : EnschedeTel: 31-53-484 8500Fax: 31-53-484 8501
Sanders 18 610 Enschede andsurrounding area
SligroHQ :VeghelTel: 31-413-343 500Fax: 31-413-341 520
Thuismarkt 115 100-350
Nation Wide
SRV (incl. Springer & Partner/Milk etc.) 150
Eigen Formule/Eigen naam 250 100-350
Milo 71
Drop Inn 40 20-50
Snoep Express (candy) 15 100-150
Prisma Food RetailHQ : NijkerkTel: 31-33-245 5455Fax: 31-33-245 5401Email: [email protected] Internet: www.primsafood.nl
Attent 57 203
Nation Wide
Golff 61 733
Meermarkt 82 360
Zomermarkt/Rekra 73 231/373
Others 39
Sperwer HoldingsHQ : De BiltTel: 31-30-221 9211Fax: 31-30-220 2074Email: [email protected]: www.plusmarkt.nl www.gastrovino.nl
Plusmarkt 128 753
Nation Wide
Garantmarkt 89 303
4=6 Service 12 85
Gastrovino (Delicatessen) 43 106
Holiday Resorts Shops 14 180
Others 20 148
Vomar VoordeelmarktHQ : IJmuidenTel: 31-255-563 700Fax: 31-255-521 649Email: [email protected] Internet: www.vomar.nl
Vomar VoordeelmarktLiquor Store
3430
1,160 North Holland
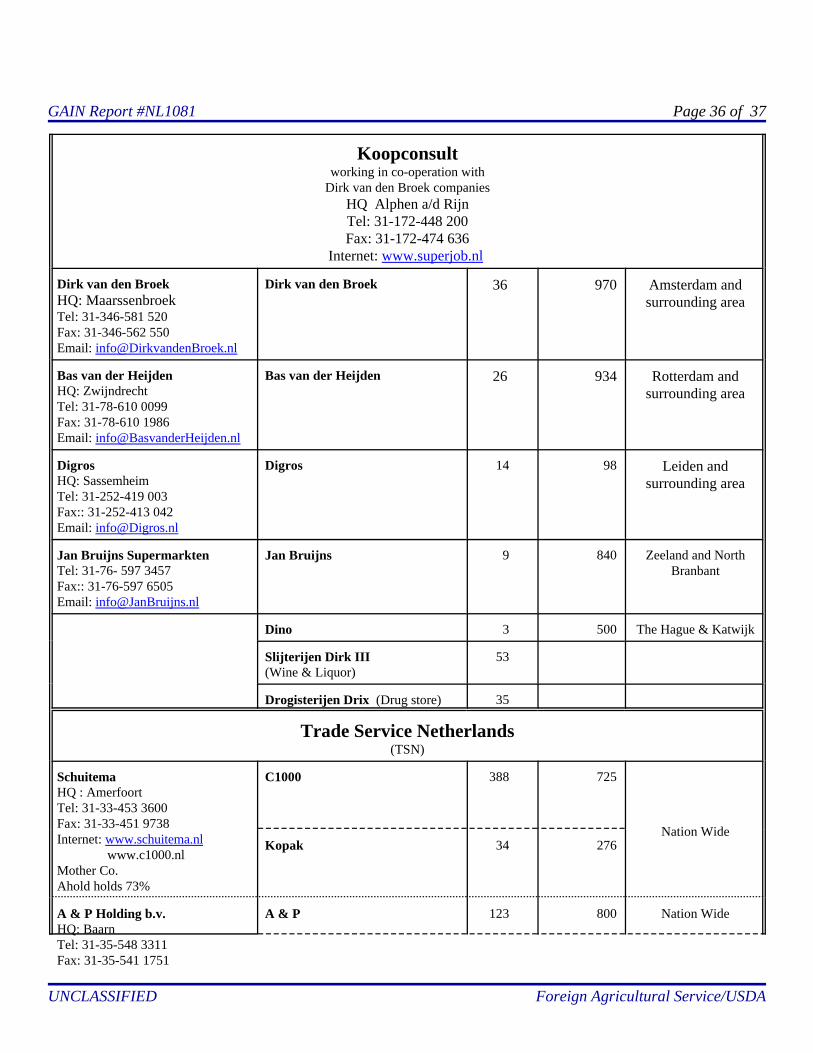
GAIN Report #NL1081 Page 36 of 37
UNCLASSIFIED Foreign Agricultural Service/USDA
Koopconsultworking in co-operation with
Dirk van den Broek companiesHQ Alphen a/d RijnTel: 31-172-448 200Fax: 31-172-474 636
Internet: www.superjob.nl
Dirk van den BroekHQ: MaarssenbroekTel: 31-346-581 520Fax: 31-346-562 550Email: [email protected]
Dirk van den Broek 36 970 Amsterdam andsurrounding area
Bas van der HeijdenHQ: ZwijndrechtTel: 31-78-610 0099Fax: 31-78-610 1986Email: [email protected]
Bas van der Heijden 26 934 Rotterdam andsurrounding area
DigrosHQ: SassemheimTel: 31-252-419 003Fax:: 31-252-413 042Email: [email protected]
Digros 14 98 Leiden andsurrounding area
Jan Bruijns SupermarktenTel: 31-76- 597 3457Fax:: 31-76-597 6505Email: [email protected]
Jan Bruijns 9 840 Zeeland and NorthBranbant
Dino 3 500 The Hague & Katwijk
Slijterijen Dirk III(Wine & Liquor)
53
Drogisterijen Drix (Drug store) 35
Trade Service Netherlands(TSN)
SchuitemaHQ : AmerfoortTel: 31-33-453 3600Fax: 31-33-451 9738Internet: www.schuitema.nl www.c1000.nl Mother Co.Ahold holds 73%
C1000 388 725
Nation WideKopak 34 276
A & P Holding b.v.HQ: BaarnTel: 31-35-548 3311Fax: 31-35-541 1751
A & P 123 800 Nation Wide

GAIN Report #NL1081 Page 37 of 37
UNCLASSIFIED Foreign Agricultural Service/USDA
A & P Hypermarkets 6 7,600 Arnhem, Ede, Muiden,Venlo, Leeuwarden &
Alkmaar
CodisHQ : The HagueTel: 31-70-359 0390Fax: 31-70-366 9098Internet: www.codis.nl
E-markt 84 297
Nation Wide
Stipt 25 105
Thuiswinkel (Mobile Shop) 7 20
Volumemarkt 44 540
Others 160
Aldi
Aldi HoldingHQ : CulemborgTel: 31-345-472 911Fax: 31-345-419 383Internet: www.aldi.nl
Mother Co.Aldi-Gruppe
Aldi 370 450 Nation Wide
Per Districts
Best 85
Culemborg 53
Drachten 52
Ommen 72
Roosendaal 51
Zaandam 57
Lidl
Lidl NetherlandsHQ : HuizenTel: 31-35-524 2411Fax: 31-35-526 4139Mother Co.Lidl Stiftung & Co.KG
Lidl 83 700
Van Tol
Levensmiddelen GroothandlenVan Tol B.V.HQ : BodegravenTel: 31-172-619 311Fax: 31-172-613 796Email: [email protected]: www.tolfood.com
Troefmarkt 86 140
Nation Wide
Emhamobile shopsneighbourhood shopsrecreational shops
2358948
<100
Vers Garant 5 80
Versunie 1,011 < 400
Export 97