Embed Size (px)
Citation preview
J. Exp. Biol. (i973). 58, 225-337 225
With 2 plates and 4 text-figures
Printed in Great Britain
GLIDING FLIGHT OF THE ANDEAN CONDOR IN NATURE
BY JERRY M C G A H A N
Department of Zoology, University of Wisconsin
(Received 25 April 1972)
INTRODUCTION
The Andean condor (Vultur gryphus) is an excellent subject for an analysis offlight. To fly, these big vultures depend on updraughts which in many areas arestrongest near cliff faces and canyon walls. From cliffside observation points qualita-tive aspects of flight by this large bird can be studied in detail at close range whilequantitative treatments of flight performance are possible at sites along foragingroutes where air movement is steady and easily monitored. This paper presentsa quantitative description of the condor's gliding flight as recorded at one of thesesites.
METHOD
Study area
All data describing the aerodynamics of gliding flight were recorded at a Peruvianbeach, Playa Chucho. This level south-facing beach is located about 30 km south ofPisco and 1 km east of the village Laguna Grande. The beach extends 620 m east-west, separating a series of sandstone cliffs that ascend abruptly to 150 m on the westand slope gradually to a 70 m elevation on the east. Before rising in a series of smallhills, 5-15 m high, the beach stretches south into the desert as a flat for 300 m on thewest end and 120 m on the east. Condors flying along the coastline crossed the beachin straight smooth flight. At one end of the beach they left declivity currents producedby the cliff-deflected south wind to encounter them again at the other end. This pre-dictable flight path in conjunction with the steady wind characteristic of the Peruviancoast provided an opportunity to measure parameters of their flight.
Procedure
The observation segment of the beach was marked by two rock piles 60 cm inheight and 250 m apart (Text-fig. 1). I stood midway between them and when acondor passed over each marker I recorded the lateral distance to the nearest metreseparating the flight path projected on to the beach from the marker. My wife, posted145 m north of and in line with the tower, recorded the angle of the bird's positionabove each marker using a sextant mounted on a swivel-head tripod. The sextant,a vertical scale with 80 2-5 mm divisions mounted on a horizontal base 58-5 cm inlength, permitted angular measurements used to compute values for altitude to thenearest metre. The tripod and sextant were adjusted so that for each sighting the baseof the vertical scale was in line with the top of the marker. For each sighting I used thetangent of the angle recorded with the sextant and the distance measured from thesextant to the flight path projected on to the beach to calculate the altitude of the bird.
15 EXB 58

226 J. MCGAHAN
Pacific Ocean
\*— 250m-»i
\1
El Front6n
Flight path of condorMarker' / , '
y 145 mAnemometer tower # {
\Inland observation point
Playa Chucho
N
Text-fig, i. The Peruvian observation beach, Playa Chucho.
Considering possible errors in measurement of both angle and distance I estimateeach altitude value to be accurate within 3 %.
The duration of the flight interval from one marker to the next was measured tothe nearest o-1 sec with a stopwatch at the inland observation point. Simultaneously,changes in wind conditions were recorded on series of gauges cabled from a s m towerstanding near the centre of the beach below the flight path. The tower supporteda wind vane, a cup anemometer sensitive to horizontal currents and a propelleranemometer sensitive to vertical currents. With data on the velocity of air and birdrelative to the ground, I used the law of cosines in a vector analysis to compute valuesfor air speed of the bird. Measured values for the ground distance and time travelledare believed accurate within 2%, values for wind speed within 20%, and computedvalues for air speed of the condor within 4%.
RESULTS
For observations on 15 condors (11 males, 4 females) that crossed the beachwithout flapping during a 13-day period, the mean air speed and computed standarderror were 15 ±0-5 m/sec (Table 1). For 42 condors (23 males and 19 females) thatflapped at some point while crossing the beach, the mean air speed and computedstandard error were 14 ± 0-2 m/sec. The sine of the condor's glide angle (0) wascalculated by dividing the difference in altitude (i.e. descent or ascent) by the airdistance travelled between the two markers. No vertical currents were ever detectedby the propeller anemometer, hence no corrections for the distance of vertical move-ment through the air were made. Values of glide angle 6 computed for condors thatdid not flap ranged from a descent of 3-5° to an ascent of i°. I computed sinking speedwith the equation
Vt= Fsinfl, (1)
where V is the air speed. The mean sinking speed and computed standard error forthe gliding condors were 0-5 ± 0-08 m/sec. Differences in air speeds and sinking speedsaccording to sex were not significant. Similar data recorded on five turkey vultures(Caihartes aura) are also presented in Table 1.

Gliding flight of the Andean condor in nature 227
Table 1. Flight data from measurements recorded at Playa Ckucho
(Each entry is a mean value followed by a computed standard error.)
Airspeed {V)Sinking speed (V,)Sine of glide angle 6Reynolds number (xio1) (Re)Coefficient of lift (CL)Total drag (FD)Induced drag {Foi)Horizontal wind speed duringobservations
Initial altitude of flight path
Unit
m/secm/sec
———NN
m/sec
m
Glidingcondors(n = t5)
i5±°-5o-5±o-o8
0-030 ± 0-0053-6±oi307 ±0-04
3±o-63±o-2S±O-2
6o±3
Flappingcondors(« = 42)
I4±O20-3 ±0-04
—
3-3±o-o6»——
4±o-23+O-2
5O±2
Flappingturkey vultures
(" = S)10 + 0-5
O"4±o-i—
1-7 ±0-09*——
0-7 + 0-072 ±0-5
3°±4
• Does not describe viscous flow regime for those moments during flapping.
Aerodynamic relations
An analysis of the data on forward speeds and sinking speeds considering dimensionsof the bird and properties of the air provide standard values useful in evaluating thegliding performance of the condor. Principles involved in such an analysis are dis-cussed in Prandtl & Tietjens (1934). The following relations, conventional foraerodynamical studies, were used:
FD = W sin d, (2)
FL=W COS 6, (3)
FD = \SpVK:D, (4)
FL = ISPV*CL, (5)
where FD is the drag force and CD the coefficient of drag, FL is the lift force and CL
the coefficient of lift, W is the weight of the bird, S is the projected wing area, andp is the air density. In all computations cos 6 was taken to be unity; variation fromunity is negligible for the small glide angles considered in this study. Size and weightare listed in Table 2. The total weight of the bird will depend to a large extent on theamount of food carried in the crop. The effect of this variable should have beennegligible here, however, since crops were empty for 54 of the 57 observations made;only one bird had a full crop. Wing area (S) was determined by using a polar plani-meter to measure the projected wing area from a photograph taken straight belowa gliding condor and multiplying it by the squared ratio of the actual wing-span tothe wing-span of the projected image. As total wing area I took the area of the planeprojected by both wings together with that part of the body intercepted by straightlines joining the leading and trailing edges of the wing. Length of the average wingchord (c) was computed by dividing values for wing area by those of the span.Values used for temperature-dependent air density ranged from 1-18 to 1-20 kg/m3.Flow conditions of any fluid around any object can be described by the Reynolds
15-2

228 J. MCGAHAN
Table 2. Dimensions of the condor and turkey vulture
Condor
Mass (m)Wingspan (b)Wing chord (c)Wing and intercepted body area (S)
Full extensionModerate flexion (span reduced2 0 % Fig. 3)
Wetted areas (SJFull extension
Tail openTail closed
Moderate flexionAspect ratio (A'/S = R)Wing loading (mg/S)
Unit
kgmmm»m«m1
m«m*m1
m«N/mf
N/m1
,Adult male
n-7(4)t2-99 (7)0 3 8—
1 1 30 9 5
—
2 7 02 6 02 2 3
7-91 0 2
Adult female
8-4 (2)2-77 (3)O-35
0 9 70 8 2
—
2-372 2 9
i-997-985
Turkeyvulture*
i-98(4)i-79 (3)0-26—
0-46—
1 0 6———
7-042
• Sexes similar in size.t Mean value is computed from sample size listed in parentheses. Data from birds measured in the
field are from records taken from the following sources: Apolinar (1914), Murphy (1925), Poole (1938),Fisher (1946), Lint (i960), Conway (1962) and Olivares (1963).
number (Re), a dimensionless number that accounts for variations in viscosity effects.Reynolds numbers noted in this study (Table 1) were calculated with the equation
Re = Vc(plu), (6)
where c is the average wing chord length and u is the viscosity of the air. Both airviscosity (M) and density (p) are temperature- and pressure-related; in this study theratio pju used varied from 62500 to 65400.
The mean and standard error for lift coefficient calculated for the 15 gliding condorswere 0-7 +0-04. Lift coefficients are dependent on wing shape and position anddescribe the effects produced by the angle of attack, the aspect ratio, the profile ofthe wings, and fluid viscosity of the air. In equilibrium gliding CL is inversely relatedto air speed. Condors probably employed a narrow range of optimum speeds incrossing Playa Chucho; I was unable to obtain estimates for minimum and maximumlimits for CL.
Drag forces act to retard forward motion, and in an equilibrium gliding situationthe energy required to overcome these forces is equal to the loss of potential energyincurred in the descent through the glide angle (equation 2). These drag forces canbe resolved into two types: (1) parasite drag F^, from skin friction and pressuredrag, and (2) induced drag, Fm, caused by the energy loss in producing vortical airmovement. I computed estimates for these two types of drag force using a procedureemployed by Parrott (1970) in his wind-tunnel analysis of black vulture flight.Induced drag, directly related to lift force, is calculated with the equation
F —n\p{bVMf (7)
where M2, the Munk span factor, accounts for non-elliptical distributions of liftacross the wing. I used a span factor of 0-9, the same value used by Parrott for the

Gliding flight of the Andean condor in nature 229
black vulture. I obtained a mean and computed standard error of 3 + 0-2 N (newtons)for induced drag forces. Estimates for weight and size dimensions used in computingCL and Fm are considered accurate within 5 %; values for CL are believed accuratewithin 20%, and values for Fm within 25%.
By subtracting the values for induced drag from those of total drag, estimates ofparasite drag force (F^) were obtained. Coefficients of parasite drag (C^) werecomputed with the equation
p
where Sw is wetted or total surface area of the bird. Values for the wetted area werecalculated with a technique devised by Tucker & Parrott (1970), whereby parts ofthe bird are equated with geometrical figures to secure surface area estimates that arebelieved accurate within 20% (Table 2).
Data recorded on five turkey vultures presented in Tables 1 and 2 have been treatedlike the data for condors with one exception. I assumed that the general shapes ofturkey vulture and black vulture were similar and estimated the wetted surface areaof the turkey vulture by multiplying the value computed for the black vulture (Parrott,1970) by the squared ratio of wing spans. Since values for the wetted area of the condordetermined by this method and the method mentioned above differed only by 1 %,I expect the error for the turkey vulture estimate to be insignificant.
Information recorded on condors and turkey vultures that flapped at some timewhile crossing the observation section of the beach also provided estimates for theforces and coefficients of parasite drag. I corrected sinking-speed values for thesedata, however, since flapping rate and sinking speed are related (McGahan, 1972).In an analysis of regression with flapping rate as the independent variable I com-puted mean sinking speeds of 0-5 m/sec for condors and o-6 m/sec for turkey vulturesfor a projected flapping rate of zero.
Parasite drag. The Cpp values I obtained for gliding condors were implausiblylow. With mean data on air speed and sinking speed I computed a CDp of o-ooi forthe gliding female condor; for the male I obtained negative values for parasite dragforces, an impossible condition (Table 3). C ^ estimates from mean data on nappingbirds were also low. I calculated 95 % confidence limits for the mean air speed andsinking speed observed and combined these upper and lower interval values to securemaximum and minimum estimates for the glide angle, and indirectly the coefficientsof parasite drag. So, for example, I divided the lower confidence interval value of13-6 m/sec for the mean air speed into the upper confidence interval of o-68 m/sec forsinking speed corrected for zero flapping, to calculate a maximum estimate for the glideangle of flapping condors. For these maximum angles, C ^ estimates were 0-003 f°r
the flapping male condor, 0-005 f°r the female, and 0-020 for the flapping turkeyvulture. All Cj^ estimates for the condor are exceptionally low, either less than orwithin the range of optimum values defined for parallel airflow across a smooth flatplate (Table 3). Only the maximum estimate for the turkey vulture approximated tothe values determined for the black vulture in Parrott's wind-tunnel study. Appa-rently some source of error has not been taken into account.

230 J. MCGAHAN
Table 3. Estimates for the coefficient of parasite drag forcondors and turkey vultures
Sinkingspeed
ad-For- justedward for
air Sinking zero Sine ofspeed speed flapping glide
Total drag Induced drag Coefficient offorce (N), force (N). parasite drag,eqn (2) eqn (7) eqn (8)
(m/sec) (m/sec) (m/sec) angle 8 Male Female Male Female Male Female
Mean data for sinking and air speedGliding condors 15 0-50 — 0-0333 3'8 2-7 3-9 2-4 — o-ooi( n = 15)
Flapping condors 14 — 0-5 0-0357 4'1 2-9
Flapping turkey 10 —vultures (» = 5)
0-95 confidence intervals for mean air andsinking speeds providing:(a) Minimum estimates for sin 6
Gliding 16-4 0-29condors
Flapping 14-5 —condors
Flapping 11-8 —turkey vultures
(6) Maximum estimates for sin 6Gliding 14-4 0-63condors
Flapping 13-6 —condors
Flapping 8-4 —turkey vultures
00333
00357
00600
3 9 2-4
4 5 2-7
0-7
— o-ooi
0008
— 0-0177 1'5
0 3 2
0-38
—
o-68
0-82
00221
0-0322
00438
00500
0-0976
2-5
5-0
5 7
o-6
33
4-2 2-5
0-5
2-O —
36 4-3
48
2-6
29 0-003
0-003
0-005
1-9
Cop values for airflow parallel to a flat plate calculated for thefollowing Re:
(1) 3-6 x 10", the mean Re computed for gliding condors(2) 3-3 x i o \ the mean Re computed for flapping condors(3) 1 -7 x io1, the mean Re computed for flapping turkey vultures
Turbulentflow
(Prandtlequation)
000540-00550-0064
Laminarflow
(Blasiusequation)
0-00220-00230-0032
DISCUSSION
Possible sources of error
I found that relatively small errors in the weight estimates for heavier birds pro-duced substantial differences in the Cj^ values. In computing total drag, weight valuesof the first power are used compared to second-power figures used in calculatinginduced drag. Thus, if the weight given for female condors is an overestimate of1 kg or 12% then the Cj^ value for napping female condors would be twice thatshown. An error of similar proportions in the weight of the smaller turkey vulturechanged the C^ by only 2%. This may help explain why data for the heaviercondors, particularly the male, are more deviant.
Two other sources of error could account for the general trend toward low C^
Gliding flight of the Andean condor in nature 231
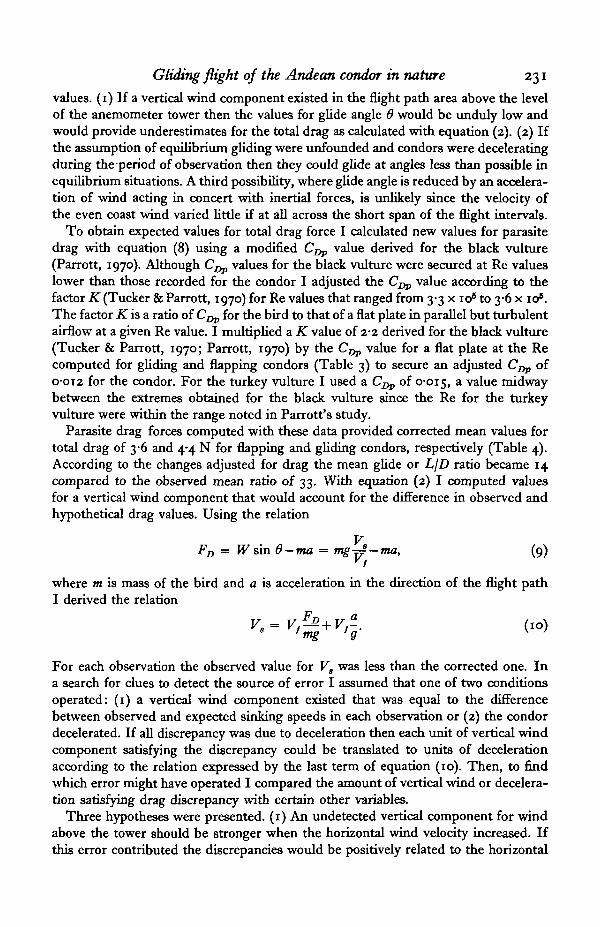
values. (1) If a vertical wind component existed in the flight path area above the levelof the anemometer tower then the values for glide angle 6 would be unduly low andwould provide underestimates for the total drag as calculated with equation (2). (2) Ifthe assumption of equilibrium gliding were unfounded and condors were deceleratingduring the-period of observation then they could glide at angles less than possible inequilibrium situations. A third possibility, where glide angle is reduced by an accelera-tion of wind acting in concert with inertial forces, is unlikely since the velocity ofthe even coast wind varied little if at all across the short span of the flight intervals.
To obtain expected values for total drag force I calculated new values for parasitedrag with equation (8) using a modified C ^ value derived for the black vulture(Parrott, 1970). Although C^ values for the black vulture were secured at Re valueslower than those recorded for the condor I adjusted the Cpp value according to thefactor K (Tucker & Parrott, 1970) for Re values that ranged from 3-3 x io6 to 3-6 x 10s.The factor K is a ratio of C ^ for the bird to that of a flat plate in parallel but turbulentairflow at a given Re value. I multiplied a K value of 2-2 derived for the black vulture(Tucker & Parrott, 1970; Parrott, 1970) by the C ^ value for a flat plate at the Recomputed for gliding and flapping condors (Table 3) to secure an adjusted C ^ of0-012 for the condor. For the turkey vulture I used a C ^ of 0-015, a value midwaybetween the extremes obtained for the black vulture since the Re for the turkeyvulture were within the range noted in Parrott's study.
Parasite drag forces computed with these data provided corrected mean values fortotal drag of 3-6 and 4-4 N for flapping and gliding condors, respectively (Table 4).According to the changes adjusted for drag the mean glide or LjD ratio became 14compared to the observed mean ratio of 33. With equation (2) I computed valuesfor a vertical wind component that would account for the difference in observed andhypothetical drag values. Using the relation
VFD = W sin 6 —ma = mg~—ma, (9)
V1
where m is mass of the bird and a is acceleration in the direction of the flight pathI derived the relation
V,= V,^+Vt-. (10)
For each observation the observed value for VB was less than the corrected one. Ina search for clues to detect the source of error I assumed that one of two conditionsoperated: (1) a vertical wind component existed that was equal to the differencebetween observed and expected sinking speeds in each observation or (2) the condordecelerated. If all discrepancy was due to deceleration then each unit of vertical windcomponent satisfying the discrepancy could be translated to units of decelerationaccording to the relation expressed by the last term of equation (10). Then, to findwhich error might have operated I compared the amount of vertical wind or decelera-tion satisfying drag discrepancy with certain other variables.
Three hypotheses were presented. (1) An undetected vertical component for windabove the tower should be stronger when the horizontal wind velocity increased. Ifthis error contributed the discrepancies would be positively related to the horizontal
232 J. MCGAHAN
Table 4. Values describing certain parameters of flight that areadjusted to satisfy a discrepancy in estimates of drag
(Each entry is a mean value followed by a computed standard error.)
Parasite drag (F^)Total drag (FD)Sine of glide angle 0Vertical wind com-ponent
Deceleration
Unit
NN
m/sec
m'/sec
Glidingcondors(» = 15)
4'4±o-37"7±o-3
0-073 ±0-00050-7 ±008
0-410-05
Flappingcondors(«=43)
3'6±oi7"3±o-2
0-073 ± O'ooos0-5 ± 0-04
0-4 ± 0-03
Flappingturkey vultures
(n = 5)I-O±O-I1 7 ±0-04
0-087 ±O-OO20-3 ± O-OS
03 ±003
wind speed. (2) Decelerating condors probably reduce their forward speeds to anoptimum level for crossing the beach. Hence I would expect birds flying faster todecelerate more on the average, predicting a positive correlation between values fordeceleration and air speed. (3) Condors could glide at steeper angles to attain above-average speeds. If most of the condors started at comparable altitudes then thosedecelerating after gliding temporarily at a steeper angle would start across the beachat a lower initial altitude. A negative correlation between the discrepancy for dragforces and the initial altitude of flight would serve as evidence for the presence ofdeceleration forces. One of the 15 gliding condors actually gained altitude whilecrossing the beach; this bird also started at the lowest altitude, 39 m. The condormay have dropped sharply just before entering the observation section and then,while decelerating, crossed it without descending - a typical pelican flight patternseen when they skim along just above the water surface without flapping.
No correlations were significant for the data on the 15 gliding condors. For theflapping condors I used a regression coefficient for flapping rate and sinking speed(McGahan, 1972) to correct the vertical wind and deceleration units to levels of zeroflapping. Then with these corrected values I computed correlation coefficients withthe same variables used with the gliding condor data. First, I examined the associationbetween the flapping rate and each of the test variables to check for any bias intro-duced by the correction factor for flapping. The correlations were not significant andin each case the bias acted to retain the null model. For units of deceleration satisfyingthe apparent drag discrepancy I obtained a negative correlation with the altitude ofthe flight path (r = —0-13) and a positive correlation with flight speed that wassignificant (Text-fig. 2). The significance of the last coefficient provides someevidence that deceleration was responsible for the low values of C ^ I obtained.
Although this analysis provided no evidence for the presence of an undetectedvertical wind component, one field observation did. A turkey vulture turned aroundtwice within the central third segment of the observation beach, glided above methree times without flapping during a 1 min period, and lost only 5-10 m of altitude.The horizontal anemometer recorded a wind speed of 8 m/sec but the vertical anemo-meter registered nothing. Deceleration in this case could not explain the unusuallylow sinking speed; a vertical wind component must have been present above thetower.

Gliding flight of the Andean condor in nature
10 r
5T 0-8
ai
^ 0-6o
233
0-4•o'o.2
HJ_ I I I I I J 1
10 12 14 16 18Forward air speed (m/sec)
20
Text-fig. 2. Air speed of condors that flapped while crossing Playa Chucho related to unitsof deceleration that satisfy an apparent discrepancy in computed values for drag (n = 42,T = +0-32, P < 0-05, i-tail test).
An average difference of 8° in the angle of streamlines in the boundary layer at thelevel of the tower and the flight path could account for the theoretical discrepancy inthe drag forces for the gliding condors. By dividing 5 m/sec, the mean horizontalwind speed for the observations (Table 1), into 0-7 m/sec, the mean vertical windcomponent expected (Table 4), I obtained an estimate of the tangent of the streamlineangle necessary to explain the drag differences. A similar computation using 0-5 m/sec, an expected value for the vertical wind in the absence of flapping, and 3 m/sec,the mean horizontal wind speed, for observations of flapping condors provided anestimate of io° for the difference in streamline angles. From data on flapping turkeyvultures I obtained a value of 90. These three sets of data recorded during periods withgenerally different wind conditions provided three similar estimates. This hypotheticalflow pattern for different levels in the boundary layer of air striking a coastline wouldnot be unusual.
Flex-gliding
Flex-gliding, a term from Hankin (1913), designates a gliding posture where thewings are partially flexed in the horizontal plane. In bending both wrist and elbowcondors altered the wing configuration across a range from near full extension tosome positions where the span was almost halved (Plate iC). Moderate flexioncharacterized smooth straight gliding journeys over long cross-country distances.Wing area is reduced by overlapping the primaries in flexing the manus and byrelaxing the patagium in bending the elbow (Text-fig. 3). Simultaneously the tailusually contracts to a more closed position. Circling condors generally initiated longcross-country flex-glides with a dipping motion by both manus; then, the wings andtail, which were expanded during the circling ascent, moved to the flexed position asthe bird began the straight descending glide.
Many of these straight flights, uninterrupted by bouts of flapping or circling,

234 J. MCGAHAN
Text-fig. 3. Differences in the flexed and extended gliding postures. Span in flexedposture is reduced by 20%. Traced from photographs.
Frequency of tailexpansion postures
about an irzone
(see sketch)
Air speed
(a) Expanded more(6) Expanded less
=S 16m/sec
2820
> 16m/gec
1
8X* = 6-76P < 001
Text-fig. 4. The degree of tail expansion related to air speed for57 condors crossing Playa Chucho.
extended over periods of 5 min. Recorded durations of four flex-glides were particu-larly long: 7 min 40 sec, 9 min 42 sec, 12 min, and 14 min 40 sec. In the last observa-tion the condor, before disappearing in the distance, had traversed about 13 km grounddistance and had lost only one-fourth of the 1000 m altitude gained in a circling boutprior to the flex-glide. Hypothetically, if the bird continued to encounter the same airconditions he could have travelled 50 km in a period of about 35 min, a potentialjourney made possible by ascent in a circling bout only 8 min in duration. In thisparticular observation I was standing below the midpoint of the flight pathdescribed. Values for altitude were obtained by combining estimates of the angle ofthe bird's position above certain mountains or ridges with data from maps on thealtitude of the landmark and its distance from the observation point. I was often ableto determine the bird's position relative to the landmark by locating the bird's shadowon the ground and then using the sun's 'line of sight' for triangulation.
The forward air speeds of condors in a moderately flexed posture should exceedthose of condors gliding with fully extended wings. In an equilibrium gliding systema reduction of airfoil area coincides with an increase in velocity. I noted that the tailsof condors crossing the observation beach at higher air speeds tended to be lessexpanded (Text-fig. 4).
Gliding flight of the Andean condor in nature 235
Assuming that the condor seeks to minimize sinking speed, then velocity increasesbrought about by wing flexion can be computed with the equation
S = zmg (M*lnRCD0)*lpV* (11)
provided by Alexander (1968), where R is the aspect ratio and CDo = C ^ (Sw/S),a parasite drag coefficient for wetted surface in terms of the projected wing area.I used an air density value p = 1-18 kg/m3, a parasite drag coefficient Ci)p = 0-012,and the mean dimension values for male and female condors given in Table 2 to com-pute estimates for the air speed of condors in the two flight postures shown in Fig. 3.
According to these computations an adult male with wings fully extended wouldglide with minimum sinking speed when his forward air speed was 13-9 m/sec. Uponflexing them to the degree shown in Text-fig. 3 (a span reduction of 20%) this opti-mum forward air speed would increase to 15-2 m/sec. Corresponding values for theadult female are 12-6 and 13-8 m/sec, respectively. These figures can serve only asrough estimates, however, since CDp variation at different speeds is neglected as wellas airfoil effects of the tail.
An ability to change forward air speed provides the condor with a flexibility forcrossing areas that differ in the types of air movement, food availability and potentialdanger. Efficient increases in air speed are necessary for flight against a headwind;the condor must sacrifice the shallow glide angle of a moderate air speed for a speedproviding some forward progress relative to the ground. As air speed increases thecondor can minimize increased sinking speed by reducing airfoil area. Once I saw anadult female circling in a 40 km/h wind flex her wings and tail more while travellingupwind than downwind, apparently accelerating upwind flight to reduce groundspeed downwind. Five condors flushed from a cliffside roost circled up about 500 mabove the sea and then, in postures flexed to the degree shown in Text-fig. 3 (dottedline), glided in steep descent south-east along the coast heading against an eveningcross wind of 30 km/h. Ground speeds were noticeably reduced compared to thoseobserved when wind speeds were less. Every 20-30 sec each bird flapped in a bout ofthree wing-beats. Presumably these bouts served to reduce sinking speed (McGahan,1972) and thus extended the potential endpoint of the descending flight path fartherup the coast.
Frequently, condors flying in intense declivity winds near cliffs glided with stronglyflexed wings and lowered feet (Plates 1 A, C, 2). This posture occurred in flight pat-terns preceding landing and often during periods when the birds flew near my observa-tion point and inspected me carefully. Fluttering wing covert feathers (Plate 2) andraised alulas (Plate 1 A) indicate that the angle of attack with the steep vertical windis large enough to detach part of the boundary layer of air moving over the wings.These stalling effects coincide with an increase in sinking speed and a reduction inforward speed. Lowered feet can function as air brakes to retard forward air speed.In an air mass that ascends rapidly the bird is permitted greater sinking speeds withoutlosing altitude; then, the reduction in forward speed can augment conditions forexamining objects on the ground, enhance the precision of landing manoeuvres, orprovide prolonged access to local declivity currents of limited size. I watched an adultmale advance with a fairly constant ground speed of only 0-5 m/sec for several minuteswhile flex-gliding near the edge of a cliff in a 35 km/h headwind. Another adult male
236 J. MCGAHAN
in a 30 km/h headwind both advanced and ascended at the rate of 0-3 m/sec. 0mcondor, flex-gliding in a deflexion current, maintained a high pitch angle of 350 anclimbed in steep almost vertical ascent without stalling. Sometimes in strong deflexioncurrents condors with fully extended wings made little forward progress relative tothe ground for extended periods; in one instance a condor, apparently gliding in theupdrafts of a beach-deflected wind, did not move, except for a gradual descent duringa 40 sec period. Then she glided downwind, ascended near the face of a bluff, andreturned again to assume this stationary glide above a carcass on the beach. Advancingslightly, another condor descended for 1 min at a mean rate of 2*4 m/sec in a straightpath that formed a 700 angle with the ground. The wings were completely extendedand pitch was parallel to the horizon.
Increasing the weight loading ratio of the airfoil by flexion may have functioned attimes to provide more stability for condors flying in turbulent updrafts. In pursuitsand in flight patterns in restricted areas temporary flexed-wing postures providedmanoeuvrability. Acceleration forward and down succeeded wing flexion, anddeceleration succeeded extension. Sometimes circling condors alternated betweenextended and flexed wing postures; in alternating between altitude gains and lossesthey tended to remain in the same general area for extended periods. Eight times animmature female alternately ascended and descended in a coastal declivity current.Flexing her wings to half span and simultaneously lowering her feet she began adescent losing about 10 m altitude; then, extending her wings fully and lifting herfeet back to the position against the body she initiated the ascent that carried herback to the original level. This series of manoeuvres was conducted while circling inthe same general area.
SUMMARY
1. Derived in a vector analysis with measurements of wind velocity and groundvelocity of the bird, the following mean air speeds were obtained for birds crossinga Peruvian beach: 15 m/sec for 15 gliding Andean condors, 14 m/sec for 42 condorsthat flapped during the crossing, and 10 m/sec for five turkey vultures that flapped.For the 15 gliding condors a mean lift coefficient of 0-7 and a mean induced dragforce of 3 N were computed.
2. Implausibly low values derived for parasite drag coefficient of the condorappeared to be due to (a) unmeasured forces of deceleration and (b) an undetectedvertical component of the wind at the level of the flight path. Field data, adjusted byintroducing a coefficient of parasite drag determined for the black vulture in a wind-tunnel study provided corrected estimates of drag. I secured an adjusted value of14 for the LjD ratio of a condor gliding with wings fully extended.
3. A moderate flexion of the wings reducing the span by 20% is estimated toincrease the optimum air speed from 13-9 to 15-2 m/sec for an adult male condor andfrom 12*6 to 13-8 m/sec for an adult female.
I am indebted to my wife, Libby, for her many hours of help in the field and on themanuscript. Karen Craighead assisted in the field and David Thompson, Dr JohnEmlen, Dr John Neess, Dr John Magnuson and Daniel Smith provided editorialassistance. For their help I am most grateful. Figure drawings are by John Dallman

Journal of Experimental Biology, Vol. 58, No. 1 Plate 1
J. McGAHAN (Facing p. 236)

Journal of Experimental Biology, Vol. 58, No. Plate 2
J. McGAHAN
Gliding flight of the Andean condor in nature 237
fcnd Cheryle Hughes. This study was supported by a grant (GB-19449) from theNational Science Foundation and a fellowship from the Danforth Foundation.
REFERENCES
ALEXANDER, R. MCN. (1968). Animal Mechanics. Seattle: University of Washington Press.APOLINAR, H. (1914). El c<5ndor. Boln. Soc. Cienc. nat. Inst. La Salle, pp. 198-107, 235-42.CONWAY, W. G. (1962). The weights of 11 living eagles and vultures at the New York Zoological Park.
Auk 79, 274-5.FISHER, H. I. (1946). Adaptations and comparative anatomy of the locomotor apparatus of New World
Vultures. Am. Midi. Nat. 35, 545-727.HANKIN, E. H. (1913). Animal Flight: A Record of Observation. London.LINT, K. C. (i960). Notes on breeding Andean condors at San Diego Zoo. Int. Zool. Yb. a, 82.MCGAHAN, J. (1972). Flapping flight of the Andean condor in nature. J. exp. Biol. 58, 230-53.MURPHY, R. C. (1925). Bird Islands of Peru. New York and London: C. P. Putnam and Sons.OLIVARES, A. (1963). jSe esta extinguiendo el c6ndor en Colombia? Monografia del cdndor. Rev. Acad.
Col. Cienc. 12, 21-8.PARROTT, G. C. (1970). Aerodynamics of gliding flight of a black vulture Coragyps atratus.J. exp. Biol.
53. 363-74-POOLE, E. L. (1938). Weights and wing areas in North American birds. Auk 55, 511-17.PRANDTL, L. & TIETJENS, O. G. (1934). Applied Hydro- and Aero-mechanics. New York: Dover Publ.
(1957)-TUCKER, V. A. & PARROTT, G. C. (1970). Aerodynamics of gliding flight in a falcon and other birds.
J. exp. Biol. 53, 345-67.