Embed Size (px)
Citation preview
Valley View Hospital
Garfield County, Colorado
Community Health Needs Assessment
December, 2015
525 S. Lake Avenue, Suite 320 │ Duluth, Minnesota 55802
218-727-9390 │ [email protected]
Get to know us better: www.ruralcenter.org

NATIONAL RURAL HEALTH RESOURCE CENTER 1
TABLE OF CONTENTS
Introduction .................................................................................................. 2
Survey Demographics ..................................................................................... 4
Survey Findings ............................................................................................. 5
Secondary Data Analysis ............................................................................... 12
Conclusions, Recommendations, and Acknowledgements .................................. 18
Establishing Health Priorities ......................................................................... 20
Improving Population Health in Your Community .............................................. 21
APPENDIX A: Survey and Cover Letter ............................................................ 25
APPENDIX B: Community Health Needs Assessment “Other” Comments ............. 28
APPENDIX C: Description and Source of Secondary Data ................................... 30
NATIONAL RURAL HEALTH RESOURCE CENTER 2
INTRODUCTION
Valley View Hospital is a 49-bed PPS hospital located in Glenwood Springs,
Colorado. Valley View Hospital (VVH) participated in a Community Health Needs
Assessment administrated by the National Rural Health Resource Center (The
Center) of Duluth, Minnesota.
In the autumn of 2015, The Center conferred with leaders from VVH to discuss the
objectives of a regional community health assessment. A mailed survey instrument
was developed to assess the health care needs and preferences in the VVH service
area. The survey instrument was designed to be easily completed by respondents.
Responses were electronically scanned to maximize accuracy. The survey was
designed to assemble information from local residents regarding:
Demographics of respondents
Utilization and perception of local health services
Perception of community health
The survey was based on a design that has been used extensively in the states of
Minnesota, Montana, Wyoming, Washington, Alaska, and Idaho.
Sampling
Glenwood Springs provided The Center with a list of inpatient hospital admissions.
Zip codes with the greatest number of admissions were stratified in the initial
sample selection. Each area would be represented in the sampling proportionately
to both the overall served population and the number of past admissions. Eight
hundred residents were selected randomly from PrimeNet Data Source, a marketing
organization. Although the survey samples were proportionately selected, actual
surveys returned from each population area varied. This may result in slightly less
proportional results.
Survey Implementation
In November 2015, the community health needs assessment, a cover letter on
Valley View Hospital’s letterhead, and a postage paid reply envelope were mailed
first class to 800 randomly selected residents in the targeted region (six zip codes).
A press release was sent to local newspapers prior to the survey distribution
announcing that VVH would conduct a Community Health Needs Assessment
throughout the region, in cooperation with The Center.
One hundred and forty-nine of the mailed surveys were returned, providing a 20%
response rate. Based on the sample size, surveyors are 95% confident that the
responses are representative of the service area population, with a margin of error
NATIONAL RURAL HEALTH RESOURCE CENTER 3
of 5.74%. Note that 60 of the original 800 surveys sent were returned by the U.S.
Postal Service as undeliverable.
This report includes comparisons to national averages from The Center’s
Community Health Needs Assessment (CHNA) Database when applicable.
Recommendations are included for developing and implementing program plans to
address key health issues identified by the community. A copy of the survey
instrument is included at the end of the report (Appendix A). This is the second
Community Health Needs Assessment survey VVH has done. The first survey was
conducted by the Center for Health Administration (CHA) at the University of
Colorado Denver in 2012, using data predominantly collected from the Colorado
Department of Public Health and Environment.
Report Findings May be Used For:
• Developing and implementing plans to address key issues as required by
the Patient Protection and Affordable Care Act §9007 for 501(c)3 charitable
hospitals
• Promoting collaboration and partnerships within the community or region
• Supporting community-based strategic planning
• Writing grants to support the community’s engagement with local health
care services
• Educating groups about emerging issues and community priorities
• Supporting community advocacy or policy development
Community Education about Local Health Care:
Community support of the local health care system is vital if the system is to remain
viable. Informed citizens are more likely to use and support the local health care
system if they have an understanding of the impact it has on the local economy and
quality of life.
NATIONAL RURAL HEALTH RESOURCE CENTER 4
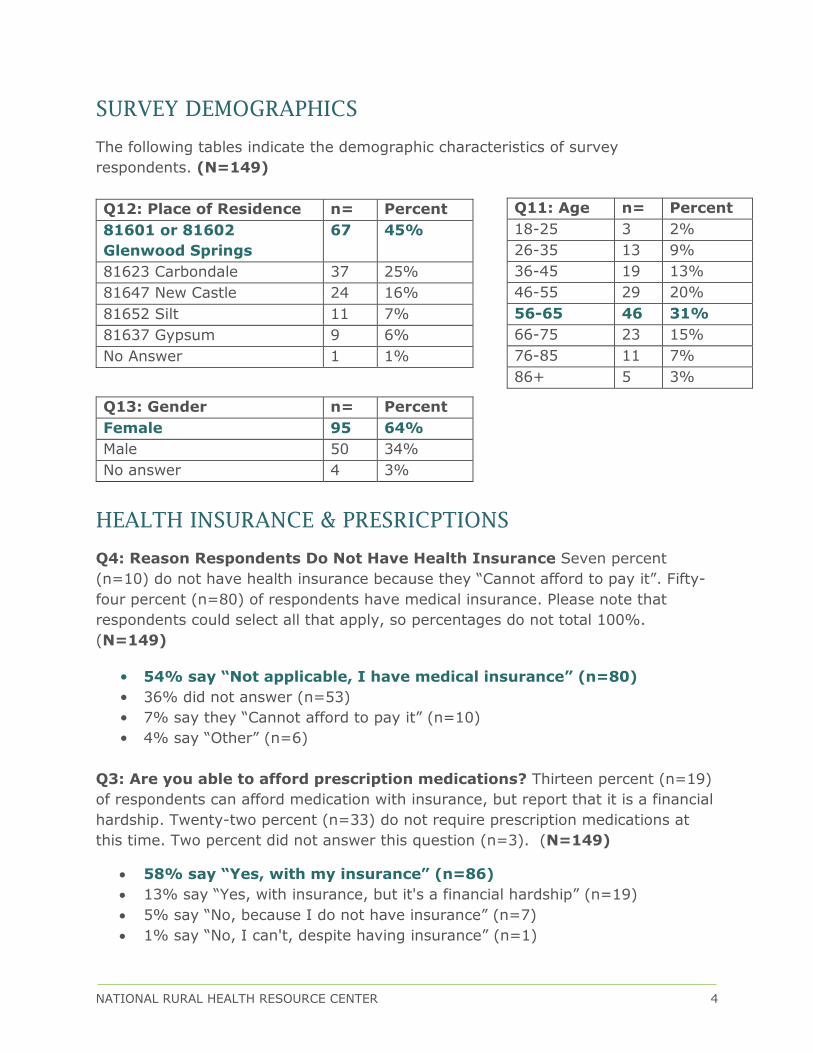
SURVEY DEMOGRAPHICS
The following tables indicate the demographic characteristics of survey
respondents. (N=149)
Q12: Place of Residence n= Percent
81601 or 81602
Glenwood Springs
67 45%
81623 Carbondale 37 25%
81647 New Castle 24 16%
81652 Silt 11 7%
81637 Gypsum 9 6%
No Answer 1 1%
Q13: Gender n= Percent
Female 95 64%
Male 50 34%
No answer 4 3%
HEALTH INSURANCE & PRESRICPTIONS
Q4: Reason Respondents Do Not Have Health Insurance Seven percent
(n=10) do not have health insurance because they “Cannot afford to pay it”. Fifty-
four percent (n=80) of respondents have medical insurance. Please note that
respondents could select all that apply, so percentages do not total 100%.
(N=149)
• 54% say “Not applicable, I have medical insurance” (n=80)
• 36% did not answer (n=53)
• 7% say they “Cannot afford to pay it” (n=10)
• 4% say “Other” (n=6)
Q3: Are you able to afford prescription medications? Thirteen percent (n=19)
of respondents can afford medication with insurance, but report that it is a financial
hardship. Twenty-two percent (n=33) do not require prescription medications at
this time. Two percent did not answer this question (n=3). (N=149)
58% say “Yes, with my insurance” (n=86)
13% say “Yes, with insurance, but it's a financial hardship” (n=19)
5% say “No, because I do not have insurance” (n=7)
1% say “No, I can't, despite having insurance” (n=1)
Q11: Age n= Percent
18-25 3 2%
26-35 13 9%
36-45 19 13%
46-55 29 20%
56-65 46 31%
66-75 23 15%
76-85 11 7%
86+ 5 3%
NATIONAL RURAL HEALTH RESOURCE CENTER 5
SURVEY FINDINGS
The Center has been administering Community Health Needs Assessments (CHNA)
in rural communities across America for over 25 years, which enables historical and
comparative analysis if applicable. Comparative analysis from the CHNA Database is
included when questions, field selections and methodology are standardized. In the
following tables and graphs, the question asked on the mailed survey is
emboldened and the question number from the mailed survey is appropriately
labeled as “Q10”.
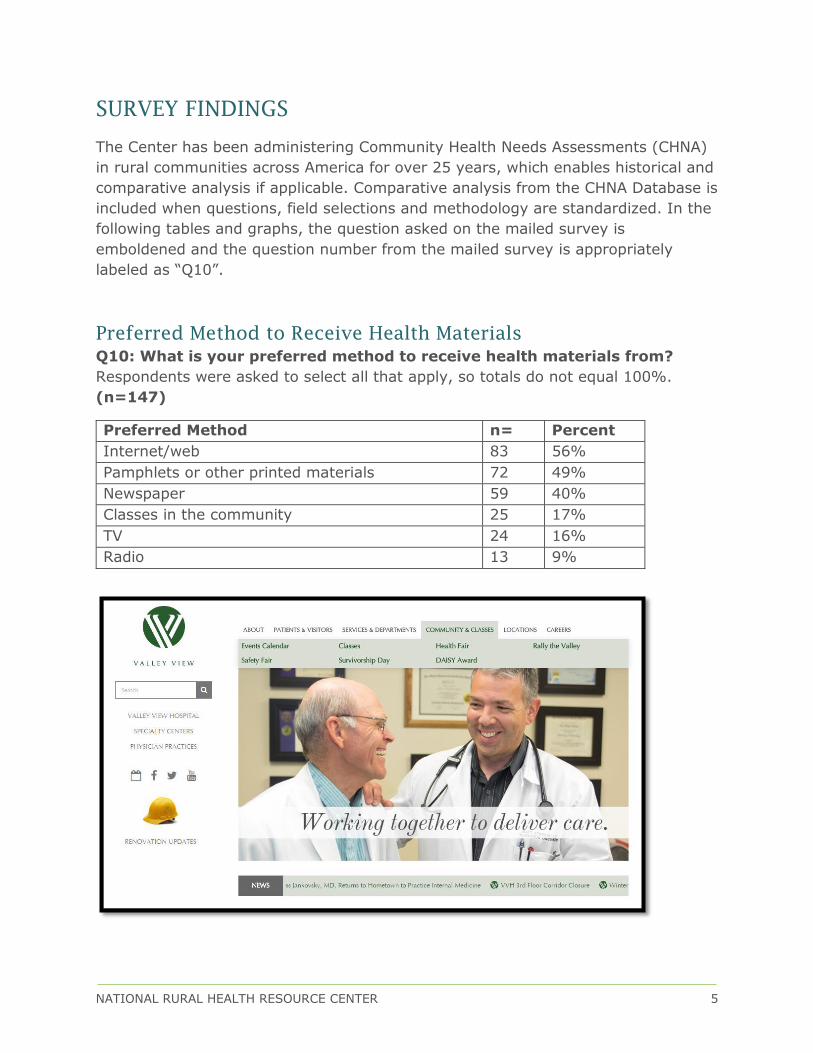
Preferred Method to Receive Health Materials
Q10: What is your preferred method to receive health materials from?
Respondents were asked to select all that apply, so totals do not equal 100%.
(n=147)
Preferred Method n= Percent
Internet/web 83 56%
Pamphlets or other printed materials 72 49%
Newspaper 59 40%
Classes in the community 25 17%
TV 24 16%
Radio 13 9%
NATIONAL RURAL HEALTH RESOURCE CENTER 6
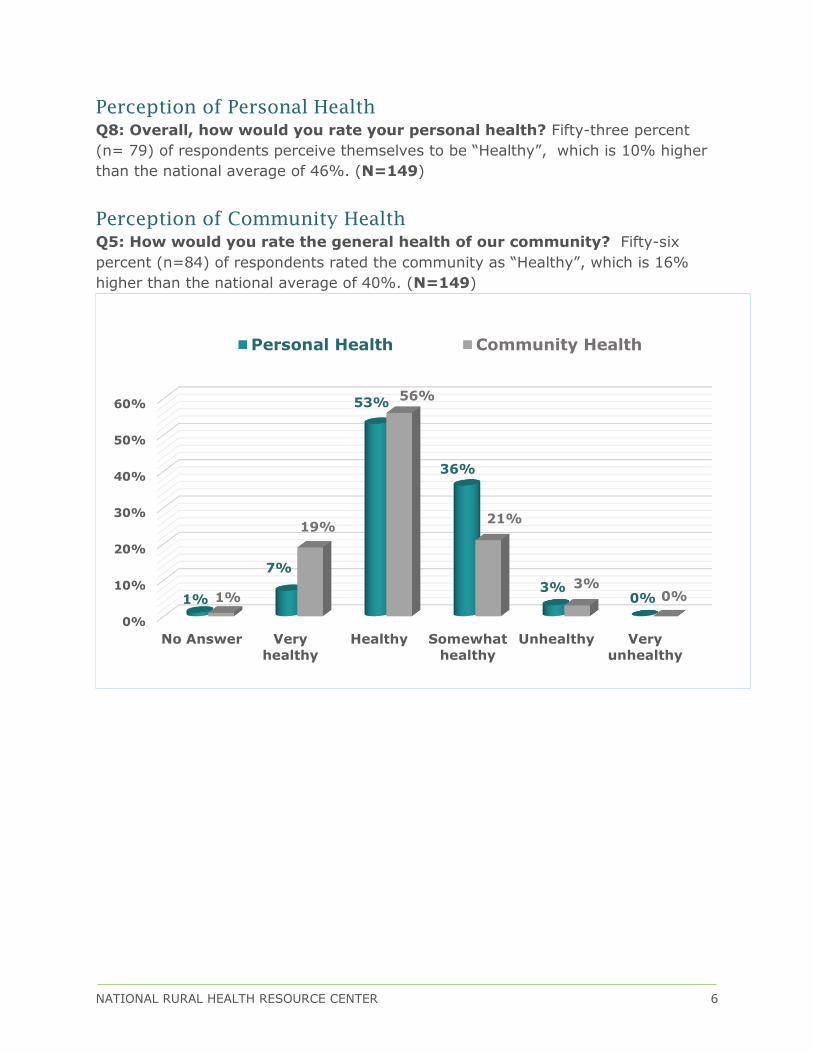
Perception of Personal Health
Q8: Overall, how would you rate your personal health? Fifty-three percent
(n= 79) of respondents perceive themselves to be “Healthy”, which is 10% higher
than the national average of 46%. (N=149)
Perception of Community Health
Q5: How would you rate the general health of our community? Fifty-six
percent (n=84) of respondents rated the community as “Healthy”, which is 16%
higher than the national average of 40%. (N=149)
0%
10%
20%
30%
40%
50%
60%
No Answer Very
healthy
Healthy Somewhat
healthy
Unhealthy Very
unhealthy
1%
7%
53%
36%
3%0%1%
19%
56%
21%
3%0%
Personal Health Community Health
NATIONAL RURAL HEALTH RESOURCE CENTER 7
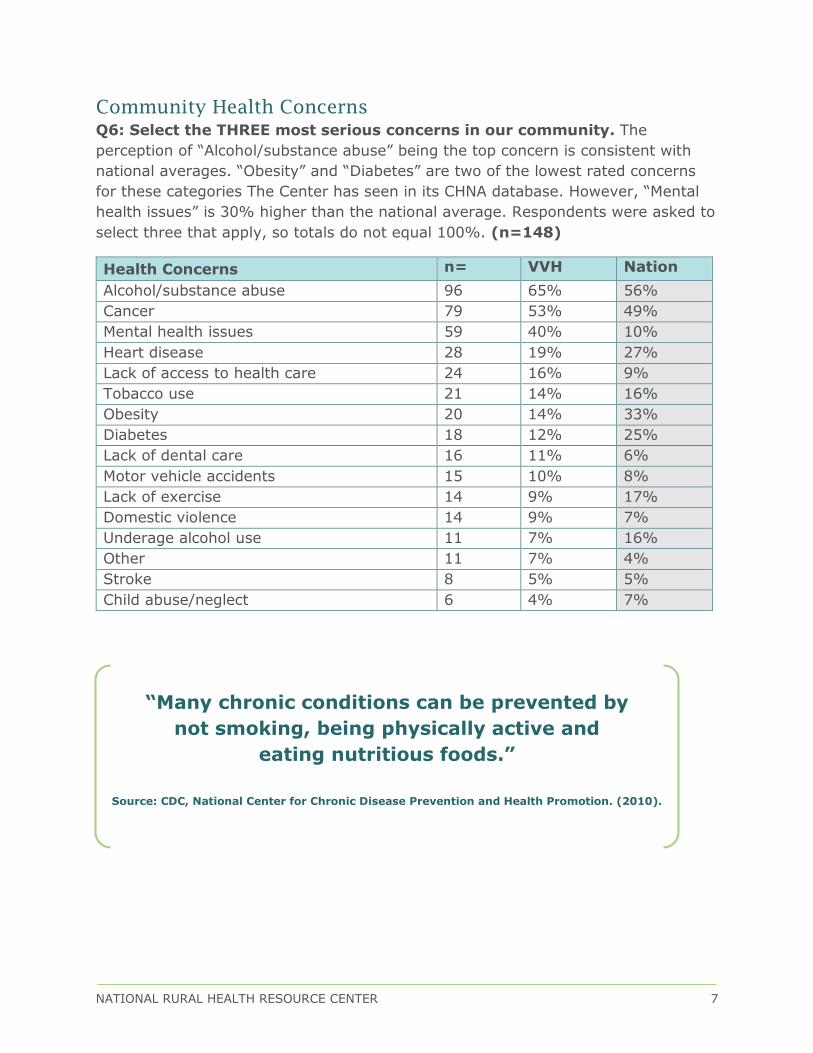
Community Health Concerns
Q6: Select the THREE most serious concerns in our community. The
perception of “Alcohol/substance abuse” being the top concern is consistent with
national averages. “Obesity” and “Diabetes” are two of the lowest rated concerns
for these categories The Center has seen in its CHNA database. However, “Mental
health issues” is 30% higher than the national average. Respondents were asked to
select three that apply, so totals do not equal 100%. (n=148)
Health Concerns n= VVH Nation
Alcohol/substance abuse 96 65% 56%
Cancer 79 53% 49%
Mental health issues 59 40% 10%
Heart disease 28 19% 27%
Lack of access to health care 24 16% 9%
Tobacco use 21 14% 16%
Obesity 20 14% 33%
Diabetes 18 12% 25%
Lack of dental care 16 11% 6%
Motor vehicle accidents 15 10% 8%
Lack of exercise 14 9% 17%
Domestic violence 14 9% 7%
Underage alcohol use 11 7% 16%
Other 11 7% 4%
Stroke 8 5% 5%
Child abuse/neglect 6 4% 7%
“Many chronic conditions can be prevented by
not smoking, being physically active and
eating nutritious foods.”
Source: CDC, National Center for Chronic Disease Prevention and Health Promotion. (2010).
NATIONAL RURAL HEALTH RESOURCE CENTER 8
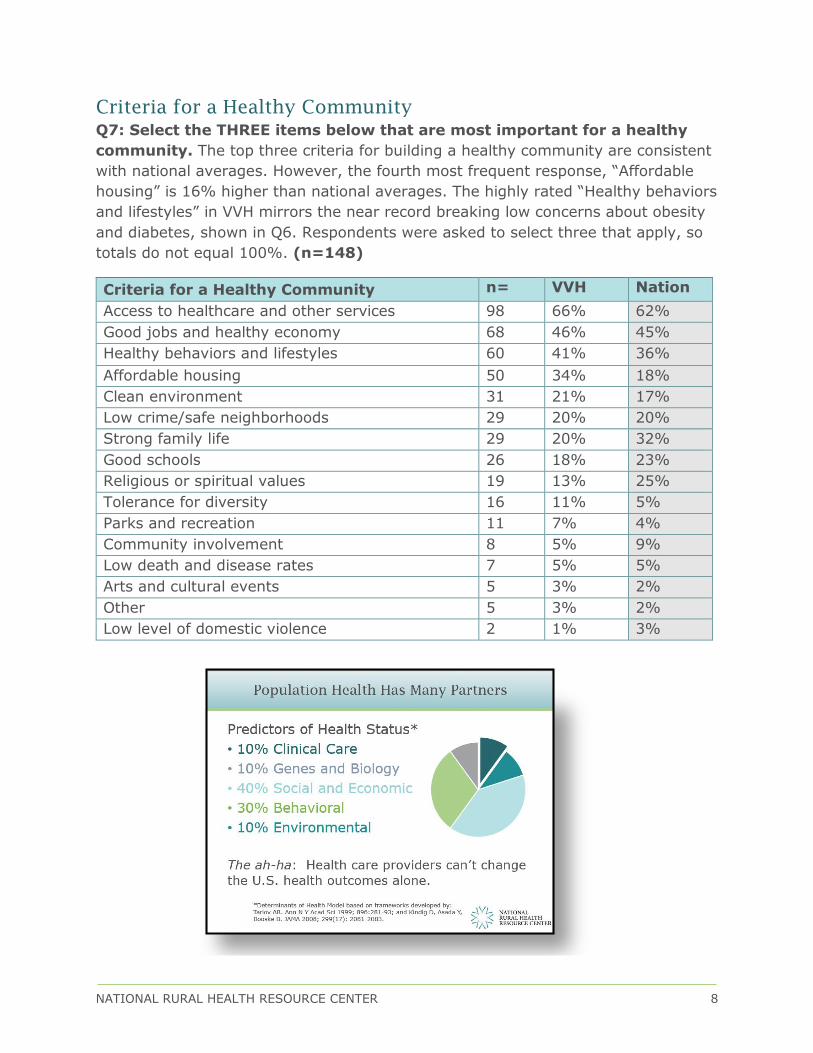
Criteria for a Healthy Community
Q7: Select the THREE items below that are most important for a healthy
community. The top three criteria for building a healthy community are consistent
with national averages. However, the fourth most frequent response, “Affordable
housing” is 16% higher than national averages. The highly rated “Healthy behaviors
and lifestyles” in VVH mirrors the near record breaking low concerns about obesity
and diabetes, shown in Q6. Respondents were asked to select three that apply, so
totals do not equal 100%. (n=148)
Criteria for a Healthy Community n= VVH Nation
Access to healthcare and other services 98 66% 62%
Good jobs and healthy economy 68 46% 45%
Healthy behaviors and lifestyles 60 41% 36%
Affordable housing 50 34% 18%
Clean environment 31 21% 17%
Low crime/safe neighborhoods 29 20% 20%
Strong family life 29 20% 32%
Good schools 26 18% 23%
Religious or spiritual values 19 13% 25%
Tolerance for diversity 16 11% 5%
Parks and recreation 11 7% 4%
Community involvement 8 5% 9%
Low death and disease rates 7 5% 5%
Arts and cultural events 5 3% 2%
Other 5 3% 2%
Low level of domestic violence 2 1% 3%

NATIONAL RURAL HEALTH RESOURCE CENTER 9
Delayed Health Care Services
Q1: In the past three years, was there a time when you or a member of your household thought you needed healthcare services, but you delayed
or did not receive medical services? “Yes”, 40% (n=60) of respondents reported delaying healthcare services when needed. This is 13% higher than the
national average of 27% reporting delayed care. (N=149)
No answer
1%
Yes
40%
No
59%
NATIONAL RURAL HEALTH RESOURCE CENTER 10
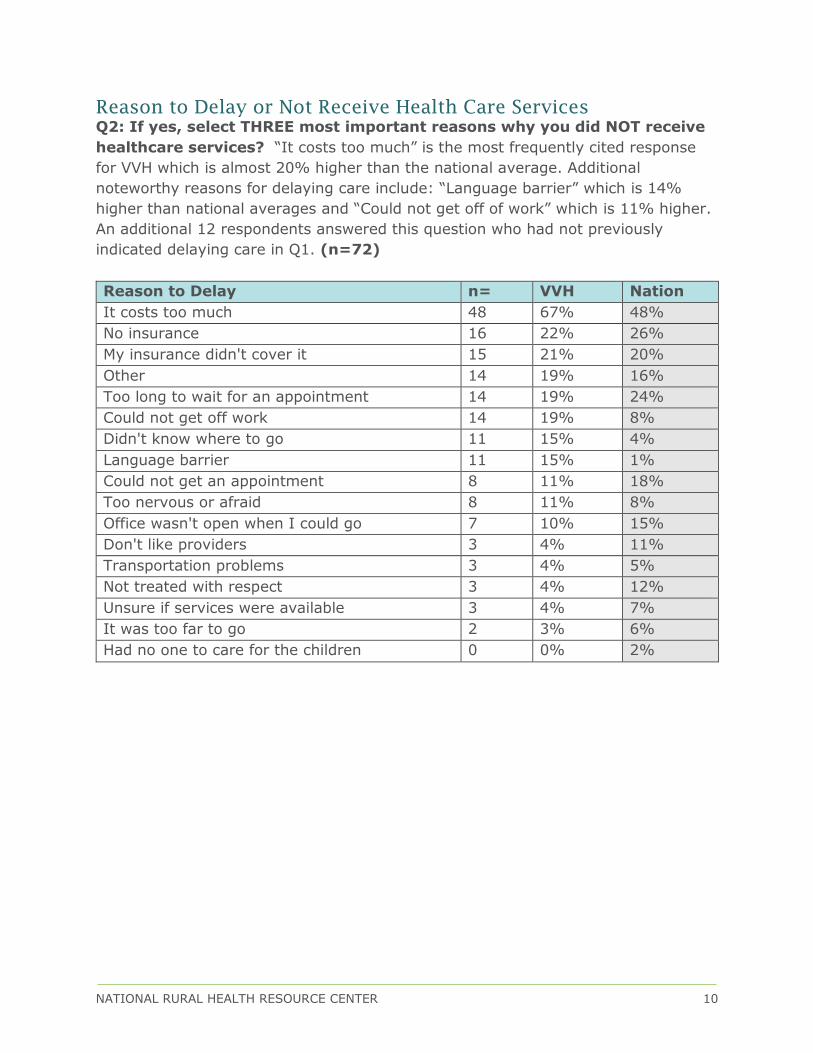
Reason to Delay or Not Receive Health Care Services
Q2: If yes, select THREE most important reasons why you did NOT receive
healthcare services? “It costs too much” is the most frequently cited response
for VVH which is almost 20% higher than the national average. Additional
noteworthy reasons for delaying care include: “Language barrier” which is 14%
higher than national averages and “Could not get off of work” which is 11% higher.
An additional 12 respondents answered this question who had not previously
indicated delaying care in Q1. (n=72)
Reason to Delay n= VVH Nation
It costs too much 48 67% 48%
No insurance 16 22% 26%
My insurance didn't cover it 15 21% 20%
Other 14 19% 16%
Too long to wait for an appointment 14 19% 24%
Could not get off work 14 19% 8%
Didn't know where to go 11 15% 4%
Language barrier 11 15% 1%
Could not get an appointment 8 11% 18%
Too nervous or afraid 8 11% 8%
Office wasn't open when I could go 7 10% 15%
Don't like providers 3 4% 11%
Transportation problems 3 4% 5%
Not treated with respect 3 4% 12%
Unsure if services were available 3 4% 7%
It was too far to go 2 3% 6%
Had no one to care for the children 0 0% 2%
NATIONAL RURAL HEALTH RESOURCE CENTER 11
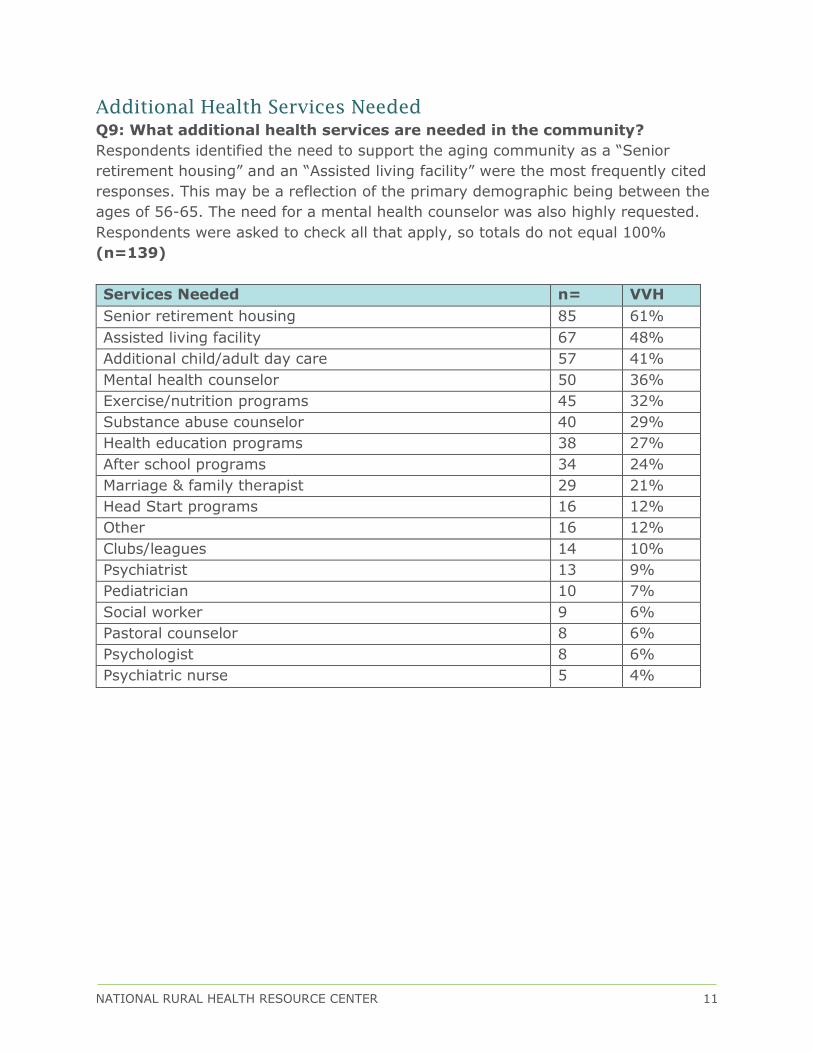
Additional Health Services Needed
Q9: What additional health services are needed in the community?
Respondents identified the need to support the aging community as a “Senior
retirement housing” and an “Assisted living facility” were the most frequently cited
responses. This may be a reflection of the primary demographic being between the
ages of 56-65. The need for a mental health counselor was also highly requested.
Respondents were asked to check all that apply, so totals do not equal 100%
(n=139)
Services Needed n= VVH
Senior retirement housing 85 61%
Assisted living facility 67 48%
Additional child/adult day care 57 41%
Mental health counselor 50 36%
Exercise/nutrition programs 45 32%
Substance abuse counselor 40 29%
Health education programs 38 27%
After school programs 34 24%
Marriage & family therapist 29 21%
Head Start programs 16 12%
Other 16 12%
Clubs/leagues 14 10%
Psychiatrist 13 9%
Pediatrician 10 7%
Social worker 9 6%
Pastoral counselor 8 6%
Psychologist 8 6%
Psychiatric nurse 5 4%
NATIONAL RURAL HEALTH RESOURCE CENTER 12
SECONDARY DATA ANALYSIS
Introduction
There are two different types of sources used to conduct a community health needs
assessment. The first type is a primary source that is the initial material that is
collected during the research process. Primary data is the data that The Center
collects using methods such as surveys, direct observations, interviews, as well as
objective data sources. Primary data is a reliable method to collect data as The
Center knows the source, how it was collected and analyzed. Secondary data is
from “outside” sources. Secondary data analysis is commonly known as second-
hand analysis. It is simply the analysis of preexisting data. Secondary data analysis
utilizes the data that was collected by another entity in order to further a study.
Secondary data analysis is useful for organizational planning to complement
primary data or if there is not time or resources to gather raw data. It has its
drawbacks however, as data from the different agencies is collected during different
timeframes. This can make direct comparisons of secondary data difficult. Please
note, that the data collected for this report is the most current information as of
December 2015.
Sources used for the collection of secondary data are primarily from government
agencies, including the United States Census Bureau, the Bureau of Labor
Statistics, County Health Rankings, Behavioral Health Risk Factors Surveillance
System, Centers for Medicaid and Medicare Services and Health Resources and
Services Administration.
NATIONAL RURAL HEALTH RESOURCE CENTER 13
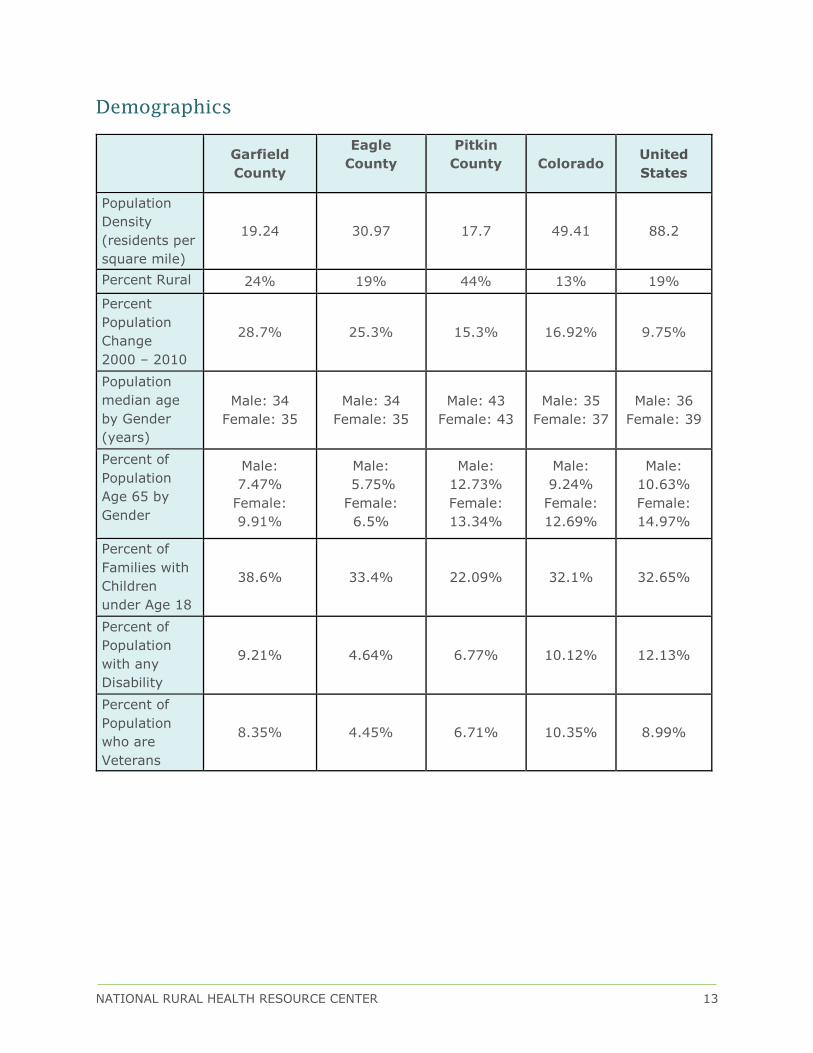
Demographics
Garfield
County
Eagle
County
Pitkin
County
Colorado United
States
Population
Density
(residents per
square mile)
19.24 30.97 17.7 49.41 88.2
Percent Rural 24% 19% 44% 13% 19%
Percent
Population
Change
2000 – 2010
28.7% 25.3% 15.3% 16.92% 9.75%
Population
median age
by Gender
(years)
Male: 34
Female: 35
Male: 34
Female: 35
Male: 43
Female: 43
Male: 35
Female: 37
Male: 36
Female: 39
Percent of
Population
Age 65 by
Gender
Male:
7.47%
Female:
9.91%
Male:
5.75%
Female:
6.5%
Male:
12.73%
Female:
13.34%
Male:
9.24%
Female:
12.69%
Male:
10.63%
Female:
14.97%
Percent of
Families with
Children
under Age 18
38.6% 33.4% 22.09% 32.1% 32.65%
Percent of
Population
with any
Disability
9.21% 4.64% 6.77% 10.12% 12.13%
Percent of
Population
who are
Veterans
8.35% 4.45% 6.71% 10.35% 8.99%

NATIONAL RURAL HEALTH RESOURCE CENTER 14
Social and Economic Factors
Garfield
County Eagle County
Pitkin
County Colorado
United
States
Percent of
Population with
High School
Degrees
72% 76% 94% 76% 82%
Percent of
Population with
Associate’s Degree
or Higher
34% 53% 65% 45% 36%
Per Capita Income $26,602 $39,496 $51,814 $31,109 $28,154
Percent of
Households with
Public Assistance
Income
1.4% .82% .97% 2.16% 2.82%
Unemployment
Rates 4.5% 4.2% 6.2% 4.1% 5.6%
Percent of
Population under
Age 18 in Poverty
14.86% 13.93% 12.69% 17.48% 21.58%
Percent Population
without Medical
insurance
27.32% 25.48% 19.3% 18.81% 20.44%
Percent of
Population Living
with Low Food
Access
3.41% 5.12% 1.36% 6.39% 6.27%
Percent of
Population with
Food Insecurity
12% 11% 13% 14% 15%
Percent of
Households with
No Motor Vehicle
4.29% 1.78% 4.26% 5.72% 9.07%
NATIONAL RURAL HEALTH RESOURCE CENTER 15
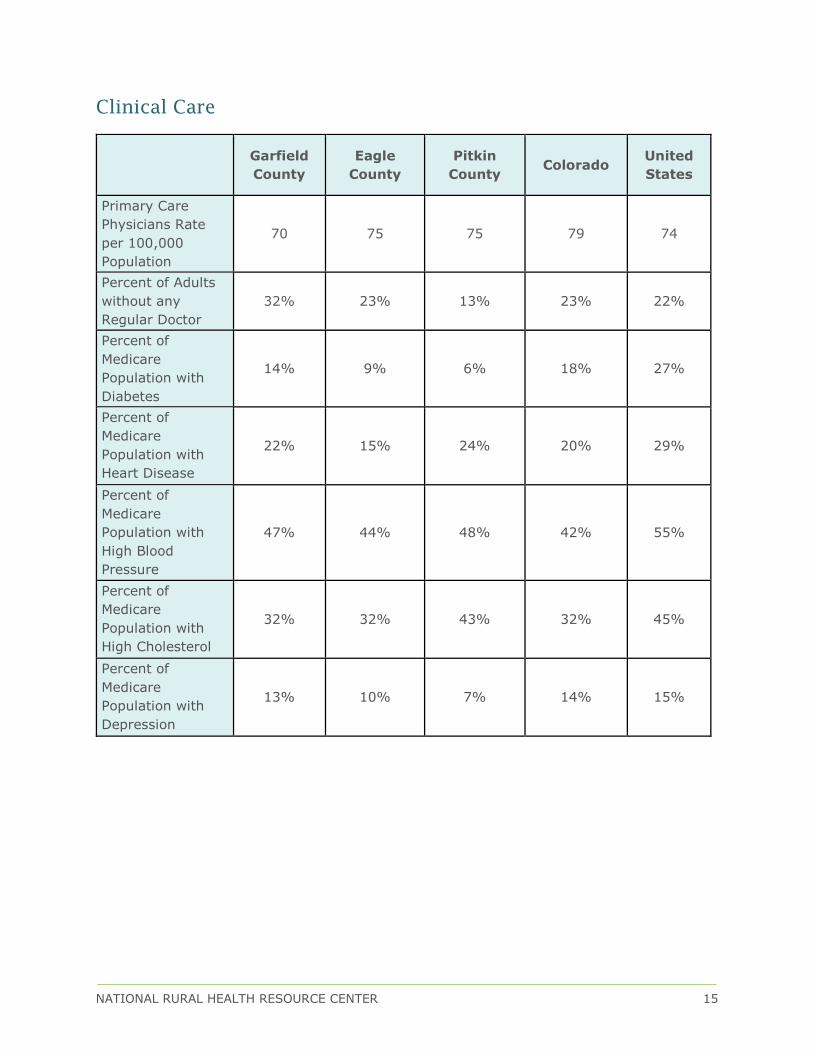
Clinical Care
Garfield
County
Eagle
County
Pitkin
County Colorado
United
States
Primary Care
Physicians Rate
per 100,000
Population
70 75 75 79 74
Percent of Adults
without any
Regular Doctor
32% 23% 13% 23% 22%
Percent of
Medicare
Population with
Diabetes
14% 9% 6% 18% 27%
Percent of
Medicare
Population with
Heart Disease
22% 15% 24% 20% 29%
Percent of
Medicare
Population with
High Blood
Pressure
47% 44% 48% 42% 55%
Percent of
Medicare
Population with
High Cholesterol
32% 32% 43% 32% 45%
Percent of
Medicare
Population with
Depression
13% 10% 7% 14% 15%
NATIONAL RURAL HEALTH RESOURCE CENTER 16
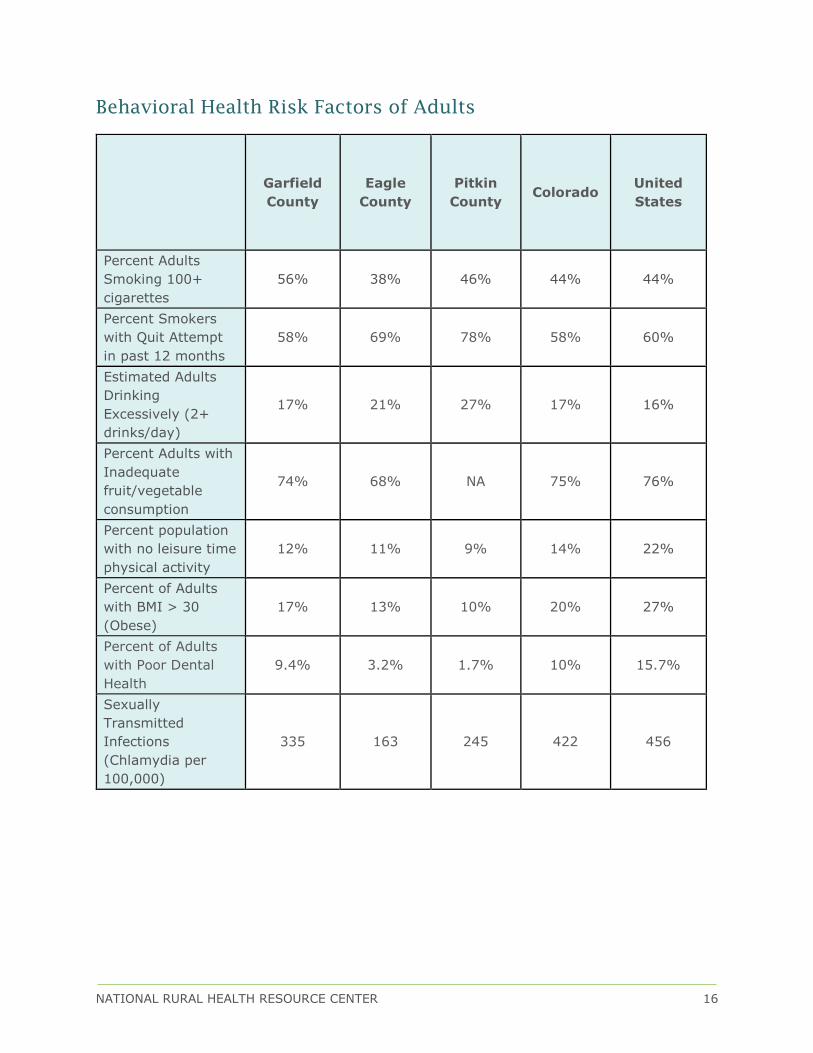
Behavioral Health Risk Factors of Adults
Garfield
County
Eagle
County
Pitkin
County Colorado
United
States
Percent Adults
Smoking 100+
cigarettes
56% 38% 46% 44% 44%
Percent Smokers
with Quit Attempt
in past 12 months
58% 69% 78% 58% 60%
Estimated Adults
Drinking
Excessively (2+
drinks/day)
17% 21% 27% 17% 16%
Percent Adults with
Inadequate
fruit/vegetable
consumption
74% 68% NA 75% 76%
Percent population
with no leisure time
physical activity
12% 11% 9% 14% 22%
Percent of Adults
with BMI > 30
(Obese)
17% 13% 10% 20% 27%
Percent of Adults
with Poor Dental
Health
9.4% 3.2% 1.7% 10% 15.7%
Sexually
Transmitted
Infections
(Chlamydia per
100,000)
335 163 245 422 456
NATIONAL RURAL HEALTH RESOURCE CENTER 17
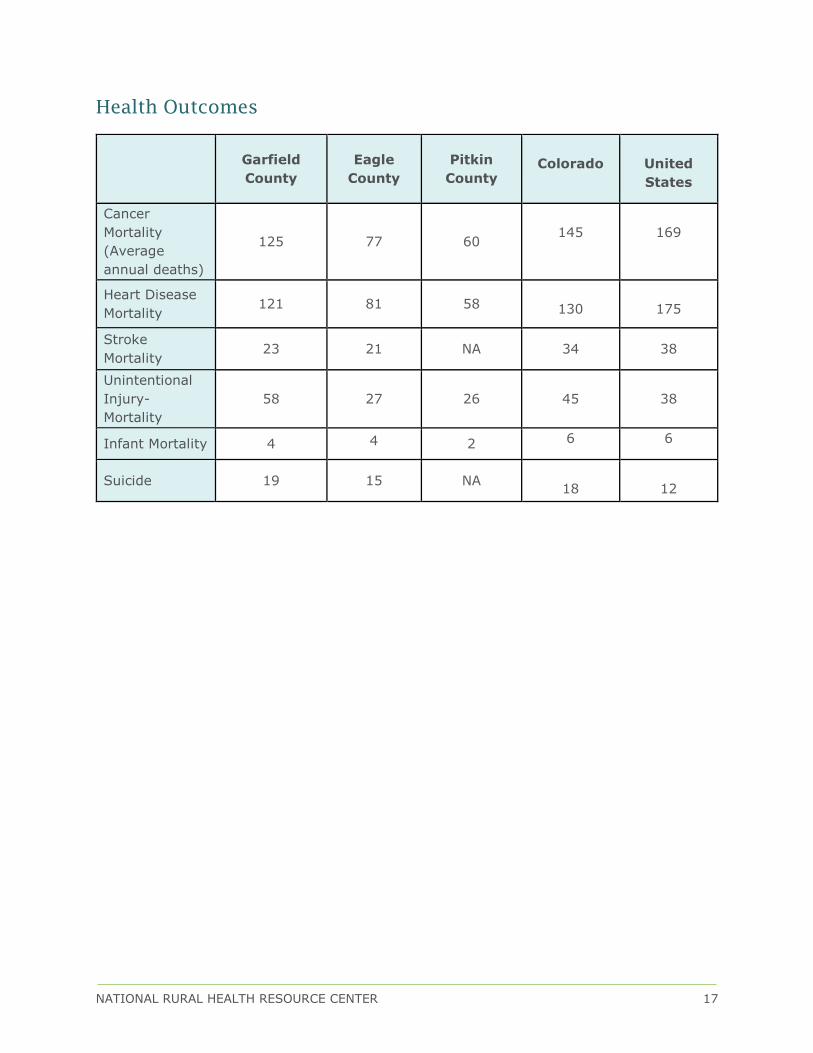
Health Outcomes
Garfield
County
Eagle
County
Pitkin
County
Colorado
United
States
Cancer
Mortality
(Average
annual deaths)
125 77 60
145
169
Heart Disease
Mortality 121 81 58
130
175
Stroke
Mortality 23 21 NA 34 38
Unintentional
Injury-
Mortality
58 27 26
45
38
Infant Mortality 4 4 2 6 6
Suicide 19 15 NA
18
12
NATIONAL RURAL HEALTH RESOURCE CENTER 18
CONCLUSIONS, RECOMMENDATIONS, AND
ACKNOWLEDGEMENTS
Conclusions
The perception of personal and community health rated as “healthy” are above
national averages. These perceptions are validated in other questions by
respondents choosing the field selection, “healthy behaviors and lifestyle” as one of
the top criteria needed for a healthy community and rating obesity and diabetes as
lower concerns than national averages. Secondary data sources confirm the
accuracy of this perception as the percentage of adults with obesity is ten percent
lower than the United States. However, Garfield County has a higher percentage of
obesity than surrounding counties. Alcohol/substance abuse was rated as the top
community health concern. The concern of mental health issues are thirty percent
higher than national averages which is validated by secondary data sources
indicating that Garfield County has a higher rate of suicide compared to state and
national statistics. Respondents recognized the valuable role a mental health
counselor could serve in the community. Additional senior services (senior
retirement housing, assisted living and additional adult day care) were requested
services. Respondents also recognize the value of access to healthcare and other
services in the community.
Recommendations
Noting the changes in health care reimbursement structures, hospitals will begin to
be reimbursed based on the population’s health outcomes. This transformation is
changing the definition of hospital volume from the number of procedures and
interventions to the number of patients being seen in the service area. Capture a
greater market share by expanding efforts towards individuals that are currently
healthy and not currently utilizing local health services by engaging the community
in prevention/wellness activities and health education.
It is also recommended the hospital increase efforts on role modeling wellness and
expanding collaborative community partnerships to improve the overall
coordination of care for patients. Reference the section below on “Improving
Population Health in Your Community”, as cited below.
There is also an opportunity to improve customer processes and perception of
quality care by implementing management frameworks such as Baldrige, the
Balanced Scorecard, Lean and/or Studer methodologies. These frameworks
evaluate and monitor the effectiveness and efficiencies of staff processes, manage
ongoing performance improvement, and help create a positive work culture that

NATIONAL RURAL HEALTH RESOURCE CENTER 19
can result in greater staff and patient satisfaction. Please contact The Center for
more information and guidance on these services or go to www.ruralcenter.org for
further details.
Share results and communicate proposed strategies that address community needs
as this will promote customer loyalty. It is advised to create a communications
strategy for releasing the report findings. It is important to be clear on the intent of
these communications (e.g., to share information or to stimulate action).
Acknowledgements
The Center would like to thank Ms. Bonnie Wasli, Ms. Patricia Faler and Ms. Lisa
Wilson for their contributions and work with developing and distributing the
assessment.
NATIONAL RURAL HEALTH RESOURCE CENTER 20
ESTABLISHING HEALTH PRIORITIES
Sufficient resources frequently are not available to address all the health concerns
identified in a Community Health Needs Assessment. Identify issues to work on in
the short to intermediate term (one to three years). Priorities should reflect the
values and criteria agreed upon by the hospital board and community stakeholders,
which should include public health.
Criteria that can be used to identify the most significant health priorities
include:
The magnitude of the health concern
(the number of people or the percentage of population impacted)
The severity of the problem
(the degree to which health status is worse than the state or national norm)
A high need among vulnerable populations
Criteria that can be used to evaluate which health issues should be
prioritized include:
The community’s capacity to act on the issue, including any economic, social,
cultural, or political considerations
The likelihood or feasibility of having a measurable impact on the issue
Community resources (programs, funding) already focused on an issue
(to reduce duplication of effort and to maximize effectiveness of limited
resources)
Whether the issue is a root cause of other problems
(thereby possibly affecting multiple issues)
Consider a comprehensive intervention plan that includes multiple strategies
(educational, policy, environmental, programmatic); uses various settings for the
implementation (hospital, schools, worksites); targets the community at large as
well as subgroups; and addresses factors that contribute to the health priority. Be
sure to document and monitor results over the next one to three years to assure
that community needs identified within the assessment are being addressed.
Maintain records of assessment processes and priorities for obtaining base line
information and for pursuing ongoing process improvements. (Adapted from
materials by the Association for Community Health Improvement)
Once priorities have been established, set aside time to
develop, implement and monitor an action plan
that assesses progress

NATIONAL RURAL HEALTH RESOURCE CENTER 21
IMPROVING POPULATION HEALTH IN YOUR COMMUNITY
The U.S. health care industry is undergoing profound change in financing and
service delivery, as it shifts from a financial system that rewards “volume” to one
that is based on “value”. Driven by the health marketplace itself, the new health
industry goals are articulated in the Institute for Health Improvement’s Triple Aim:
better population health, better health quality and lower health costs. Payers are
increasingly factoring in population health outcomes into reimbursement formulas.
Population Health Portal
Navigate the journey towards improved population health by accessing a Critical
Access Hospital Readiness Assessment, resources and educational modules that
offer step-by-step instructions of common population health analytical procedures.
Small Rural Hospital Transition Guides and Toolkit
Informational guides developed by field experts and a toolkit developed by Rural
Health Innovations that concentrates on best practices and strategies to support
small rural hospital performance improvement and preparation for transitioning to
value-based care and purchasing.
Critical Population Health Success Factors
The following section summarizes the 2014 “Improving Population Health: A Guide
for Critical Access Hospitals”, created by The Center and Stratis Health
Leadership
Develop awareness and provide education on the critical role of population
health in value-based reimbursement
Shift hospital culture, processes, facilities and business models to include a
focus on population health
Lead the way and model behaviors. Participate in programs, be active in
community outreach
Strategic Planning
Incorporate population health approaches as part of ongoing strategic
planning processes
“If you don’t help your community to thrive and grow
–How will your organization thrive and grow?”
NATIONAL RURAL HEALTH RESOURCE CENTER 22
Engage multiple stakeholders and partners to coordinate strategies aimed
at improving the population's health
Prioritize – what are the one or two things that would make the biggest
difference for the population you serve
Engagement
• Use the community health needs assessment (CHNA) process as an
opportunity for community and patient engagement
• Articulate vision of hospital contributing to population health based on
community conversations
• Engage all types of health care and social service providers to coordinate
transitions of care and address underlying needs
Leadership
• Develop awareness and provide education on the critical role of population
health in value-based reimbursement
• Shift hospital culture, processes, facilities and business models to include a
focus on population health
• Lead the way and model behaviors. Participate in programs, be active in
community outreach
Workforce
• Establish wellness programs for employees and role model these programs
in the community
• Develop a workforce culture that is adaptable to change in redesigning
care to address population health
• Embed a community focused mind-set across the organization so
engagement, coordination and cooperation are expectations of staff
interaction
Operations and Efficiency
• Maximize the efficiency of operational, clinical, and business processes
under current payment structures
• Utilize health information technology (HIT) (such as electronic medical
records, health information exchange and telemedicine) to support
population health goals
Measurement, Feedback & Knowledge Management, Impact & Outcomes
• Identify measurable goals that reflect community needs
• Utilize data to monitor progress towards strategic goals on population
health

NATIONAL RURAL HEALTH RESOURCE CENTER 23
• Publicly share goals, data and outcomes. Use it as an opportunity to
engage partners and the community
Population Health Critical Access Hospital Case Studies
Leadership
Clearwater Valley Hospital in Idaho is utilizing a dyad management model which is
a two-pronged approach to physician/hospital integration. This model places the
organization’s leadership under the management of qualified physician and non-
physician teams aimed to incorporate the concept of value into health care
decision-making where departments have been restructured to meet patient needs
in both the inpatient and outpatient settings. This facility has received multiple
awards for incorporating this management model. For more information:
http://healthandwelfare.idaho.gov/Portals/0/Health/Rural%20Health/Orofino%20Ca
se%20Study%20November%202011.pdf
Strategic Planning
Essentia Health Fosston in Minnesota incorporated community health needs
assessment findings to improve the health of the community toward retaining a
quality and viable agricultural industry. For more information:
http://www.ruralcenter.org/tasc/resources/applying-community-health-
assessments-rural-hospital-strategy
Partners, Patients, Community
The Community Connector Program was established by Tri County Rural Health
Network in Helena, Arkansas which aims to increase access to home and
community-based services by creating alternatives to institutionalized living and
improving the quality of life for elderly and adults with physical disabilities while
maintaining or decreasing costs. The return on investment was $3 of every $1
invested, or a 23.8 percent average reduction in annual Medicaid spending per
participant, for a total reduction in spending of $2.619 million over three years. For
more information:
http://cph.uiowa.edu/ruralhealthvalue/innovations/Profiles/CommunityConnectors.p
df
Workforce and Culture
Mason District Hospital in Illinois is implementing a three tiered approach to a
worksite wellness program which includes a care coordination plan for employees
with multiple chronic illnesses. After two years, the hospital has seen nearly
$360,000 in reduced employee health care costs and has started offering the
program to local businesses which both improves health locally and provides an
NATIONAL RURAL HEALTH RESOURCE CENTER 24
additional revenue stream for the program. For more information:
http://www.icahn.org/files/White_Papers/ICAHN_PopHealthManagement_Print_FIN
AL.pdf (page 19)
Operations and Efficiency
Mercy Health Network in Iowa has adopted a Process Excellence tool modeled after
Lean to improve operations, efficiency and patient safety. Each hospital in the
network was assigned accountabilities, selected process improvements and helped
educate the hospital board. After 18 months, process improvements results in a 51
percent decrease in patient falls and a 37 percent decrease in medical errors. For
more information:
http://cph.uiowa.edu/ruralhealthvalue/innovations/Profiles/MercyHealthNetwork.pdf
Measurement, Feedback, & Knowledge Management, Impact & Outcomes
Marcum & Wallace Memorial Hospital in Hazard, Kentucky has adopted the
Performance Excellence Blueprint as indicators for their system (Catholic Health
Partnership) strategies. Leadership developed a dashboard to track program
towards targets in each of the seven Performance Excellence Components. For
more information:
https://ruralcenter.org/tasc/resources/marcum-wallace-memorial-hospital-
performance-excellence

NATIONAL RURAL HEALTH RESOURCE CENTER 25
APPENDIX A
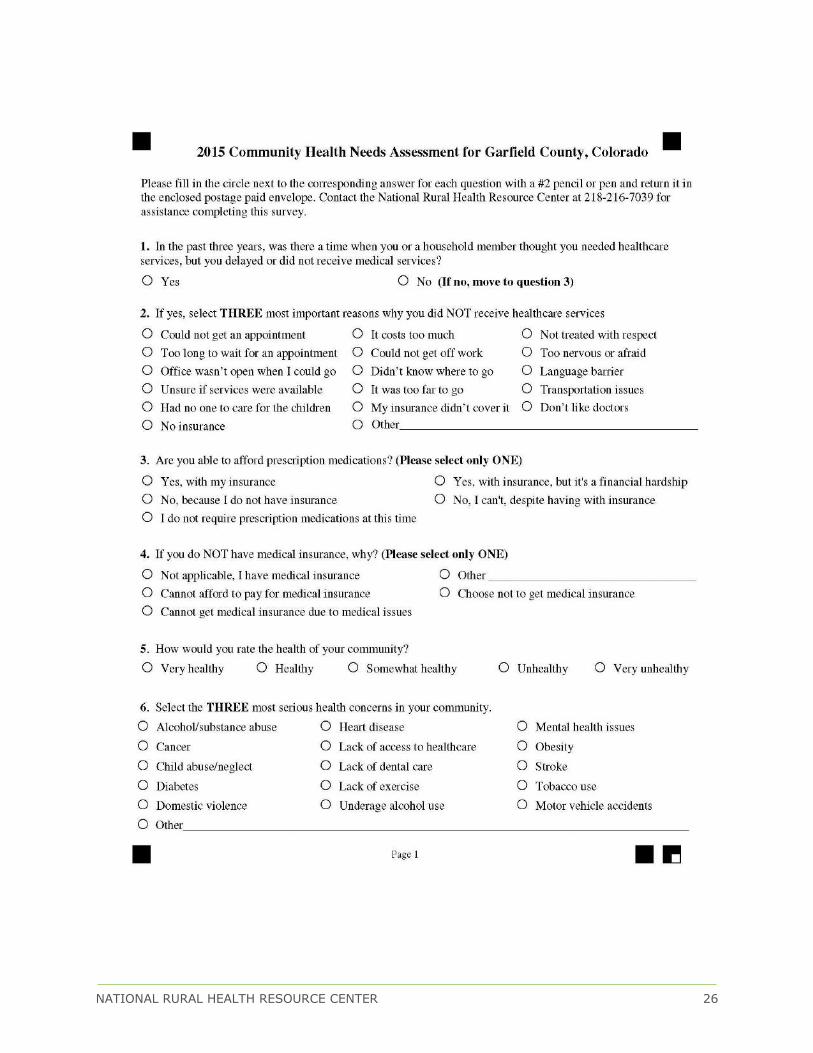
NATIONAL RURAL HEALTH RESOURCE CENTER 26
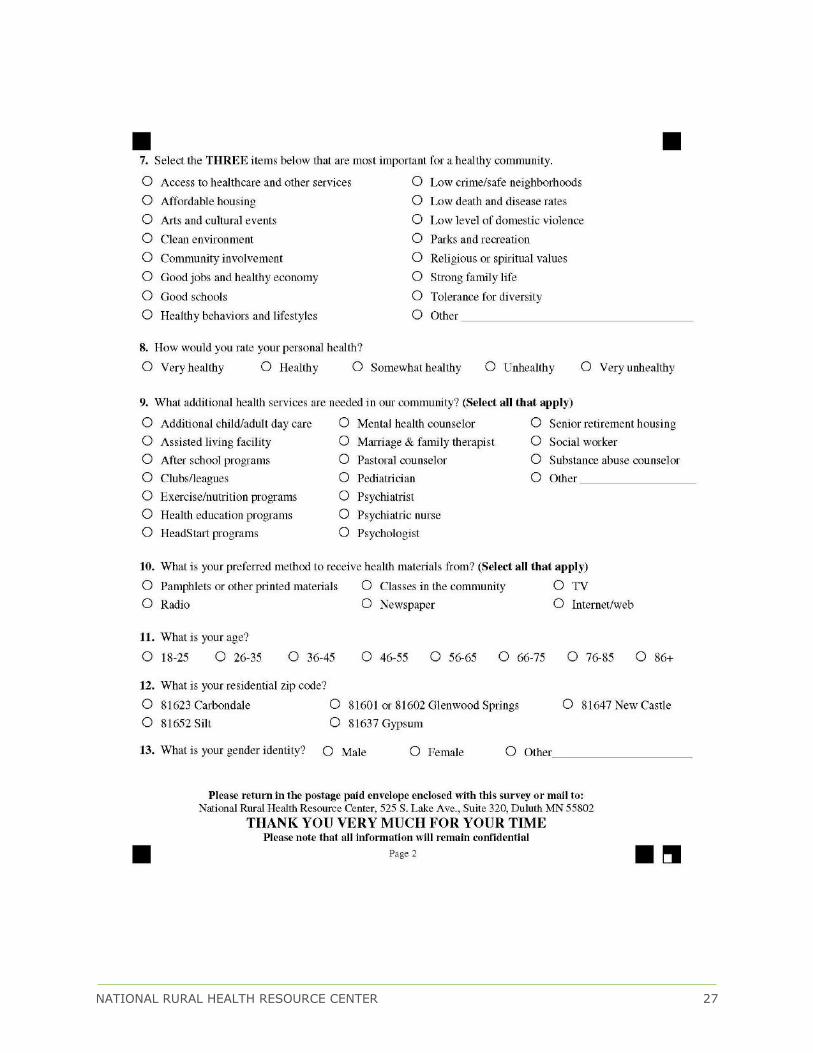
NATIONAL RURAL HEALTH RESOURCE CENTER 27
NATIONAL RURAL HEALTH RESOURCE CENTER 28
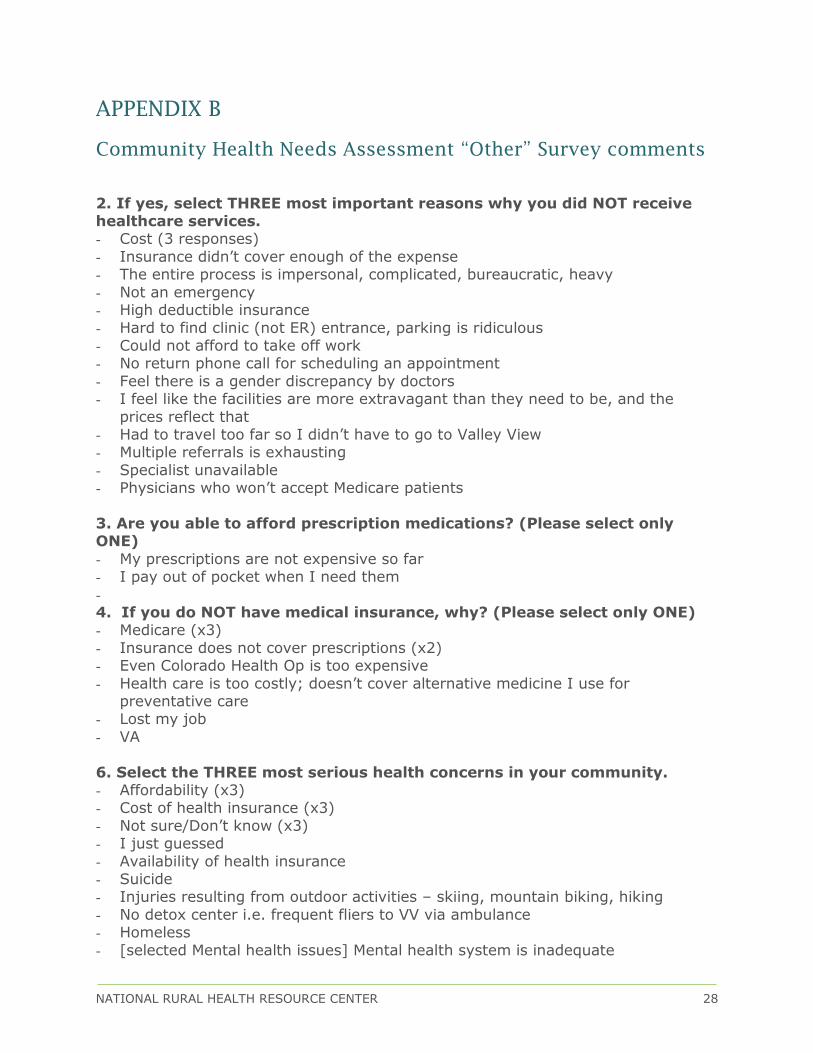
APPENDIX B
Community Health Needs Assessment “Other” Survey comments
2. If yes, select THREE most important reasons why you did NOT receive healthcare services. - Cost (3 responses)
- Insurance didn’t cover enough of the expense - The entire process is impersonal, complicated, bureaucratic, heavy
- Not an emergency - High deductible insurance
- Hard to find clinic (not ER) entrance, parking is ridiculous - Could not afford to take off work - No return phone call for scheduling an appointment
- Feel there is a gender discrepancy by doctors - I feel like the facilities are more extravagant than they need to be, and the
prices reflect that - Had to travel too far so I didn’t have to go to Valley View - Multiple referrals is exhausting
- Specialist unavailable - Physicians who won’t accept Medicare patients
3. Are you able to afford prescription medications? (Please select only ONE)
- My prescriptions are not expensive so far - I pay out of pocket when I need them
- 4. If you do NOT have medical insurance, why? (Please select only ONE) - Medicare (x3)
- Insurance does not cover prescriptions (x2) - Even Colorado Health Op is too expensive
- Health care is too costly; doesn’t cover alternative medicine I use for preventative care
- Lost my job
- VA
6. Select the THREE most serious health concerns in your community. - Affordability (x3) - Cost of health insurance (x3)
- Not sure/Don’t know (x3) - I just guessed
- Availability of health insurance - Suicide - Injuries resulting from outdoor activities – skiing, mountain biking, hiking
- No detox center i.e. frequent fliers to VV via ambulance - Homeless
- [selected Mental health issues] Mental health system is inadequate

NATIONAL RURAL HEALTH RESOURCE CENTER 29
- Stress of the working class - Poverty
- Lack of Medicare & Medicaid caregivers - Nutrition
- Family planning/birth control
7. Select the THREE items below that are most important for a healthy
community. - All of the above (x2)
- Vibrant hope - Facilities for our elders and hospice/end-of-life care - Adequate mental health services
9. What additional health services are needed in our community? (Select
all that apply) - Don’t know (x3) - Affordable mental health options (x2)
- Homeless services (x2) - [selected Senior retirement housing] Currently inadequate, 3-5 year wait
- Single payer coverage - Alternative school choices other than public school
- More diverse doctors who are affordable - Arthritis clinic - Neurology
- Detox center - Eye care
- General practice/family docs - Low cost hospital options - Better funding for liberal arts in children’s education
- Peace not war - Birth control/family planning
Additional comments: - The CEO of Valley View makes $1 million+ and no accountability to the public
NATIONAL RURAL HEALTH RESOURCE CENTER 30
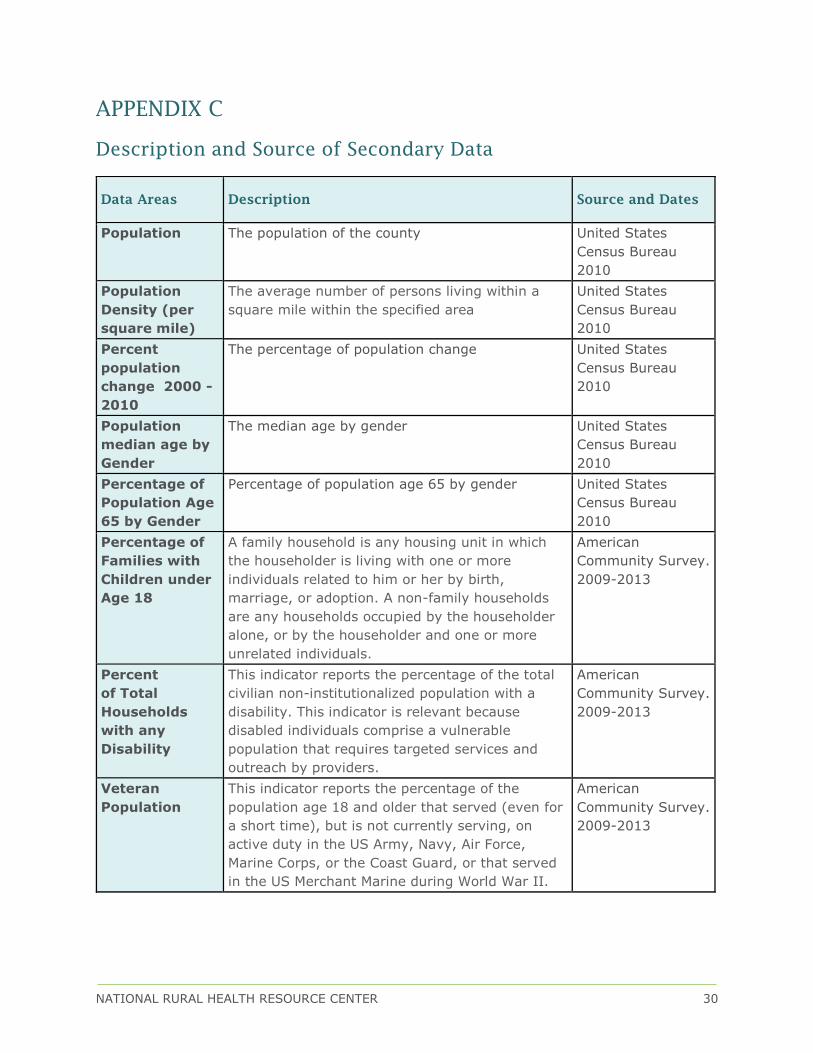
APPENDIX C
Description and Source of Secondary Data
Data Areas Description Source and Dates
Population The population of the county United States
Census Bureau
2010
Population
Density (per
square mile)
The average number of persons living within a
square mile within the specified area
United States
Census Bureau
2010
Percent
population
change 2000 -
2010
The percentage of population change United States
Census Bureau
2010
Population
median age by
Gender
The median age by gender United States
Census Bureau
2010
Percentage of
Population Age
65 by Gender
Percentage of population age 65 by gender United States
Census Bureau
2010
Percentage of
Families with
Children under
Age 18
A family household is any housing unit in which
the householder is living with one or more
individuals related to him or her by birth,
marriage, or adoption. A non-family households
are any households occupied by the householder
alone, or by the householder and one or more
unrelated individuals.
American
Community Survey.
2009-2013
Percent
of Total
Households
with any
Disability
This indicator reports the percentage of the total
civilian non-institutionalized population with a
disability. This indicator is relevant because
disabled individuals comprise a vulnerable
population that requires targeted services and
outreach by providers.
American
Community Survey.
2009-2013
Veteran
Population
This indicator reports the percentage of the
population age 18 and older that served (even for
a short time), but is not currently serving, on
active duty in the US Army, Navy, Air Force,
Marine Corps, or the Coast Guard, or that served
in the US Merchant Marine during World War II.
American
Community Survey.
2009-2013
NATIONAL RURAL HEALTH RESOURCE CENTER 31
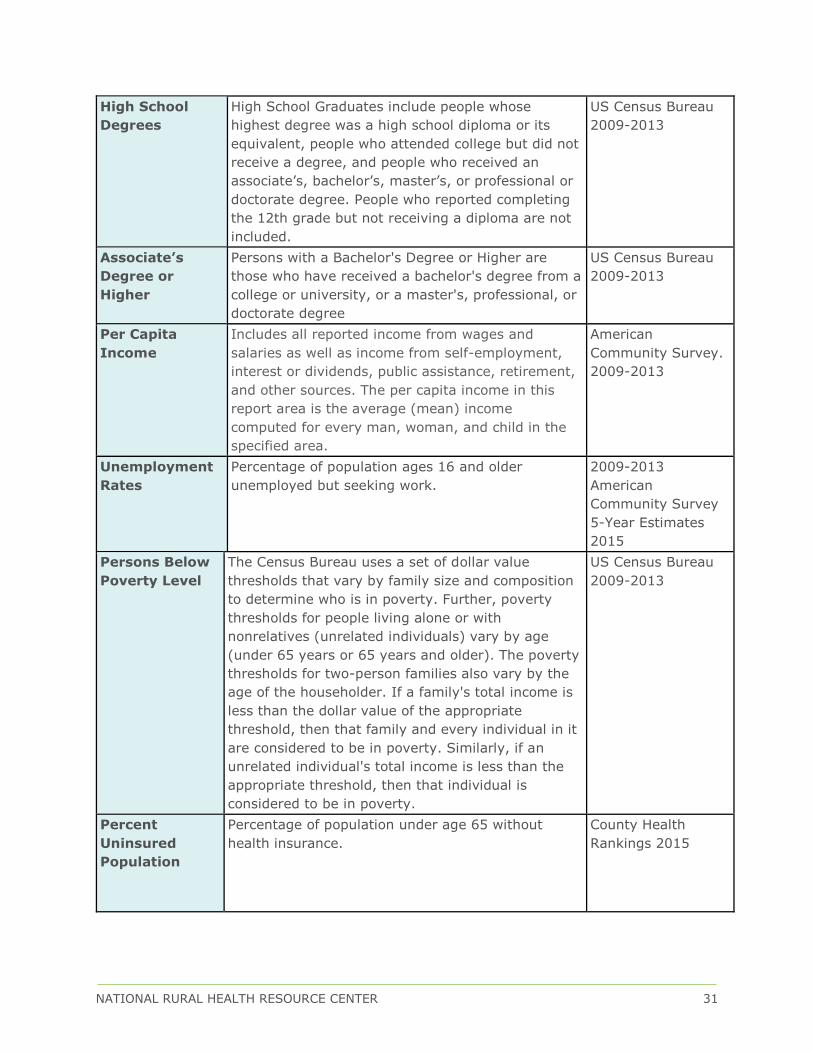
High School
Degrees
High School Graduates include people whose
highest degree was a high school diploma or its
equivalent, people who attended college but did not
receive a degree, and people who received an
associate’s, bachelor’s, master’s, or professional or
doctorate degree. People who reported completing
the 12th grade but not receiving a diploma are not
included.
US Census Bureau
2009-2013
Associate’s
Degree or
Higher
Persons with a Bachelor's Degree or Higher are
those who have received a bachelor's degree from a
college or university, or a master's, professional, or
doctorate degree
US Census Bureau
2009-2013
Per Capita
Income
Includes all reported income from wages and
salaries as well as income from self-employment,
interest or dividends, public assistance, retirement,
and other sources. The per capita income in this
report area is the average (mean) income
computed for every man, woman, and child in the
specified area.
American
Community Survey.
2009-2013
Unemployment
Rates
Percentage of population ages 16 and older
unemployed but seeking work.
2009-2013
American
Community Survey
5-Year Estimates
2015
Persons Below
Poverty Level
The Census Bureau uses a set of dollar value
thresholds that vary by family size and composition
to determine who is in poverty. Further, poverty
thresholds for people living alone or with
nonrelatives (unrelated individuals) vary by age
(under 65 years or 65 years and older). The poverty
thresholds for two-person families also vary by the
age of the householder. If a family's total income is
less than the dollar value of the appropriate
threshold, then that family and every individual in it
are considered to be in poverty. Similarly, if an
unrelated individual's total income is less than the
appropriate threshold, then that individual is
considered to be in poverty.
US Census Bureau
2009-2013
Percent
Uninsured
Population
Percentage of population under age 65 without
health insurance.
County Health
Rankings 2015
NATIONAL RURAL HEALTH RESOURCE CENTER 32
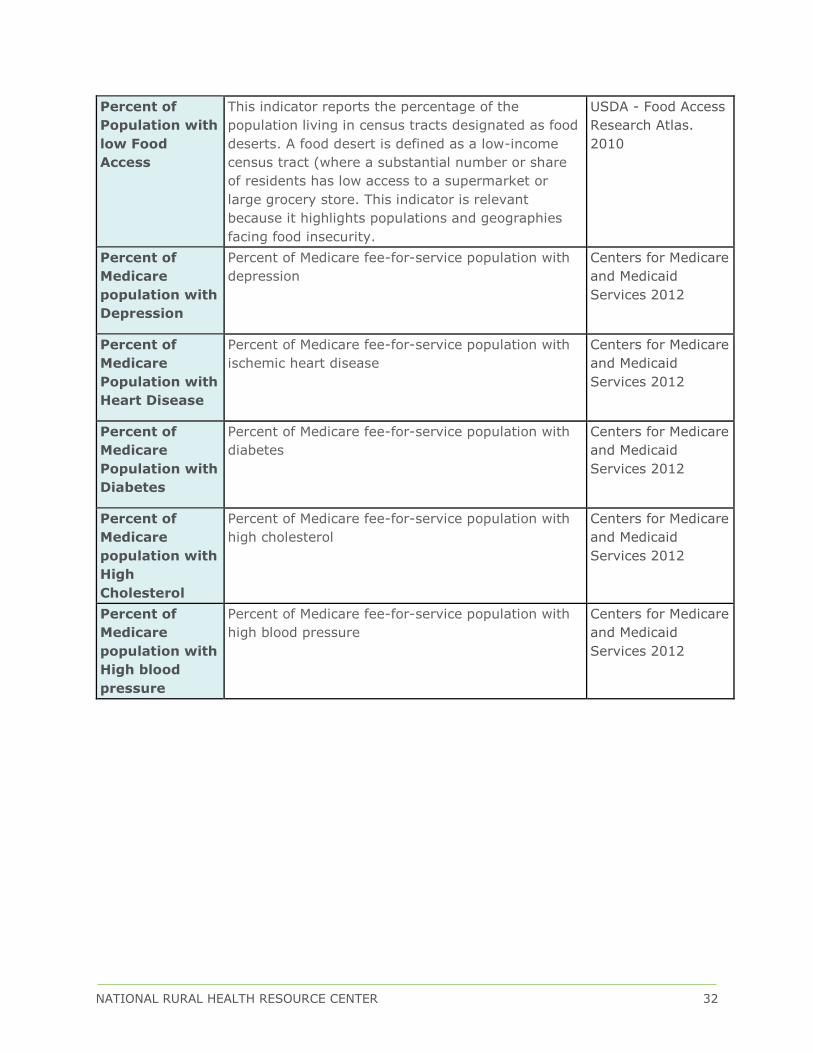
Percent of
Population with
low Food
Access
This indicator reports the percentage of the
population living in census tracts designated as food
deserts. A food desert is defined as a low-income
census tract (where a substantial number or share
of residents has low access to a supermarket or
large grocery store. This indicator is relevant
because it highlights populations and geographies
facing food insecurity.
USDA - Food Access
Research Atlas.
2010
Percent of
Medicare
population with
Depression
Percent of Medicare fee-for-service population with
depression
Centers for Medicare
and Medicaid
Services 2012
Percent of
Medicare
Population with
Heart Disease
Percent of Medicare fee-for-service population with
ischemic heart disease
Centers for Medicare
and Medicaid
Services 2012
Percent of
Medicare
Population with
Diabetes
Percent of Medicare fee-for-service population with
diabetes
Centers for Medicare
and Medicaid
Services 2012
Percent of
Medicare
population with
High
Cholesterol
Percent of Medicare fee-for-service population with
high cholesterol
Centers for Medicare
and Medicaid
Services 2012
Percent of
Medicare
population with
High blood
pressure
Percent of Medicare fee-for-service population with
high blood pressure
Centers for Medicare
and Medicaid
Services 2012

NATIONAL RURAL HEALTH RESOURCE CENTER 33
Percent of
Households
with No Motor
Vehicle
This indicator reports the number and percentage
of households with no motor vehicle based on the
latest 5-year American Community Survey
estimates.
American
Community
Survey. 2009-2013
Primary Care
Physician Rate
per 100,000
Number of primary care physicians per 100,000
population. (MD, DO)
County Health
Rankings 2015
Percent Adults
without any
Regular Doctor
Adults aged 18 and older who self-report they do
not have at least one person who they of as their
personal healthcare provider.
Behavioral Health
Risk Factors
Surveillance
System
Adult Obesity Percentage of adults that report a BMI of 30 or
more.
County Health
Rankings 2015
Percent Adults
Smoking 100+
Cigarettes
Percentage of adults who are former or current
smokers.
County Health
Rankings 2015
Percent
smokers with
Quit attempts
in past 12
months
Percentage of adults 18+ reporting attempts at
quitting smoking within the past year
Behavioral Health
Risk Factors
Surveillance
System 2012
Percent adults
with
inadequate
fruit/vegetable
consumption
Adults 18+ who are consuming less than 5
servings of fruits and vegetables daily
Behavioral Health
Risk Factors
Surveillance
System 2012
Estimated
adults drinking
excessively
Adults 18+ who self-report drinking 2+ drinks
daily
Behavioral Health
Risk Factors
Surveillance
System 2012
Percent of
population
with no leisure
time physical
activity
Adults 20+ who self-report no leisure time
physical activity (such as exercising, golfing,
gardening, walking, etc.)
National Center
for Chronic
Disease
Prevention and
Health Promotion
2012
NATIONAL RURAL HEALTH RESOURCE CENTER 34
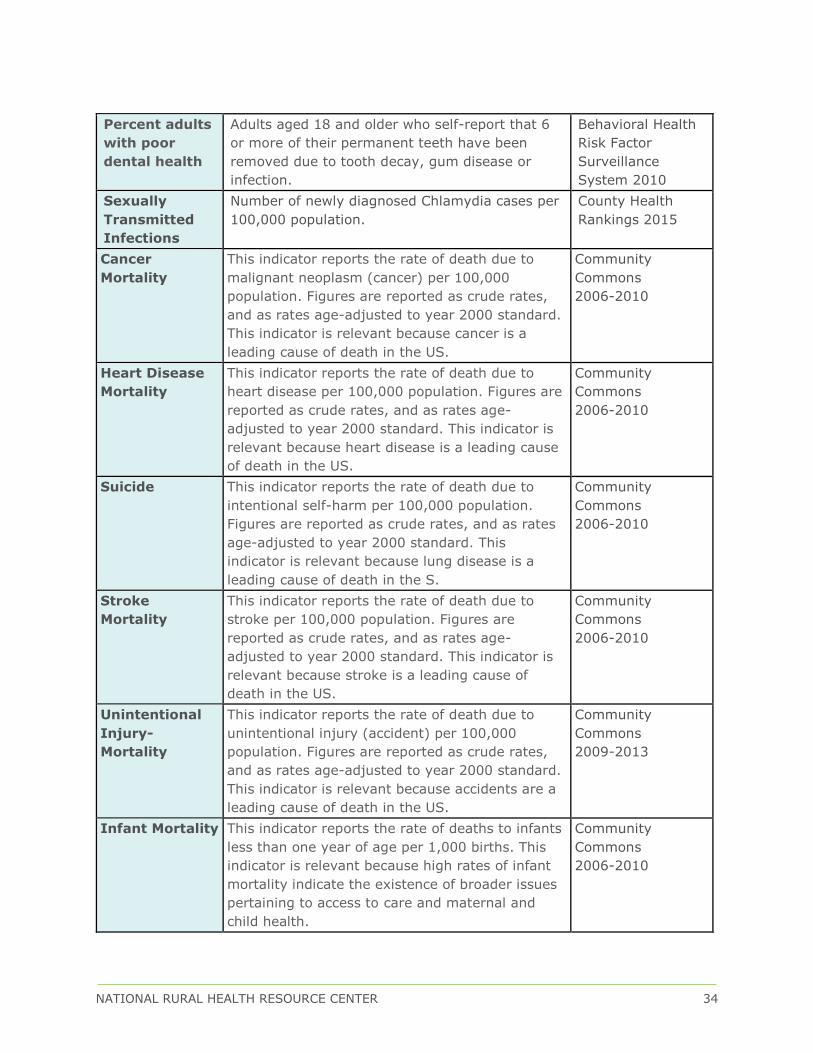
Percent adults
with poor
dental health
Adults aged 18 and older who self-report that 6
or more of their permanent teeth have been
removed due to tooth decay, gum disease or
infection.
Behavioral Health
Risk Factor
Surveillance
System 2010
Sexually
Transmitted
Infections
Number of newly diagnosed Chlamydia cases per
100,000 population.
County Health
Rankings 2015
Cancer
Mortality
This indicator reports the rate of death due to
malignant neoplasm (cancer) per 100,000
population. Figures are reported as crude rates,
and as rates age-adjusted to year 2000 standard.
This indicator is relevant because cancer is a
leading cause of death in the US.
Community
Commons
2006-2010
Heart Disease
Mortality
This indicator reports the rate of death due to
heart disease per 100,000 population. Figures are
reported as crude rates, and as rates age-
adjusted to year 2000 standard. This indicator is
relevant because heart disease is a leading cause
of death in the US.
Community
Commons
2006-2010
Suicide This indicator reports the rate of death due to
intentional self-harm per 100,000 population.
Figures are reported as crude rates, and as rates
age-adjusted to year 2000 standard. This
indicator is relevant because lung disease is a
leading cause of death in the S.
Community
Commons
2006-2010
Stroke
Mortality
This indicator reports the rate of death due to
stroke per 100,000 population. Figures are
reported as crude rates, and as rates age-
adjusted to year 2000 standard. This indicator is
relevant because stroke is a leading cause of
death in the US.
Community
Commons
2006-2010
Unintentional
Injury-
Mortality
This indicator reports the rate of death due to
unintentional injury (accident) per 100,000
population. Figures are reported as crude rates,
and as rates age-adjusted to year 2000 standard.
This indicator is relevant because accidents are a
leading cause of death in the US.
Community
Commons
2009-2013
Infant Mortality This indicator reports the rate of deaths to infants
less than one year of age per 1,000 births. This
indicator is relevant because high rates of infant
mortality indicate the existence of broader issues
pertaining to access to care and maternal and
child health.
Community
Commons
2006-2010