Embed Size (px)
Citation preview
1
Stock Data
Sector Pharmaceuticals
Face Value (Rs.) 1.00
52 wk. High/Low (Rs.) 389.75/230.00
Volume (2 wk. Avg.) 61000
BSE Code 532296
Market Cap (Rs.mn.) 96147.74
Financials (Rs. in mn.) FY10
FY11E FY12E
Net Sales 25120.80 29140.13 32636.94
EBIDTA 6685.29 8539.80 9527.73
PAT 3310.32 5075.42 5831.39
EPS 12.27 18.80 21.59
P/E 29.02 18.94 16.49
Glenmark Pharmaceuticals Ltd
BUY
F
I
R
S
T
C
A
L
L
R
E
S
E
A
R
C
H
SYNOPSIS
Glenmark Pharmaceuticals Limited, together with its subsidiaries, engages in the manufacture and marketing of pharmaceutical formulations and active pharmaceutical ingredients in India and internationally.
The company has a significant presence in branded generics markets across emerging economies including India. Its subsidiary, Glenmark Generics Limited has a fast growing and robust US generics business.
The company’s net sales and net profit are expected to grow at a CAGR of 15% and 44% over FY09 to FY12E.
It is the most successful Indian company in novel drug discovery research and has earned US$137m.
The company out-licensed GRC 15300 to Sanofi-Aventis with a total deal value of US$325m. Glenmark received US$20m as upfront payment.
1 Year Comparative Graph
Glenmark Pharma BSE SENSEX
V.S.R. Sastry
Equity Research Desk
Dr. V.V.L.N. Sastry Ph.D.
Chief Research Officer
C.M.P: Target Price: Rs.356.05 Rs.400.00
Share Holding Pattern
January 07th, 2011
2
Table of Content
Content Page No.
1. Peer Group Comparison 03
2. Investment Highlights 03
3. Company profile 06
4. Financials 07
5. Charts & Graph 09
6. Outlook and Conclusion 11
7. Industry Overview 12
3
Peer Group Comparison
Name of the company CMP(Rs.) Market
Cap.(Rs.Mn.) EPS(Rs.) P/E(x) P/Bv(x) Dividend (%)
Glenmark Pharma 356.05 96147.74 12.27 29.02 4.08 40.00
Cipla 356.85 286522.50 13.51 26.41 4.85 100.00
Cadila Healthcare 771.70 158004.40 31.09 24.82 12.82 100.00
Ajanta Pharma 211.25 2473.40 26.69 7.12 1.41 35.00 *As on 07/01/2011
Investment Highlights
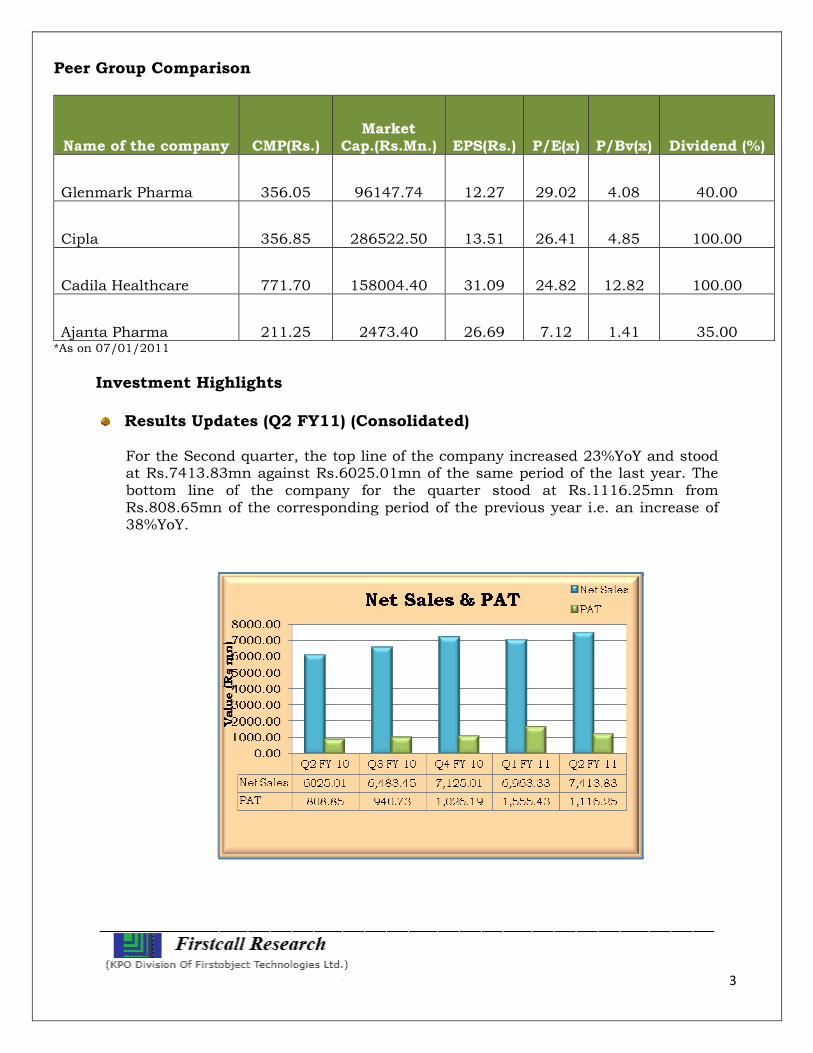
Results Updates (Q2 FY11) (Consolidated)
For the Second quarter, the top line of the company increased 23%YoY and stood at Rs.7413.83mn against Rs.6025.01mn of the same period of the last year. The bottom line of the company for the quarter stood at Rs.1116.25mn from Rs.808.65mn of the corresponding period of the previous year i.e. an increase of 38%YoY.
4
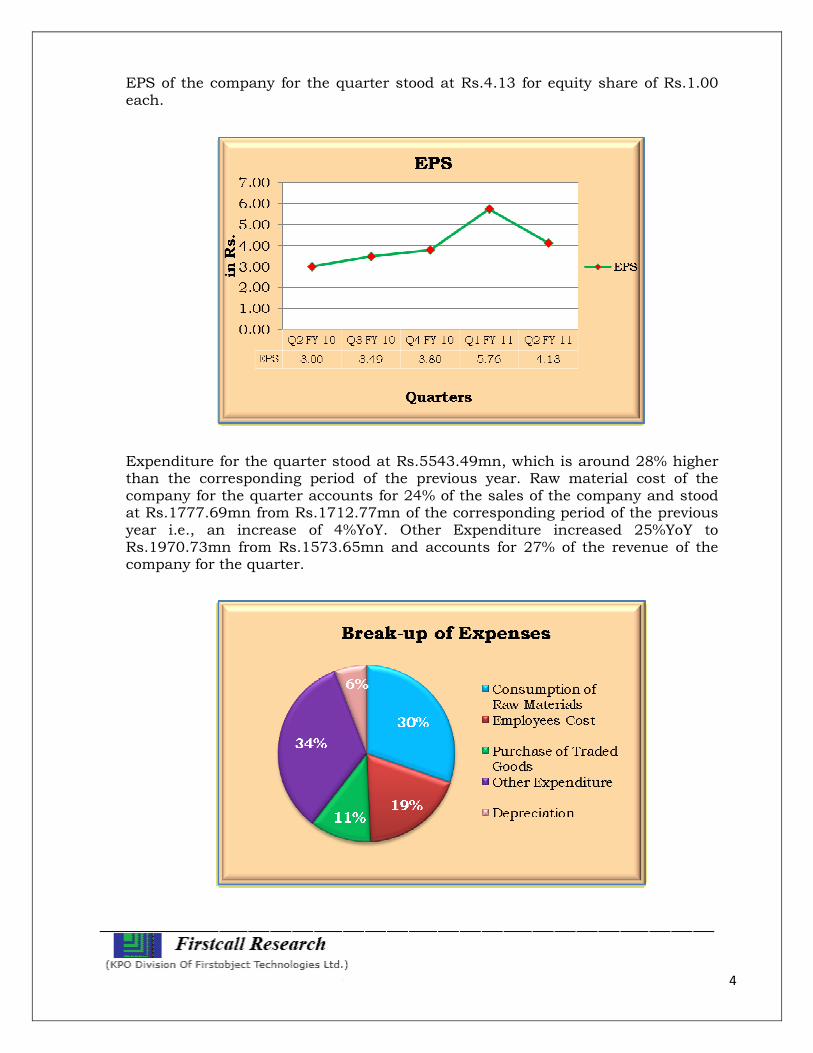
EPS of the company for the quarter stood at Rs.4.13 for equity share of Rs.1.00 each.
Expenditure for the quarter stood at Rs.5543.49mn, which is around 28% higher than the corresponding period of the previous year. Raw material cost of the company for the quarter accounts for 24% of the sales of the company and stood at Rs.1777.69mn from Rs.1712.77mn of the corresponding period of the previous year i.e., an increase of 4%YoY. Other Expenditure increased 25%YoY to Rs.1970.73mn from Rs.1573.65mn and accounts for 27% of the revenue of the company for the quarter.
5
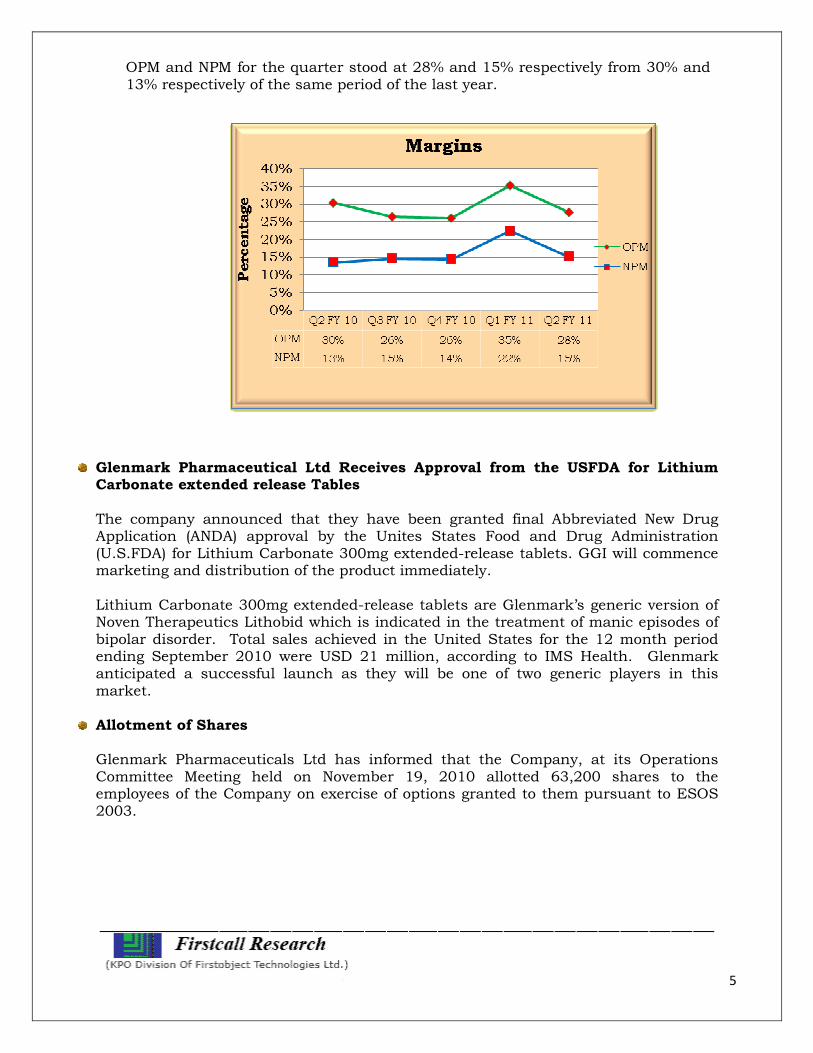
OPM and NPM for the quarter stood at 28% and 15% respectively from 30% and 13% respectively of the same period of the last year.
Glenmark Pharmaceutical Ltd Receives Approval from the USFDA for Lithium Carbonate extended release Tables The company announced that they have been granted final Abbreviated New Drug Application (ANDA) approval by the Unites States Food and Drug Administration (U.S.FDA) for Lithium Carbonate 300mg extended-release tablets. GGI will commence marketing and distribution of the product immediately. Lithium Carbonate 300mg extended-release tablets are Glenmark’s generic version of Noven Therapeutics Lithobid which is indicated in the treatment of manic episodes of bipolar disorder. Total sales achieved in the United States for the 12 month period ending September 2010 were USD 21 million, according to IMS Health. Glenmark anticipated a successful launch as they will be one of two generic players in this market.
Allotment of Shares Glenmark Pharmaceuticals Ltd has informed that the Company, at its Operations Committee Meeting held on November 19, 2010 allotted 63,200 shares to the employees of the Company on exercise of options granted to them pursuant to ESOS 2003.
6
Company Profile Glenmark Pharmaceuticals Limited, together with its subsidiaries, engages in the
manufacture and marketing of pharmaceutical formulations and active
pharmaceutical ingredients in India and internationally. Its formulations include solid,
semi-solid, and liquid orals, as well as external preparations, including powders,
lotions, creams, and capsules. The company’s products include GRC 8200, which
completed Phase II clinical trial for the treatment diabetes; GRC 3886, a Phase II
clinical trial product targeting asthma; GRC 4039 that completed Phase I clinical trial
for the treatment of rheumatoid arthritis, inflammation, and multiple sclerosis; GRC
10693, which completed Phase I clinical trial for the treatment of neuropathic pain,
osteoarthritis, and other inflammatory pain; and GRC 6211, a Phase II clinical trial
targeting osteoarthritis, incontinence, and neuropathic pain.
Its products also comprise GBR 500, a Phase I clinical trial product for the treatment
of multiple sclerosis and inflammatory disorders; GRC 15300, a Phase I clinical trial
product for the treatment of osteoarthritis, neuropathic pain, and skin disorders; GBR
600, a pre clinical trial product for the treatment of acute stroke/coronary syndrome
and thrombosis cardiovascular disorders; GRC 9332, a pre clinical trail product for
the treatment of obesity, dyslipidemia, and metabolic disorders; and Crofelemer, a
Phase III clinical trial product targeting adult acute infectious diarrhoea and HIV-
related diarrhoea. The company has a collaborations or partnerships with Forest
Laboratories, Inc.; Teijin Pharma Limited; Dyax Corp; and Eli Lilly and Company. The
company was founded in 1977 and is headquartered in Mumbai, India
7
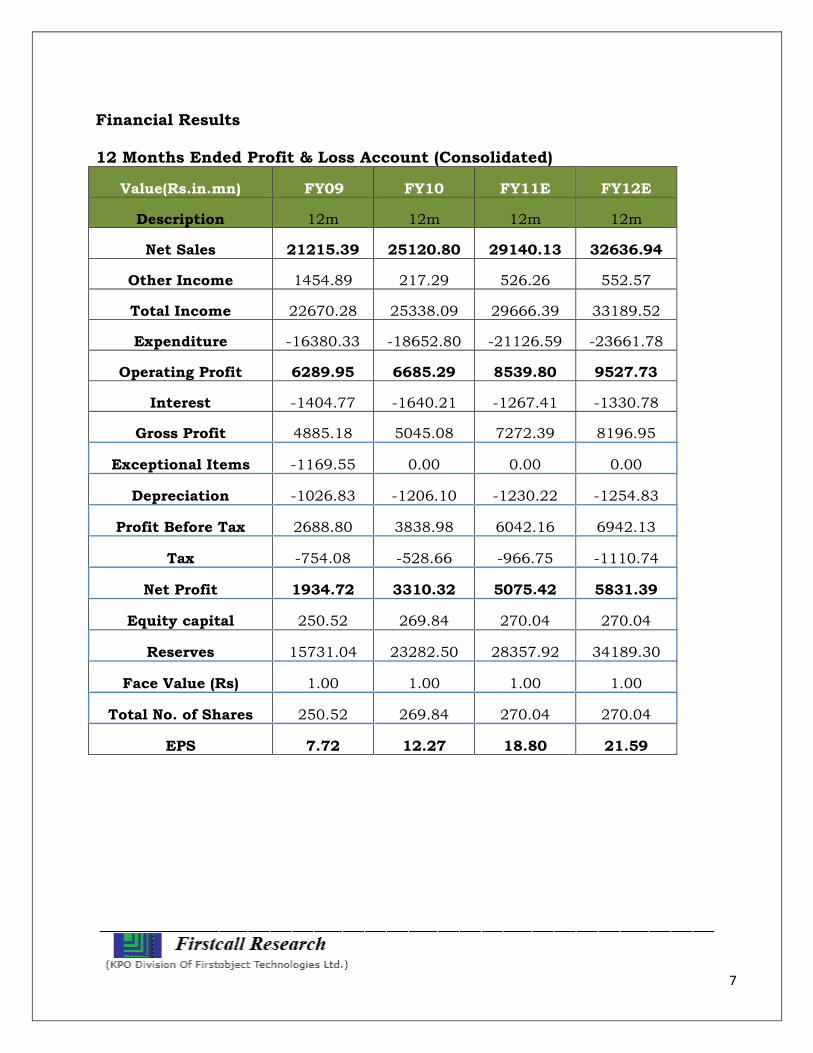
Financial Results 12 Months Ended Profit & Loss Account (Consolidated)
Value(Rs.in.mn) FY09 FY10 FY11E FY12E
Description 12m 12m 12m 12m
Net Sales 21215.39 25120.80 29140.13 32636.94
Other Income 1454.89 217.29 526.26 552.57
Total Income 22670.28 25338.09 29666.39 33189.52
Expenditure -16380.33 -18652.80 -21126.59 -23661.78
Operating Profit 6289.95 6685.29 8539.80 9527.73
Interest -1404.77 -1640.21 -1267.41 -1330.78
Gross Profit 4885.18 5045.08 7272.39 8196.95
Exceptional Items -1169.55 0.00 0.00 0.00
Depreciation -1026.83 -1206.10 -1230.22 -1254.83
Profit Before Tax 2688.80 3838.98 6042.16 6942.13
Tax -754.08 -528.66 -966.75 -1110.74
Net Profit 1934.72 3310.32 5075.42 5831.39
Equity capital 250.52 269.84 270.04 270.04
Reserves 15731.04 23282.50 28357.92 34189.30
Face Value (Rs) 1.00 1.00 1.00 1.00
Total No. of Shares 250.52 269.84 270.04 270.04
EPS 7.72 12.27 18.80 21.59
8
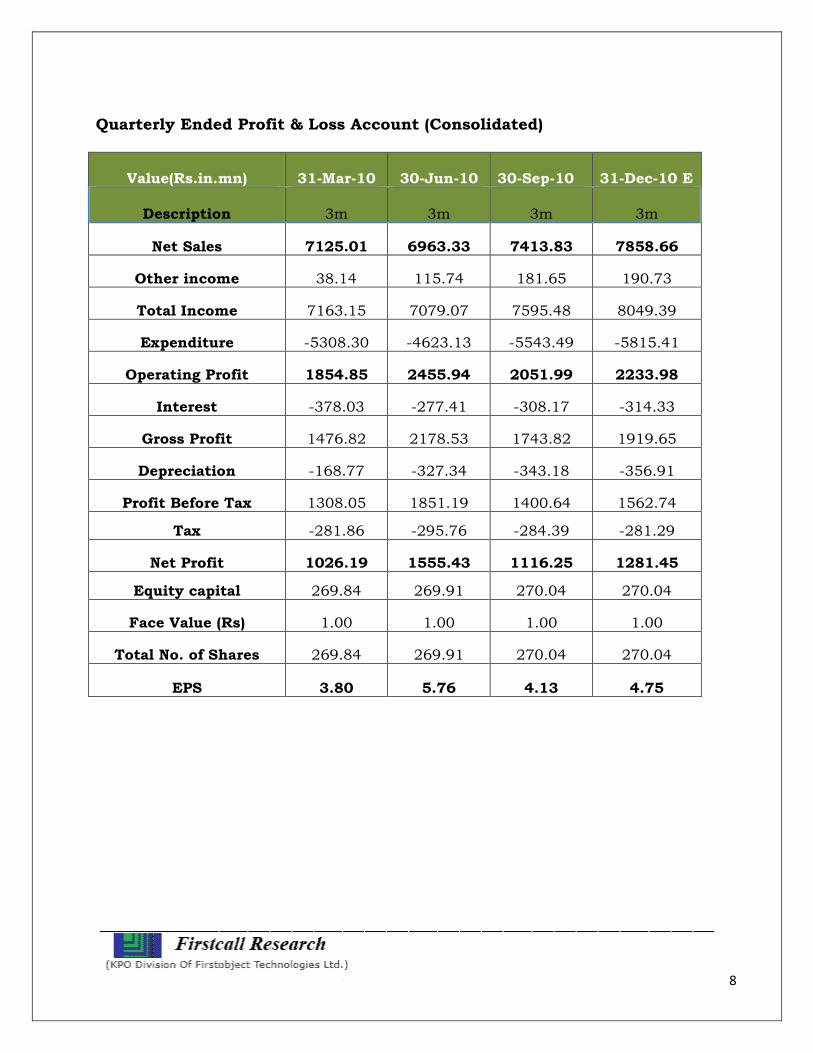
Quarterly Ended Profit & Loss Account (Consolidated)
Value(Rs.in.mn) 31-Mar-10 30-Jun-10 30-Sep-10 31-Dec-10 E
Description 3m 3m 3m 3m
Net Sales 7125.01 6963.33 7413.83 7858.66
Other income 38.14 115.74 181.65 190.73
Total Income 7163.15 7079.07 7595.48 8049.39
Expenditure -5308.30 -4623.13 -5543.49 -5815.41
Operating Profit 1854.85 2455.94 2051.99 2233.98
Interest -378.03 -277.41 -308.17 -314.33
Gross Profit 1476.82 2178.53 1743.82 1919.65
Depreciation -168.77 -327.34 -343.18 -356.91
Profit Before Tax 1308.05 1851.19 1400.64 1562.74
Tax -281.86 -295.76 -284.39 -281.29
Net Profit 1026.19 1555.43 1116.25 1281.45
Equity capital 269.84 269.91 270.04 270.04
Face Value (Rs) 1.00 1.00 1.00 1.00
Total No. of Shares 269.84 269.91 270.04 270.04
EPS 3.80 5.76 4.13 4.75

9
Key Ratio
Particulars FY09 A FY10 A FY11 E FY12 E
EBIDTA % 30% 27% 29% 29%
PAT % 9% 13% 17% 18%
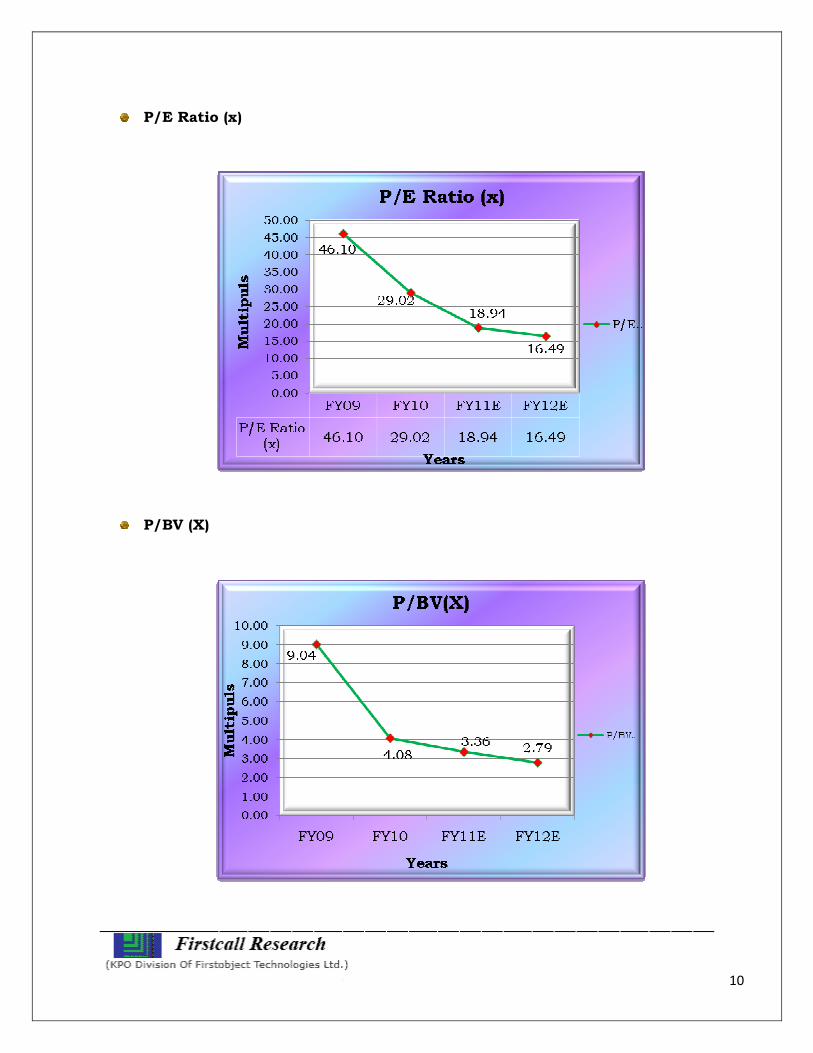
P/E ratio (x) 46.10 29.02 18.94 16.49
ROE - % 12% 14% 18% 17%
ROCE - % 20% 18% 20% 19%
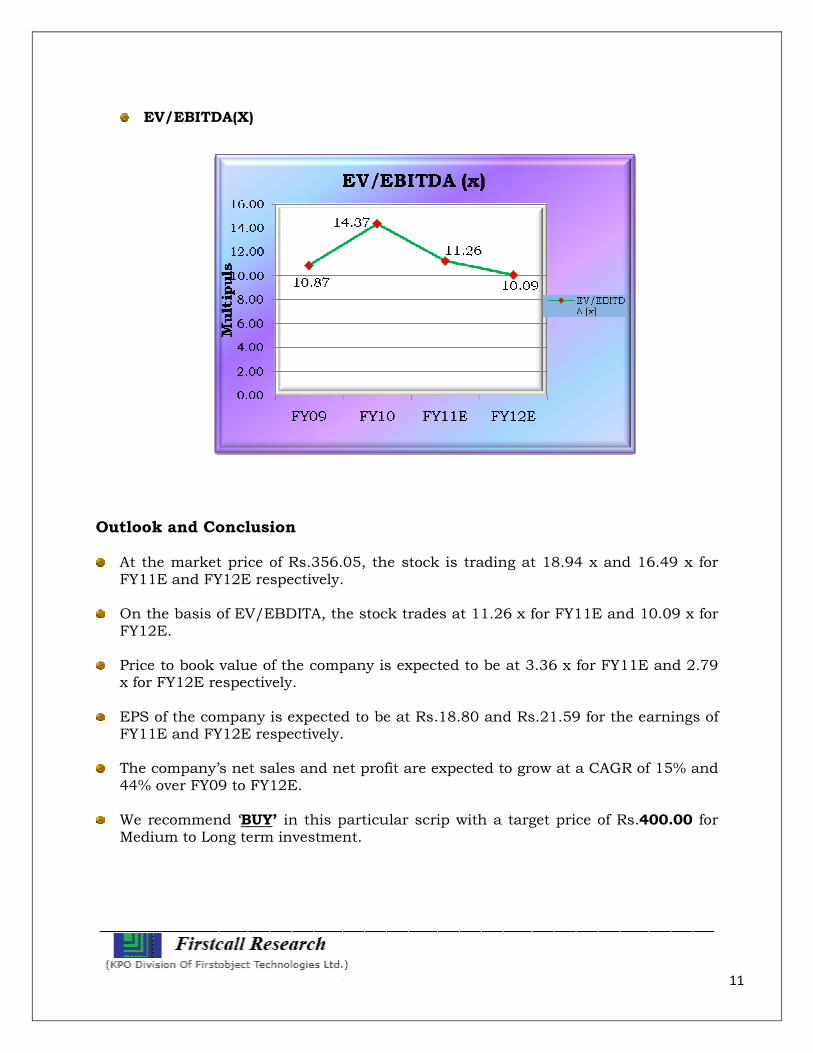
EV/EBIDITA (x) 10.87 14.37 11.26 10.09
Debt Equity Ratio 0.68 0.33 0.28 0.24
Price/Book Value 9.04 4.08 3.36 2.79 A-Actual E-Expected Charts:
Net sales & PAT
10
P/E Ratio (x)
P/BV (X)
11
EV/EBITDA(X)
Outlook and Conclusion
At the market price of Rs.356.05, the stock is trading at 18.94 x and 16.49 x for FY11E and FY12E respectively.
On the basis of EV/EBDITA, the stock trades at 11.26 x for FY11E and 10.09 x for FY12E.
Price to book value of the company is expected to be at 3.36 x for FY11E and 2.79 x for FY12E respectively.
EPS of the company is expected to be at Rs.18.80 and Rs.21.59 for the earnings of FY11E and FY12E respectively.
The company’s net sales and net profit are expected to grow at a CAGR of 15% and 44% over FY09 to FY12E.
We recommend ‘BUY’ in this particular scrip with a target price of Rs.400.00 for Medium to Long term investment.
12
Industry Overview India's pharmaceutical industry is now the third largest in the world in terms of volume and stands 14th in terms of value. According to data published by the Department of Pharmaceuticals, Ministry of Chemicals and Fertilizers, the total turnover of India's pharmaceuticals industry between September 2008 and September 2009 was US$ 21.04 billion. Of this the domestic market was worth US$ 12.26 billion. The Indian pharmaceuticals market is expected to reach US$ 55 billion in 2020 from US$ 12.6 billion in 2009, according to a report ‘India Pharma 2020: Propelling access and acceptance, realising true potential’ by McKinsey & Company. The report states that the market has the further potential to reach US$ 70 billion by 2020 in an aggressive growth scenario. Moreover, according to an Ernst & Young and industry body study, the increasing population of the higher-income group in the country, will open a potential US$ 8 billion market for multinational companies selling costly drugs by 2015. Besides, the report said the domestic pharma market is estimated to touch US$ 20 billion by 2015, making India a lucrative destination for clinical trials for global giants. Further, IMS Health India, which tracks drug sales in the country through a network of nationwide drug distributors, estimates the healthcare market in India to reach US$ 31.59 billion by 2020. Growth The Indian pharmaceutical market reached US$ 10.04 billion in size, with a value-wise growth rate of 20.4 per cent over the previous year’s corresponding period on a Moving Annual Total (MAT) basis for the 12 months ended July 2010, according to data from IMS Health India. Cipla maintained its leadership position in the domestic market with 5.27 per cent share, followed by Ranbaxy. The highest growth in the domestic market was for Mankind Pharma, which grew 37.2 per cent. Leading companies in the domestic market such as Sun Pharma (25.7 per cent), Abbott (25 per cent), Zydus Cadila (24.1 per cent), Alkem Laboratories (23.3 per cent), Pfizer (23.6 per cent), GSK India (19 per cent), Piramal Healthcare (18.6 per cent) and Lupin (18.8 per cent) had impressive growth during July 2010, shows the data. According to the All India Organisation of Chemists and Druggists (AIOCD), the pharmaceuticals industry in India will grow by over 100 per cent over the next two years. "The people are increasingly becoming health conscious and the sell of all types of medicines, particularly anti-biotic, will zoom up in the coming years. We expect the business to double by 2012", as per JS Shinde, President, and AIOCD.
13
According to Shinde, the pharmaceutical industry is currently growing at the rate of 12 per cent, but this will accelerate soon. The sale of all types of medicines in the country stands at US$ 9.61 billion, which is expected to reach around US$ 19.22 billion by 2012. India's domestic pharmaceutical market is valued approximately at US$ 12 billion in 2010, and has shown a strong growth of 21.3 per cent for the 12 months ending September 2010, as per consulting firm Price water house Coopers (PwC). It estimates that over the next 10 years, the domestic market will grow to US$ 49 billion, at a compounded annual growth rate (CAGR) of 15 per cent. Further, a RNCOS report titled 'Booming Pharma Sector in India' projects that the formulations industry is expected to prosper parallel to the pharmaceutical industry. It is expected that the domestic formulations market in India will grow at an annual rate of around 17 per cent in 2009-10, owing to increasing middle class population and rapid urbanisation. Diagnostics Outsourcing/Clinical Trials According to the research published by RNCOS titled 'Indian Diagnostic Market Analysis' published in January 2010, the Indian diagnostic services are projected to grow at a CAGR of more than 20 per cent during 2010-2012. Some of the major Indian pharmaceutical firms, including Sun Pharma, Cadilla Healthcare and Piramal Life Sciences, had applied for conducting clinical trials on at least 12 new drugs in 2010, indicating a growing interest in new drug discovery research. Generics According to Mr Srikant Kumar Jena, Union Minister of State for Chemicals and Fertilisers, India tops the world in exporting generic medicines worth US$ 11 billion and currently, the Indian pharmaceutical industry is one of the worlds largest and most developed. Moreover, as per a press release by research firm RNCOS in May 2010, the report titled ‘Booming Generics Drug Market in India' projects the Indian generic drug market to grow at a CAGR of around 17 per cent between 2010-11 and 2012-13. Mr Anand Sharma, Union Minister of Commerce and Industry and Lim Hng Kiang, Minister for Trade and Industry, Singapore, have signed a 'Special Scheme for Registration of Generic Medicinal Products from India' in May 2010, which seeks to fast-track the registration process for Indian generic medicines in Singapore. According to Lim Hng Kiang, "What we have agreed is that if your (Indian) generics have already cleared the regulations of one of the five countries/ regions - US, Canada, the European Union, UK or Australia - Singapore will take that as 'already cleared' and we will import it (the generic medicines) without any additional clearances."
14
Mr Sharma said, "This (understanding) will facilitate quick registration and approvals (of Indian generic drugs) in Singapore. It is a major movement forward. One-fourth of the world's generics come from India. This has ensured easy availability of life-saving medicines particularly where affordability has been an issue." Government Initiative 100 per cent foreign direct investment (FDI) is allowed under the automatic route in the drugs and pharmaceuticals sector including those involving use of recombinant technology. (DIPP) The Government plans to set up a US$ 639.56 million venture capital (VC) fund to give a boost to drug discovery and strengthen the pharma infrastructure in the country. According to Mr Ashok Kumar, Secretary, Department of Pharmaceuticals, the Government had issued an expression of interest (EoI) for technical and financial bids for the selection of a global level consultant (GLC) for the preparation of a detailed project report (DPR) in order to develop India as a drug discovery and pharma innovation hub by 2020. The Drugs and Pharmaceuticals Manufacturers Association has received an in-principle approval for its proposed special economic zone (SEZ) for pharmaceuticals, bulk drugs, active pharmaceutical ingredients (APIs) and formulations to be located at Nakkapalli mandal in Visakhapatnam district, according to a government press release. According to Mr Srikant Kumar Jena, Union Minister of State for Chemicals and Fertilisers, the Department of Pharmaceuticals has prepared a "Pharma Vision 2020" for making India one of the leading destinations for end-to-end drug discovery and innovation and for that purpose provides requisite support by way of world class infrastructure, internationally competitive scientific manpower for pharma research and development (R&D), venture fund for research in the public and private domain and such other measures. The government plans to open 3,000 Jan Aushadhi stores, which sell unbranded generic drugs at heavy discounts to branded drugs, in the next two years. Investment The healthcare sector has attracted growing investor support in 2010 with nearly a tenth of the total private equity funding going to this sector. In the third quarter the calendar year 2010, a total of US$ 2,047 million was invested across 88 deals, of which 9 per cent were healthcare deals, according to research firm Venture Intelligence. Further, in October 2010, the pharma, healthcare and biotech sector witnessed five merger and acquisition transactions (M&A) worth US$ 250 million, according to global consultancy firm Grant Thornton.
15
The drugs and pharmaceuticals sector has attracted FDI worth US$ 1,825.43 million between April 2000 and September 2010, according to data published by Department of Industrial Policy and Promotion (DIPP). Some of the major investment developments in the sector include:
• Hyderabad-based Natco Pharma plans to raise US$ 22.22 million to fund its expansion plans and research activities.
• Private equity major Sequoia Capital has made its first investment in the
pharmaceutical sector in the country by investing US$ 15.86 million into Celon Labs, which will use the funds to double its manufacturing facility.
• Belgium based Helvoet Pharma, part of the Daetwyler Group is setting up its
first greenfield production facility in Khandala Industrial Area, phase I (SEZ), on Pune- Bangalore Highway, near Pune. The company has invested US$ 26.56 million for the plant.
• Swiss Pharma major Lonza AG, would invest around US$ 55.33 million through
its Indian subsidiary in a phased manner in Genome Valley project, Hyderabad, said Stefan Borgas, CEO, Lonza.
• Chennai-based Bafna Pharmaceuticals plans to raise around US$ 4.43 million
for its future expansion by issuance of warrants and shares.
• Hyderabad Menzies Air Cargo Private Limited, a joint venture between GMR Hyderabad International Airport Limited (GHIAL) and Menzies Aviation, has launched India's first airport-based pharma zone, dedicated pharmaceutical cargo storage and handling facility, at Hyderabad. The project involved an investment of US$ 1.22 million.
Road Ahead According to a report by PwC in April 2010, India will join the league of top 10 global pharmaceuticals markets in terms of sales by 2020 with the total value reaching US$ 50 billion.
16
________________ ____ _________________________
Disclaimer:
This document prepared by our research analysts does not constitute an offer or solicitation
for the purchase or sale of any financial instrument or as an official confirmation of any
transaction. The information contained herein is from publicly available data or other
sources believed to be reliable but do not represent that it is accurate or complete and it
should not be relied on as such. Firstcall India Equity Advisors Pvt. Ltd. or any of it’s
affiliates shall not be in any way responsible for any loss or damage that may arise to any
person from any inadvertent error in the information contained in this report. This document
is provide for assistance only and is not intended to be and must not alone be taken as the
basis for an investment decision.
17
Firstcall India Equity Research: Email – [email protected]
C.V.S.L.Kameswari Pharma
U. Janaki Rao Capital Goods
B. Prathap IT
D. Asha kiran kumar Automobile
A. Rajesh Babu FMCG
H.Lavanya Oil & Gas
A.Prathibha Diverisfied
G.Bharani Bhukta Banking
Dheeraj Bhatia Diversified
Manoj Kotian Diversified
Nimesh Gada Diversified
Firstcall India also provides
Firstcall India Equity Advisors Pvt.Ltd focuses on, IPO’s, QIP’s, F.P.O’s, Takeover
Offers, Offer for Sale and Buy Back Offerings.
Corporate Finance Offerings include Foreign Currency Loan Syndications,
Placement of Equity / Debt with multilateral organizations, Short Term Funds
Management Debt & Equity, Working Capital Limits, Equity & Debt
Syndications and Structured Deals.
Corporate Advisory Offerings include Mergers & Acquisitions (domestic and
cross-border), divestitures, spin-offs, valuation of business, corporate
Restructuring-Capital and Debt, Turnkey Corporate Revival – Planning &
Execution, Project Financing, Venture capital, Private Equity and Financial
Joint Ventures
Firstcall India also provides Financial Advisory services with respect to raising
of capital through FCCBs, GDRs, ADRs and listing of the same on International
Stock Exchanges namely AIMs, Luxembourg, Singapore Stock Exchanges and
Other international stock exchanges.
For Further Details Contact:
3rd Floor, Sankalp, The Bureau, Dr.R.C.Marg, Chembur, Mumbai 400 071
Tel.: 022-2527 2510/2527 6077/25276089 Telefax: 022-25276089
E-mail: [email protected]
www.firstcallindiaequity.com