Embed Size (px)
Citation preview
Glass Fiber-Filled Thermoplastics. I . Wall and Processing Effects on Rheological Properties
BIN CHUNG and CLAUDE COHEN
School of Chemical Engineering Cornell University
Ithaca, New York 14853
A systematic study of wall effects on the shear viscosity of short glass fiber-filled polypropylene and polystyrene is pre- sented. The dependence of these effects on capillary radius, shear rate, temperature, and polymer matrix is examined. The “true” viscosity curves of these materials (free from wall effects) can be obtained by an extrapolation procedure. Breakage of glass fibers in the high shear-rate processes of extrusion and injection molding lead to an appreciable reduction of the vis- cosity of these materials and is probably the more important effect to take into account in these processes.
INTRODUCTION lass-filled thermoplastics are composite mate- G rials. For the engineering purpose of mold fill-
ing or other polymer processes, it would be a useful simplification to treat these composites as one- phase continuous materials if possible, to study their flow properties under that assumption, and to incorporate these properties into flow simulation schemes developed for unfilled thermoplastics (1). The rheology of fiber-filled materials can, however, be influenced by wall effects, flow geometry, and distribution of fiber length (2 to 4). It has been reported recently that when the average fiber length is comparable to (or smaller than) the critical dimension of the rheometer, i.e. the diameter of a capillary viscometer or the gap width of a slit rhe- ometer, wall effects are negligible (5 to 7); there has been, however, no systematic study of these effects.
We present in this paper a thorough investigation of the effect of the radius of capillary dies on the flow properties of short glass-fiber filled thermo- plastics indicating that a “wall” effect occurs and is dependent on capillary radius, shear rate, fiber concentration, and temperature (or polymer ma- trix). Such a phenomenon is absent for unfilled polymers under the same conditions. As long as capillary dies of the same radius (but different lengths) are used, the traditional corrections can be made on the raw data from filled materials. These corrections are the Bagley (or end-) correction to account for the undeveloped flow effects at the entrance and exit of the capillary die and the Ra- binowitsch correction to account for the shear-rate dependence of the viscosity. Well-behaved linear Bagley plots are obtained, although very small ran- dom fluctuations of the measured force (pressure
drop) are observed due probably to the inhomoge- neity of the filled resins which are basically two- phase materials. Reproducible and compatible re- sults from different capillary dies with different lengths but same radius can be obtained and are presented here. Effects of fiber concentration and temperature can be extracted from these results and are in qualitative agreement with previously reported behavior (4, 7, 8). We show, however, by an investigation with capillary dies of different ra- dii, that rheological data are affected by wall effects for certain filled polymers when the diameter of the capillary is of the same order of magnitude as the average length of the fiber in the composite material. These wall effects are particularly appre- ciable at low shear rates and at high temperature (or for low viscosity matrices).
In an effort to obtain rheological data at fairly high shear rates by using a modified extruder as a rheometer, we have found that the rheology of glass fiber-filled materials is very much affected by the polymer process itself due to the breakage of the fibers. Such degradation reduces appreciably the viscosity of the filled material.
EXPERIMENTAL PROCEDURE Materials
Glass fiber-filled polypropylene and polystyrene supplied by Wilson-Fiberfil International were used in this study. The materials designated by PP, PP(20), PP(40), PS, and PS(20) denote polypropyl- ene with 0, 20, and 40 percent glass fibers (by weight) and polystyrene with 0 and 20 percent glass fibers. These percentages are nominal fiber concen- trations; the actual fiber concentration of the com- pounds as received and after capillary extrusion or
POLYMER ENGINEERING AND SCIENCE, NOVEMBER, 7985, Vol. 25, No. 76 1001
Bin Chung and Claude Cohen
injection molding were obtained by using a muffler furnace to burn off the polymer at a temperature of about 450°C for about three hours. The weight fractions of the nominal 20 and 40 percent filled polypropylene were measured to be 19.2 and 38.4 percent, respectively; that of the nominal 20 per- cent filled polystyrene was found to be 19.8 per- cent. The weight fractions of the extrudates from capillary dies and of injection molded materials were found to be the same, within experimental error, as those of the materials as received. The fiber size distribution was, however, affected by the process (capillary extrusion or injection mold- ing). The distributions were obtained by spreading the glass fibers on a glass slide after the polymer has been burned off and taking pictures under a microscope. Histograms of fiber length distribution were constructed manually from the pictures. The average length of the glass fibers in the materials as received was around 400 pm with some fibers as long as 1300 pm, the diameter of the fibers was 16 pm. Evidence of fiber breakage was found in the shift of the distribution to smaller fiber sizes deter- mined from photographs (9). The fact that fibers longer than the die diameters through which they pass were found in the extrudates indicated, how- ever, that a substantial number of fibers are ori- ented along the flow and pass through the die without breakage.
Rheometers and Dies Used To study the effect of the radius of capillary dies
on the flow properties of filled and unfilled mate- rials we have used the assortment of dies listed in Table 1 . A Sieglaff-McKelvey capillary rheometer was used for the measurement of the apparent shear stress 7, versus apparent shear rate j / , at the wall of the capillary die.
The raw data taken directly from the two-channel recorder of the rheometer can be put in the form
7, = (AP)R/(BL) [dynes/cm2] [11
+, = 4Q/(rR3) [s-l] [21
and
where AP is the pressure drop across the capillary, Q is the volumetric flow rate, R is the radius of the capillary, and L is its length. The temperature of the melt is controlled in the barrel within k0.2"C. The A set of dies in Table 1 was used to study the concentration and temperature effects on the flow
Table 1. Dimensions of Capillary Dies.
No. R* (cm) LIR Set
0.020882 0.025446 0.0251 38 0.02501 0 0.025495 0.048634 0.047326 0.046808 0.098196
121.64 99.82 A 75.68 A 50.37 A 24.71 A, C 52.23 6 39.93 6 26.92 B, C 25.87 C
* Data supplied by the manufacturer (Tinius Olaen Testing Machine Co., Inc.).
curve. We note that all the dies in this set have a diameter ( ~ 5 0 0 mp) comparable to the average glass fiber length. Dies in set B have a diameter about twice as large as those of set A, whereas the dies in set C (dies nos. S, 8, 9) have a practically constant L/R ratio but widely different radii. Dies 1 to 4 were used to measure the flow properties of the unfilled materials. Both B and C sets of dies were used to investigate the wall effects for the filled materials.
A modified extruder has also been used to mea- sure the viscosity of our materials in the high shear- rate range. The extruder (from Killion Extruders, Inc.) has four separately controlled heating zones. A Dynisco pressure transducer with a range from zero to 3000 psi was flush mounted about 2 cm before the die entrance. The volumetric flow rates were measured by a modified LVDT (linear-vari- able-differential transformer).
RESULTS AND DISCUSSION
The Bagley (or end-) correction and the Rabino- witsch correction were made on the raw data of both the unfilled and filled materials. Although the data obtained from the dies of sets A and B were self-consistent within each set for the filled mate- rials and lead to a single corrected viscosity curve, the presssure drops from the dies in set B were found to be higher than those from set A at the same shear rate and for approximately the same L/R ratio. Such an effect is absent for the unfilled materials, which give essentially identical pressure- drop-versus-shear-rate curves for dies of different radius but approximately the same L/R ratio. This suggests that for the glass-filled materials the ratio of the capillary radius to the fiber length may be an important factor in the rheology of these materials or, in other words, that wall effects may be impor- tant.
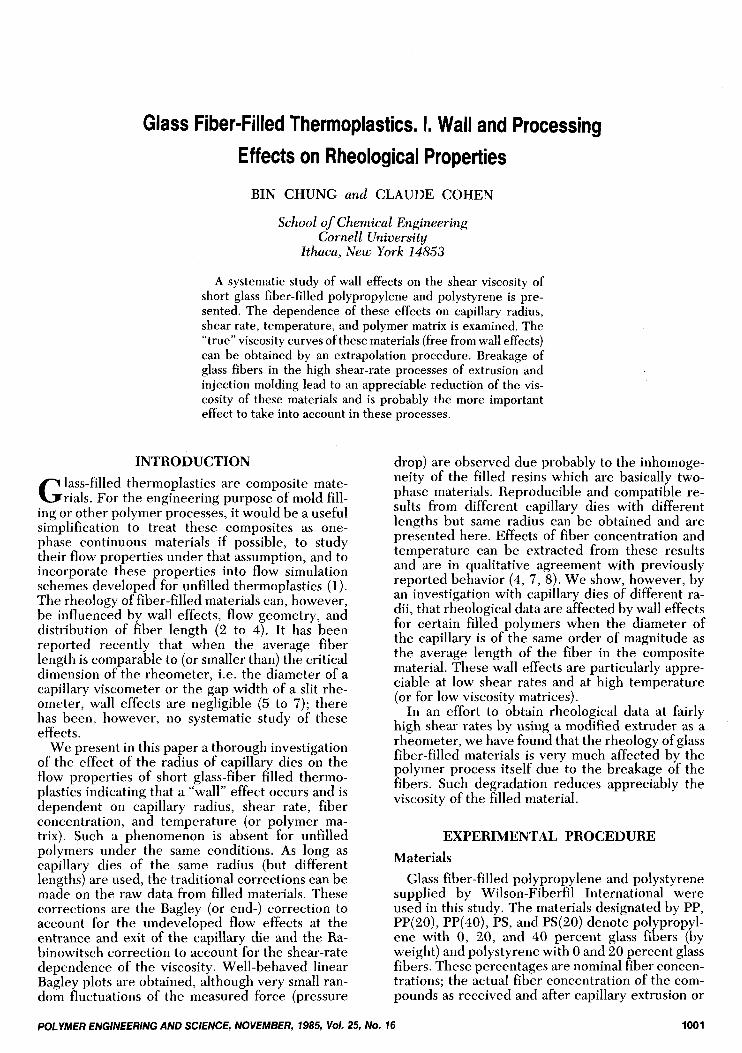
Effects of fiber concentration and temperature The results of corrected viscosity curves we have
obtained for the polypropylene and polystyrene systems investigated with the A set of dies are shown in Figs. 1 to 4 . The variations of the viscosity curve with temperature for a given material can be obtained from these results. The general qualitative conclusions that may be deduced are: an increase in fiber concentration leads to an increase in the shear viscosity at a given shear rate; the increase in viscosity due to the fibers is more pronounced for PP than for PS; at the low shear-rate range, the presence of fibers causes an appreciable increase in viscosity which diminishes at higher shear rates; the most interesting result is, however, that the in- crease of fiber concentration from 20 to 40 percent does not give a very appreciable increase in viscos- ity.
We found, however, that such comparison of viscosity curves containing different concentrations of fibers could be misleading, as the polymer ma- trices in these systems are different. We have ana- lyzed the fiber content of the extrudates and found
1002 POLYMER ENGINEERING AND SCIENCE, NOVEMBER, 1985, Vol. 25, No. 16
Wall and Processing Effects on Rheological Properties
I 1
1 o2 , O1 1
Shear Raia Gec-’)
Fig. 1 . Corrected viscosity curves of polypropylene with different glass fiber concentrations at 230°C. Bagley and Rabinowitsch corrections were made using a set of dies (set A) with dqferent L f R ratios and same R ( R = 0.025 cm).
10 1 0’ 21 102 Shear Rmie (eec-1) 1 03 1 o4
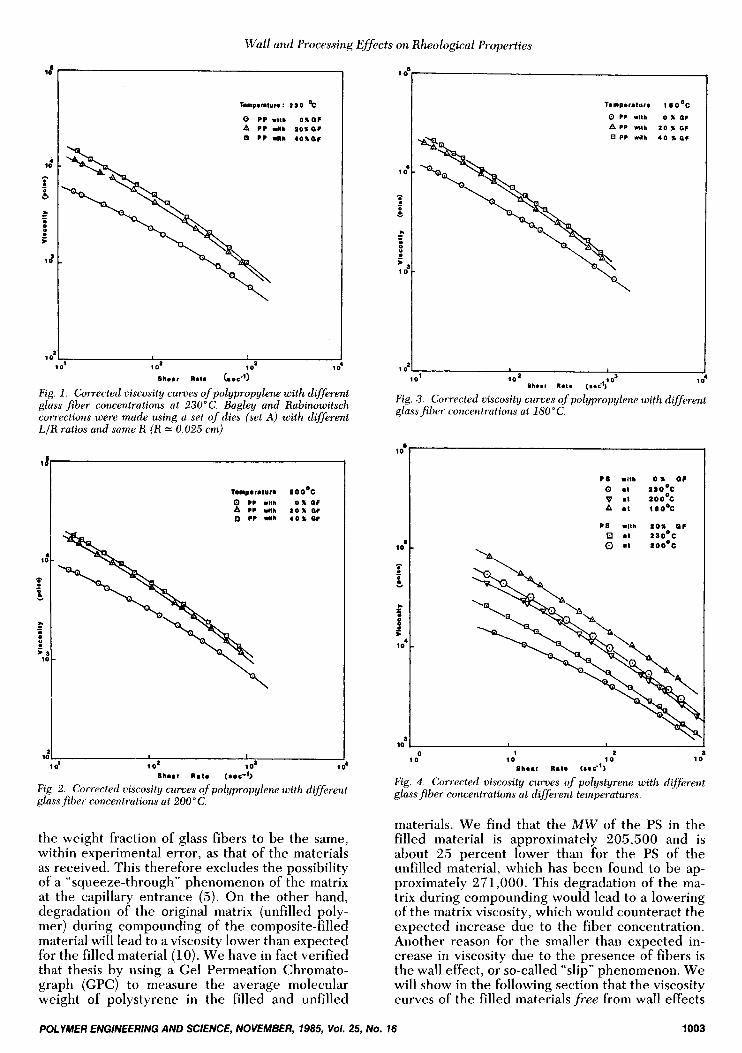
Fig. 2. Corrected viscosity curves of polypropylene with different glassfiber concentrations at 200°C.
the weight fraction of glass fibers to be the same, within experimental error, as that of the materials as received. This therefore excludes the possibility of a “squeeze-through” phenomenon of the matrix at the capillary entrance (5). On the other hand, degradation of the original matrix (unfilled poly- mer) during compounding of the composite-filled material will lead to a viscosity lower than expected for the filled material (10). We have in fact verified that thesis by using a Gel Permeation Chromato- graph (GPC) to measure the average molecular weight of polystyrene in the filled and unfilled
Temperature 1 O O O C
0 PP W l l h 0 X O F A PP Wl lh 2 0 X OF
wllh 4 0 X Q ?
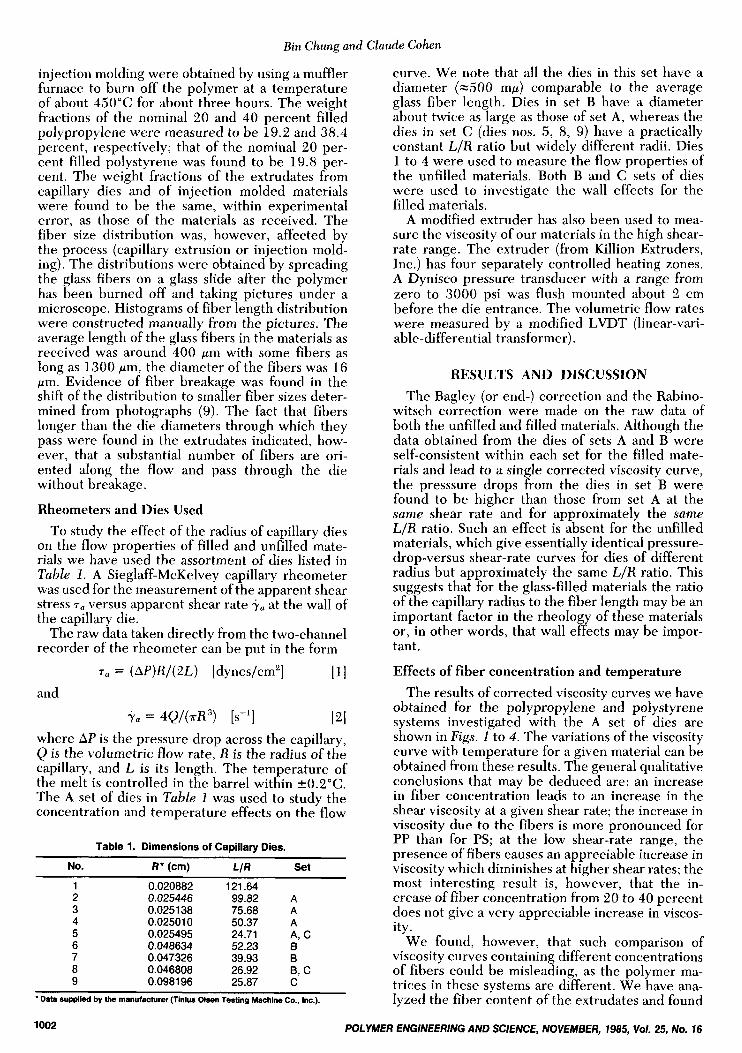
Fig. 3. Corrected viscosity curues of polypropylene with difierent glassfiber concentrations at 180°C.
PS with o n of 0 a1 2 3 o 0 c v at 200OC
El a t 2 5 o O c e Q a t aoooc
A a i cso0C
PS wllh 2 0 % O f
10 - i 0
Y
wn - - 0 5 1 04
5 10
0 1 2 10 10 10 11
Shear Reie (nee-’)
Fig. 4 . Corrected viscosity curves of polystyrene with different glass fiber concentrations at different temperatures.
materials. We find that the M W of the PS in the filled material is approximately 205,500 and is about 25 percent lower than for the PS of the unfilled material, which has been found to be ap- proximately 271,000. This degradation of the ma- trix during compounding would lead to a lowering of the matrix viscosity, which would counteract the expected increase due to the fiber concentration. Another reason for the smaller than expected in- crease in viscosity due to the presence of fibers is the wall effect, or so-called “slip” phenomenon. We will show in the following section that the viscosity curves of the filled materials free from wall effects
POLYMER ENGINEERING AND SCIENCE, NOVEMBER, 1985, Vol. 25, No. 16 1003
Bin Chung and Claude Cohen
would be appreciably higher than those reported in Figs. 1 through 4 (see Fig. 6).
The increase in viscosity due to the presence of fibers is more pronounced at higher temperatures for the same matrix or for the lower viscosity matrix (PP as compared with PS) at the same temperature. This trend may be interpreted in terms of the en- ergy dissipation resulting from the glass-fiber mo- tions which are larger at lower viscosities or higher temperature. A similar qualitative trend has been reported by Moskal (8). The temperature depend- ence of the viscosity can be described very well in the range of temperatures investigated by the Ar- rhenius equation
9 = A exp(AE,/RT) 131 where A is a constant, AE, is the activation energy and R is the gas constant. Based on the viscosity curves shown in Figs. 1 to 4, AE, can be calculated from the viscosity values at different temperatures with either shear rate or shear stress held constant. We have listed in Table 2 the activation energies at constant shear rates obtained by plotting log 9 ver- sus 1/T. Our activation energies for unfilled PP are in close agreement with recently reported values (4). Further, the filled PP resins are seen to have a lower AE, than the unfilled PP. We note also that the activation energy decreases as shear rate in- creases; this trend is most pronounced for the 20 percent fiber-filled PP. Wall effect
When capillary dies with the same L/R ratio but different radii are used, one would anticipate from equation [ 11 that identical uncorrected flow curves would result from such measurements. We find that this is not the case for filled materials.
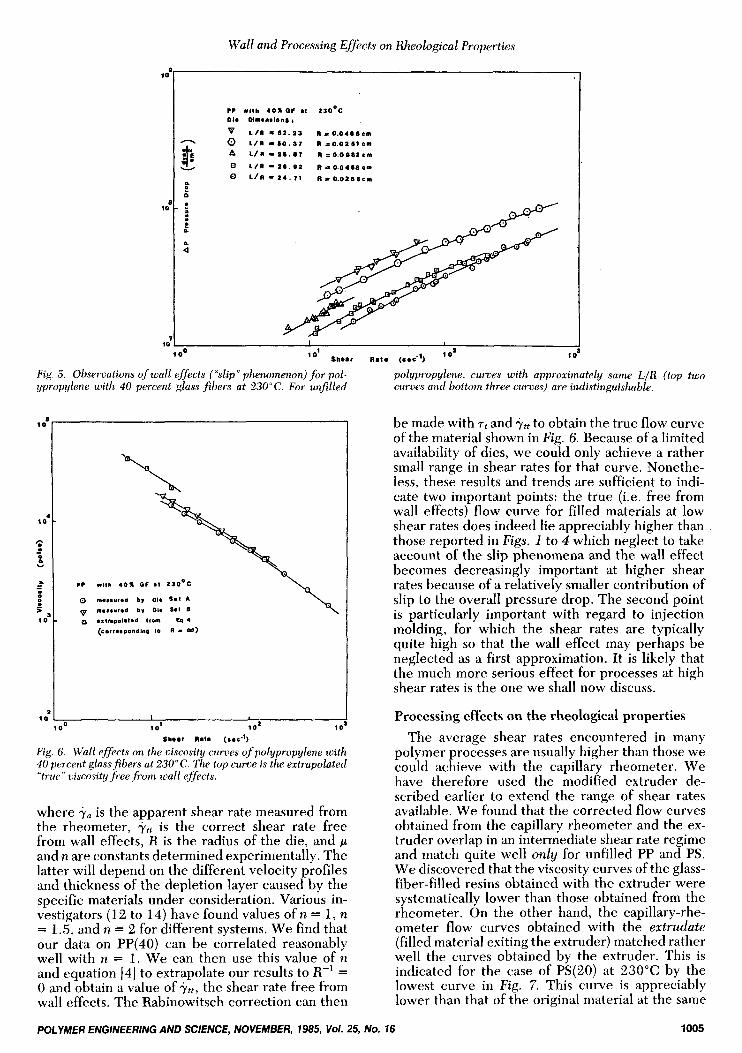
The flow properties of PP(40) were measured using the C set of dies corresponding to L/R = 25 and radii of 0.0982, 0.0468, and 0.0255 cm. The results of AP versus shear rate are shown in Fig. 5 with the larger capillary radius giving rise to a larger pressure drop for the same shear rate. This discrep- ancy (often referred to as a “slip phenomenon”) is thought to result from a depletion of fibers from a small region near the wall of the capillary such that the remaining lower-viscosity polymer matrix acts as a lubricating layer. This fiber exclusion from the wall region would indeed lead to a lower overall pressure drop and therefore a lower apparent vis-
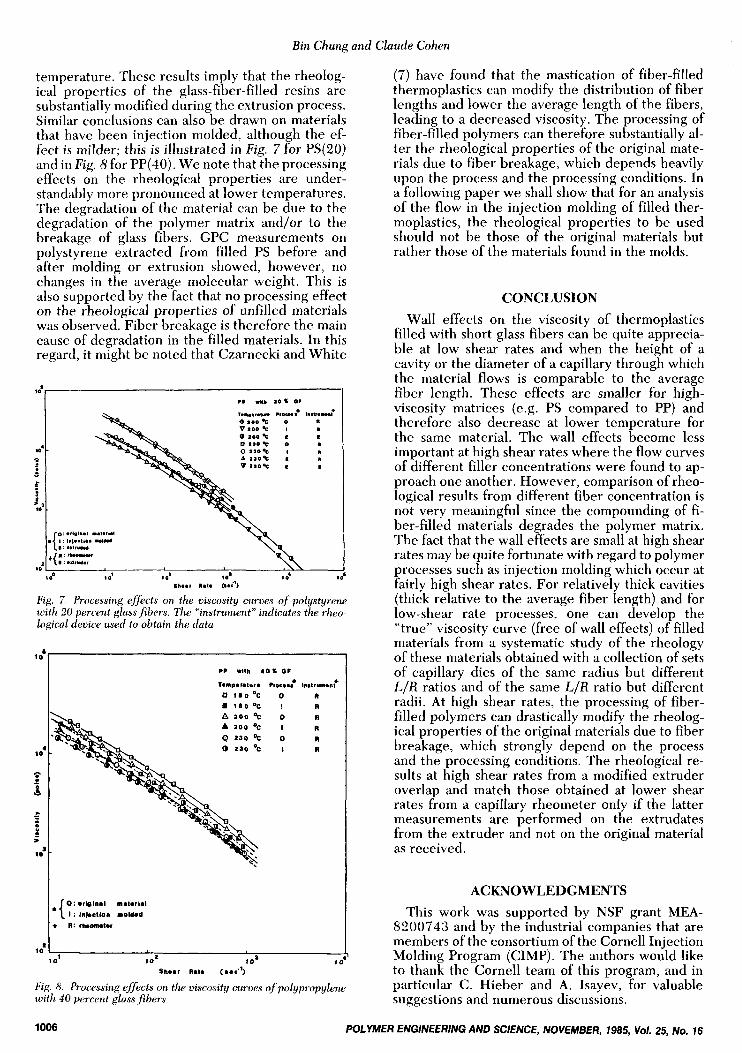
cosity. Evidently, the relative effect of this deple- tion layer (or, more generally, wall effect) will be larger in capillaries of smaller radius, with the effect becoming vanishingly small as the radius becomes larger relative to the length of the fibers. The B set of dies was used to measure and calculate a cor- rected (i.e. with Bagley and Rabinowitsch correc- tions) flow curve for PP(40) in order to make com- parison with that obtained from the A set of dies which corresponds to a smaller radius. These cor- rected flow curves are shown in Fig. 6, from which it is seen that set B gives a higher viscosity at a given shear rate with the effect being larger at lower shear rates. Similar results have been recently reported by Bigg (1 1) for a filled low-density poly- ethylene (LDPE) system. Similar observations of other types of two-phase systems have also been reported whenever the size of the suspended par- ticles becomes comparable to the radius or gap- width of the capillary die or slit (12 to 15).
In filled thermoplastics, this wall effect is in gen- eral small due to the high viscosity of the matrix and may become altogether undetectable for ma- trices of very high viscosity (or, equivalently, at low temperature). For example, Chan, et al. (16) find that no wall effects can be observed on PS(20) and PS(40) at 180°C. We have measured PS(20) at 230°C by using the A and B sets of dies and have found different flow curves, but the difference is smaller than that for PP(40) shown in Fig. 6. This is probably due to the relatively high viscosity of PS; at 180°C, the difference may become too difficult to detect due to the even higher viscosity of the system. Nonetheless, wall effects raise the question of how to define a flow curve for glass fiber-filled materials when they are flowing in cavities having a thickness comparable to the fiber length. This may present a problem for the injection-molding analysis of very thin cavities, particularly when flow rates (and therefore shear rates) are low, corre- sponding to when wall effects are the largest. For thicker cavities, it is possible to devise a method of extrapolating experimental rheological data in or- der to obtain a flow curve which does not depend on the rheometer geometry (i.e. free of wall ef- fects). This can be done by using an empirical formula which is often used in the literature (12) to account for wall effects at a fixed shear stress:
Table 2. Activation Energy at Different Shear Rates.
Shear Rate (sec-’) PS PP PP + 20% PP + 40%
€.(Kcal/rnole) E.(Kcal/rnole) E.(Kcal/mole) E,(Kcal/rnole)
10 15.2 6.28 5.30 3.90 20 14.1 5.81 4.67 3.77 40 12.5 5.51 4.02 3.62 60 11.8 5.40 3.81 3.50 100 11.3 4.96 3.54 3.42 200 10.6 4.29 3.02 3.15 400 10.3 4.20 2.76 3.06 600 10.1 4.15 2.66 3.06
4.04 2.50 3.01 1000 -
1004 POLYMER ENGINEERING AND SCIENCE, NOVEMBER, 1985, Vol. 25, No. 16
0 10
101-
7 10
CC l l l h 4 0 X Q F I t 230’C D h Mn.n*lanl I
V L / n = s t . 2 3 R O . O 4 l ) 6 c m - 0 L i n - 6 0 . 3 1 ~ n o . o z 5 l c m
$ A r / n = a s . 8 7 u = o . o o a a C m
v 0 L / n - 2 o . o ~ R ~ o . o ~ s ( I ~ ~ 0 L / n - 2 4 . 7 1 R - O . O Z B S ~ ~
0 ?
5 t
L a
I
where is the apparent shear rate measured from the rheometer, Ttt is the correct shear rate free from wall effects, R is the radius of the die, and p and n are constants determined experimentally. The latter will depend on the different velocity profiles and thickness of the depletion layer caused by the specific materials under consideration. Various in- vestigators (12 to 14) have found values of n = 1, n = 1.5, and n = 2 for different systems. We find that our data on PP(40) can be correlated reasonably well with n = 1. We can then use this value of n and equation [4] to extrapolate our results to R-’ = 0 and obtain a value of + t t , the shear rate free from wall effects. The Rabinowitsch correction can then
10
2 10
be made with T~ and ytt to obtain the true flow curve of the material shown in Fig. 6. Because of a limited availability of dies, we could only achieve a rather small range in shear rates for that curve. Nonethe- less, these results and trends are sufficient to indi- cate two important points: the true (i.e. free from wall effects) flow curve for filled materials at low shear rates does indeed lie appreciably higher than those reported in Figs. 1 to 4 which neglect to take account of the slip phenomena and the wall effect becomes decreasingly important at higher shear rates because of a relatively smaller contribution of slip to the overall pressure drop. The second point is particularly important with regard to injection molding, for which the shear rates are typically quite high so that the wall effect may perhaps be neglected as a first approximation. It is likely that the much more serious effect for processes at high shear rates is the one we shall now discuss.
- 0 *xtmpol.l*d 11m W 4
(corr-spondlna 10 n - w )
I Processing effects on the rheological properties The average shear rates encountered in many
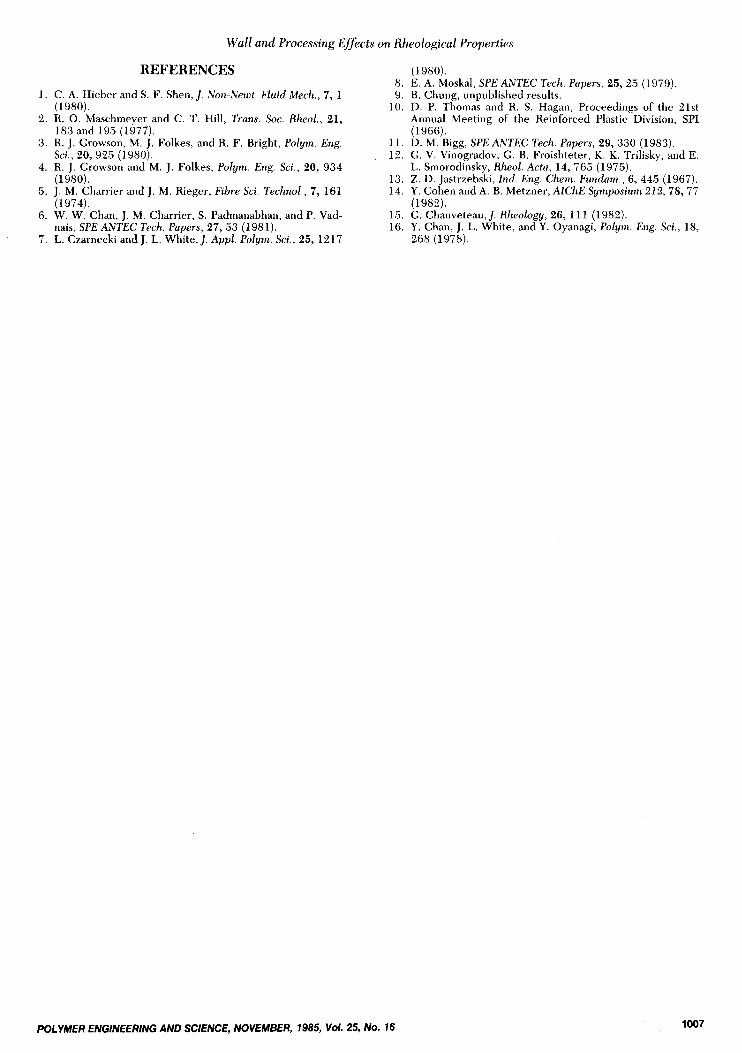
polymer processes are usually higher than those we could achieve with the capillary rheometer. We have therefore used the modified extruder de- scribed earlier to extend the range of shear rates available. We found that the corrected flow curves obtained from the capillary rheometer and the ex- truder overlap in an intermediate shear rate regime and match quite well only for unfilled PP and PS. We discovered that the viscosity curves of the glass- fiber-filled resins obtained with the extruder were systematically lower than those obtained from the rheometer. On the other hand, the capillary-rhe- ometer flow curves obtained with the extrudate (filled material exiting the extruder) matched rather well the curves obtained by the extruder. This is indicated for the case of PS(20) at 230°C by the lowest curve in Fig. 7. This curve is appreciably lower than that of the original material at the same
POLYMER ENGlNEERlNG AND SCIENCE, NOVEMBER, 1985, Vol. 25, No. 16 1005
Bin Chung and Claude Cohen
temperature. These results imply that the rheolog- ical properties of the glass-fiber-filled resins are substantially modified during the extrusion process. Similar conclusions can also be drawn on materials that have been injection molded, although the ef- fect is milder; this is illustrated in Fig. 7 for PS(20) and in Fig. 8 for PP(40). We note that the processing effects on the rheological properties are under- standably more pronounced at lower temperatures. The degradation of the material can be due to the degradation of the polymer matrix and/or to the breakage of glass fibers. GPC measurements on polystyrene extracted from filled PS before and after molding or extrusion showed, however, no changes in the average molecular weight. This is also supported by the fact that no processing effect on the rheological properties of unfilled materials was observed. Fiber breakage is therefore the main cause of degradation in the filled materials. In this regard, it might be noted that Czarnecki and White
10' - 8 - P a to .
?%.-#A 0 a r o t
...a,.* 0 I I 0 I I I
*{ 0 : .n.in., I.,., 1.1
I : l"l.'*l." uw I : ..I,- R : P u I m r +{.: . a w . r
10 , 1 0' 1 0' 10'
8ha.r I.1. 6.f)
Fig. 7. Processing effects on the viscosity curves of polystyrene with 20 percent glassfibers. The "instrument" indicates the rheo- logical device used to obtain the data.
CP Wl lh 4 0 X O f
ronpemtura roe..: inatrunan?
0 t a o o c 0 R m i a o ~ c I n A z o o Oc o R A zoo Oc I R 0 z a o OC o R o z a o "c I R
10'
Fig. 8. Processing effects on the viscosity curves of polypropylene with 40 percent glassfibers.
(7) have found that the mastication of fiber-filled thermoplastics can modify the distribution of fiber lengths and lower the average length of the fibers, leading to a decreased viscosity. The processing of fiber-filled polymers can therefore substantially al- ter the rheological properties of the original mate- rials due to fiber breakage, which depends heavily upon the process and the processing conditions. In a following paper we shall show that for an analysis of the flow in the injection molding of filled ther- moplastics, the rheological properties to be used should not be those of the original materials but rather those of the materials found in the molds.
CONCLUSION Wall effects on the viscosity of thermoplastics
filled with short glass fibers can be quite apprecia- ble at low shear rates and when the height of a cavity or the diameter of a capillary through which the material flows is comparable to the average fiber length. These effects are smaller for high- viscosity matrices (e.g. PS compared to PP) and therefore also decrease at lower temperature for the same material. The wall effects become less important at high shear rates where the flow curves of different filler concentrations were found to ap- proach one another. However, comparison of rheo- logical results from different fiber concentration is not very meaningful since the compounding of fi- ber-filled materials degrades the polymer matrix. The fact that the wall effects are small at high shear rates may be quite fortunate with regard to polymer processes such as injection molding which occur at fairly high shear rates. For relatively thick cavities (thick relative to the average fiber length) and for low-shear rate processes, one can develop the "true" viscosity curve (free of wall effects) of filled materials from a systematic study of the rheology of these materials obtained with a collection of sets of capillary dies of the same radius but different L/R ratios and of the same L / R ratio but different radii. At high shear rates, the processing of fiber- filled polymers can drastically modify the rheolog- ical properties of the original materials due to fiber breakage, which strongly depend on the process and the processing conditions. The rheological re- sults at high shear rates from a modified extruder overlap and match those obtained at lower shear rates from a capiIlary rheometer only if the latter measurements are performed on the extrudates from the extruder and not on the original material as received.
ACKNOWLEDGMENTS This work was supported by NSF grant MEA-
8200743 and by the industrial companies that are members of the consortium of the Cornell Injection Molding Program (CIMP). The authors would like to thank the Cornell team of this program, and in particular C . Hieber and A. Isayev, for valuable suggestions and numerous discussions.
1006 POLYMER ENGINEERING AND SCIENCE, NOVEMBER, 7985, Vol. 25, No. 16
Wall and Processing Effects on Rheological Properties
REFERENCES
1. C. A. Hieber and S. F. Shen,]. Non-Newt. Fluid Mech., 7, 1
2. R. 0. Maschmeyer and C. T. Hill, Trans. Soc. Rheol., 21,
3. R. J. Growson, M. J. Folkes, and R. F. Bright, Polym. Eng.
4 . R. J. Growson and M. J. Folkes, Polym. Eng. Sci., 20, 934
5. J. M. Charrier and J. M. Rieger, Fibre Sci. Technol., 7, 161
6. W. W. Chan, J. M. Charrier, S. Padmanabhan, andP. Vad-
7. L. Czarnecki and J. L. White, J . Appl. Polym. Sci., 25, 1217
(1980).
183 and l Y r j (1977).
Sci., 20, 925 (1980).
(1980).
(1974).
nais, SPEANTEC Tech. Papers, 27, 53 (1981).
( 1 980). 8. E. A. Moskal, SPE ANTEC Tech. Papers, 25, 25 (1979). 9. B. Chung, unpublished results.
10. D. P. Thomas and R. S. Hagan, Proceedings of the 21st Annual Meeting of the Reinforced Plastic Division, SPI (1966).
11. D. M. Bigg, SPE ANTEC Tech. Papers, 29,330 (1983). 12. G. V. Vinogradov, G. B. Froishteter, K. K. Trilisky, andE.
13. Z. D. Jastrzebski, lnd. Eng. Chem. Fundam., 6, 445 (1967). 14. Y. Cohen and A. B. Metzner, AlChE Symposium 212,78,77
15. G. Chauveteau,]. Rheology, 26, 111 (1982). 16. Y. Chan, J. L. White, andY. Oyanagi, Polym. Eng. Sci., 18,
L. Smorodinsky, Rheol. Acta, 14, 765 (1975).
(1982).
268 (1978).
POLYMER ENGINEERING AND SCIENCE, NOVEMBER, 1985, Vol. 25, NO. 16 1007


![Effect of Particle Size and Concentration of Flyash on ... · Particulate filled polymer composites are becoming attractive ... properties of thermoplastics and thermosets [8-13]](https://img.pdfslide.us/doc/110x75/5e8a307e31f60942be474980/effect-of-particle-size-and-concentration-of-flyash-on-particulate-filled-polymer.jpg)