Embed Size (px)
Citation preview

Glass Factories under the
Industrial Emissions Directive
Sites, competition and investment potentials in Europe
Cologne, June 2014
Picture credits: left: flat glass cladding of DuMont’s house in Cologne, Germany; lower right: container glass manufacturing; both by courtesy of Compagnie de Saint-Gobain. Upper right: © palomita0306 / Fotolia.com, container glass factory in Ernstthal, Germany.
Extract

ecoprogecoprog
ecoprog GmbH
Glass Factories under the Industrial Emissions Directive
The market for modernisation measures at European glass factories will increase considerably in the years
to come: By 2020, about 14 billion EUR will be invested in the European glass industry – an annual increase
of up to 45 per cent in comparison to the past years’ average.
The main reason for this growth is the coming into force of the Industrial Emissions Directive (IED), which
defines EU-wide limit values for air and water emissions for different industrial sectors, from 2016 on. The
specific limit values are determined in the BAT reference documents (BAT stands for Best Available
Techniques) and the BAT conclusions. The glass industry is one of the first industries BAT conclusions have
already been published for. The content of these conclusions and the way the affected glass factories will
handle them thus also give a signal to other industries.
More than 420 European glass factories have to comply with the limit values from 2016 on. The limit values
for nitrogen oxides and sulphur oxides will be particularly challenging for many glass factory operators, both
in technical and financial terms – and especially in countries with so far less strict legal frameworks, as is the
case in many Eastern European states. However, there are also many glass factories lacking state-of-the-art
technology in countries such as France and Spain.
This means that most glass manufacturers have to invest in modernising their factories. Funds will go to
optimising individual production processes or to new technical components for flue gas cleaning, furnace
technology or sealing the melter.
In the light of this development, ecoprog has collected information on the affected glass factories and
calculated the investment potentials by country.
The study “Glass Factories under the Industrial Emissions Directive” includes:
A detailed analysis of the IED, the BAT conclusions and other important legal frameworks as well as
the assessment of their importance for the glass industry.
Description and analysis (by country) of more than 420 European glass factories falling under the
IED criteria, including technical data, contact addresses and a geographical presentation of the
largest national markets in Europe.
A reliable estimation of future investment volumes by country.
A competitive analysis of the most important glass manufacturers in the European market.
An overview of the most important plant technology and cost structures in the glass industry.
The study is available in German and English from 2,900,- EUR plus VAT.
Contact:
Marcel Siebertz
ecoprog GmbH
Tel. +49 221 788 03 88 – 14

Content
Glass factories under the Industrial Emissions Directive
ecoprog GmbH, www.ecoprog.com
ecoprogecoprog
Preface 11
Management summary 13
1 Background 17
1.1 Introduction 17
1.2 Differentiation 17
1.3 Definitions 19
2 Plant technology 20
2.1 Glass batch preparation 21
2.2 Glass melting and refining 21
2.3 Cooling and forming 25
2.4 Flue gas cleaning 26
3 Costs 27
3.1 Investment costs 27
3.2 Current costs 28
3.3 Costs for reducing emissions 29
4 Current legal framework and market factors 31
4.1 Industrial Emissions Directive (IED) 31
4.2 BAT conclusions for the glass industry 33
4.3 European Union Emission Trading Scheme 36
4.4 Concentration processes in Europe 39
4.5 Transport and dependencies 40
5 Glass factories and market 43
5.1 Glass factories 43
5.2 Market 48
6 Competition 55
6.1 Glass manufacturers 55
6.2 Technology providers 59
7 National markets and sites 61
7.1 Belgium 61
7.2 Bulgaria 69
7.3 Denmark 75
7.4 Germany 79
7.5 Estonia 99
7.6 Finland 103
7.7 France 108
7.8 Greece 120
7.9 Italy 125
7.10 Croatia 139
7.11 Latvia 143
7.12 Lithuania 147
7.13 Luxembourg 151
7.14 Netherlands 153
7.15 Norway 160
7.16 Austria 165
7.17 Poland 171
7.18 Portugal 183
7.19 Romania 189
7.20 Sweden 195
7.21 Slovakia 199
7.22 Slovenia 205
7.23 Spain 209
7.24 Czech Republic 223
7.25 Hungary 232
7.26 United Kingdom 239
Data origin and methodology 248
Glossary 251
European glass factory register 252

Figures
Glass factories under the Industrial Emissions Directive
ecoprog GmbH, www.ecoprog.com
ecoprog
Figure 1: Analysed area 18
Figure 2: Schematic illustration of a glass factory 20
Figure 3: Types of glass furnaces in European glass factories 22
Figure 4: Model of a regenerative glass furnace, end-port 23
Figure 5: Model of a recuperative glass furnace, side-port 24
Figure 6: Melting capacities of different types of furnaces 25
Figure 7: Melting steps during glass production 26
Figure 8: Overview investment costs 27
Figure 9: Breakdown of investment costs in glass factories 28
Figure 10: Current costs of glass manufacturing 29
Figure 11: Investment costs for emission reduction measures 30
Figure 12: BAT emission ranges for air emissions 34
Figure 13: Upper BAT limit values for wastewater 35
Figure 14: Kyoto goals and status of implementation in Europe 36
Figure 15: European Union Emission Trading Scheme: price development 38
Figure 16: Development of glass production in Europe 2002-2012 39
Figure 17: Production and foreign trade balance of European glass industry 2012 41
Figure 18: Overview of other industries 41
Figure 19: IED glass factories in Europe 43
Figure 20: Production capacities in Europe 44
Figure 21: Production capacity by type of glass and region 44
Figure 22: Annual glass production in Europe 45
Figure 23: Glass factories in Europe 46
Figure 24: Glass industry country data 47
Figure 25: Market forecast Europe 48
Figure 26: Investment potential by industrial sector in Europe 2014-2020 49
Figure 27: Emission reduction measures 49
Figure 28: Estimated technology investments by region 50
Figure 29: Market volume Europe 2014-2020 51
Figure 30: Investments over course of time in Europe 2014-2020 52
Figure 31: Investment potentials by country 53
Figure 32: Market volume investments in glass factories 2014-2020 (million EUR) 54
Figure 33: Top 15 of European glass manufacturers 55
Figure 34: The ten largest glass factory operators in Europe 56
[…]
Figure 180: Structure of glass industry in the United Kingdom 239
Figure 181: Analysed sites by industrial sector in the United Kingdom 240
Figure 182: Glass production in the United Kingdom 241
Figure 183: Glass industry’s energy purchase in the United Kingdom 241
Figure 184: Glass factories in the United Kingdom 242
Figure 185: Investment potential by industrial sector in the United Kingdom 2014-2020 243
Figure 186: Market forecast United Kingdom 244
Figure 187: Differentiation of market regions 248

Extract, Chapter 4, Current legal framework and market factors
Glass factories under the Industrial Emissions Directive 33
ecoprog GmbH, www.ecoprog.com
ecoprog
4.2. BAT conclusions for the glass industry
The Industrial Emissions Directive says that the BAT reference documents (BAT stands for best
available techniques), also called BREFs, should define emission limit values (ELVs) for the
different industrial sectors.
The current BAT reference document for the glass industry was published in February 2012 as an
update of the first BREF from 2000. Furthermore, the legally binding conclusions were published in
all EU national languages for the first time within the framework of the IED. The conclusions
illustrate the summed up ELVs. The glass industry is one of the first industries BAT conclusions
have been completed for.
In practice, the EU-wide obliging limit values affect:
Glass manufacturing plants (including glass fibre) with a melting capacity of over 20 tons
per day and
plants melting mineral material (including mineral fibre production) with a melting capacity
of over 20 tons daily.
The BAT documents define upper emission limit values for these facilities. The specific values are
ranges from lower to upper limit values. The upper values reflect the maximum allowable limit
values, the lower the currently possible values that can be reached when applying BAT.
The upper limit values have only changed slightly in comparison to the 2000 BREF. Many lower
limit values, by contrast, have declined considerably due to technological advances. You will find
the differences when looking at the details. The limit values for hydrogen fluoride, for instance,
were tightened significantly.
Figure 12: BAT emission ranges for air emissions
Parameter
Container glass Flat glass Glass fibre/mineral wool
Mg/Nm³ kg/t glass Mg/Nm³ kg/t glass Mg/Nm³ kg/t glass
Dust 10-20 0.015-0.06 10-20 0.025-0.05 10-20 0.02-0.05
Carbon monoxide 100 - 100 - 100 -
Nitrogen oxides NO2 100-800 0.3-1.2 400-1.200 1-3 200-700 0.4-1.25
Sulphur oxides SO2
(natural gas furnace) 200-500 0.3-0.75 300-500 0.75-1.25
50-1,400 0.1-3.5 Sulphur oxides SO2
(heating oil furnace) 500-1,200 0.75-1.8 500-1,300 1.25-3.25
Emission ranges for the most important emission sources, simplified and grouped illustration. Source: Official Journal of the European Union 2012
The limit values for nitrogen oxides and sulphur oxides are the most decisive ones. Complying with
these values is the toughest challenge for most glass factory operators.
The most significant change, however, is not the tightening of individual values (as those were only
changed in specific cases). The fact that these values are now obliging throughout the EU and are
no longer only recommending, is much more important. […]

Extract, Chapter 7, National markets and sites, France
Glass factories under the Industrial Emissions Directive 108
ecoprog GmbH, www.ecoprog.com
ecoprog
7.7 France
Inhabitants [million] 66 Production sites under IED 46
EU ranking glass production [No./26] 2 Ø capacity of sites [estimated in 1,000 t/a] 93
EU ranking investments 2014-2020 [Nr./26] 4 Investments 2014-2020 [million EUR] 1,417
Management summary
France has the second largest glass manufacturing industry in Europe. Investments to modernise it
have been low in the past years. Many glass factories are out-of-date and some of them even lack
flue gas cleaning. There thus is a pressure to modernise this infrastructure, which is one again
intensified by the IED. This is why investments in modernising the French glass factories will
increase within the next two years especially.
Structure of the glass industry
France is one of the largest European glass manufacturers. About 1,300 companies are active in
this industry. The French industry is dominated by large enterprises: its 88 active large companies
employ 87 per cent of all staff and generate about 90 per cent of the overall industry’s turnover.
The IED affects 46 manufacturing sites, where approximately 20 per cent of the industry’s
employees work.
Figure 71: Structure of glass industry in France
< 50 employees 50+ employees Total EU ranking (No./26)
Companies 1,215 88 1,303 3
Staff 5,203 41,895 47,098 2
Turnover [m EUR] 764 6.901 7.665 2
[…]
6%
27%
55%
4%8%
Share of employees per sector
2%
35%
28%1%
34%
Share of enterprises per sector
13%
28%
45%
8%6%
Share of total revenue per sector
Source: Eurostat 2013
Flat glass
Processing of flat glass
Container glass
Glass fibre
Other
Share of turnover per sector

Extract, Chapter 7, National markets and sites, Italy
Glass factories under the Industrial Emissions Directive 128
ecoprog GmbH, www.ecoprog.com
ecoprog
Figure 41: Glass factories in Italy
Map for extract:
The map in the study will show all sites.
Extract, Chapter 7, National markets and sites, Poland
Glass factories under the Industrial Emissions Directive 172
ecoprog GmbH, www.ecoprog.com
ecoprog
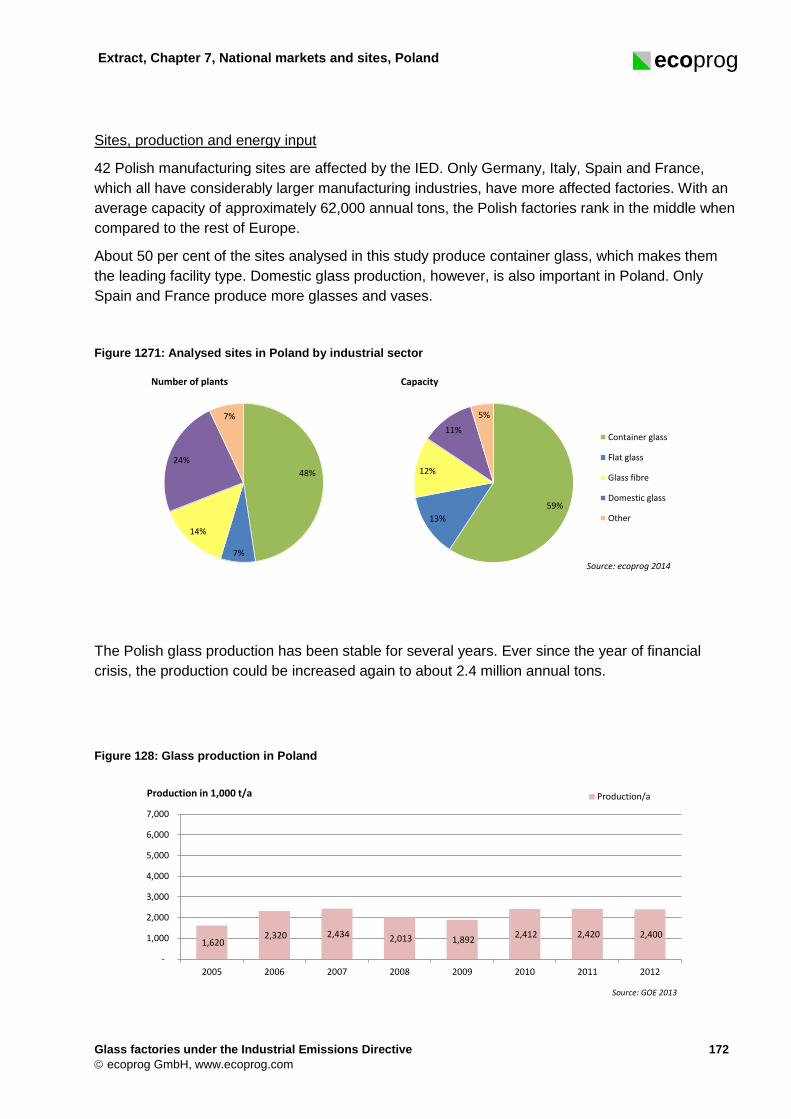
Sites, production and energy input
42 Polish manufacturing sites are affected by the IED. Only Germany, Italy, Spain and France,
which all have considerably larger manufacturing industries, have more affected factories. With an
average capacity of approximately 62,000 annual tons, the Polish factories rank in the middle when
compared to the rest of Europe.
About 50 per cent of the sites analysed in this study produce container glass, which makes them
the leading facility type. Domestic glass production, however, is also important in Poland. Only
Spain and France produce more glasses and vases.
Figure 1271: Analysed sites in Poland by industrial sector
The Polish glass production has been stable for several years. Ever since the year of financial
crisis, the production could be increased again to about 2.4 million annual tons.
Figure 128: Glass production in Poland
48%
7%
14%
24%
7%
Number of plants
59%
13%
12%
11%
5%
Capacity
Container glass
Flat glass
Glass fibre
Domestic glass
Other
Source: ecoprog 2014
1,620 2,320 2,434 2,013 1,892
2,412 2,420 2,400
-
1,000
2,000
3,000
4,000
5,000
6,000
7,000
2005 2006 2007 2008 2009 2010 2011 2012
Production/aProduction in 1,000 t/a
Source: GOE 2013

Extract, Chapter 7, National markets and sites, Romania
Glass factories under the Industrial Emissions Directive 191
ecoprog GmbH, www.ecoprog.com
ecoprog
[…]
Sites, production and energy input
[…]
Most Romanian glass factories use natural gas. Heating oil also continues to play an important role
for generating energy, which is a sign for partly out-of-date factories, as natural gas is the
dominating fuel type of more recent glass furnaces.
Figure 141: Glass industry’s energy purchase in Romania
Adjustment and modernisation needs
About 24 million EUR have been invested annually in the Romanian glass industry over the past
years. This is circa 11 per cent of the overall industry’s turnover.
The nine affected glass factories will have to invest large amounts after the new limit values are put
into national law. The values are either significantly stricter than the ones in effect or they will be
introduced for the first time.
The best investment opportunities for modernisations and new constructions will develop in the flue
gas cleaning sector. Investments will especially increase in 2016 and 2017. In line with its large
production volume, the container glass industry will face the highest investment needs.
Figure 142: Investment potential by industrial sector in Romania 2014-2020
[…]
1020
0
100
200
300
400
500
600
Electricity Heat
million €
31%
68%
1%
Oil
Gas
District heat
Share of thermal energy per fuel type
21%
76%
3%Flat glass
Processing of flat glass
Container glass
Glass fibre
Other
Share of energy purchase by type of glass
Source: Estimation based on Eurostat
152 -
1,000
2,000
3,000
4,000
5,000
Investmentsum
million €
18%
56%
26% Flat glass
Container glass
Glass fibre
Other
Source: prognosis by ecoprog
Extract, Chapter 7, National markets and sites, Austria
Glass factories under the Industrial Emissions Directive 168
ecoprog GmbH, www.ecoprog.com
ecoprog
Adjustment and modernisation needs
[…]
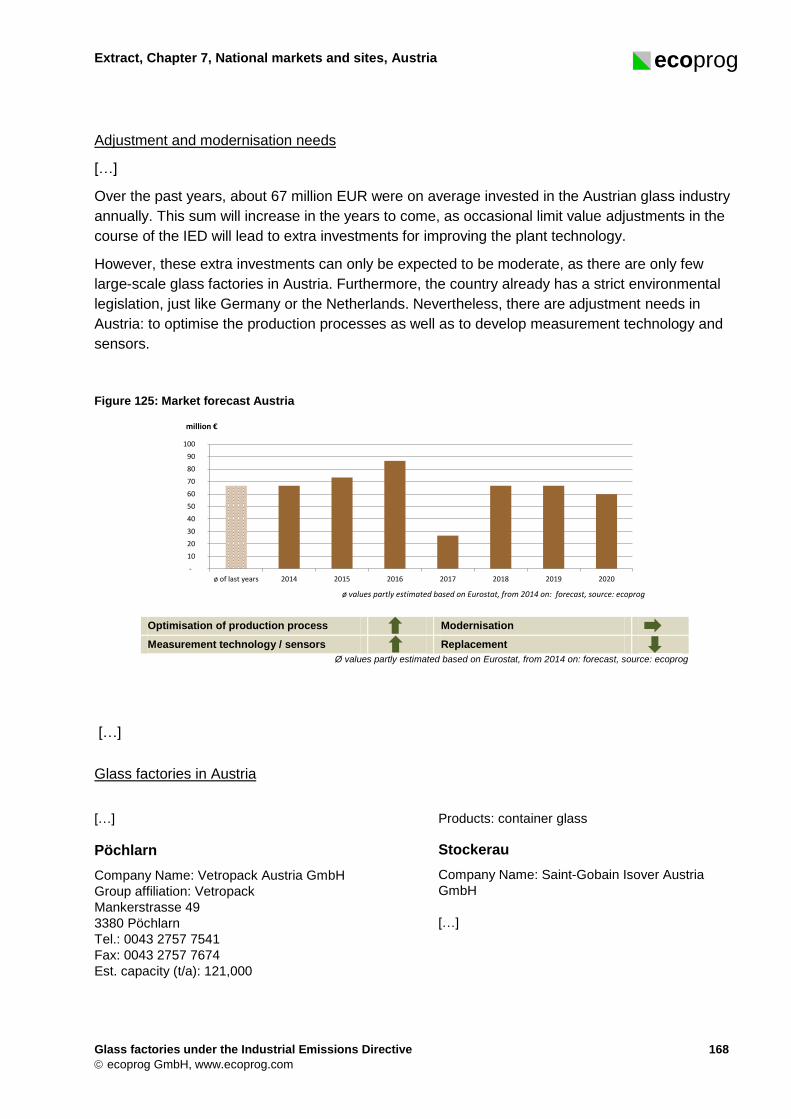
Over the past years, about 67 million EUR were on average invested in the Austrian glass industry
annually. This sum will increase in the years to come, as occasional limit value adjustments in the
course of the IED will lead to extra investments for improving the plant technology.
However, these extra investments can only be expected to be moderate, as there are only few
large-scale glass factories in Austria. Furthermore, the country already has a strict environmental
legislation, just like Germany or the Netherlands. Nevertheless, there are adjustment needs in
Austria: to optimise the production processes as well as to develop measurement technology and
sensors.
Figure 125: Market forecast Austria
Optimisation of production process Modernisation
Measurement technology / sensors Replacement Ø values partly estimated based on Eurostat, from 2014 on: forecast, source: ecoprog
[…]
Glass factories in Austria
[…]
Pöchlarn
Company Name: Vetropack Austria GmbH
Group affiliation: Vetropack
Mankerstrasse 49
3380 Pöchlarn
Tel.: 0043 2757 7541
Fax: 0043 2757 7674
Est. capacity (t/a): 121,000
Products: container glass
Stockerau
Company Name: Saint-Gobain Isover Austria
GmbH
[…]
-
10
20
30
40
50
60
70
80
90
100
ø of last years 2014 2015 2016 2017 2018 2019 2020
million €
ø values partly estimated based on Eurostat, from 2014 on: forecast, source: ecoprog

Extract, Chapter 7, National markets and sites, United Kingdom
Glass factories under the Industrial Emissions Directive 246
ecoprog GmbH, www.ecoprog.com
ecoprog
Glass factories in the United Kingdom
[…]
UK-08
Wigan
Company Name: PPG Industries (UK) ltd
Group affiliation: PPG
Leigh Road Hindley Green
WN2 4XG Wigan
Tel.: 0044 1942 257161
Fax: 0044 1942 522385
Est. capacity (t/a): 54,000
Products: fiber glass
Remarks: The plant is using oxygen melting
technology.
UK-09
Runcorn
Company Name: BPB United Kingdom Limited
Group affiliation: Saint Gobain
Whitehouselnd Estate
WA7 3DP Runcorn
Est. capacity (t/a): 25,000
Products: insulation wool
UK-10
Leeds
Company Name: Allied Glass Containers Ltd
Group affiliation: AGC
South Accommodation Road
LS10 1NQ Leeds
Tel.: 0044 113 2451568
Fax: 0044 113 2449349
Est. capacity (t/a): 75,000
Products: glass bottles
UK-11
Barnsley
Company Name: Ardagh Glass Limited
Group affiliation: Ardagh
Bouron Road Monk Bretton
S71 SQG Barnsley
Tel.: 0044 1226710211
Fax: 0044 1226 716808
Est. capacity (t/a): 182,000
Products: packaging glass
UK-12
Pencoed
Company Name: Rockwool Limited
Group affiliation: Rockwool
CF35 6NY Pencoed
Tel.: 0044 1656 862621
Est. capacity (t/a): 197,000
Products: mineral wool, insulation
Employees: 350
UK-13
Knottingley 1
Company Name: Allied Glass Containers Ltd
Group affiliation: AGC
Fernley Green Road
WF11 8DH Knottingley 1
Tel.: 0044 1977 672661
Est. capacity (t/a): 65,000
Products: glass bottles
UK-14
Knottingley 2
Company Name: Ardagh Glass Limited
Group affiliation: Ardagh
Headlands Lane
W11 0HP Knottingley 2
Tel.: 0044 1977 674111
Fax: 0044 1977 635821
Est. capacity (t/a): 84,000
Products: packaging glass
[…]

ecoprog
Price and product information
Contact:
+49 (0) 221 788 03 88 14
You can order the market report here:
https://www.ecoprog.com/publikationen/energiewirtschaft/glaswerke-ier/order-glaswerke.htm
Price models:
Single user copy: 2,900,- EUR plus VAT
Company version: 5,800,- EUR plus VAT
Corporate version: POA
Explanation:
Single user copy: personal copy (personalised and password-protected PDF file, sent via e-mail)
Company version: company-wide copy (legal entity), sent via email
Corporate version: for different, legally connected companies (e.g. sister companies, subsidiaries abroad). Price depends on number of companies and employees
Additionally, you can order copies of the study on paper (hardcover book).
Price: 150,- EUR plus VAT per book.


![].pdf · Best Available Techniques (BAT) Reference Document for Common Waste Gas Management and Treatment Systems in the Chemical Sector . Industrial Emissions Directive 2010/75/EU](https://img.pdfslide.us/doc/110x75/5f40727f171ef02d0d32a4a8/1pdf-best-available-techniques-bat-reference-document-for-common-waste-gas.jpg)