Embed Size (px)
Citation preview
Ixtaina et al. International Journal of Mechanical andMaterials Engineering (2015) 10:1 DOI 10.1186/s40712-014-0027-2
ORIGINAL ARTICLE Open Access
Glare by Light Emitting Diode (LED) vehicle trafficsignalsPablo Ixtaina1*, Matias Presso2, Nicolás Rosales1 and Gustavo H Marin3
Abstract
Background: In this paper we analyze devices for traffic signals (traffic lights) with light-emitting diode (LED)technology.
Methods: The traditional measurements of luminous intensity were complemented with the luminance analysis ofthe devices, evaluated for diverse angular fields. Besides, a subjective glare evaluation is presented. In theexperience, signals with LEDs directly visible and signals with refractors are compared. Both signals were introducedin the visual field of 30 observers within a perceptive scene that simulated night vision conditions for a driver. Theobservers were later inquired about the experienced perturbation or discomfort sensation.
Results: The obtained results show a significant increase in the punctual luminance as well as an evidentperturbation and discomfort for the observers.
Conclusions: This effect together with the relatively high degree of coherence of the color lights could result innew kinds of glares not considered in the current standards.
BackgroundThe present study has its origin in the claims of roadusers about the presumed visual perturbation that thesignaling devices using LED as lighting source produced.Specifically, the luminous signals referred as “annoying”had the characteristic of having LEDs individually vis-ible. The sign that represented the signal (a circumfer-ence, an arrow, letter, etc.) was formed by the sum ofluminous dots and was seen as homogeneous only at aconsiderable distance. The glare effect was also observedby the laboratory technicians in charge of photometry,who normally observe the signal when centering andadjusting the measurement system. The effect was veri-fied in devices whose emitted luminous intensities werenot so different from those of “conventional” devices,considering the latter as uniformly illuminated (whetherthey use LEDs or another luminous source).Figure 1 shows the LEDs individually visible studied
devices. The diameters of the used LEDs ranged between
* Correspondence: [email protected] de Acústica y Luminotecnia de la Comisión de Investigaciones,Científicas de la Provincia de Buenos Aires LAL CIC, Camino Centenario y506, 1897 Gonnet, La Plata, ArgentinaFull list of author information is available at the end of the article
© 2015 Ixtaina et al.; licensee Springer. This is aAttribution License (http://creativecommons.orin any medium, provided the original work is p
2 and 5 mm, while the separation between the observedadjacent elements was 12 mm.The effect under study appears when the signal begins
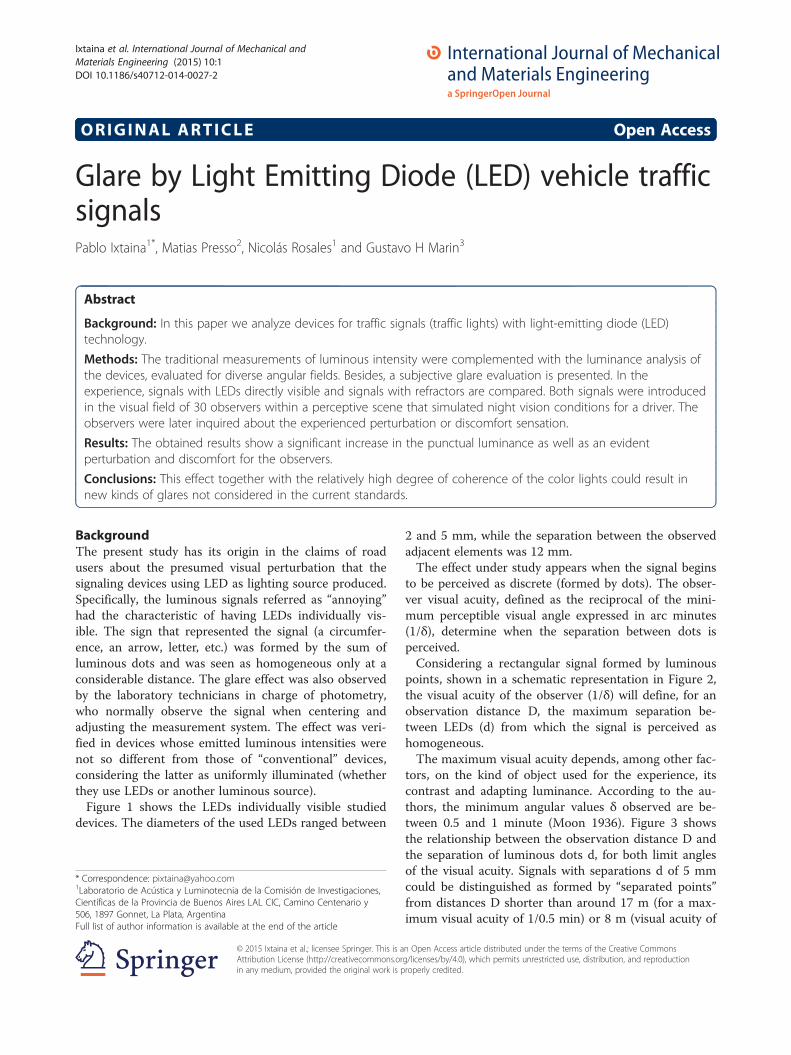
to be perceived as discrete (formed by dots). The obser-ver visual acuity, defined as the reciprocal of the mini-mum perceptible visual angle expressed in arc minutes(1/δ), determine when the separation between dots isperceived.Considering a rectangular signal formed by luminous
points, shown in a schematic representation in Figure 2,the visual acuity of the observer (1/δ) will define, for anobservation distance D, the maximum separation be-tween LEDs (d) from which the signal is perceived ashomogeneous.The maximum visual acuity depends, among other fac-
tors, on the kind of object used for the experience, itscontrast and adapting luminance. According to the au-thors, the minimum angular values δ observed are be-tween 0.5 and 1 minute (Moon 1936). Figure 3 showsthe relationship between the observation distance D andthe separation of luminous dots d, for both limit anglesof the visual acuity. Signals with separations d of 5 mmcould be distinguished as formed by “separated points”from distances D shorter than around 17 m (for a max-imum visual acuity of 1/0.5 min) or 8 m (visual acuity of
n Open Access article distributed under the terms of the Creative Commonsg/licenses/by/4.0), which permits unrestricted use, distribution, and reproductionroperly credited.
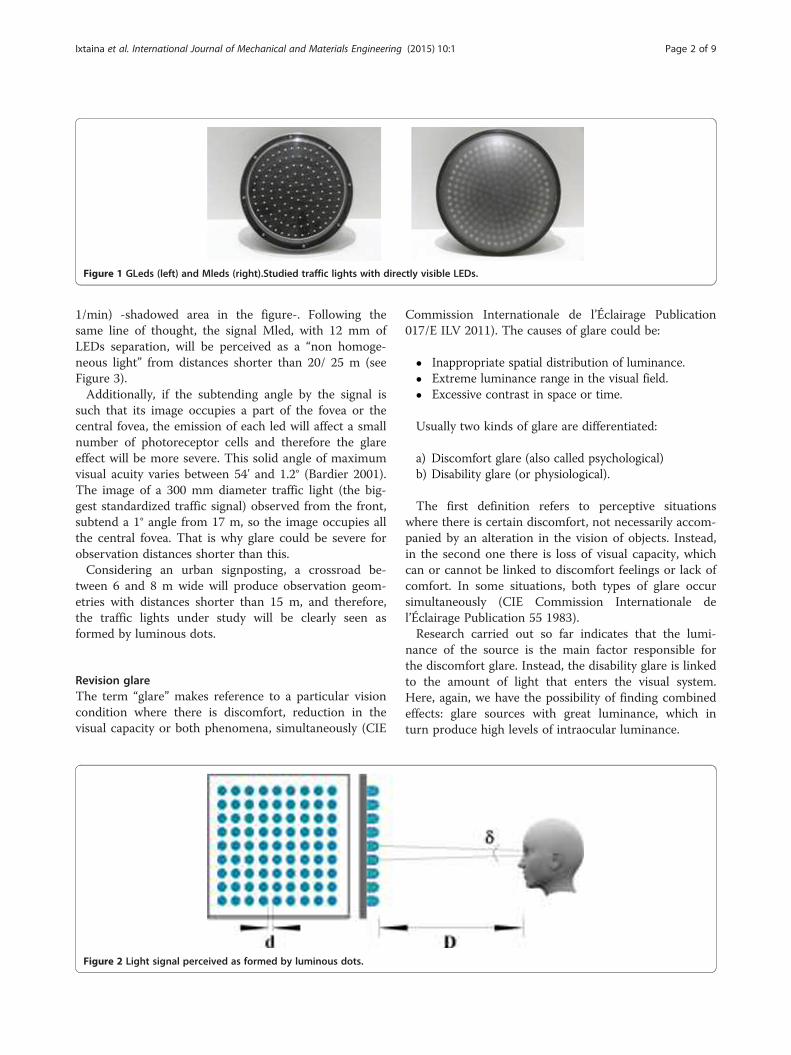
Figure 1 GLeds (left) and Mleds (right).Studied traffic lights with directly visible LEDs.
Ixtaina et al. International Journal of Mechanical and Materials Engineering (2015) 10:1 Page 2 of 9
1/min) -shadowed area in the figure-. Following thesame line of thought, the signal Mled, with 12 mm ofLEDs separation, will be perceived as a “non homoge-neous light” from distances shorter than 20/ 25 m (seeFigure 3).Additionally, if the subtending angle by the signal is
such that its image occupies a part of the fovea or thecentral fovea, the emission of each led will affect a smallnumber of photoreceptor cells and therefore the glareeffect will be more severe. This solid angle of maximumvisual acuity varies between 54' and 1.2° (Bardier 2001).The image of a 300 mm diameter traffic light (the big-gest standardized traffic signal) observed from the front,subtend a 1° angle from 17 m, so the image occupies allthe central fovea. That is why glare could be severe forobservation distances shorter than this.Considering an urban signposting, a crossroad be-
tween 6 and 8 m wide will produce observation geom-etries with distances shorter than 15 m, and therefore,the traffic lights under study will be clearly seen asformed by luminous dots.
Revision glareThe term “glare” makes reference to a particular visioncondition where there is discomfort, reduction in thevisual capacity or both phenomena, simultaneously (CIE
Figure 2 Light signal perceived as formed by luminous dots.
Commission Internationale de l’Éclairage Publication017/E ILV 2011). The causes of glare could be:
� Inappropriate spatial distribution of luminance.� Extreme luminance range in the visual field.� Excessive contrast in space or time.
Usually two kinds of glare are differentiated:
a) Discomfort glare (also called psychological)b) Disability glare (or physiological).
The first definition refers to perceptive situationswhere there is certain discomfort, not necessarily accom-panied by an alteration in the vision of objects. Instead,in the second one there is loss of visual capacity, whichcan or cannot be linked to discomfort feelings or lack ofcomfort. In some situations, both types of glare occursimultaneously (CIE Commission Internationale del’Éclairage Publication 55 1983).Research carried out so far indicates that the lumi-
nance of the source is the main factor responsible forthe discomfort glare. Instead, the disability glare is linkedto the amount of light that enters the visual system.Here, again, we have the possibility of finding combinedeffects: glare sources with great luminance, which inturn produce high levels of intraocular luminance.
0,0
2,0
4,0
6,0
8,0
10,0
12,0
0 5 10 15 20
Observation distance D [m]
Sep
arat
ion
d [m
m]
1 min.
0.5 min.
Figure 3 Distances to distinguish “dots” for different LEDs separations and visual acuities.
Ixtaina et al. International Journal of Mechanical and Materials Engineering (2015) 10:1 Page 3 of 9
Glare is caused by a complex combination of diversefactors: a glare source in a determined position, an ob-servation direction, a background luminance, etc. Thevalues or indexes used as control parameters depend onthe model used for describing the glare situation to beassessed. These experimental models have been orientedto “static” indoor lighting on one hand and to “dynamic”road lighting on the other. The glare produced by trafficsignals involves a new perception model to be studied.
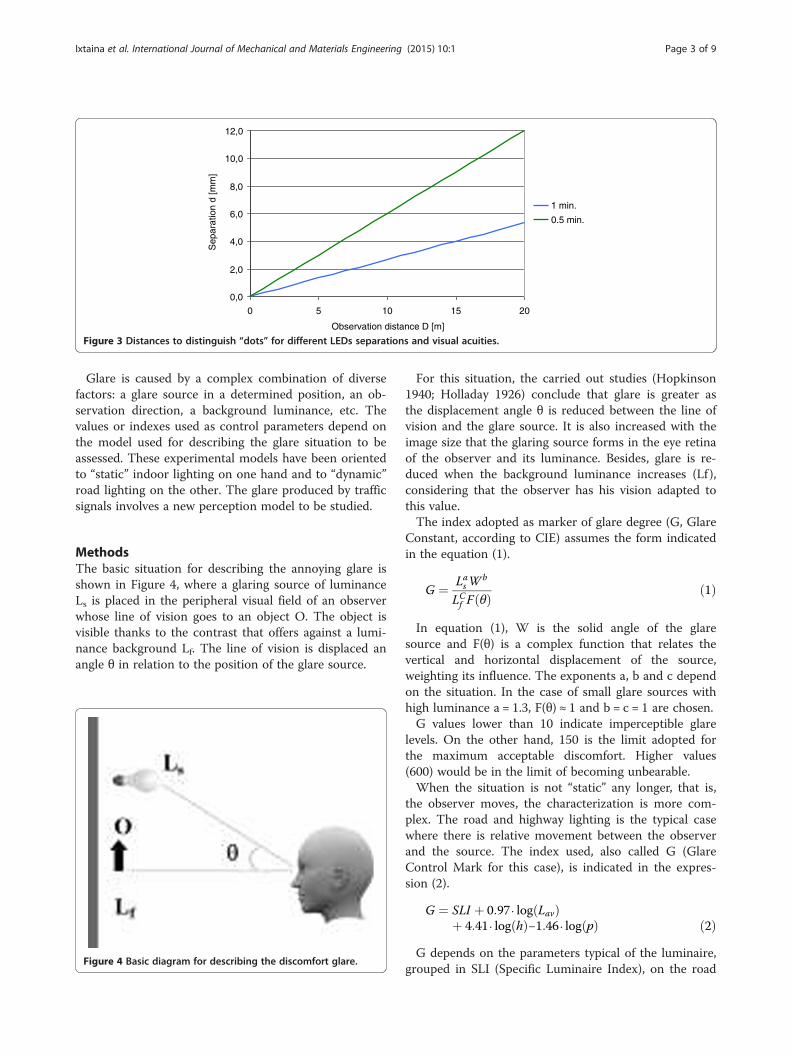
MethodsThe basic situation for describing the annoying glare isshown in Figure 4, where a glaring source of luminanceLs is placed in the peripheral visual field of an observerwhose line of vision goes to an object O. The object isvisible thanks to the contrast that offers against a lumi-nance background Lf. The line of vision is displaced anangle θ in relation to the position of the glare source.
Figure 4 Basic diagram for describing the discomfort glare.
For this situation, the carried out studies (Hopkinson1940; Holladay 1926) conclude that glare is greater asthe displacement angle θ is reduced between the line ofvision and the glare source. It is also increased with theimage size that the glaring source forms in the eye retinaof the observer and its luminance. Besides, glare is re-duced when the background luminance increases (Lf ),considering that the observer has his vision adapted tothis value.The index adopted as marker of glare degree (G, Glare
Constant, according to CIE) assumes the form indicatedin the equation (1).
G ¼ LasWb
LCf F θð Þ ð1Þ
In equation (1), W is the solid angle of the glaresource and F(θ) is a complex function that relates thevertical and horizontal displacement of the source,weighting its influence. The exponents a, b and c dependon the situation. In the case of small glare sources withhigh luminance a = 1.3, F(θ) ≈ 1 and b = c = 1 are chosen.G values lower than 10 indicate imperceptible glare
levels. On the other hand, 150 is the limit adopted forthe maximum acceptable discomfort. Higher values(600) would be in the limit of becoming unbearable.When the situation is not “static” any longer, that is,
the observer moves, the characterization is more com-plex. The road and highway lighting is the typical casewhere there is relative movement between the observerand the source. The index used, also called G (GlareControl Mark for this case), is indicated in the expres-sion (2).
G ¼ SLI þ 0:97⋅ log Lavð Þþ 4:41⋅ log hð Þ−1:46⋅ log pð Þ ð2Þ
G depends on the parameters typical of the luminaire,grouped in SLI (Specific Luminaire Index), on the road
Ixtaina et al. International Journal of Mechanical and Materials Engineering (2015) 10:1 Page 4 of 9
average luminance (Lav), vertical distance between theobserver and the height of luminary assembly (h), andthe number of luminaires per kilometer (p).The scale used is inverse to the previous case: low
values (≈1) indicate unacceptable glare (van Bommel &de Boer 1982; Publication CIE N° 30–2 (TC-4.6) 1982).
Disability glareThe method used to assess the disability glare is basedon Holladay, Adrian and Schreuder’s studies, amongothers (Holladay 1926; Adrian & Schreuder 1970). Tak-ing as starting point a diagram similar to that of Figure 1,the veil over the observed objects produced by the lightof the glare source entering the eye was estimated. Theeffect was quantified with the equivalent veiling lumi-nance Lv.
Lv ¼ 10Eeye
θ2ð3Þ
The equivalent veiling luminance depends directly onthe iluminance produced by the glare source over theeye, in a perpendicular plane to the vision line (Eeye)and inversely with the square of the angle between thevision line and the glare source (in degrees). The expres-sion (3) has as application limit θ values lower than 60°and there are also corrections according to the ob-server’s age (Adrian & Schreuder 1970; Fisher & Christie1965).The veiling luminance is added to both background lu-
minance and object luminance, what determines an ef-fective loss of contrast. Thus, in order that the objectremains with the same degree of visibility, the contrastin scene with glare source should be increased in the so-called “perception threshold” TI, obtained with the em-piric expression (4).
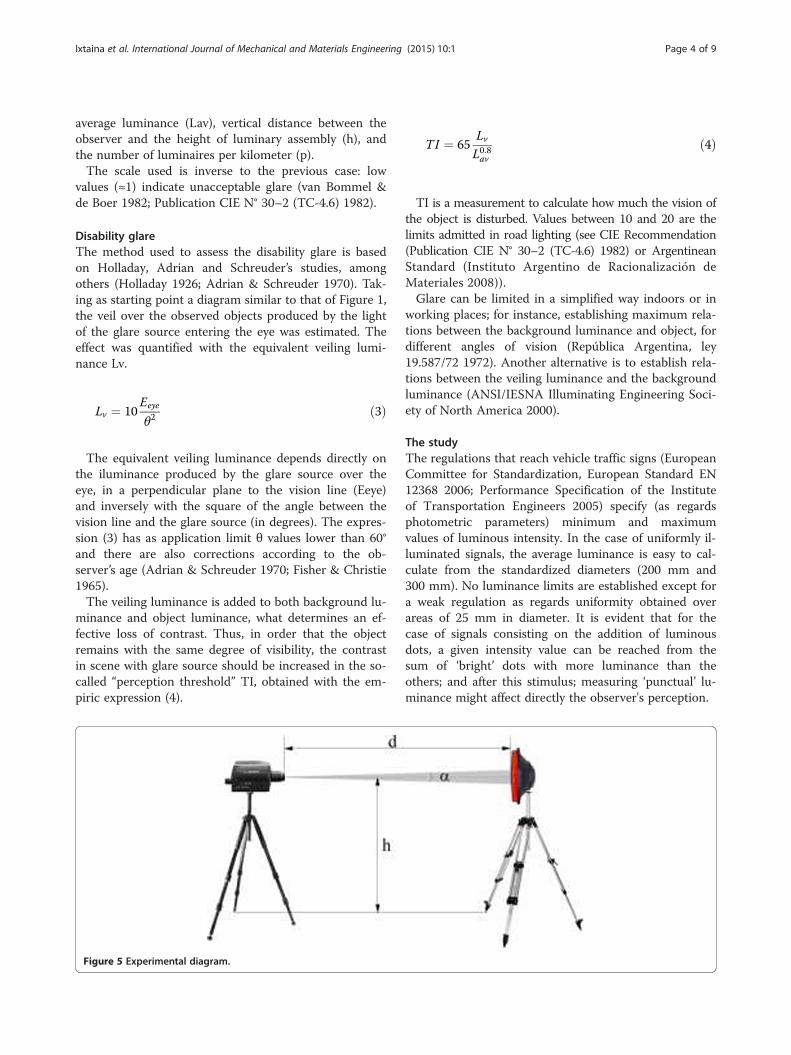
Figure 5 Experimental diagram.
TI ¼ 65LvL0:8av
ð4Þ
TI is a measurement to calculate how much the vision ofthe object is disturbed. Values between 10 and 20 are thelimits admitted in road lighting (see CIE Recommendation(Publication CIE N° 30–2 (TC-4.6) 1982) or ArgentineanStandard (Instituto Argentino de Racionalización deMateriales 2008)).Glare can be limited in a simplified way indoors or in
working places; for instance, establishing maximum rela-tions between the background luminance and object, fordifferent angles of vision (República Argentina, ley19.587/72 1972). Another alternative is to establish rela-tions between the veiling luminance and the backgroundluminance (ANSI/IESNA Illuminating Engineering Soci-ety of North America 2000).
The studyThe regulations that reach vehicle traffic signs (EuropeanCommittee for Standardization, European Standard EN12368 2006; Performance Specification of the Instituteof Transportation Engineers 2005) specify (as regardsphotometric parameters) minimum and maximumvalues of luminous intensity. In the case of uniformly il-luminated signals, the average luminance is easy to cal-culate from the standardized diameters (200 mm and300 mm). No luminance limits are established except fora weak regulation as regards uniformity obtained overareas of 25 mm in diameter. It is evident that for thecase of signals consisting on the addition of luminousdots, a given intensity value can be reached from thesum of ‘bright’ dots with more luminance than theothers; and after this stimulus; measuring ‘punctual’ lu-minance might affect directly the observer's perception.
Traffic Lights Luminance
1,00E+03
1,00E+04
1,00E+05
1,00E+06
0 5 10 15 20 25 30 35 40
Aperture d [mm]
L [c
d/m
2]
Gleds Green Gleds Yellow Gleds Red
Mleds Green Mleds Yellow Mleds Red
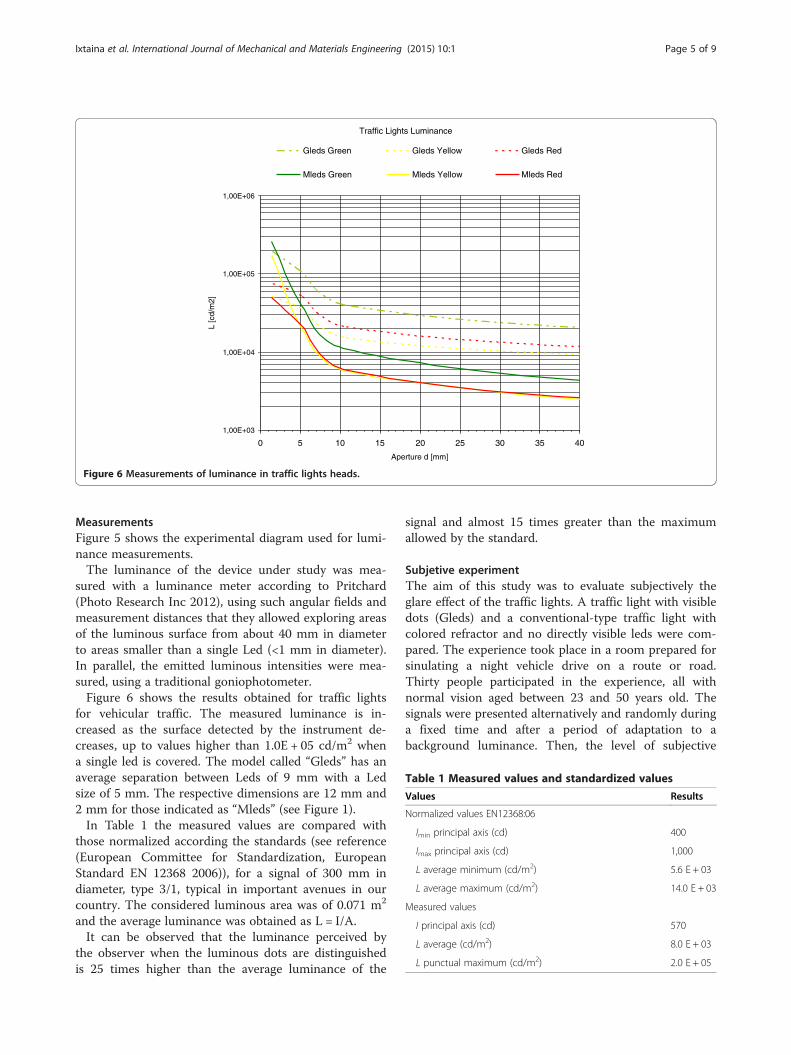
Figure 6 Measurements of luminance in traffic lights heads.
Table 1 Measured values and standardized values
Values Results
Normalized values EN12368:06
Imin principal axis (cd) 400
Imax principal axis (cd) 1,000
L average minimum (cd/m2) 5.6 E + 03
L average maximum (cd/m2) 14.0 E + 03
Measured values
I principal axis (cd) 570
L average (cd/m2) 8.0 E + 03
L punctual maximum (cd/m2) 2.0 E + 05
Ixtaina et al. International Journal of Mechanical and Materials Engineering (2015) 10:1 Page 5 of 9
MeasurementsFigure 5 shows the experimental diagram used for lumi-nance measurements.The luminance of the device under study was mea-
sured with a luminance meter according to Pritchard(Photo Research Inc 2012), using such angular fields andmeasurement distances that they allowed exploring areasof the luminous surface from about 40 mm in diameterto areas smaller than a single Led (<1 mm in diameter).In parallel, the emitted luminous intensities were mea-sured, using a traditional goniophotometer.Figure 6 shows the results obtained for traffic lights
for vehicular traffic. The measured luminance is in-creased as the surface detected by the instrument de-creases, up to values higher than 1.0E + 05 cd/m2 whena single led is covered. The model called “Gleds” has anaverage separation between Leds of 9 mm with a Ledsize of 5 mm. The respective dimensions are 12 mm and2 mm for those indicated as “Mleds” (see Figure 1).In Table 1 the measured values are compared with
those normalized according the standards (see reference(European Committee for Standardization, EuropeanStandard EN 12368 2006)), for a signal of 300 mm indiameter, type 3/1, typical in important avenues in ourcountry. The considered luminous area was of 0.071 m2
and the average luminance was obtained as L = I/A.It can be observed that the luminance perceived by
the observer when the luminous dots are distinguishedis 25 times higher than the average luminance of the
signal and almost 15 times greater than the maximumallowed by the standard.
Subjetive experimentThe aim of this study was to evaluate subjectively theglare effect of the traffic lights. A traffic light with visibledots (Gleds) and a conventional-type traffic light withcolored refractor and no directly visible leds were com-pared. The experience took place in a room prepared forsinulating a night vehicle drive on a route or road.Thirty people participated in the experience, all withnormal vision aged between 23 and 50 years old. Thesignals were presented alternatively and randomly duringa fixed time and after a period of adaptation to abackground luminance. Then, the level of subjective
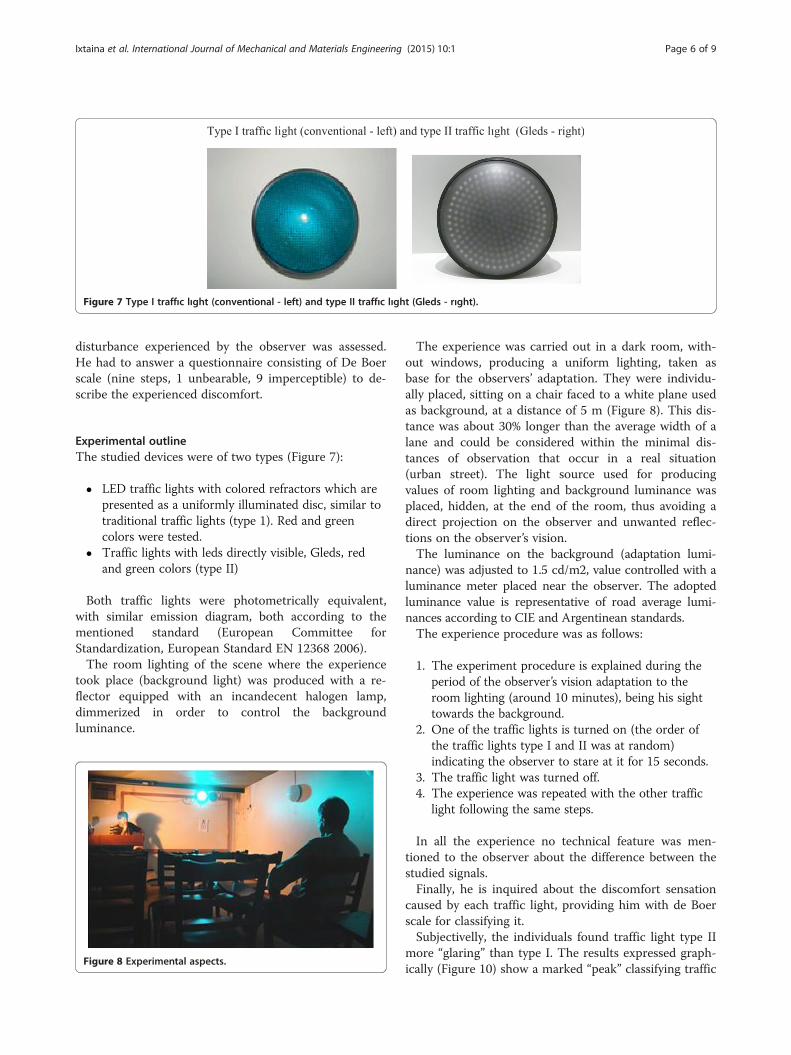
Figure 7 Type I traffıc lıght (conventional - left) and type II traffıc lıght (Gleds - rıght).
Ixtaina et al. International Journal of Mechanical and Materials Engineering (2015) 10:1 Page 6 of 9
disturbance experienced by the observer was assessed.He had to answer a questionnaire consisting of De Boerscale (nine steps, 1 unbearable, 9 imperceptible) to de-scribe the experienced discomfort.
Experimental outlineThe studied devices were of two types (Figure 7):
� LED traffic lights with colored refractors which arepresented as a uniformly illuminated disc, similar totraditional traffic lights (type 1). Red and greencolors were tested.
� Traffic lights with leds directly visible, Gleds, redand green colors (type II)
Both traffic lights were photometrically equivalent,with similar emission diagram, both according to thementioned standard (European Committee forStandardization, European Standard EN 12368 2006).The room lighting of the scene where the experience
took place (background light) was produced with a re-flector equipped with an incandecent halogen lamp,dimmerized in order to control the backgroundluminance.
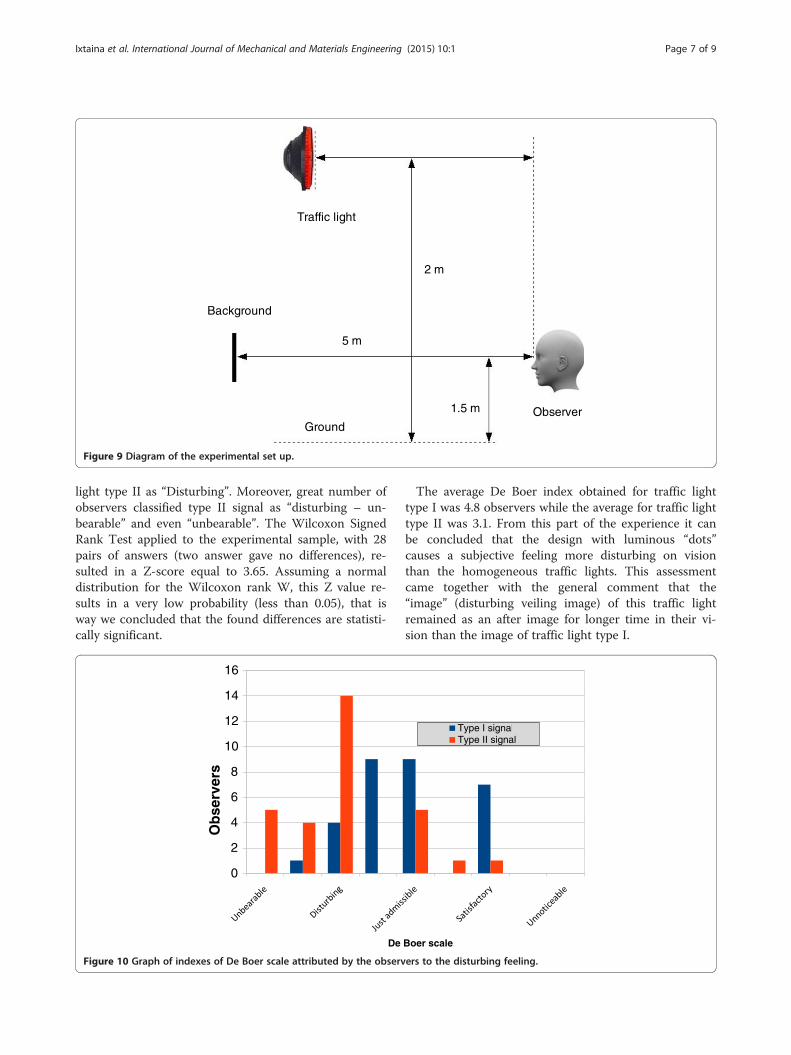
Figure 8 Experimental aspects.
The experience was carried out in a dark room, with-out windows, producing a uniform lighting, taken asbase for the observers’ adaptation. They were individu-ally placed, sitting on a chair faced to a white plane usedas background, at a distance of 5 m (Figure 8). This dis-tance was about 30% longer than the average width of alane and could be considered within the minimal dis-tances of observation that occur in a real situation(urban street). The light source used for producingvalues of room lighting and background luminance wasplaced, hidden, at the end of the room, thus avoiding adirect projection on the observer and unwanted reflec-tions on the observer’s vision.The luminance on the background (adaptation lumi-
nance) was adjusted to 1.5 cd/m2, value controlled with aluminance meter placed near the observer. The adoptedluminance value is representative of road average lumi-nances according to CIE and Argentinean standards.The experience procedure was as follows:
1. The experiment procedure is explained during theperiod of the observer’s vision adaptation to theroom lighting (around 10 minutes), being his sighttowards the background.
2. One of the traffic lights is turned on (the order ofthe traffic lights type I and II was at random)indicating the observer to stare at it for 15 seconds.
3. The traffic light was turned off.4. The experience was repeated with the other traffic
light following the same steps.
In all the experience no technical feature was men-tioned to the observer about the difference between thestudied signals.Finally, he is inquired about the discomfort sensation
caused by each traffic light, providing him with de Boerscale for classifying it.Subjectivelly, the individuals found traffic light type II
more “glaring” than type I. The results expressed graph-ically (Figure 10) show a marked “peak” classifying traffic
Traffic light
Observer
5 m
Background
2 m
1.5 m
Ground
Figure 9 Diagram of the experimental set up.
Ixtaina et al. International Journal of Mechanical and Materials Engineering (2015) 10:1 Page 7 of 9
light type II as “Disturbing”. Moreover, great number ofobservers classified type II signal as “disturbing – un-bearable” and even “unbearable”. The Wilcoxon SignedRank Test applied to the experimental sample, with 28pairs of answers (two answer gave no differences), re-sulted in a Z-score equal to 3.65. Assuming a normaldistribution for the Wilcoxon rank W, this Z value re-sults in a very low probability (less than 0.05), that isway we concluded that the found differences are statisti-cally significant.
0
2
4
6
8
10
12
14
16
Ob
serv
ers
De
Figure 10 Graph of indexes of De Boer scale attributed by the observ
The average De Boer index obtained for traffic lighttype I was 4.8 observers while the average for traffic lighttype II was 3.1. From this part of the experience it canbe concluded that the design with luminous “dots”causes a subjective feeling more disturbing on visionthan the homogeneous traffic lights. This assessmentcame together with the general comment that the“image” (disturbing veiling image) of this traffic lightremained as an after image for longer time in their vi-sion than the image of traffic light type I.
Boer scale
Type I signalType II signal
ers to the disturbing feeling.
Glare Constant - G
1,00E-07
1,00E-05
1,00E-03
1,00E-01
1,00E+01
1,00E+03
1,00E+05
1,00E+00 1,00E+01 1,00E+02 1,00E+03 1,00E+04 1,00E+05
Ls [cd/m2]
G
G (day 5 m) G (day 10 m) G (night 5 m) G (night 10 m)
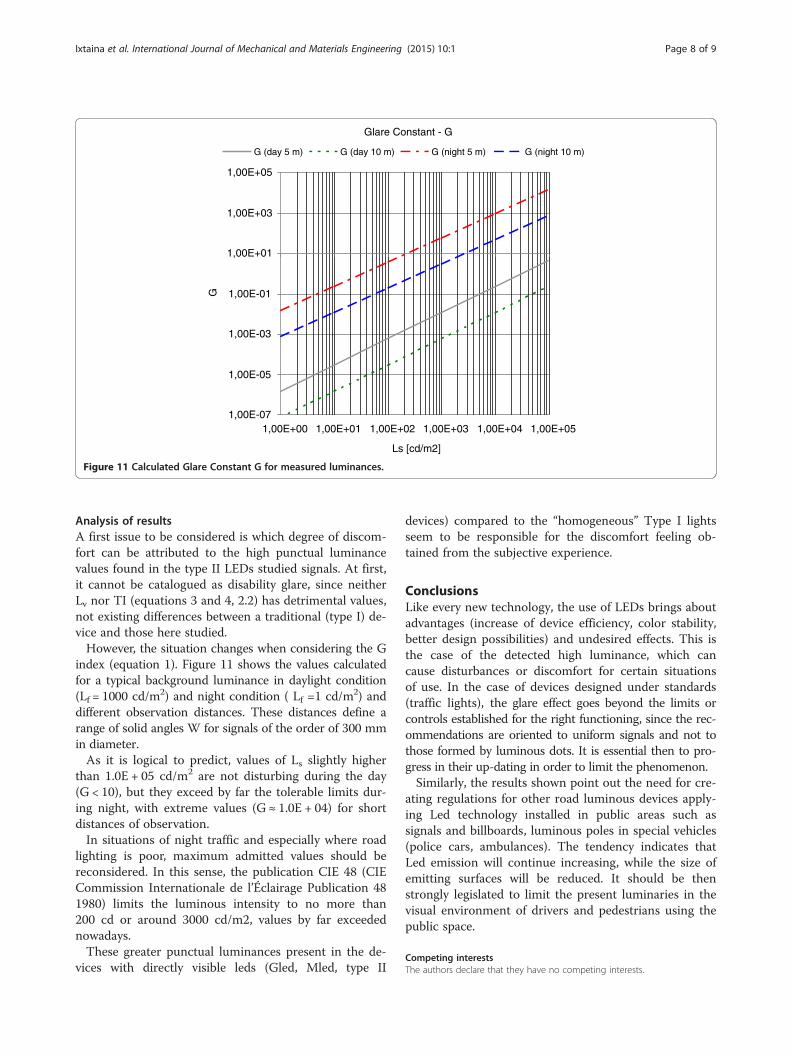
Figure 11 Calculated Glare Constant G for measured luminances.
Ixtaina et al. International Journal of Mechanical and Materials Engineering (2015) 10:1 Page 8 of 9
Analysis of resultsA first issue to be considered is which degree of discom-fort can be attributed to the high punctual luminancevalues found in the type II LEDs studied signals. At first,it cannot be catalogued as disability glare, since neitherLv nor TI (equations 3 and 4, 2.2) has detrimental values,not existing differences between a traditional (type I) de-vice and those here studied.However, the situation changes when considering the G
index (equation 1). Figure 11 shows the values calculatedfor a typical background luminance in daylight condition(Lf = 1000 cd/m2) and night condition ( Lf =1 cd/m2) anddifferent observation distances. These distances define arange of solid angles W for signals of the order of 300 mmin diameter.As it is logical to predict, values of Ls slightly higher
than 1.0E + 05 cd/m2 are not disturbing during the day(G < 10), but they exceed by far the tolerable limits dur-ing night, with extreme values (G ≈ 1.0E + 04) for shortdistances of observation.In situations of night traffic and especially where road
lighting is poor, maximum admitted values should bereconsidered. In this sense, the publication CIE 48 (CIECommission Internationale de l’Éclairage Publication 481980) limits the luminous intensity to no more than200 cd or around 3000 cd/m2, values by far exceedednowadays.These greater punctual luminances present in the de-
vices with directly visible leds (Gled, Mled, type II
devices) compared to the “homogeneous” Type I lightsseem to be responsible for the discomfort feeling ob-tained from the subjective experience.
ConclusionsLike every new technology, the use of LEDs brings aboutadvantages (increase of device efficiency, color stability,better design possibilities) and undesired effects. This isthe case of the detected high luminance, which cancause disturbances or discomfort for certain situationsof use. In the case of devices designed under standards(traffic lights), the glare effect goes beyond the limits orcontrols established for the right functioning, since the rec-ommendations are oriented to uniform signals and not tothose formed by luminous dots. It is essential then to pro-gress in their up-dating in order to limit the phenomenon.Similarly, the results shown point out the need for cre-
ating regulations for other road luminous devices apply-ing Led technology installed in public areas such assignals and billboards, luminous poles in special vehicles(police cars, ambulances). The tendency indicates thatLed emission will continue increasing, while the size ofemitting surfaces will be reduced. It should be thenstrongly legislated to limit the present luminaries in thevisual environment of drivers and pedestrians using thepublic space.
Competing interestsThe authors declare that they have no competing interests.
Ixtaina et al. International Journal of Mechanical and Materials Engineering (2015) 10:1 Page 9 of 9
Authors’ contributionsIP, PM , RN. carried out the LED research experience mentioned in this paper;MGH. participated in the sequence alignment and drafted the manuscript.
AcknowledgementsThe authors would like to thank CIC PBA, where P.I. is member of the Careerof Scientific and Technological Researcher and M.P. and N.R. belong to theProfessional Staff.
Author details1Laboratorio de Acústica y Luminotecnia de la Comisión de Investigaciones,Científicas de la Provincia de Buenos Aires LAL CIC, Camino Centenario y506, 1897 Gonnet, La Plata, Argentina. 2Instituto de Investigación enTecnología Informática Avanzada INTIA, Campus Universitario - Paraje ArroyoSeco s/n, UNCPBA, 7000 Tandil, Argentina. 3Comisión de InvestigacionesCientíficas de la Provincia de Buenos Aires CIC, Buenos Aires, Argentina.
Received: 12 August 2014 Accepted: 14 November 2014
ReferencesAdrian, W, & Schreuder, D. (1970). “A simple method for the appraisal of glare in
street lighting”. Lighting Research and Technology, 2, 61.ANSI/IESNA Illuminating Engineering Society of North America. (2000). “American
National Standard Practice for Roadway Lighting”. NY: RP-8-2000.Bardier, D. (2001). “de la Visión al Conocimiento”. In SA Tradinco (Ed.),
Montevideo.CIE Commission Internationale de l’Éclairage Publication 017/E ILV. (2011).
International Lighting Vocabulary. UK: http://cie.co.at/index.php?i_ca_id=827.CIE Commission Internationale de l’Éclairage Publication 48. (1980). “Light signals
for road traffic control” (pp. 14–7). Paris.CIE Commission Internationale de l’Éclairage Publication 55. (1983). Discomfort
Glare in the Interior Working Environment. France.Commission Internationale de l’Éclairage CIE. (1982). “Calculation and
measurement of luminance and illuminance in road lighting”. Computerprogram for luminance, illuminance and glare. CIE N° 30–2 (pp. 4–6). Paris,France: CIE Editorial.
Crawford, B. (1936). “The integration of the effects from a number of glaresources”. Proc. Phys. Soc. of London, 48, 35.
European Committee for Standardization, European Standard EN 12368. (2006).“Traffic control equipment. Signal heads” Brussels (pp. 25–30). Brussels.
Fisher, A, & Christie, A. (1965). “A note on disability glare”. Vision Research, 5, 565.Holladay, L. (1926). “The fundamentals of glare and visibility”. Journal of the
Optical Society of America, 41, 235–244.Hopkinson, RG. (1940). “Discomfort glare in lighted streets”. London: Transactions
of the IES, 5 (1).Instituto Argentino de Racionalización de Materiales. (2008). IRAM AADL J 2022–2,
“Alumbrado Público, Vías de Tránsito – Clasificación y niveles de iluminación”.Buenos Aires.
Moon, P. (1936). “The Scientific Basis of Illuminating Engineering”. London: McGrawHill Book Company.
Performance Specification of the Institute of Transportation Engineers. (2005).Vehicle Traffic Control Signal Heads. Washington, D.C: Light Emitting Diode(LED) Circular Signal Supplement.
Photo Research Inc. (2012). PR880 Photometer specification. http://www.photoresearch.com/current/pr880.asp.
República Argentina, ley 19.587/72. (1972). “Ley de Seguridad e Higiene e eltrabajo”, Anexo IV, cap. XII. Buenos Aires: Iluminación y Color.
van Bommel, W, & de Boer, J. (1982). “Road Lighting”. The Netherlands: PhilipsTechnical Library.
Submit your manuscript to a journal and benefi t from:
7 Convenient online submission
7 Rigorous peer review
7 Immediate publication on acceptance
7 Open access: articles freely available online
7 High visibility within the fi eld
7 Retaining the copyright to your article
Submit your next manuscript at 7 springeropen.com