Embed Size (px)
Citation preview
Gladstone Industry - Community Perception Study
2010
Lindsay Greer, Delwar Akbar, John Rolfe and Julie Mann
Prepared for Gladstone Industry Leadership Group (GILG)
CQUniversity, Building 7, Rockhampton, QLD 4702
October 2010
2010 GLADSTONE INDUSTRY COMMUNITY PERCEPTION STUDY
2 Centre for Environmental Management
2010
Centre for Environmental Management 3
ACKNOWLEDGEMENTS
This study has been supported by the Gladstone Industry Leadership Group (GILG) representing theGladstone industries; Boyne Smelters Limited (BSL), Cement Australia (CA), NRG GladstoneOperating Services, Queensland Alumina Limited (QAL), and Rio Tinto Alcan – Yarwun (RTA).
The primary data for this report was collected by National Field Services Australia (NFS) a marketresearch and data collection agency and the resources division of Millward Brown Australia. All ofNFS’ resources are in-house and NFS is a member of the Association of Market and Social ResearchOrganisations (AMRSO).
In addition, the assistance of other stakeholders involved with the study is gratefully acknowledged.The secondary material utilised in the preparation of this document incorporated a wide range ofreports, papers, discussions, state government websites, and library research.
Images by Julie Mann
DISCLAIMER
The Centre for Environmental Management (CEM) has made every attempt to ensure the accuracyand validity of the information contained in this document, however, CEM cannot accept any liabilityfor its use or application. The user accepts all risks in the interpretation and use of any informationcontained in this document. The views and interpretations expressed in this report are those of theauthor(s) and should not be attributed to the organisations associated with the project.
CQUniversity acknowledges and respects Elders both past and present of the DarumbalNation and all Aboriginal peoples and nations on all the lands in which we operate inworking together to create a better future for us all. CQUniversity commits to a just andmeaningful partnership of reconciliation with Aboriginal and Torres Strait Islanderpeople throughout the communities we serve. The CQUniversity ReconciliationStatement was issued in 2002 and is available at www.cqu.edu.au
2010 GLADSTONE INDUSTRY COMMUNITY PERCEPTION STUDY
4 Centre for Environmental Management
TABLE OF CONTENTS
ACKNOWLEDGEMENTS ....................................................................................................................................3
DISCLAIMER.....................................................................................................................................................3
TABLE OF CONTENTS........................................................................................................................................4
LIST OF TABLES ................................................................................................................................................6
LIST OF FIGURES...............................................................................................................................................6
ABBREVIATIONS ..............................................................................................................................................8
EXECUTIVE SUMMARY .....................................................................................................................................9
SECTION 1 INTRODUCTION.........................................................................................................................13
1.1. STUDY OUTLINE ............................................................................................................................................. 131.2. STUDY LOCATION ........................................................................................................................................... 131.3. STUDY CONTEXT............................................................................................................................................. 161.4. PREVIOUS STUDIES ......................................................................................................................................... 181.5. STUDY METHOD............................................................................................................................................. 21
1.5.1 Data collection methods ..................................................................................................................... 211.5.2 Sampling techniques ........................................................................................................................... 211.5.3 Response rates .................................................................................................................................... 221.5.4 Accuracy of estimates ......................................................................................................................... 221.5.5 Data input ........................................................................................................................................... 221.5.6 Data analysis methods........................................................................................................................ 23
SECTION 2 STUDY RESULTS ............................................................................................................................24
2.1.1 Interpreting the data........................................................................................................................... 242.2 SURVEY RESPONDENT DEMOGRAPHICS................................................................................................................. 24
2.2.1 Location of survey respondents .......................................................................................................... 252.2.2 Length of residency and employment ................................................................................................. 262.2.3 Knowledge of Gladstone Industry Leadership Group (GILG) ............................................................... 27
2.3 GENERAL KNOWLEDGE OF GLADSTONE INDUSTRY .................................................................................................. 292.3.1 Main source of information about Gladstone industry ....................................................................... 312.3.2 Level of consultation by industry......................................................................................................... 312.3.3 Industrial development, liveability and future priorities ..................................................................... 322.3.4 Gladstone industry, personal health and environment....................................................................... 362.3.5 Gladstone industry and corporate citizenship..................................................................................... 41
2.4 QUALITATIVE INTERVIEWS ................................................................................................................................. 492.4.1 Key themes.......................................................................................................................................... 50
3.1. CONCLUSION...........................................................................................................................................60
REFERENCES...................................................................................................................................................61
APPENDICES...................................................................................................................................................63
APPENDIX 1 SURVEY SAMPLE METHODS ..................................................................................................63
A1.1 Sampling methods ............................................................................................................................... 63A1.2 Sample representiveness ..................................................................................................................... 65A1.3 Weighting ............................................................................................................................................ 66
APPENDIX 2 GILG INDUSTRY – COMMUNITY PERCEPTION SURVEY ...............................................................67

2010
Centre for Environmental Management 5
APPENDIX 3 PERSONAL INTERVIEW SCHEDULE..............................................................................................81
2010 GLADSTONE INDUSTRY COMMUNITY PERCEPTION STUDY
6 Centre for Environmental Management
LIST OF TABLES
Table 2.1 (S3) Survey respondents by Gladstone area 25Table 2.2 (S4) Suburb or locality you live in (recode) 26Table 2.3 (q1) Rating of level of general knowledge of Gladstone industry 29Table 2.4 (q2) Main source of information about Gladstone industry 31Table 2.5 (q3) Rating of the level of consultation by industry in Gladstone 31Table 2.6 (q4) Agreement about industry development in the Gladstone region. 32Table 2.7 (q5) Comparison of overall liveability rating (0-10) 33Table 2.8 (q6) What can be done to improve the liveability of the Gladstone region? 34Table 2.9 (q7) Priority areas for Gladstone industry 35Table 2.10 (q8) Other priority areas that Gladstone industry should address 35Table 2.11 (q10) Level of concern for selected industry emission for the Gladstone region. 38Table 2.12 (q11) Any other industry emissions 38Table 2.13 (q12) Industry emissions concern and associated industry 39Table 2.14 (q14) General perception of the performance of Gladstone industry. 42Table 2.15 Requirements of being a good corporate citizen 43Table 2.16 (q18-22) Measure of good corporate citizenship, selected industries 45Table 2.17 Areas of concern regarding Gladstone industry 46Table A1.1 Estimated resident population by urban centre/locality, June 2009 63Table A1.2 Gender and age quotas 64Table A1.3 Gladstone Final Sample Disposition Report 64Table A1.4 Age distribution for the 2010 survey sample 65Table A1.5 Calculation of weighting variable (wtvar1) 66
LIST OF FIGURES
Figure 1.1 Map of study area ................................................................................................................14Figure 1.2 Estimated population growth in Gladstone Regional Area .................................................16Figure 1.3 Estimated total community complaints, QAL 1996-2010....................................................19Figure 1.4 Percentage of community complaints by category 2009-10 ...............................................20Figure 2.1 Age distribution of survey respondents, percentage ..........................................................24Figure 2.2 Years living in Gladstone region (n) .....................................................................................26Figure 2.3 Employment status (n).........................................................................................................27Figure 2.4 Percentage of respondent with knowledge of GILG by age ................................................28Figure 2.5 Awareness of GILG and knowledge of Gladstone industry, %.............................................28Figure 2.6 Level of general knowledge of Gladstone industry by location (Ave.) ................................30Figure 2.7 Rating of industry performance and general knowledge of industry % ..............................30Figure 2.8 Rating of industry performance and general knowledge of industry (n) ............................31Figure 2.9 Average rating of industry consultation by locality .............................................................32Figure 2.10 Support for industry development by suburb (mean values)............................................33Figure 2.11 Comparison of liveability rating, mean scores...................................................................34Figure 2.12 Concern that industry in Gladstone might affect your health, % ......................................37Figure 2.13 Qld Health Gladstone Community Survey 2009 and GILG 2010........................................37Figure 2.14 Level of concern (mean values) for odour and fumes by suburbs ....................................41
2010
Centre for Environmental Management 7
Figure 2.15 (q16) Rating of acceptance of industry by suburb.............................................................44Figure 2.16 Performance as corporate citizen as a percentage of total company score .....................44Figure 2.17 Measure of good corporate citizenship, selected industries (Ave. scores) .......................46
2010 GLADSTONE INDUSTRY COMMUNITY PERCEPTION STUDY
8 Centre for Environmental Management
ABBREVIATIONS
ABS Australian Bureau of StatisticsBSL Boyne Smelter LimitedCEM Centre for Environmental ManagementCA Cement AustraliaCATI Computer Assisted Telephone InterviewCQUniversity Central Queensland UniversityDEEDI Department of Employment, Economic Development and InnovationDET Department of Education and TrainingDERM Department of Environment and Resource ManagementDIDO Drive in/Drive outDME Department of Mines and EnergyEPA Environment Protection AuthorityERP Estimated Residential PopulationFIFO Fly in/Fly outGILG Gladstone Industry Leadership GroupGPC Gladstone Ports CorporationGRC Gladstone Regional CouncilGRP Gross Regional ProductsIRC Isaac Regional CouncilKm KilometreLGA Local Government AuthorityLNG Liquefied Natural GasNRG NRG Gladstone Operating ServicesOESR Office of Economic and Statistical ResearchQAL Queensland Alumina LimitedQLD QueenslandRDD Random Digit DiallingRTA-Y Rio Tinto Alcan - YarwunSD Statistical DivisionSLA Statistical Local Area
EXECUTIVE SUMMARY 2010
Centre for Environmental Management 9
EXECUTIVE SUMMARY
Study objectives:The purpose of this study is to provide a measure of the perception of Gladstone industryperformance by the residents of the Gladstone region. This is an independent study designed to bean on-going and accurate measure capable of providing a benchmark of the performance of existingGladstone industries. This study was commissioned by the Gladstone Industry Leadership Group(GILG).
The study objectives were: (a) to provide an estimate of the perceptions of a representative sampleof Gladstone area households of the performance of Gladstone industry across a range of corporatecitizen factors, (b) to estimate the perception of health and environment related performancemeasures, and (c) to provide Gladstone industry with perceptive feedback on its performance in theGladstone community and offer a mechanism for improvement into the future.
Research methods:The study used survey research methods consisting of a household survey (n=520) and an in-depthinterview with some selected residents (n=12). These surveys were undertaken to collect data tounderstand the community perceptions of Gladstone in relation to the performance of Gladstoneindustry across a series of benchmark indicators of corporate citizenship performance. The datacollection was undertaken by National Field Service, a Sydney based data collection agency usingsophisticated in-house CATI facilities. The study used a range of techniques to understand theindividual and aggregated perception about the Gladstone Region’s industrial health andenvironment, descriptive statistical analysis, composite index and thematic (qualitative) analysis.
Study area:Gladstone is an industrial and port city located in the Central Queensland region. The Gladstone areahas been represented by a single local government authority, the Gladstone Regional Council (GRC),since 2008, when three previous shires of Gladstone City, Calliope and Miriam Vale wereamalgamated. The population of the GRC area was approximately 59,644 in June, 2009, about 1.3percent of the state’s population. The average annual growth rate in the GRC between 2004 and2009 was 3.2 per cent, compared with 2.6 per cent for the State of Queensland. The majority of thatpopulation was in the Gladstone and Calliope communities in close proximity to the GladstoneIndustrial area.
In this study, there were 267 male (51.3 percent) and 253 female (48.6 percent) survey respondentswith a total of 520 valid responses. The median number of years that respondents had resided in theGladstone region was twenty years or more, indicating that the survey respondents in the majoritywere long term residents. Most of those surveyed lived in their own separate house (94.6 percenti.e., higher than Queensland average), of which the majority were owned or being purchased (79.6percent), with 12.8 percent being rented on the open market. The Gladstone population is generallyyounger (33 years) than the Queensland average of 36 years.
The largest education category was the respondents who indicated that their highest education levelwas Year 11 or lower (34.2 percent), followed by those who had attained a post secondary
2010 GLADSTONE INDUSTRY COMMUNITY PERCEPTION STUDY
10 Centre for Environmental Management
qualification (22.8 percent) and who had completed Year 12 (19.6 percent). Just over 15 percent hadan undergraduate degree and 7.8 percent had a postgraduate degree. Post-school educationalattainment levels in Gladstone are generally below the Queensland state average except at theCertificate level where they are higher.
The locality of the respondents was recorded by dividing the Gladstone region into three areas:Gladstone (62.3%), Boyne Island/Tannum Sands (BITS) (23.1%), former Calliope Shire and MiriamVale Shire (14.6%). These three regions were further divided into 11 neighbourhoods (i.e., BoyneValley, Toolooa-Glen Eden, Gladstone City, West Gladstone, Boyne Island- Tannum Sands, Calliope,Clinton, Kin Kora -Telina and Sun Valley, Gladstone South, New Auckland, and Yarwun-Targinnie) forbetter understanding about views of Gladstone Industry performance at a neighbourhood level. Justover half of the respondents either worked for a major industry in Gladstone or had a familymember who did so. A quarter of the respondents were employed in both small and medium sizedbusiness and 14.8 percent of the respondents were Federal, State or Local government employees.
Survey results:The survey respondents were asked to rate their level of general knowledge of Gladstone industryon a scale of one to ten where one indicates limited knowledge and ten extensive knowledge. Themean score of all respondents was 6.42/10, which means most respondents have some level ofknowledge about the Gladstone Industries, which might reflect their opinion on the rating ofGladstone industry performance.
An important aspect of the community’s level of knowledge of industry is the rating (1-5) given tothe level of consultation by industry in Gladstone. The mean score of all respondents is 3.17/5,which is slightly better than the median score. The results also show a range scores across thelocations from 2.4/5 in the Boyne Valley to 3.5/5 in the Yarwun Targinnie area.
The respondents were asked to rate the overall liveability of the Gladstone region on a scale of 1 to10 where one equals poor liveability and ten equals excellent liveability. Overall liveability of theregion is 6.71/10, which is above the median score of liveability and this is better than some of theregional areas in Queensland such as Isaac Regional Council. By locality the rating of liveability inboth Boyne Valley and in Yarwun/Targinnie is the lowest in the Gladstone area.
The Gladstone community is concerned about their regional liveability and industrial development.Six statements regarding industrial development were presented to the survey respondents tounderstand the positive and negative aspects of such development. The results show that mostrespondents felt that the overall benefits of industry development are greater than possiblenegative impacts, and most respondents did not agree that Gladstone has too many industries.However the picture is not straight forward as the second statement with which most people agreedis that ‘more state government regulation is required to coordinate growth’. This could suggest anunderlying level of anxiety regarding the level and character of future industrial development. Thiswill need to be examined in further detail in future studies.
In order to ascertain the priority areas that Gladstone industry should consider for the Gladstoneregion the respondents were first asked to give a priority rating to key areas identified from previous
EXECUTIVE SUMMARY 2010
Centre for Environmental Management 11
studies. These were rated on a scale of 1 to 5, with 5 being of the highest priority. The main twopriority areas identified were infrastructure and environmental concerns (including health issues)followed by health infrastructure concerns.
Although health issues had a relatively low priority with the initial construction of QAL forty-fiveyears ago this has changed considerably as Gladstone’s economic development has progressed(Roper, 2010). Recently a study led by Queensland Health identified that there is little or no directcorrelation between industry emission and health outcomes, however latent concerns within thecommunity persist. The results of this survey also show further lessening of concern compared tothe Queensland Health survey with 28.7 percent indicating that they were not at all concerned, 21.1percent were slightly concerned and 27.5 percent were moderately concerned, while 13.8 percentwere highly concerned, and 8.7 percent were extremely concerned.
This study found the highest level of concern by Gladstone residents was dust (Mean 3.62/5)followed by air quality (Mean 3.61/5). The majority of responses were associated with the QALfacility (odour, caustic vapour) and the prevalence of coal dust from the rail and port facilities withinclose proximity to the Gladstone CBD area.
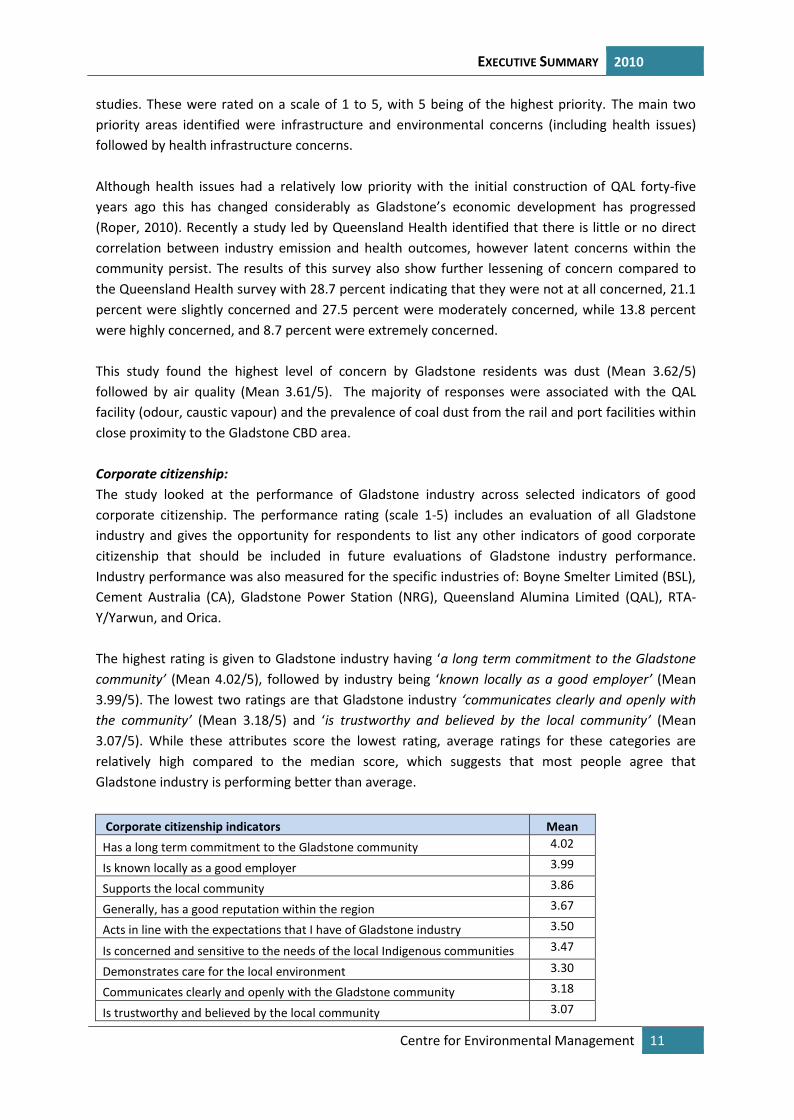
Corporate citizenship:The study looked at the performance of Gladstone industry across selected indicators of goodcorporate citizenship. The performance rating (scale 1-5) includes an evaluation of all Gladstoneindustry and gives the opportunity for respondents to list any other indicators of good corporatecitizenship that should be included in future evaluations of Gladstone industry performance.Industry performance was also measured for the specific industries of: Boyne Smelter Limited (BSL),Cement Australia (CA), Gladstone Power Station (NRG), Queensland Alumina Limited (QAL), RTA-Y/Yarwun, and Orica.
The highest rating is given to Gladstone industry having ‘a long term commitment to the Gladstonecommunity’ (Mean 4.02/5), followed by industry being ‘known locally as a good employer’ (Mean3.99/5). The lowest two ratings are that Gladstone industry ‘communicates clearly and openly withthe community’ (Mean 3.18/5) and ‘is trustworthy and believed by the local community’ (Mean3.07/5). While these attributes score the lowest rating, average ratings for these categories arerelatively high compared to the median score, which suggests that most people agree thatGladstone industry is performing better than average.
Corporate citizenship indicators MeanHas a long term commitment to the Gladstone community 4.02
Is known locally as a good employer 3.99
Supports the local community 3.86
Generally, has a good reputation within the region 3.67
Acts in line with the expectations that I have of Gladstone industry 3.50
Is concerned and sensitive to the needs of the local Indigenous communities 3.47
Demonstrates care for the local environment 3.30
Communicates clearly and openly with the Gladstone community 3.18
Is trustworthy and believed by the local community 3.07
2010 GLADSTONE INDUSTRY COMMUNITY PERCEPTION STUDY
12 Centre for Environmental Management
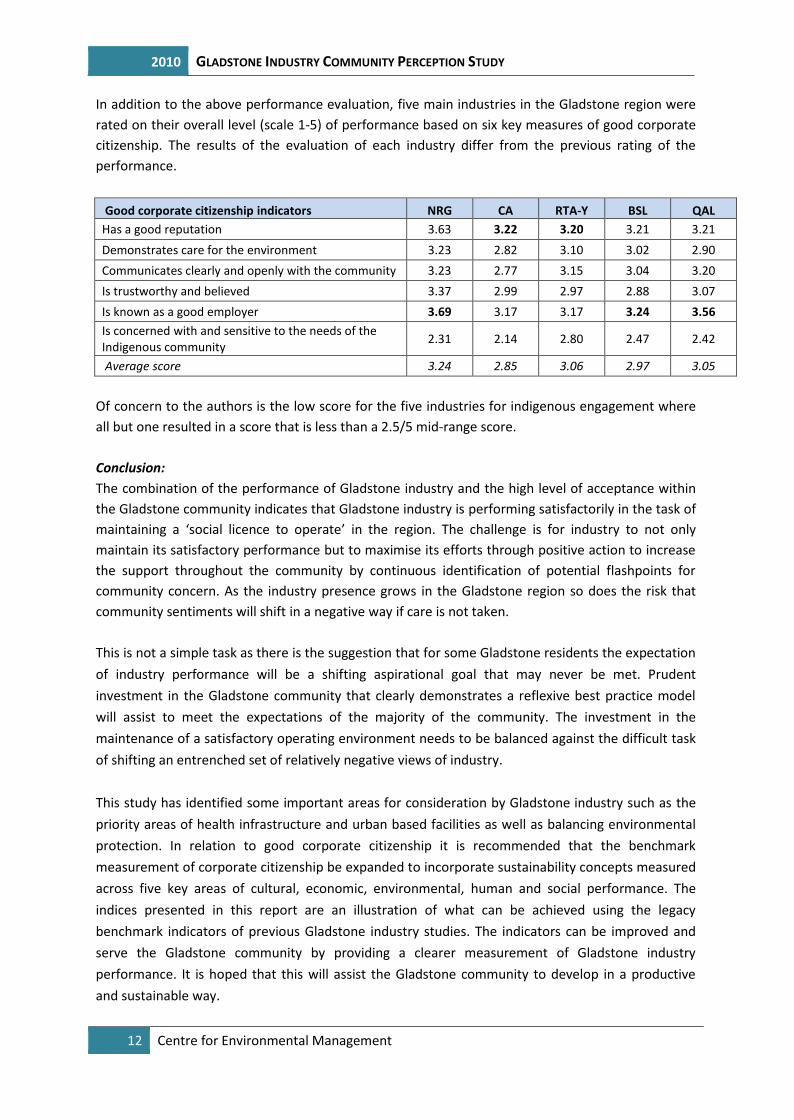
In addition to the above performance evaluation, five main industries in the Gladstone region wererated on their overall level (scale 1-5) of performance based on six key measures of good corporatecitizenship. The results of the evaluation of each industry differ from the previous rating of theperformance.
Good corporate citizenship indicators NRG CA RTA-Y BSL QALHas a good reputation 3.63 3.22 3.20 3.21 3.21Demonstrates care for the environment 3.23 2.82 3.10 3.02 2.90Communicates clearly and openly with the community 3.23 2.77 3.15 3.04 3.20Is trustworthy and believed 3.37 2.99 2.97 2.88 3.07Is known as a good employer 3.69 3.17 3.17 3.24 3.56Is concerned with and sensitive to the needs of theIndigenous community 2.31 2.14 2.80 2.47 2.42
Average score 3.24 2.85 3.06 2.97 3.05
Of concern to the authors is the low score for the five industries for indigenous engagement whereall but one resulted in a score that is less than a 2.5/5 mid-range score.
Conclusion:The combination of the performance of Gladstone industry and the high level of acceptance withinthe Gladstone community indicates that Gladstone industry is performing satisfactorily in the task ofmaintaining a ‘social licence to operate’ in the region. The challenge is for industry to not onlymaintain its satisfactory performance but to maximise its efforts through positive action to increasethe support throughout the community by continuous identification of potential flashpoints forcommunity concern. As the industry presence grows in the Gladstone region so does the risk thatcommunity sentiments will shift in a negative way if care is not taken.
This is not a simple task as there is the suggestion that for some Gladstone residents the expectationof industry performance will be a shifting aspirational goal that may never be met. Prudentinvestment in the Gladstone community that clearly demonstrates a reflexive best practice modelwill assist to meet the expectations of the majority of the community. The investment in themaintenance of a satisfactory operating environment needs to be balanced against the difficult taskof shifting an entrenched set of relatively negative views of industry.
This study has identified some important areas for consideration by Gladstone industry such as thepriority areas of health infrastructure and urban based facilities as well as balancing environmentalprotection. In relation to good corporate citizenship it is recommended that the benchmarkmeasurement of corporate citizenship be expanded to incorporate sustainability concepts measuredacross five key areas of cultural, economic, environmental, human and social performance. Theindices presented in this report are an illustration of what can be achieved using the legacybenchmark indicators of previous Gladstone industry studies. The indicators can be improved andserve the Gladstone community by providing a clearer measurement of Gladstone industryperformance. It is hoped that this will assist the Gladstone community to develop in a productiveand sustainable way.
2010
Centre for Environmental Management 13
SECTION 1 INTRODUCTION
The purpose of this report is to provide a measure of the public perception of Gladstone industryperformance by the residents of the Gladstone region. The report was commissioned by theGladstone Industry Leadership Group (GILG). It presents an opportunity to conduct an independentstudy designed to be an on-going and accurate measure capable of providing a benchmark of theperformance of existing industry groups in the Gladstone region.
The study objectives are to:
1. Review the existing design and methodology of current Gladstone industry communitysurveys.
2. Gain acceptance for a revised approach and survey instrument.3. Measure the performance of Gladstone Industry from environment and corporate
citizenship perspective.4. Measure the acceptance of Gladstone industry to the Gladstone community5. Seek constructive feedback from the community on how Gladstone industry performance
can be improved
1.1. Study OutlineThe Gladstone Industry - Community Perception 2010 Study was designed as a two stage studybeginning with a computer assisted telephone interview (CATI) of 520 randomly selected householdswithin the Gladstone area. In addition to the CATI survey, analysis of key issues was further exploredthrough a small number of qualitative interviews (n=12) with selected respondents. The objective ofthe qualitative interviews was to provide further in-depth understanding and clarification of the keyissues as identified by the CATI survey.
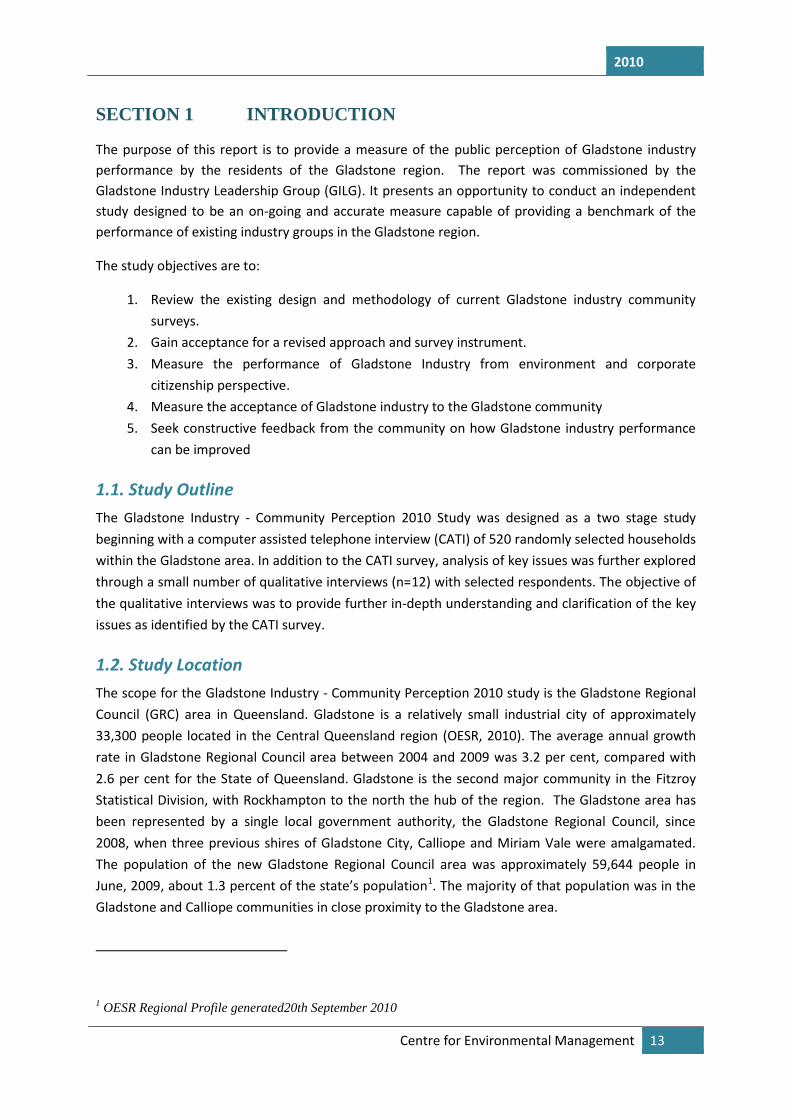
1.2. Study LocationThe scope for the Gladstone Industry - Community Perception 2010 study is the Gladstone RegionalCouncil (GRC) area in Queensland. Gladstone is a relatively small industrial city of approximately33,300 people located in the Central Queensland region (OESR, 2010). The average annual growthrate in Gladstone Regional Council area between 2004 and 2009 was 3.2 per cent, compared with2.6 per cent for the State of Queensland. Gladstone is the second major community in the FitzroyStatistical Division, with Rockhampton to the north the hub of the region. The Gladstone area hasbeen represented by a single local government authority, the Gladstone Regional Council, since2008, when three previous shires of Gladstone City, Calliope and Miriam Vale were amalgamated.The population of the new Gladstone Regional Council area was approximately 59,644 people inJune, 2009, about 1.3 percent of the state’s population1. The majority of that population was in theGladstone and Calliope communities in close proximity to the Gladstone area.
1 OESR Regional Profile generated20th September 2010
2010 GLADSTONE INDUSTRY COMMUNITY PERCEPTION STUDY
14 Centre for Environmental Management
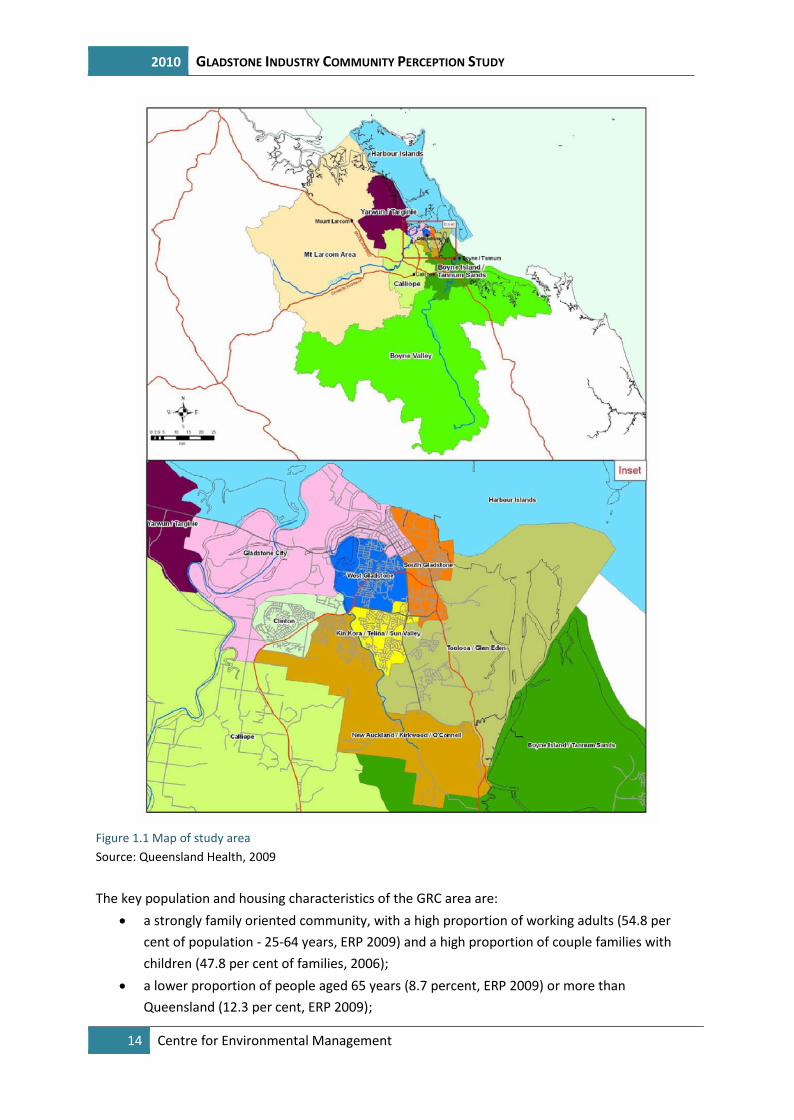
Figure 1.1 Map of study areaSource: Queensland Health, 2009
The key population and housing characteristics of the GRC area are: a strongly family oriented community, with a high proportion of working adults (54.8 per
cent of population - 25-64 years, ERP 2009) and a high proportion of couple families withchildren (47.8 per cent of families, 2006);
a lower proportion of people aged 65 years (8.7 percent, ERP 2009) or more thanQueensland (12.3 per cent, ERP 2009);
2010
Centre for Environmental Management 15
relatively low proportions of Indigenous people (3.1 per cent of total population, 2006) andpeople from non-English speaking backgrounds (3.4 per cent of total population, 2006)although many nationalities are represented;
a transient population, with 49.8 per cent of the population being based at another addressfive years previously;
relatively high incomes with 23.7 per cent earning more than $1,000 per week (Queensland16.8 per cent, 2006), although 39.6 per cent of the population (15 years and over) earns lessthan $400 per week;
a work oriented community, with a low unemployment rate (5.7 per cent, March 2010) andhigh labour force participation rate; with manufacturing (19.9 per cent), construction (12.6per cent), and retail trade (10.4 per cent) the main employment sectors.
a low proportion of households owning their own home (25.8 per cent, 2006), and a highproportion purchasing their home (41.52 per cent, 2006) i.e. a significant ‘mortgage belt’;
a high proportion of separate houses (91.6 per cent, 2006) and a low proportion offlats/units (8.3 per cent, 2006), indicating limited housing choice;
low vacancy rates, resulting in high rents for flats and decreasing housing affordability.(Source: Social Infrastructure Strategic Plan; OESR Regional Profile 2010)
The economy of the broader Fitzroy (Statistical Division) region is dominated by mining (particularlycoal), agriculture (beef cattle, cropping, cotton and horticulture), and minerals processing as primaryexport industries that drive regional activity. Gladstone is a major industrial centre for mineralsprocessing, transport (port and rail) and power generation. While Rockhampton remains the majorhub for service industries, the growth in Gladstone means that there is an increasing demand forservices in the community, with corresponding growth in the business and public sector to providethese.
With the bulk of Queensland’s export coal coming from Central Queensland’s Bowen Basin,Gladstone and the Central Queensland region is well positioned to benefit from this growth.Gladstone also has strong prospects for growth in other sectors of minerals processing and energyexports, particularly with the development of the LNG industry.
The Gladstone State Development area2 supports a number of key industries in refining, mineralsprocessing, chemicals and mining. Major industries within the region include:
Queensland Alumina Limited (QAL) – major alumina refinery, commenced in 1964 NRG/Gladstone Power Station commissioned in 1969 Cement Australia – major cement manufacturer, commenced in 1981 Boyne Smelter Limited – major aluminium smelter, commenced in 1982
2 The Gladstone State Development area covers approximately 28,000 hectares and is considered suitable forlarge scale industrial development. State Development areas were created under Section 77 of the StateDevelopment and Public Works Organisation Act 1971 and are designed to promote economic development ofindustrial land and multi-user infrastructure.
2010 GLADSTONE INDUSTRY COMMUNITY PERCEPTION STUDY
16 Centre for Environmental Management
Orica – major chemical manufacturer, commenced in 1990 Rio Tinto Alcan Yarwun Refinery – major alumina refinery, commenced in 2002
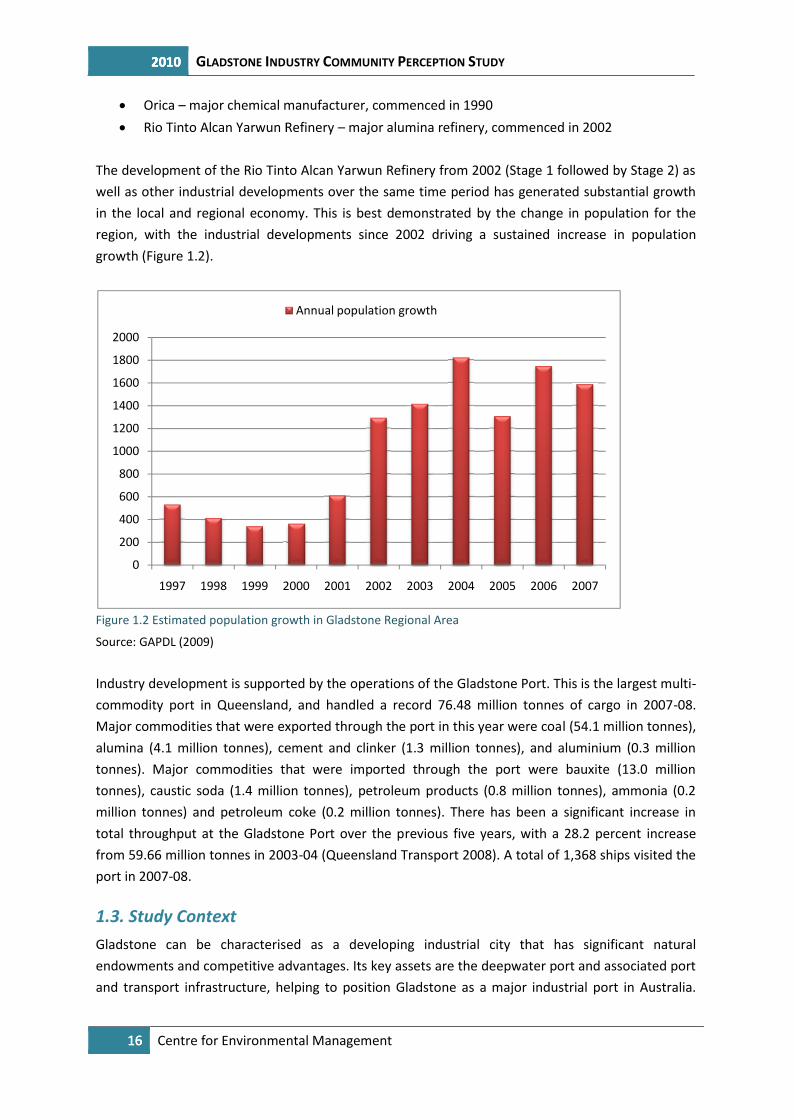
The development of the Rio Tinto Alcan Yarwun Refinery from 2002 (Stage 1 followed by Stage 2) aswell as other industrial developments over the same time period has generated substantial growthin the local and regional economy. This is best demonstrated by the change in population for theregion, with the industrial developments since 2002 driving a sustained increase in populationgrowth (Figure 1.2).
Figure 1.2 Estimated population growth in Gladstone Regional Area
Source: GAPDL (2009)
Industry development is supported by the operations of the Gladstone Port. This is the largest multi-commodity port in Queensland, and handled a record 76.48 million tonnes of cargo in 2007-08.Major commodities that were exported through the port in this year were coal (54.1 million tonnes),alumina (4.1 million tonnes), cement and clinker (1.3 million tonnes), and aluminium (0.3 milliontonnes). Major commodities that were imported through the port were bauxite (13.0 milliontonnes), caustic soda (1.4 million tonnes), petroleum products (0.8 million tonnes), ammonia (0.2million tonnes) and petroleum coke (0.2 million tonnes). There has been a significant increase intotal throughput at the Gladstone Port over the previous five years, with a 28.2 percent increasefrom 59.66 million tonnes in 2003-04 (Queensland Transport 2008). A total of 1,368 ships visited theport in 2007-08.
1.3. Study ContextGladstone can be characterised as a developing industrial city that has significant naturalendowments and competitive advantages. Its key assets are the deepwater port and associated portand transport infrastructure, helping to position Gladstone as a major industrial port in Australia.
0
200
400
600
800
1000
1200
1400
1600
1800
2000
1997 1998 1999 2000
2010 GLADSTONE INDUSTRY COMMUNITY PERCEPTION STUDY
16 Centre for Environmental Management
Orica – major chemical manufacturer, commenced in 1990 Rio Tinto Alcan Yarwun Refinery – major alumina refinery, commenced in 2002
The development of the Rio Tinto Alcan Yarwun Refinery from 2002 (Stage 1 followed by Stage 2) aswell as other industrial developments over the same time period has generated substantial growthin the local and regional economy. This is best demonstrated by the change in population for theregion, with the industrial developments since 2002 driving a sustained increase in populationgrowth (Figure 1.2).
Figure 1.2 Estimated population growth in Gladstone Regional Area
Source: GAPDL (2009)
Industry development is supported by the operations of the Gladstone Port. This is the largest multi-commodity port in Queensland, and handled a record 76.48 million tonnes of cargo in 2007-08.Major commodities that were exported through the port in this year were coal (54.1 million tonnes),alumina (4.1 million tonnes), cement and clinker (1.3 million tonnes), and aluminium (0.3 milliontonnes). Major commodities that were imported through the port were bauxite (13.0 milliontonnes), caustic soda (1.4 million tonnes), petroleum products (0.8 million tonnes), ammonia (0.2million tonnes) and petroleum coke (0.2 million tonnes). There has been a significant increase intotal throughput at the Gladstone Port over the previous five years, with a 28.2 percent increasefrom 59.66 million tonnes in 2003-04 (Queensland Transport 2008). A total of 1,368 ships visited theport in 2007-08.
1.3. Study ContextGladstone can be characterised as a developing industrial city that has significant naturalendowments and competitive advantages. Its key assets are the deepwater port and associated portand transport infrastructure, helping to position Gladstone as a major industrial port in Australia.
2000 2001 2002 2003 2004 2005 2006 2007
Annual population growth
2010 GLADSTONE INDUSTRY COMMUNITY PERCEPTION STUDY
16 Centre for Environmental Management
Orica – major chemical manufacturer, commenced in 1990 Rio Tinto Alcan Yarwun Refinery – major alumina refinery, commenced in 2002
The development of the Rio Tinto Alcan Yarwun Refinery from 2002 (Stage 1 followed by Stage 2) aswell as other industrial developments over the same time period has generated substantial growthin the local and regional economy. This is best demonstrated by the change in population for theregion, with the industrial developments since 2002 driving a sustained increase in populationgrowth (Figure 1.2).
Figure 1.2 Estimated population growth in Gladstone Regional Area
Source: GAPDL (2009)
Industry development is supported by the operations of the Gladstone Port. This is the largest multi-commodity port in Queensland, and handled a record 76.48 million tonnes of cargo in 2007-08.Major commodities that were exported through the port in this year were coal (54.1 million tonnes),alumina (4.1 million tonnes), cement and clinker (1.3 million tonnes), and aluminium (0.3 milliontonnes). Major commodities that were imported through the port were bauxite (13.0 milliontonnes), caustic soda (1.4 million tonnes), petroleum products (0.8 million tonnes), ammonia (0.2million tonnes) and petroleum coke (0.2 million tonnes). There has been a significant increase intotal throughput at the Gladstone Port over the previous five years, with a 28.2 percent increasefrom 59.66 million tonnes in 2003-04 (Queensland Transport 2008). A total of 1,368 ships visited theport in 2007-08.
1.3. Study ContextGladstone can be characterised as a developing industrial city that has significant naturalendowments and competitive advantages. Its key assets are the deepwater port and associated portand transport infrastructure, helping to position Gladstone as a major industrial port in Australia.
2007
2010
Centre for Environmental Management 17
The continued development of the mining and gas industries in central Queensland are likely tounderpin the future development of the city.
Gladstone plays a key role in the Australian and Queensland economy as a state designatedindustrial centre. Its access to energy and water supplies, excellent industry focused heavy transportinfrastructure (rail and port facilities), proximity to minerals deposits and the presence of a suitableworkforce and business supply chain create significant advantages for minerals processing and otherindustrial activities. There has been progressive, but sometimes patchy growth in the mineralsprocessing and chemicals industry in Gladstone since Queensland Alumina began construction of theplant in Gladstone in 1964. While Gladstone has major comparative advantages as a location forfuture minerals processing industries, there is still the potential for major new projects to havesignificant impacts on the regional economy. Possible future industrial developments in theGladstone area include:
Rio-Tinto Aluminium –expansion to 3.4 mt pa alumina refinery Gladstone Pacific Nickel – 126 kt pa nickel and 10.4 kt pa refinery Wiggin's Island Coal Terminal – 80mt pa coal terminal Gladstone LNG Fisherman’s Landing - $0.45B – 1 mt pa liquefied natural gas plant GLNG Santos - $5-7B 4 mt pa LNG plant QCLNG - $8B LNG plant APLNG – $35B 16mt pa LNG development Western Basin Dredging and Fisherman’s Landing development Shell – LNG development Curtis Is Boulder steel development
The Gladstone Industry Leadership Group (GILG) formed in December 2008 and comprised of fivemember companies: Boyne Smelters Limited (BSL), Cement Australia (CA), NRG Gladstone OperatingServices, Queensland Alumina Limited (QAL), Rio Tinto Alcan – Yarwun (RTA). It is the peak industrygroup dedicated to increasing industry engagement, transparency and accountability. The GILGstated vision is ‘a clean and healthy Gladstone where industry has a positive impact on society,economy and environment’.
Acknowledgement that the maintenance of a social licence to operate is paramount for Gladstoneindustry is supported by the GILG publicly committing to ensuring that the concerns of theGladstone community over industry performance are suitably articulated and addressed. In previousyears the GILG member companies have conducted individual audits of the Gladstone communitiesconcerns and assessment of industry performance. This study represents a new collaborativeapproach between the industry companies, GILG and CQUniversity to independently assess andbenchmark the community perceptions of industry performance and to seek input from thecommunity on how Gladstone industry can improve its performance.
2010 GLADSTONE INDUSTRY COMMUNITY PERCEPTION STUDY
18 Centre for Environmental Management
1.4. Previous StudiesThe Gladstone community and environment has been subjected to considerable scrutiny by industryand government initiated assessments. Results from previous studies have highlighted andsubsequently concentrated on two main areas of concern. The first is the persistent reporting ofGladstone community concerns over air quality and dust in the Gladstone area. The second is theconcern that this may be linked to detrimental health outcomes in the community. For example inMay 2007 a report was released by the Central Queensland Ports Authority that examined the publicperceptions of industry performance in Gladstone. The qualitative study involving more than 80participants identified as a major concern the ‘unknown impact of coal dust on their [Gladstoneresidents] health’.
In response to the ongoing concerns in Gladstone about industrial emissions, air quality and possibleassociated human health risks, as well as criticism of the EPA Air Monitoring program, the Clean andHealthy Air for Gladstone project was established in July 2007. The project is being jointly conductedby the Queensland Environmental Protection Agency and Queensland Health. The project arguablystrengthens the role of the environmental regulator and the Environmental Protection Act by theinclusion of strategies designed to manage existing industries through the monitoring ofenvironmental data, the application of best practise and the assessment of industry performance inrelation to compliance with the EPA. Additional measures include assessment of communityreporting and more broadly an assessment of the maintenance of the social licence to operate byGladstone industry.
Consistent with these aims a summary report, the Final Human Health Risk Assessment, wasreleased in August 2010 which examined air quality data to assess the likelihood of health riskconcerns and to evaluate the air quality monitoring program. The results are publicly available athttp://www.derm.qld.gov.au/environmental_management/air/clean_and_healthy_air_for_gladstone/pdf/final-health-risk-assessment-report.pdf
In brief the report concludes that;“in response to specific concerns raised during the project, levels of particulates, metals,benzene and fluoride in the ambient air are well below health-based standards, apart fromcircumstances where regional dust storms or local bush fires raised particulate levels. Inregard to concerns about cancers and reproductive effects, there is no obvious basis fromthe air quality data for concluding that the ambient air in Gladstone poses unacceptablehealth risks.Where comparative data are available, the report includes the comparison of the results forGladstone with recent results from air quality monitoring in South-east Queensland,particularly in the urban Brisbane region. This comparison does not show any notablediscrepancies between the overall ambient air qualities of the two airsheds. From a healthrisk assessment perspective, any small differences are not considered to be significant”.
In November 2008 Queensland Health released the report, Health assessment Phase 1: Summary ofdata analysis from existing health datasets. This concluded that overall, the health of the population
2010
Centre for Environmental Management 19
of the Gladstone area as measured by key health outcomes did not show consistent variation fromQueensland as a whole. Furthermore it stated that ‘deaths and cancers generally occurred at ratessimilar to the Queensland rates’. In general the report found that while there were somefluctuations in the rates of hospitalisation with average Queensland rates there were neitherconsistent patterns nor systemic conclusions that could be drawn from the data.
However, despite the number of studies that have investigated air quality and health concerns, theperception of air quality problems associated with Gladstone industry have had a particular currencyin the Gladstone community and continue to be identified as areas of interest by the community.The persistency of community concerns reflects the ongoing challenge that Gladstone industry hasto maintain its social licence to operate and to instil openness and trust with all members of theGladstone community.
In an example of openness, Boyne Smelters Limited (BSL) released the Boyne Smelters LimitedEnvironmental Investigation Report – 30th Sept 2009. The report details a list of public complaints(n=57) relating to industry emission from the industry complex during the period 1st January 2006through 30th June 2009 (pp: 14-15). The complaints have been categorised with 45 attributed toknown events or source (32 related to odour, 8 to emissions (including dust), and 5 relating toconcerns over health impact).
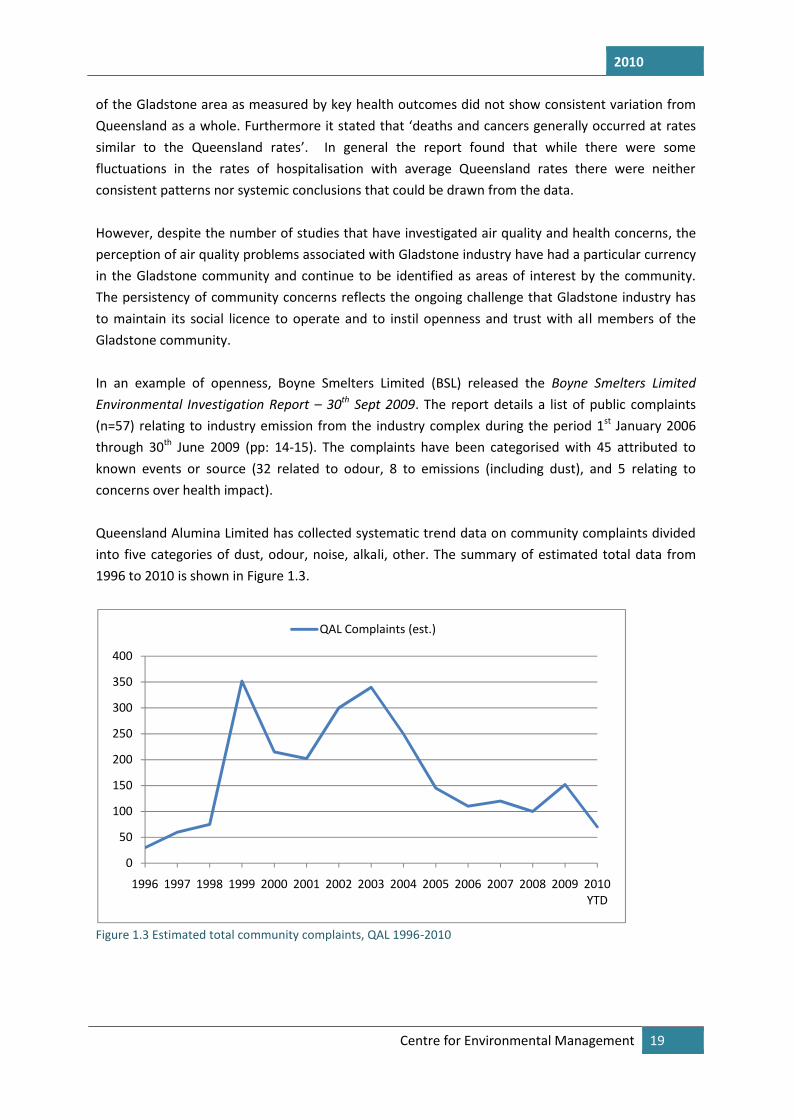
Queensland Alumina Limited has collected systematic trend data on community complaints dividedinto five categories of dust, odour, noise, alkali, other. The summary of estimated total data from1996 to 2010 is shown in Figure 1.3.
Figure 1.3 Estimated total community complaints, QAL 1996-2010
0
50
100
150
200
250
300
350
400
1996 1997 1998 1999 2000 2001 2002 2003 2004 2005 2006 2007 2008 2009 2010YTD
QAL Complaints (est.)
2010 GLADSTONE INDUSTRY COMMUNITY PERCEPTION STUDY
20 Centre for Environmental Management
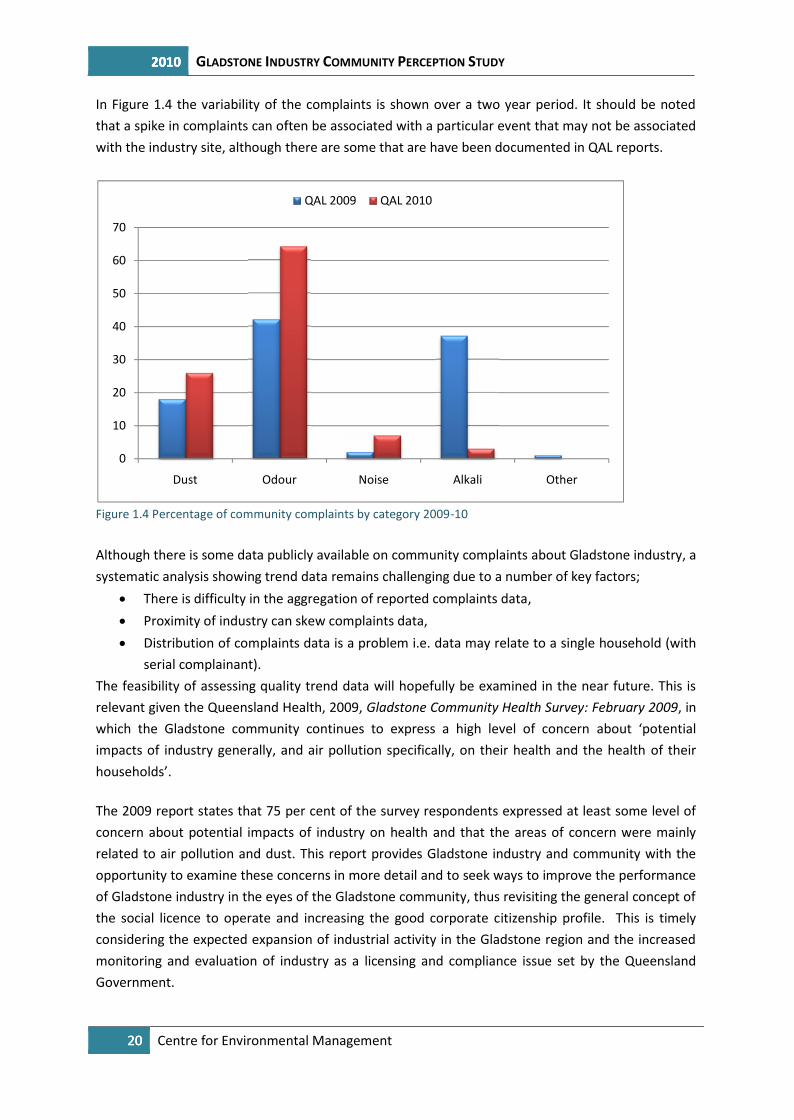
In Figure 1.4 the variability of the complaints is shown over a two year period. It should be notedthat a spike in complaints can often be associated with a particular event that may not be associatedwith the industry site, although there are some that are have been documented in QAL reports.
Figure 1.4 Percentage of community complaints by category 2009-10
Although there is some data publicly available on community complaints about Gladstone industry, asystematic analysis showing trend data remains challenging due to a number of key factors;
There is difficulty in the aggregation of reported complaints data, Proximity of industry can skew complaints data, Distribution of complaints data is a problem i.e. data may relate to a single household (with
serial complainant).The feasibility of assessing quality trend data will hopefully be examined in the near future. This isrelevant given the Queensland Health, 2009, Gladstone Community Health Survey: February 2009, inwhich the Gladstone community continues to express a high level of concern about ‘potentialimpacts of industry generally, and air pollution specifically, on their health and the health of theirhouseholds’.
The 2009 report states that 75 per cent of the survey respondents expressed at least some level ofconcern about potential impacts of industry on health and that the areas of concern were mainlyrelated to air pollution and dust. This report provides Gladstone industry and community with theopportunity to examine these concerns in more detail and to seek ways to improve the performanceof Gladstone industry in the eyes of the Gladstone community, thus revisiting the general concept ofthe social licence to operate and increasing the good corporate citizenship profile. This is timelyconsidering the expected expansion of industrial activity in the Gladstone region and the increasedmonitoring and evaluation of industry as a licensing and compliance issue set by the QueenslandGovernment.
0
10
20
30
40
50
60
70
Dust Odour
2010 GLADSTONE INDUSTRY COMMUNITY PERCEPTION STUDY
20 Centre for Environmental Management
In Figure 1.4 the variability of the complaints is shown over a two year period. It should be notedthat a spike in complaints can often be associated with a particular event that may not be associatedwith the industry site, although there are some that are have been documented in QAL reports.
Figure 1.4 Percentage of community complaints by category 2009-10
Although there is some data publicly available on community complaints about Gladstone industry, asystematic analysis showing trend data remains challenging due to a number of key factors;
There is difficulty in the aggregation of reported complaints data, Proximity of industry can skew complaints data, Distribution of complaints data is a problem i.e. data may relate to a single household (with
serial complainant).The feasibility of assessing quality trend data will hopefully be examined in the near future. This isrelevant given the Queensland Health, 2009, Gladstone Community Health Survey: February 2009, inwhich the Gladstone community continues to express a high level of concern about ‘potentialimpacts of industry generally, and air pollution specifically, on their health and the health of theirhouseholds’.
The 2009 report states that 75 per cent of the survey respondents expressed at least some level ofconcern about potential impacts of industry on health and that the areas of concern were mainlyrelated to air pollution and dust. This report provides Gladstone industry and community with theopportunity to examine these concerns in more detail and to seek ways to improve the performanceof Gladstone industry in the eyes of the Gladstone community, thus revisiting the general concept ofthe social licence to operate and increasing the good corporate citizenship profile. This is timelyconsidering the expected expansion of industrial activity in the Gladstone region and the increasedmonitoring and evaluation of industry as a licensing and compliance issue set by the QueenslandGovernment.
Odour Noise Alkali Other
QAL 2009 QAL 2010
2010 GLADSTONE INDUSTRY COMMUNITY PERCEPTION STUDY
20 Centre for Environmental Management
In Figure 1.4 the variability of the complaints is shown over a two year period. It should be notedthat a spike in complaints can often be associated with a particular event that may not be associatedwith the industry site, although there are some that are have been documented in QAL reports.
Figure 1.4 Percentage of community complaints by category 2009-10
Although there is some data publicly available on community complaints about Gladstone industry, asystematic analysis showing trend data remains challenging due to a number of key factors;
There is difficulty in the aggregation of reported complaints data, Proximity of industry can skew complaints data, Distribution of complaints data is a problem i.e. data may relate to a single household (with
serial complainant).The feasibility of assessing quality trend data will hopefully be examined in the near future. This isrelevant given the Queensland Health, 2009, Gladstone Community Health Survey: February 2009, inwhich the Gladstone community continues to express a high level of concern about ‘potentialimpacts of industry generally, and air pollution specifically, on their health and the health of theirhouseholds’.
The 2009 report states that 75 per cent of the survey respondents expressed at least some level ofconcern about potential impacts of industry on health and that the areas of concern were mainlyrelated to air pollution and dust. This report provides Gladstone industry and community with theopportunity to examine these concerns in more detail and to seek ways to improve the performanceof Gladstone industry in the eyes of the Gladstone community, thus revisiting the general concept ofthe social licence to operate and increasing the good corporate citizenship profile. This is timelyconsidering the expected expansion of industrial activity in the Gladstone region and the increasedmonitoring and evaluation of industry as a licensing and compliance issue set by the QueenslandGovernment.
Other
2010
Centre for Environmental Management 21
1.5. Study MethodThe study utilised both quantitative survey and qualitative interview research methods. The studywas granted ethics approval by the CQUniversity Human Research Ethics Committee on 23rd July2010 (H10/07-127).
1.5.1 Data collection methods
A Computer Assisted Telephone Interview (CATI) household survey (n=520) was undertaken tocollect data to understand the community perceptions of Gladstone in relation to the performanceof Gladstone industry across a series of benchmark indicators of corporate citizenship performance.The data collection was undertaken by National Field Service a Sydney based data collection agencyusing sophisticated in-house CATI facilities.
The data collection commenced with a pilot study (n=20) on the 1st September 2010. The purpose ofthis pilot was to test question formats and question sequences, and to address any survey issues.The original questionnaire was amended slightly from the results of the pilot. The survey length wasdeemed too long (average response time of 23 minutes) and specific questions were pre-coded todecrease the survey length. The final average interview length was 21.34 minutes. There were alsosome minor adjustments made to the question order following the pilot study with the live datacollection restarting on Friday 3rd September evening session. The data collection was completed onMonday 13th September.
The telephone interviews were generally made between 5pm and 9pm Monday to Friday and 10amto 5pm on Saturday and Sunday except were a specific appointment has been made. Trainedinterviewers carried out the data collection and were supervised at all times. On contacting thehousehold, the interviewer initially identified themselves and the purpose of the survey. Allinterviews were conducted in English. A maximum of six attempts were made to organise anappointment to interview the respondent. The call back timing were organised in such a way thatchances of obtaining an interview are maximised in relation to the overall sample required and couldbe called outside scheduled interviewing hours if required. This assisted in minimising non-responsebias. As per IQCA requirements, ten percent of the work completed by the interviewers was selectedat random for validation by the supervisor.
At the completion of the CATI survey a stratified sample of respondents who indicated a willingnessto participate in face to face interviews were contacted and 12 interviews arranged. CEMresearchers conducted the interviews in the first two weeks of November 2010. Interviewees wereselected on the basis of gender and age. An information sheet, consent form and interview schedule(Appendix 3) were used to guide the interviews in which the researcher was able to explore issues ofconcern in-depth.
1.5.2 Sampling techniques
The sample frame for the survey was households contactable by landline telephone within thedesignated in-scope areas. The sample frame is bound by the local government area of Gladstone
2010 GLADSTONE INDUSTRY COMMUNITY PERCEPTION STUDY
22 Centre for Environmental Management
Regional Council (GRC). To ensure an adequate representation of the population to be surveyed,minimum quotas were set to reduce age and gender bias.
A simple random sampling technique was used via Random Digit Dialing (RDD). RDD is acontinuously updated randomly generated phone number database that has been designed to drawa sample on postcode level based on existing telephone exchange prefixes. The sample wasrandomly selected in each household by requesting the youngest male over the age of 18 years thenthe youngest female in the household. This method of selection is significantly more efficient andcost effective due to greater availability and also allows targeting of younger people who are difficultto sample (See Survey questionnaire in Appendix 2).
1.5.3 Response rates
The final response rate was 21%, which is considered a satisfactory survey response rate. Thisresponse rate is based only on the number of contacts we made with an in-scope actual person(does not include answering machines, dead numbers etc). It is calculated as: Completedsurveys/(Completed surveys + Refusals + Terminated surveys). The response rate is related to therandom digit dialling methodology. Response rates for telephone surveys have in general beendeclining due in part to the increased use of mobile phones and in response to survey fatigueincluding an increase in telemarketing. Given this background, the actual response rate is verysatisfactory.
1.5.4 Accuracy of estimates
The results of this survey provide estimates of the data that would be found if the whole populationwas interviewed. The sampling error is a measure of the validity of the descriptive statistics that areobserved in a sample. The estimated sampling error, at the 95% confidence level, for the surveysample of 520 households and a 50/50 binomial percentage distribution is plus or minus 4.2percentage points3. With a large sample size of n=520 there is a higher probability that theresponses accurately reflect the population that it is intended to represent. The sample size of n=520means we can be 95% confident that the true opinions lie within + or – 4.2% of the current datacollected. The following formulae were used to calculate the sampling error at a 95% confidencelevel for the survey:
Gladstone Region sample (n=520) 1.96 x √.5 x .5 = 1.96 x √.000480 = 1.96 x .021908 = .0429414520
1.5.5 Data input
Data was initially analysed in SPSS4 (Version 17) and transferred to Excel and STATISTICA5 for furtheranalysis and for presentation. The study used nominal and ordinal scales for the data collected from
3 Babbie, Earl (1989) The Practice of Social Research (Fifth Edition). Belmont, California: Wadsworth PublishingCompany, p.A32.4 SPSS (Statistical Product and Service Solutions – formerly Statistical Package for the Social Sciences) is aproduct of SPSS Inc., Chicago, Illinois.
2010
Centre for Environmental Management 23
the household survey. This study also used Likert-type scales in the case of ordinal data in somequestions. Open ended responses were recoded into logical categories. Data analysis was performedby categorising and tabulating evidence to address the objectives of the study.
1.5.6 Data analysis methods
The study used the following techniques to understand the individual and aggregated perceptionabout the Gladstone Region’s industrial health and environment as well as relationship betweendifferent variables:
1. Descriptive statistical analysis2. Composite index3. Qualitative analysis
Descriptive analysis: The descriptive analysis includes the calculation of frequencies, mean (average)ratings along with selected cross-tabulations shown as percentages and graphs. The survey data wasexported into SPSS version 17.0 and data outputs were prepared using Microsoft Excel.
Composite index: This can be defined as an aggregation of the GRC area health and environmentalvalues (community perception) which collectively convey information about the quality of GladstoneRegion’s health and environmental condition. This is a method that combines a series of indicators inan appropriate manner. The weighted average technique is the most widely used technique ofcomposite index. This technique can be used where the variables have different weights in terms ofimportance in assessing performance.
The simplest formula of this technique is: 1 1 2 2 n nU y x y x y x
Where Xn is the nth variable, and Yn its corresponding weight. This is a linear aggregation method.Here, where applicable, the 0 and 1 values have been replaced with minimum and maximummembership values. Composite index development was performed using Microsoft Excel.
Qualitative analysis: The above quantitative analysis is supported by qualitative analysis such asdiscourse and thematic analysis and observation following the semi-structured selected interviews.
For further details of the survey methodology see Appendix 1.
5 STATISTICA (ver 8) is a product of StatSoft, Tulsa Oklahoma
2010 GLADSTONE INDUSTRY COMMUNITY PERCEPTION STUDY
24 Centre for Environmental Management
SECTION 2 STUDY RESULTS
The study results are presented here following an initial descriptive analysis which includes thecalculation of frequencies, mean (average) ratings along with selected cross-tabulations shown aspercentages and graphs. In the majority of cases the scales used in the survey were five point likertscales organised from negative to positive with one equating to less concerned/quality and five tobetter concerned/quality. The exceptions were: q1 self assessment of the level of knowledge ofGladstone industry and q5 rating of the liveability of the Gladstone region which are organised fromnegative to positive on a scale of one to ten.
2.1.1 Interpreting the data
For the Gladstone population, the sample size (n=520) is a statistically significant representation ofthe Gladstone population at a 95% confidence level. As the sample includes respondents who do nothave any industry nearby, these results assist in understanding the viewpoints of those living nearindustry and those who do not. Total responses were also included to highlight differences betweena particular region and the total sample population.
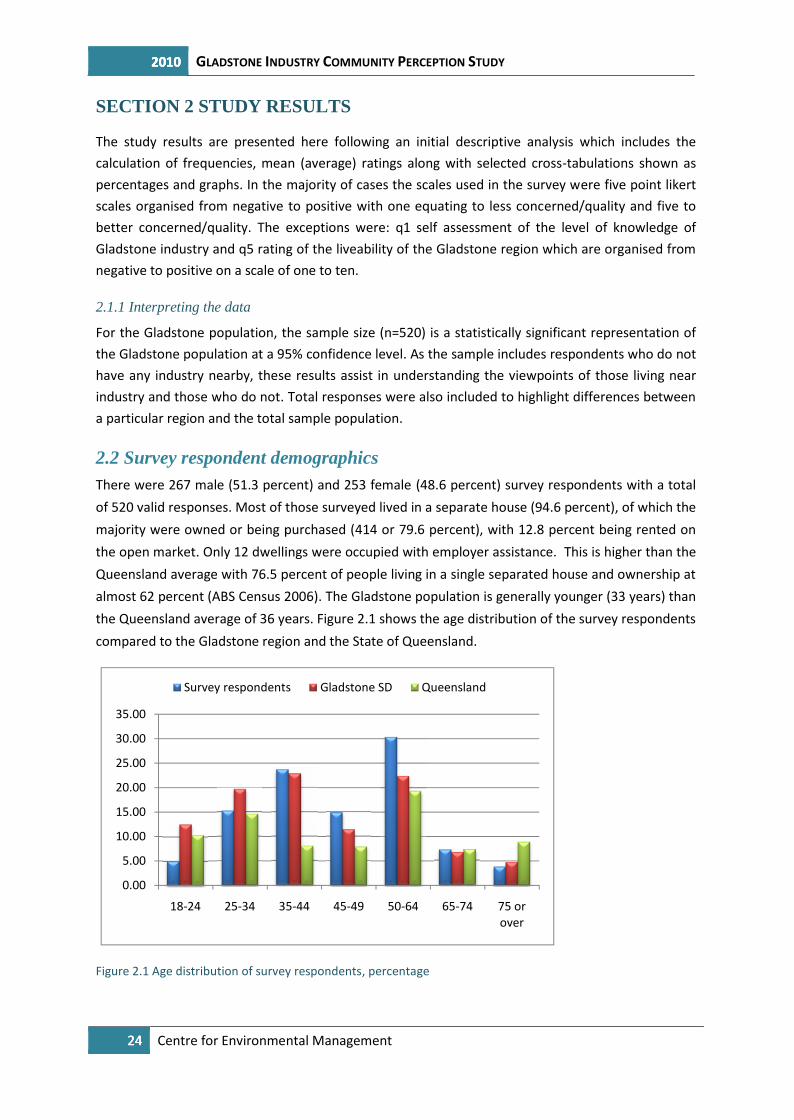
2.2 Survey respondent demographicsThere were 267 male (51.3 percent) and 253 female (48.6 percent) survey respondents with a totalof 520 valid responses. Most of those surveyed lived in a separate house (94.6 percent), of which themajority were owned or being purchased (414 or 79.6 percent), with 12.8 percent being rented onthe open market. Only 12 dwellings were occupied with employer assistance. This is higher than theQueensland average with 76.5 percent of people living in a single separated house and ownership atalmost 62 percent (ABS Census 2006). The Gladstone population is generally younger (33 years) thanthe Queensland average of 36 years. Figure 2.1 shows the age distribution of the survey respondentscompared to the Gladstone region and the State of Queensland.
Figure 2.1 Age distribution of survey respondents, percentage
0.00
5.00
10.00
15.00
20.00
25.00
30.00
35.00
18-24 25-34 35-44
Survey respondents
2010 GLADSTONE INDUSTRY COMMUNITY PERCEPTION STUDY
24 Centre for Environmental Management
SECTION 2 STUDY RESULTS
The study results are presented here following an initial descriptive analysis which includes thecalculation of frequencies, mean (average) ratings along with selected cross-tabulations shown aspercentages and graphs. In the majority of cases the scales used in the survey were five point likertscales organised from negative to positive with one equating to less concerned/quality and five tobetter concerned/quality. The exceptions were: q1 self assessment of the level of knowledge ofGladstone industry and q5 rating of the liveability of the Gladstone region which are organised fromnegative to positive on a scale of one to ten.
2.1.1 Interpreting the data
For the Gladstone population, the sample size (n=520) is a statistically significant representation ofthe Gladstone population at a 95% confidence level. As the sample includes respondents who do nothave any industry nearby, these results assist in understanding the viewpoints of those living nearindustry and those who do not. Total responses were also included to highlight differences betweena particular region and the total sample population.
2.2 Survey respondent demographicsThere were 267 male (51.3 percent) and 253 female (48.6 percent) survey respondents with a totalof 520 valid responses. Most of those surveyed lived in a separate house (94.6 percent), of which themajority were owned or being purchased (414 or 79.6 percent), with 12.8 percent being rented onthe open market. Only 12 dwellings were occupied with employer assistance. This is higher than theQueensland average with 76.5 percent of people living in a single separated house and ownership atalmost 62 percent (ABS Census 2006). The Gladstone population is generally younger (33 years) thanthe Queensland average of 36 years. Figure 2.1 shows the age distribution of the survey respondentscompared to the Gladstone region and the State of Queensland.
Figure 2.1 Age distribution of survey respondents, percentage
35-44 45-49 50-64 65-74 75 orover
Survey respondents Gladstone SD Queensland
2010 GLADSTONE INDUSTRY COMMUNITY PERCEPTION STUDY
24 Centre for Environmental Management
SECTION 2 STUDY RESULTS
The study results are presented here following an initial descriptive analysis which includes thecalculation of frequencies, mean (average) ratings along with selected cross-tabulations shown aspercentages and graphs. In the majority of cases the scales used in the survey were five point likertscales organised from negative to positive with one equating to less concerned/quality and five tobetter concerned/quality. The exceptions were: q1 self assessment of the level of knowledge ofGladstone industry and q5 rating of the liveability of the Gladstone region which are organised fromnegative to positive on a scale of one to ten.
2.1.1 Interpreting the data
For the Gladstone population, the sample size (n=520) is a statistically significant representation ofthe Gladstone population at a 95% confidence level. As the sample includes respondents who do nothave any industry nearby, these results assist in understanding the viewpoints of those living nearindustry and those who do not. Total responses were also included to highlight differences betweena particular region and the total sample population.
2.2 Survey respondent demographicsThere were 267 male (51.3 percent) and 253 female (48.6 percent) survey respondents with a totalof 520 valid responses. Most of those surveyed lived in a separate house (94.6 percent), of which themajority were owned or being purchased (414 or 79.6 percent), with 12.8 percent being rented onthe open market. Only 12 dwellings were occupied with employer assistance. This is higher than theQueensland average with 76.5 percent of people living in a single separated house and ownership atalmost 62 percent (ABS Census 2006). The Gladstone population is generally younger (33 years) thanthe Queensland average of 36 years. Figure 2.1 shows the age distribution of the survey respondentscompared to the Gladstone region and the State of Queensland.
Figure 2.1 Age distribution of survey respondents, percentage
2010
Centre for Environmental Management 25
The survey respondents differed from the general population of Gladstone in some important agecategories. For example, there was an under-representation of respondents under the age of 35 andan over representation in the 45 to 64 categories.
The largest education category was the respondents who indicated that their highest education levelwas Year 11 or lower with 178 respondents (34.2 percent), this was followed by 119 (22.8 percentwho had attained a post secondary qualification and 102 (19.6 percent) who had completed Year 12.Just over 15 percent (79 respondents) had an undergraduate degree and 7.8 percent (41) had apostgraduate degree. Within Queensland 59 percent of residents have obtained a post-secondaryqualification (incl. university degrees) which is higher than the survey respondents which was slightlylower at 45.8 percent.
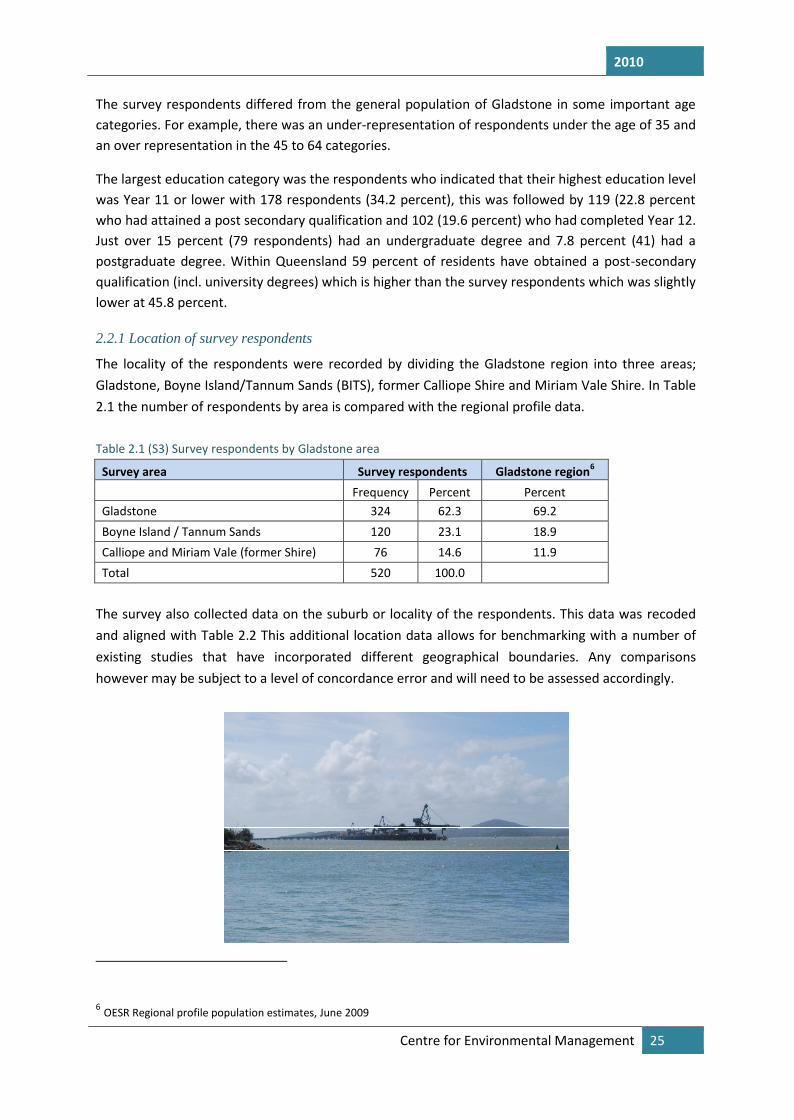
2.2.1 Location of survey respondents
The locality of the respondents were recorded by dividing the Gladstone region into three areas;Gladstone, Boyne Island/Tannum Sands (BITS), former Calliope Shire and Miriam Vale Shire. In Table2.1 the number of respondents by area is compared with the regional profile data.
Table 2.1 (S3) Survey respondents by Gladstone area
Survey area Survey respondents Gladstone region6
Frequency Percent PercentGladstone 324 62.3 69.2Boyne Island / Tannum Sands 120 23.1 18.9Calliope and Miriam Vale (former Shire) 76 14.6 11.9Total 520 100.0
The survey also collected data on the suburb or locality of the respondents. This data was recodedand aligned with Table 2.2 This additional location data allows for benchmarking with a number ofexisting studies that have incorporated different geographical boundaries. Any comparisonshowever may be subject to a level of concordance error and will need to be assessed accordingly.
6 OESR Regional profile population estimates, June 2009
2010 GLADSTONE INDUSTRY COMMUNITY PERCEPTION STUDY
26 Centre for Environmental Management
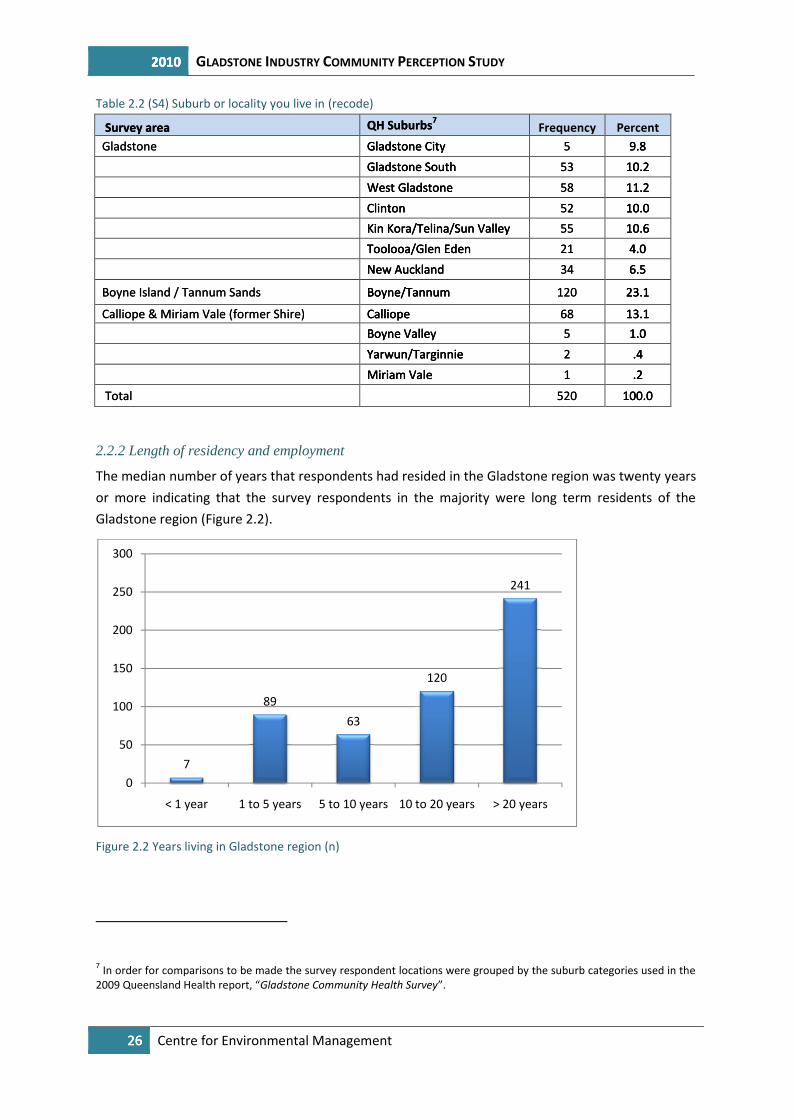
Table 2.2 (S4) Suburb or locality you live in (recode)
Survey area QH Suburbs7Frequency Percent
Gladstone Gladstone City 5 9.8Gladstone South 53 10.2West Gladstone 58 11.2Clinton 52 10.0Kin Kora/Telina/Sun Valley 55 10.6Toolooa/Glen Eden 21 4.0New Auckland 34 6.5
Boyne Island / Tannum Sands Boyne/Tannum 120 23.1
Calliope & Miriam Vale (former Shire) Calliope 68 13.1Boyne Valley 5 1.0Yarwun/Targinnie 2 .4Miriam Vale 1 .2
Total 520 100.0
2.2.2 Length of residency and employment
The median number of years that respondents had resided in the Gladstone region was twenty yearsor more indicating that the survey respondents in the majority were long term residents of theGladstone region (Figure 2.2).
Figure 2.2 Years living in Gladstone region (n)
7 In order for comparisons to be made the survey respondent locations were grouped by the suburb categories used in the2009 Queensland Health report, “Gladstone Community Health Survey”.
7
89
0
50
100
150
200
250
300
< 1 year 1 to 5 years
2010 GLADSTONE INDUSTRY COMMUNITY PERCEPTION STUDY
26 Centre for Environmental Management
Table 2.2 (S4) Suburb or locality you live in (recode)
Survey area QH Suburbs7Frequency Percent
Gladstone Gladstone City 5 9.8Gladstone South 53 10.2West Gladstone 58 11.2Clinton 52 10.0Kin Kora/Telina/Sun Valley 55 10.6Toolooa/Glen Eden 21 4.0New Auckland 34 6.5
Boyne Island / Tannum Sands Boyne/Tannum 120 23.1
Calliope & Miriam Vale (former Shire) Calliope 68 13.1Boyne Valley 5 1.0Yarwun/Targinnie 2 .4Miriam Vale 1 .2
Total 520 100.0
2.2.2 Length of residency and employment
The median number of years that respondents had resided in the Gladstone region was twenty yearsor more indicating that the survey respondents in the majority were long term residents of theGladstone region (Figure 2.2).
Figure 2.2 Years living in Gladstone region (n)
7 In order for comparisons to be made the survey respondent locations were grouped by the suburb categories used in the2009 Queensland Health report, “Gladstone Community Health Survey”.
63
120
241
1 to 5 years 5 to 10 years 10 to 20 years > 20 years
2010 GLADSTONE INDUSTRY COMMUNITY PERCEPTION STUDY
26 Centre for Environmental Management
Table 2.2 (S4) Suburb or locality you live in (recode)
Survey area QH Suburbs7Frequency Percent
Gladstone Gladstone City 5 9.8Gladstone South 53 10.2West Gladstone 58 11.2Clinton 52 10.0Kin Kora/Telina/Sun Valley 55 10.6Toolooa/Glen Eden 21 4.0New Auckland 34 6.5
Boyne Island / Tannum Sands Boyne/Tannum 120 23.1
Calliope & Miriam Vale (former Shire) Calliope 68 13.1Boyne Valley 5 1.0Yarwun/Targinnie 2 .4Miriam Vale 1 .2
Total 520 100.0
2.2.2 Length of residency and employment
The median number of years that respondents had resided in the Gladstone region was twenty yearsor more indicating that the survey respondents in the majority were long term residents of theGladstone region (Figure 2.2).
Figure 2.2 Years living in Gladstone region (n)
7 In order for comparisons to be made the survey respondent locations were grouped by the suburb categories used in the2009 Queensland Health report, “Gladstone Community Health Survey”.
2010
Centre for Environmental Management 27
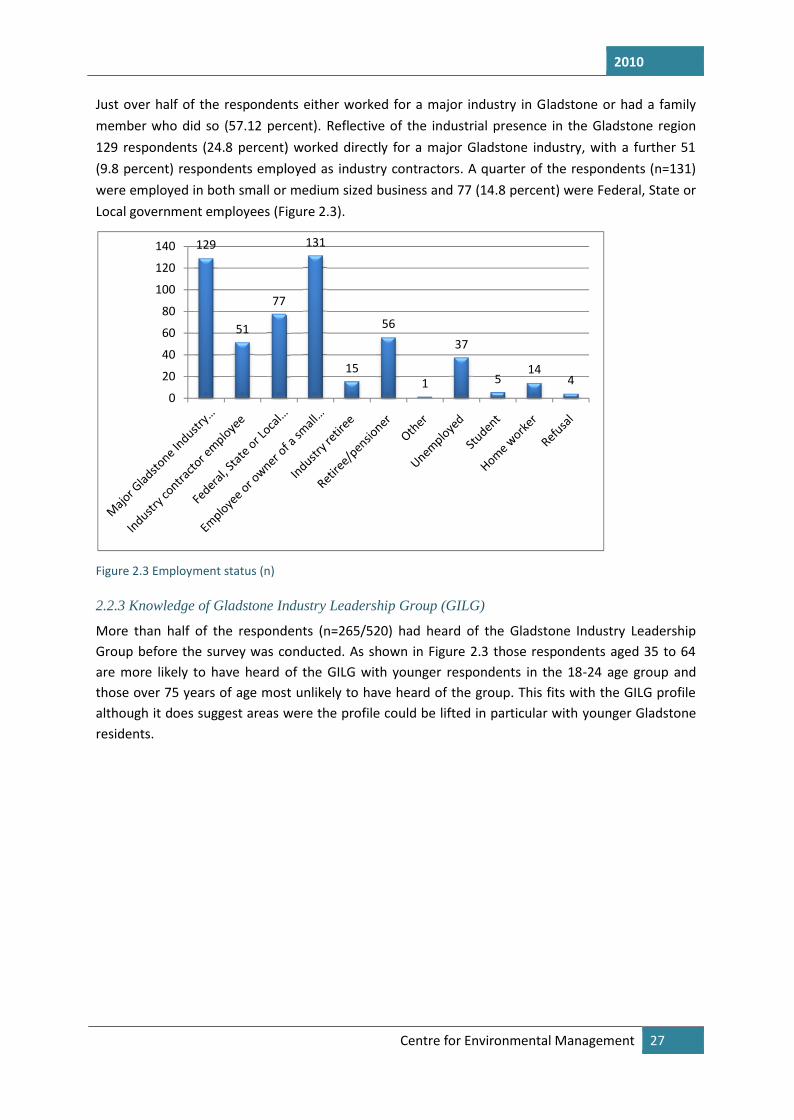
Just over half of the respondents either worked for a major industry in Gladstone or had a familymember who did so (57.12 percent). Reflective of the industrial presence in the Gladstone region129 respondents (24.8 percent) worked directly for a major Gladstone industry, with a further 51(9.8 percent) respondents employed as industry contractors. A quarter of the respondents (n=131)were employed in both small or medium sized business and 77 (14.8 percent) were Federal, State orLocal government employees (Figure 2.3).
Figure 2.3 Employment status (n)
2.2.3 Knowledge of Gladstone Industry Leadership Group (GILG)
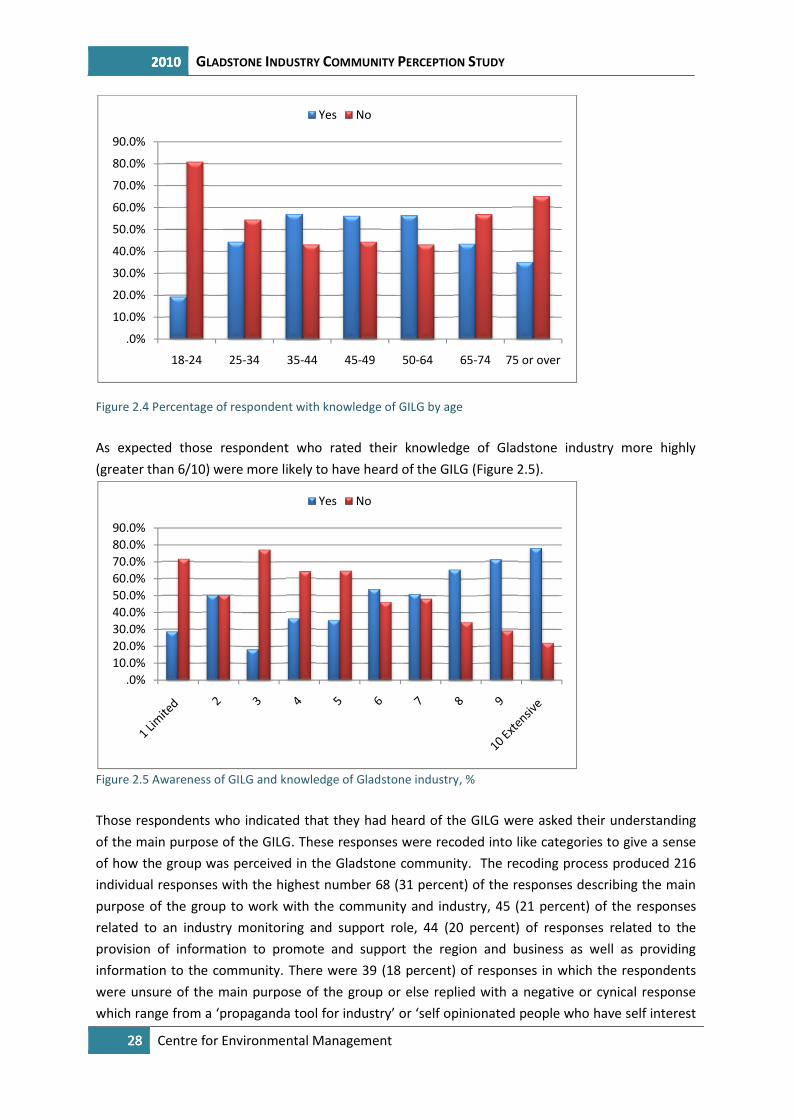
More than half of the respondents (n=265/520) had heard of the Gladstone Industry LeadershipGroup before the survey was conducted. As shown in Figure 2.3 those respondents aged 35 to 64are more likely to have heard of the GILG with younger respondents in the 18-24 age group andthose over 75 years of age most unlikely to have heard of the group. This fits with the GILG profilealthough it does suggest areas were the profile could be lifted in particular with younger Gladstoneresidents.
129
51
77
0
20
40
60
80
100
120
140
2010
Centre for Environmental Management 27
Just over half of the respondents either worked for a major industry in Gladstone or had a familymember who did so (57.12 percent). Reflective of the industrial presence in the Gladstone region129 respondents (24.8 percent) worked directly for a major Gladstone industry, with a further 51(9.8 percent) respondents employed as industry contractors. A quarter of the respondents (n=131)were employed in both small or medium sized business and 77 (14.8 percent) were Federal, State orLocal government employees (Figure 2.3).
Figure 2.3 Employment status (n)
2.2.3 Knowledge of Gladstone Industry Leadership Group (GILG)
More than half of the respondents (n=265/520) had heard of the Gladstone Industry LeadershipGroup before the survey was conducted. As shown in Figure 2.3 those respondents aged 35 to 64are more likely to have heard of the GILG with younger respondents in the 18-24 age group andthose over 75 years of age most unlikely to have heard of the group. This fits with the GILG profilealthough it does suggest areas were the profile could be lifted in particular with younger Gladstoneresidents.
77
131
15
56
1
37
514
4
2010
Centre for Environmental Management 27
Just over half of the respondents either worked for a major industry in Gladstone or had a familymember who did so (57.12 percent). Reflective of the industrial presence in the Gladstone region129 respondents (24.8 percent) worked directly for a major Gladstone industry, with a further 51(9.8 percent) respondents employed as industry contractors. A quarter of the respondents (n=131)were employed in both small or medium sized business and 77 (14.8 percent) were Federal, State orLocal government employees (Figure 2.3).
Figure 2.3 Employment status (n)
2.2.3 Knowledge of Gladstone Industry Leadership Group (GILG)
More than half of the respondents (n=265/520) had heard of the Gladstone Industry LeadershipGroup before the survey was conducted. As shown in Figure 2.3 those respondents aged 35 to 64are more likely to have heard of the GILG with younger respondents in the 18-24 age group andthose over 75 years of age most unlikely to have heard of the group. This fits with the GILG profilealthough it does suggest areas were the profile could be lifted in particular with younger Gladstoneresidents.
4
2010 GLADSTONE INDUSTRY COMMUNITY PERCEPTION STUDY
28 Centre for Environmental Management
Figure 2.4 Percentage of respondent with knowledge of GILG by age
As expected those respondent who rated their knowledge of Gladstone industry more highly(greater than 6/10) were more likely to have heard of the GILG (Figure 2.5).
Figure 2.5 Awareness of GILG and knowledge of Gladstone industry, %
Those respondents who indicated that they had heard of the GILG were asked their understandingof the main purpose of the GILG. These responses were recoded into like categories to give a senseof how the group was perceived in the Gladstone community. The recoding process produced 216individual responses with the highest number 68 (31 percent) of the responses describing the mainpurpose of the group to work with the community and industry, 45 (21 percent) of the responsesrelated to an industry monitoring and support role, 44 (20 percent) of responses related to theprovision of information to promote and support the region and business as well as providinginformation to the community. There were 39 (18 percent) of responses in which the respondentswere unsure of the main purpose of the group or else replied with a negative or cynical responsewhich range from a ‘propaganda tool for industry’ or ‘self opinionated people who have self interest
.0%
10.0%
20.0%
30.0%
40.0%
50.0%
60.0%
70.0%
80.0%
90.0%
18-24 25-34 35-44
.0%10.0%20.0%30.0%40.0%50.0%60.0%70.0%80.0%90.0%
2010 GLADSTONE INDUSTRY COMMUNITY PERCEPTION STUDY
28 Centre for Environmental Management
Figure 2.4 Percentage of respondent with knowledge of GILG by age
As expected those respondent who rated their knowledge of Gladstone industry more highly(greater than 6/10) were more likely to have heard of the GILG (Figure 2.5).
Figure 2.5 Awareness of GILG and knowledge of Gladstone industry, %
Those respondents who indicated that they had heard of the GILG were asked their understandingof the main purpose of the GILG. These responses were recoded into like categories to give a senseof how the group was perceived in the Gladstone community. The recoding process produced 216individual responses with the highest number 68 (31 percent) of the responses describing the mainpurpose of the group to work with the community and industry, 45 (21 percent) of the responsesrelated to an industry monitoring and support role, 44 (20 percent) of responses related to theprovision of information to promote and support the region and business as well as providinginformation to the community. There were 39 (18 percent) of responses in which the respondentswere unsure of the main purpose of the group or else replied with a negative or cynical responsewhich range from a ‘propaganda tool for industry’ or ‘self opinionated people who have self interest
35-44 45-49 50-64 65-74 75 or over
Yes No
Yes No
2010 GLADSTONE INDUSTRY COMMUNITY PERCEPTION STUDY
28 Centre for Environmental Management
Figure 2.4 Percentage of respondent with knowledge of GILG by age
As expected those respondent who rated their knowledge of Gladstone industry more highly(greater than 6/10) were more likely to have heard of the GILG (Figure 2.5).
Figure 2.5 Awareness of GILG and knowledge of Gladstone industry, %
Those respondents who indicated that they had heard of the GILG were asked their understandingof the main purpose of the GILG. These responses were recoded into like categories to give a senseof how the group was perceived in the Gladstone community. The recoding process produced 216individual responses with the highest number 68 (31 percent) of the responses describing the mainpurpose of the group to work with the community and industry, 45 (21 percent) of the responsesrelated to an industry monitoring and support role, 44 (20 percent) of responses related to theprovision of information to promote and support the region and business as well as providinginformation to the community. There were 39 (18 percent) of responses in which the respondentswere unsure of the main purpose of the group or else replied with a negative or cynical responsewhich range from a ‘propaganda tool for industry’ or ‘self opinionated people who have self interest
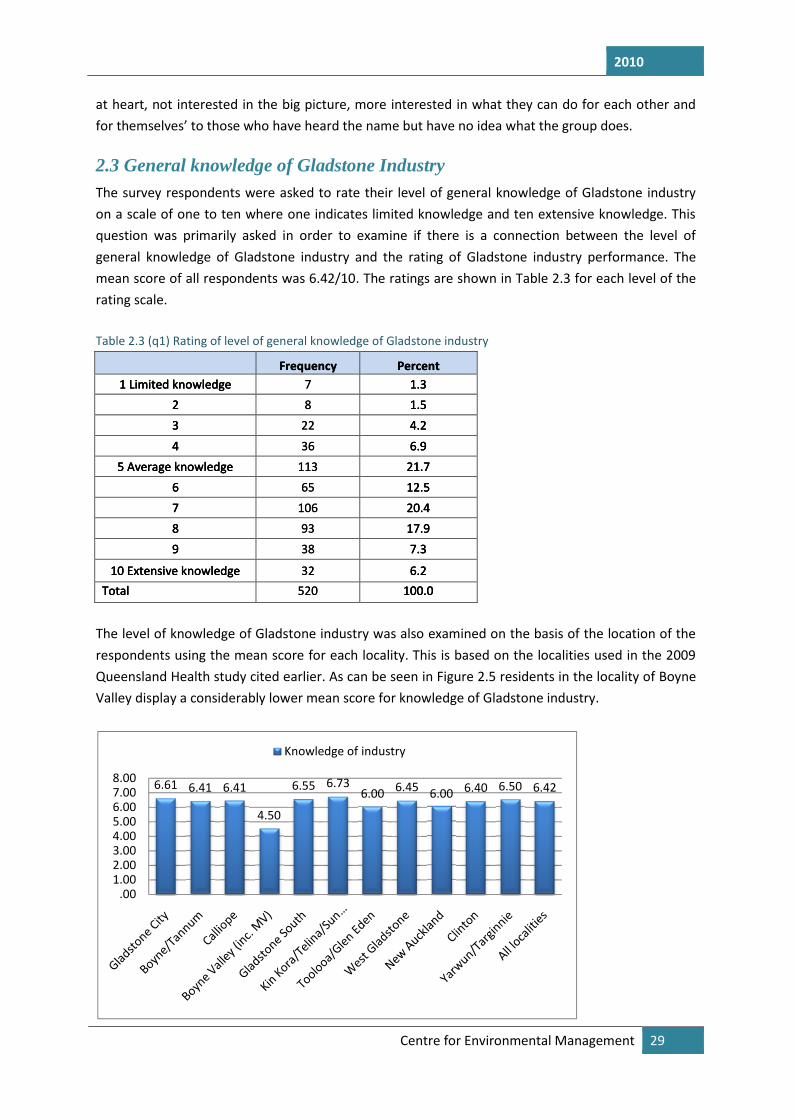
2010
Centre for Environmental Management 29
at heart, not interested in the big picture, more interested in what they can do for each other andfor themselves’ to those who have heard the name but have no idea what the group does.
2.3 General knowledge of Gladstone IndustryThe survey respondents were asked to rate their level of general knowledge of Gladstone industryon a scale of one to ten where one indicates limited knowledge and ten extensive knowledge. Thisquestion was primarily asked in order to examine if there is a connection between the level ofgeneral knowledge of Gladstone industry and the rating of Gladstone industry performance. Themean score of all respondents was 6.42/10. The ratings are shown in Table 2.3 for each level of therating scale.
Table 2.3 (q1) Rating of level of general knowledge of Gladstone industry
Frequency Percent1 Limited knowledge 7 1.3
2 8 1.53 22 4.24 36 6.9
5 Average knowledge 113 21.76 65 12.57 106 20.48 93 17.99 38 7.3
10 Extensive knowledge 32 6.2Total 520 100.0
The level of knowledge of Gladstone industry was also examined on the basis of the location of therespondents using the mean score for each locality. This is based on the localities used in the 2009Queensland Health study cited earlier. As can be seen in Figure 2.5 residents in the locality of BoyneValley display a considerably lower mean score for knowledge of Gladstone industry.
6.61 6.41 6.41
4.50
6.55
.001.002.003.004.005.006.007.008.00
Knowledge of industry
2010
Centre for Environmental Management 29
at heart, not interested in the big picture, more interested in what they can do for each other andfor themselves’ to those who have heard the name but have no idea what the group does.
2.3 General knowledge of Gladstone IndustryThe survey respondents were asked to rate their level of general knowledge of Gladstone industryon a scale of one to ten where one indicates limited knowledge and ten extensive knowledge. Thisquestion was primarily asked in order to examine if there is a connection between the level ofgeneral knowledge of Gladstone industry and the rating of Gladstone industry performance. Themean score of all respondents was 6.42/10. The ratings are shown in Table 2.3 for each level of therating scale.
Table 2.3 (q1) Rating of level of general knowledge of Gladstone industry
Frequency Percent1 Limited knowledge 7 1.3
2 8 1.53 22 4.24 36 6.9
5 Average knowledge 113 21.76 65 12.57 106 20.48 93 17.99 38 7.3
10 Extensive knowledge 32 6.2Total 520 100.0
The level of knowledge of Gladstone industry was also examined on the basis of the location of therespondents using the mean score for each locality. This is based on the localities used in the 2009Queensland Health study cited earlier. As can be seen in Figure 2.5 residents in the locality of BoyneValley display a considerably lower mean score for knowledge of Gladstone industry.
4.50
6.55 6.736.00 6.45 6.00 6.40 6.50 6.42
Knowledge of industry
2010
Centre for Environmental Management 29
at heart, not interested in the big picture, more interested in what they can do for each other andfor themselves’ to those who have heard the name but have no idea what the group does.
2.3 General knowledge of Gladstone IndustryThe survey respondents were asked to rate their level of general knowledge of Gladstone industryon a scale of one to ten where one indicates limited knowledge and ten extensive knowledge. Thisquestion was primarily asked in order to examine if there is a connection between the level ofgeneral knowledge of Gladstone industry and the rating of Gladstone industry performance. Themean score of all respondents was 6.42/10. The ratings are shown in Table 2.3 for each level of therating scale.
Table 2.3 (q1) Rating of level of general knowledge of Gladstone industry
Frequency Percent1 Limited knowledge 7 1.3
2 8 1.53 22 4.24 36 6.9
5 Average knowledge 113 21.76 65 12.57 106 20.48 93 17.99 38 7.3
10 Extensive knowledge 32 6.2Total 520 100.0
The level of knowledge of Gladstone industry was also examined on the basis of the location of therespondents using the mean score for each locality. This is based on the localities used in the 2009Queensland Health study cited earlier. As can be seen in Figure 2.5 residents in the locality of BoyneValley display a considerably lower mean score for knowledge of Gladstone industry.
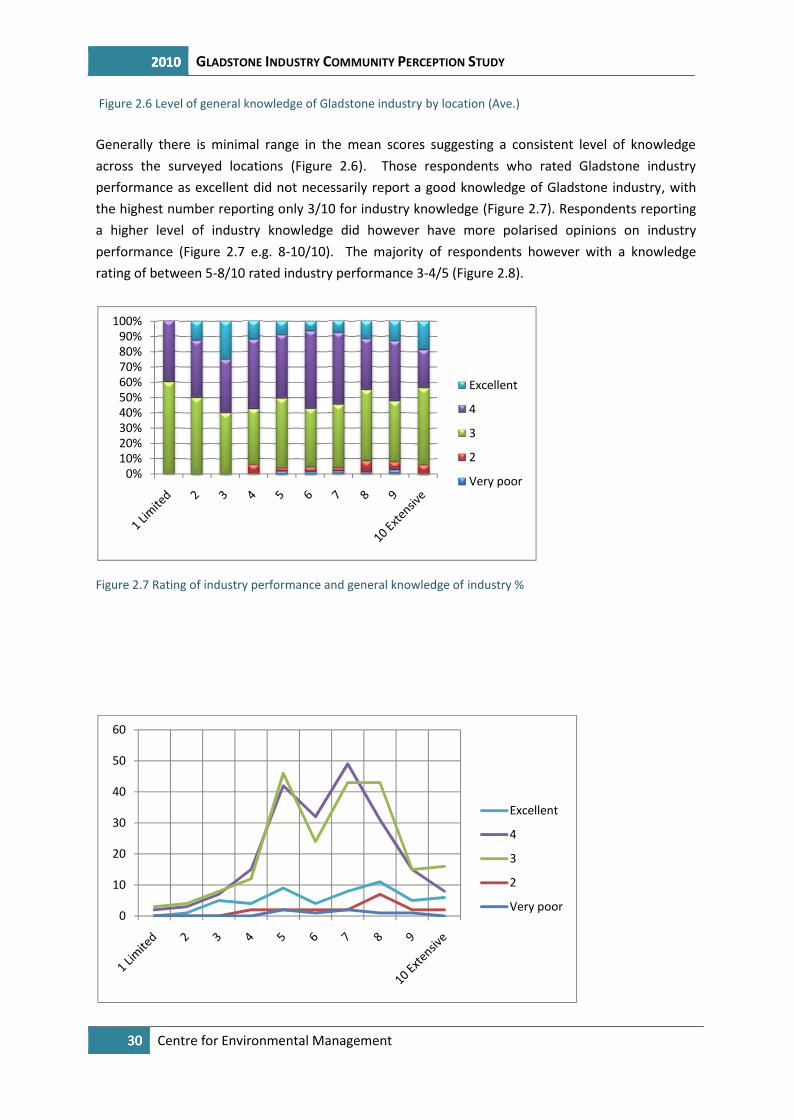
2010 GLADSTONE INDUSTRY COMMUNITY PERCEPTION STUDY
30 Centre for Environmental Management
Figure 2.6 Level of general knowledge of Gladstone industry by location (Ave.)
Generally there is minimal range in the mean scores suggesting a consistent level of knowledgeacross the surveyed locations (Figure 2.6). Those respondents who rated Gladstone industryperformance as excellent did not necessarily report a good knowledge of Gladstone industry, withthe highest number reporting only 3/10 for industry knowledge (Figure 2.7). Respondents reportinga higher level of industry knowledge did however have more polarised opinions on industryperformance (Figure 2.7 e.g. 8-10/10). The majority of respondents however with a knowledgerating of between 5-8/10 rated industry performance 3-4/5 (Figure 2.8).
Figure 2.7 Rating of industry performance and general knowledge of industry %
0%10%20%30%40%50%60%70%80%90%
100%
0
10
20
30
40
50
60
2010 GLADSTONE INDUSTRY COMMUNITY PERCEPTION STUDY
30 Centre for Environmental Management
Figure 2.6 Level of general knowledge of Gladstone industry by location (Ave.)
Generally there is minimal range in the mean scores suggesting a consistent level of knowledgeacross the surveyed locations (Figure 2.6). Those respondents who rated Gladstone industryperformance as excellent did not necessarily report a good knowledge of Gladstone industry, withthe highest number reporting only 3/10 for industry knowledge (Figure 2.7). Respondents reportinga higher level of industry knowledge did however have more polarised opinions on industryperformance (Figure 2.7 e.g. 8-10/10). The majority of respondents however with a knowledgerating of between 5-8/10 rated industry performance 3-4/5 (Figure 2.8).
Figure 2.7 Rating of industry performance and general knowledge of industry %
Excellent
4
3
2
Very poor
Excellent
4
3
2
Very poor
2010 GLADSTONE INDUSTRY COMMUNITY PERCEPTION STUDY
30 Centre for Environmental Management
Figure 2.6 Level of general knowledge of Gladstone industry by location (Ave.)
Generally there is minimal range in the mean scores suggesting a consistent level of knowledgeacross the surveyed locations (Figure 2.6). Those respondents who rated Gladstone industryperformance as excellent did not necessarily report a good knowledge of Gladstone industry, withthe highest number reporting only 3/10 for industry knowledge (Figure 2.7). Respondents reportinga higher level of industry knowledge did however have more polarised opinions on industryperformance (Figure 2.7 e.g. 8-10/10). The majority of respondents however with a knowledgerating of between 5-8/10 rated industry performance 3-4/5 (Figure 2.8).
Figure 2.7 Rating of industry performance and general knowledge of industry %
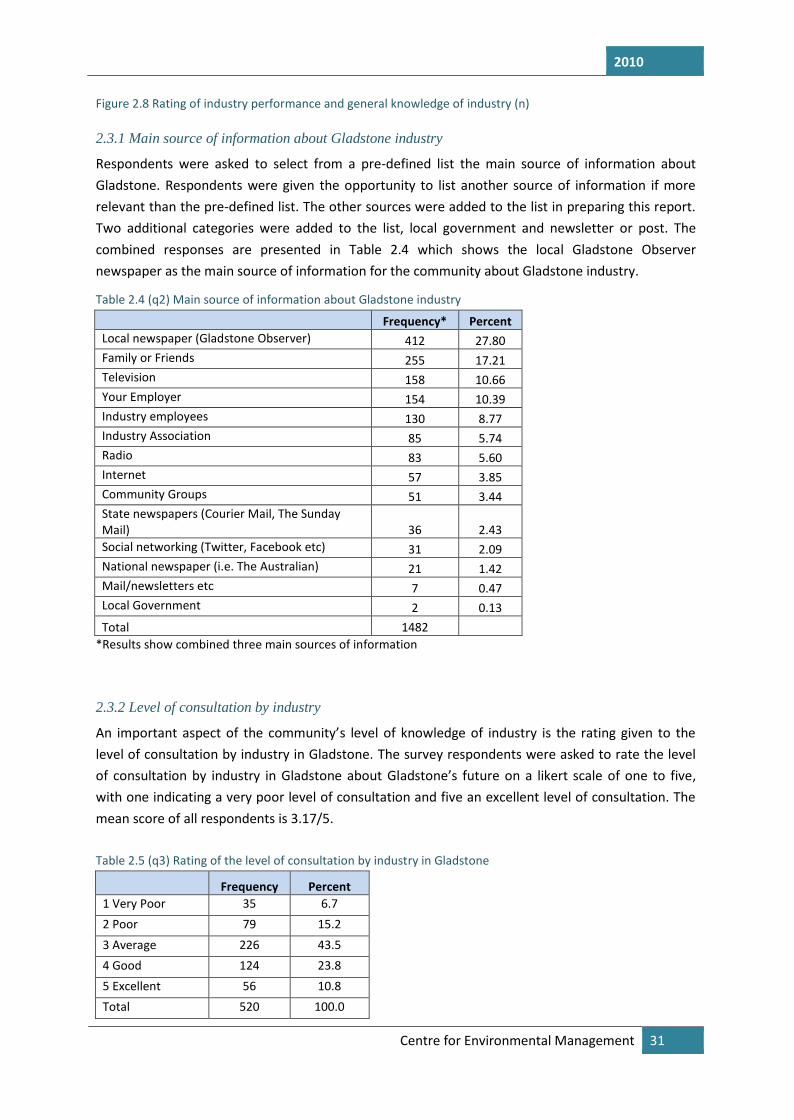
2010
Centre for Environmental Management 31
Figure 2.8 Rating of industry performance and general knowledge of industry (n)
2.3.1 Main source of information about Gladstone industry
Respondents were asked to select from a pre-defined list the main source of information aboutGladstone. Respondents were given the opportunity to list another source of information if morerelevant than the pre-defined list. The other sources were added to the list in preparing this report.Two additional categories were added to the list, local government and newsletter or post. Thecombined responses are presented in Table 2.4 which shows the local Gladstone Observernewspaper as the main source of information for the community about Gladstone industry.
Table 2.4 (q2) Main source of information about Gladstone industry
Frequency* PercentLocal newspaper (Gladstone Observer) 412 27.80Family or Friends 255 17.21Television 158 10.66Your Employer 154 10.39Industry employees 130 8.77Industry Association 85 5.74Radio 83 5.60Internet 57 3.85Community Groups 51 3.44State newspapers (Courier Mail, The SundayMail) 36 2.43Social networking (Twitter, Facebook etc) 31 2.09National newspaper (i.e. The Australian) 21 1.42Mail/newsletters etc 7 0.47Local Government 2 0.13Total 1482
*Results show combined three main sources of information
2.3.2 Level of consultation by industry
An important aspect of the community’s level of knowledge of industry is the rating given to thelevel of consultation by industry in Gladstone. The survey respondents were asked to rate the levelof consultation by industry in Gladstone about Gladstone’s future on a likert scale of one to five,with one indicating a very poor level of consultation and five an excellent level of consultation. Themean score of all respondents is 3.17/5.
Table 2.5 (q3) Rating of the level of consultation by industry in Gladstone
Frequency Percent1 Very Poor 35 6.72 Poor 79 15.23 Average 226 43.54 Good 124 23.85 Excellent 56 10.8Total 520 100.0
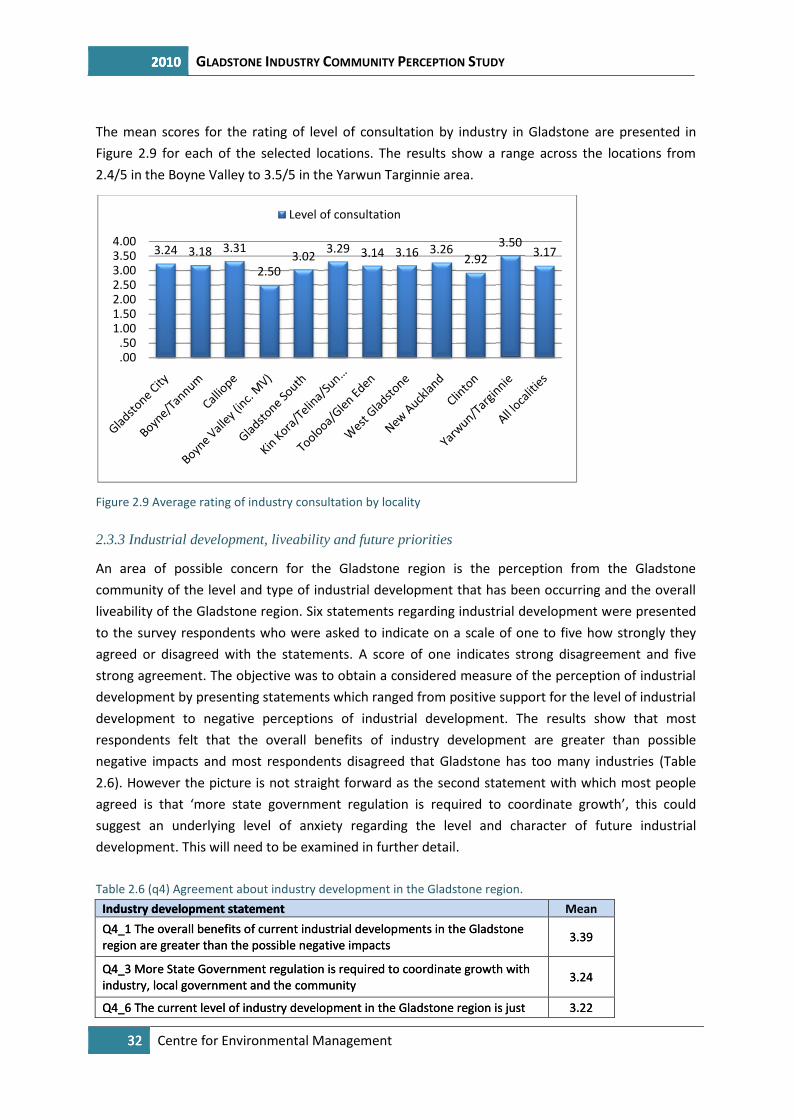
2010 GLADSTONE INDUSTRY COMMUNITY PERCEPTION STUDY
32 Centre for Environmental Management
The mean scores for the rating of level of consultation by industry in Gladstone are presented inFigure 2.9 for each of the selected locations. The results show a range across the locations from2.4/5 in the Boyne Valley to 3.5/5 in the Yarwun Targinnie area.
Figure 2.9 Average rating of industry consultation by locality
2.3.3 Industrial development, liveability and future priorities
An area of possible concern for the Gladstone region is the perception from the Gladstonecommunity of the level and type of industrial development that has been occurring and the overallliveability of the Gladstone region. Six statements regarding industrial development were presentedto the survey respondents who were asked to indicate on a scale of one to five how strongly theyagreed or disagreed with the statements. A score of one indicates strong disagreement and fivestrong agreement. The objective was to obtain a considered measure of the perception of industrialdevelopment by presenting statements which ranged from positive support for the level of industrialdevelopment to negative perceptions of industrial development. The results show that mostrespondents felt that the overall benefits of industry development are greater than possiblenegative impacts and most respondents disagreed that Gladstone has too many industries (Table2.6). However the picture is not straight forward as the second statement with which most peopleagreed is that ‘more state government regulation is required to coordinate growth’, this couldsuggest an underlying level of anxiety regarding the level and character of future industrialdevelopment. This will need to be examined in further detail.
Table 2.6 (q4) Agreement about industry development in the Gladstone region.Industry development statement MeanQ4_1 The overall benefits of current industrial developments in the Gladstoneregion are greater than the possible negative impacts 3.39
Q4_3 More State Government regulation is required to coordinate growth withindustry, local government and the community 3.24
Q4_6 The current level of industry development in the Gladstone region is just 3.22
3.24 3.18 3.31
2.503.02
.00
.501.001.502.002.503.003.504.00
Level of consultation
2010 GLADSTONE INDUSTRY COMMUNITY PERCEPTION STUDY
32 Centre for Environmental Management
The mean scores for the rating of level of consultation by industry in Gladstone are presented inFigure 2.9 for each of the selected locations. The results show a range across the locations from2.4/5 in the Boyne Valley to 3.5/5 in the Yarwun Targinnie area.
Figure 2.9 Average rating of industry consultation by locality
2.3.3 Industrial development, liveability and future priorities
An area of possible concern for the Gladstone region is the perception from the Gladstonecommunity of the level and type of industrial development that has been occurring and the overallliveability of the Gladstone region. Six statements regarding industrial development were presentedto the survey respondents who were asked to indicate on a scale of one to five how strongly theyagreed or disagreed with the statements. A score of one indicates strong disagreement and fivestrong agreement. The objective was to obtain a considered measure of the perception of industrialdevelopment by presenting statements which ranged from positive support for the level of industrialdevelopment to negative perceptions of industrial development. The results show that mostrespondents felt that the overall benefits of industry development are greater than possiblenegative impacts and most respondents disagreed that Gladstone has too many industries (Table2.6). However the picture is not straight forward as the second statement with which most peopleagreed is that ‘more state government regulation is required to coordinate growth’, this couldsuggest an underlying level of anxiety regarding the level and character of future industrialdevelopment. This will need to be examined in further detail.
Table 2.6 (q4) Agreement about industry development in the Gladstone region.Industry development statement MeanQ4_1 The overall benefits of current industrial developments in the Gladstoneregion are greater than the possible negative impacts 3.39
Q4_3 More State Government regulation is required to coordinate growth withindustry, local government and the community 3.24
Q4_6 The current level of industry development in the Gladstone region is just 3.22
2.503.02 3.29 3.14 3.16 3.26
2.923.50
3.17
Level of consultation
2010 GLADSTONE INDUSTRY COMMUNITY PERCEPTION STUDY
32 Centre for Environmental Management
The mean scores for the rating of level of consultation by industry in Gladstone are presented inFigure 2.9 for each of the selected locations. The results show a range across the locations from2.4/5 in the Boyne Valley to 3.5/5 in the Yarwun Targinnie area.
Figure 2.9 Average rating of industry consultation by locality
2.3.3 Industrial development, liveability and future priorities
An area of possible concern for the Gladstone region is the perception from the Gladstonecommunity of the level and type of industrial development that has been occurring and the overallliveability of the Gladstone region. Six statements regarding industrial development were presentedto the survey respondents who were asked to indicate on a scale of one to five how strongly theyagreed or disagreed with the statements. A score of one indicates strong disagreement and fivestrong agreement. The objective was to obtain a considered measure of the perception of industrialdevelopment by presenting statements which ranged from positive support for the level of industrialdevelopment to negative perceptions of industrial development. The results show that mostrespondents felt that the overall benefits of industry development are greater than possiblenegative impacts and most respondents disagreed that Gladstone has too many industries (Table2.6). However the picture is not straight forward as the second statement with which most peopleagreed is that ‘more state government regulation is required to coordinate growth’, this couldsuggest an underlying level of anxiety regarding the level and character of future industrialdevelopment. This will need to be examined in further detail.
Table 2.6 (q4) Agreement about industry development in the Gladstone region.Industry development statement MeanQ4_1 The overall benefits of current industrial developments in the Gladstoneregion are greater than the possible negative impacts 3.39
Q4_3 More State Government regulation is required to coordinate growth withindustry, local government and the community 3.24
Q4_6 The current level of industry development in the Gladstone region is just 3.22
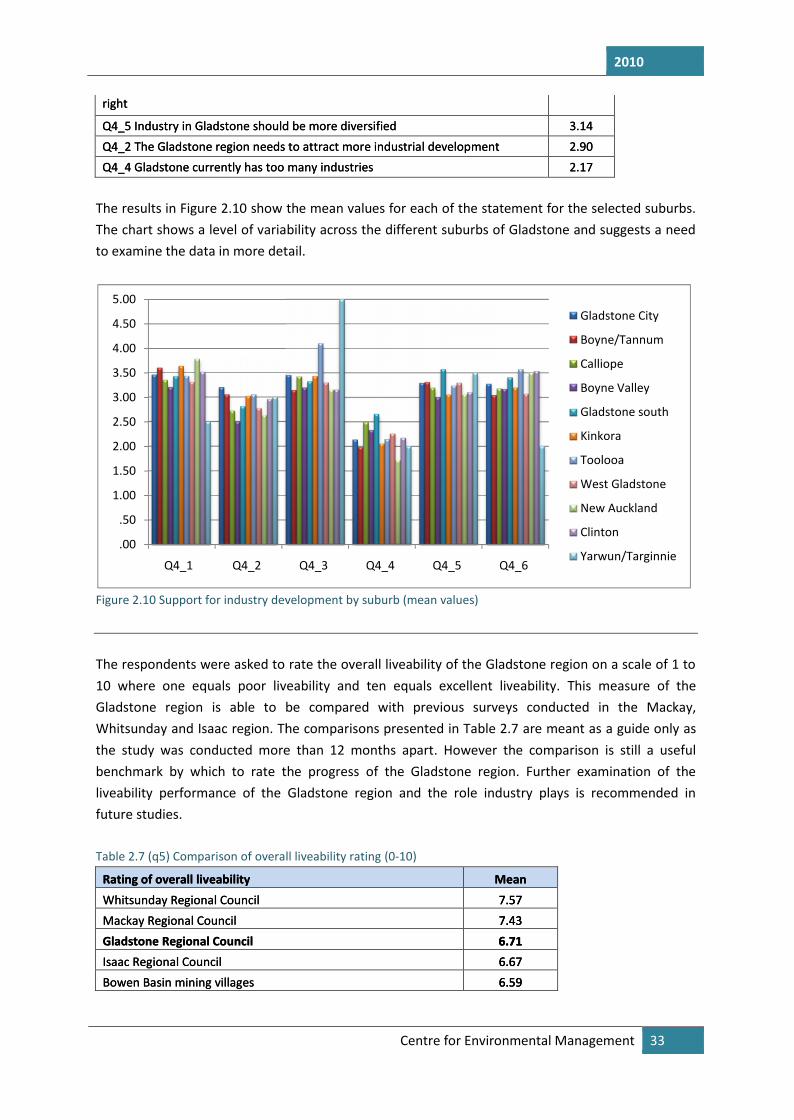
2010
Centre for Environmental Management 33
right
Q4_5 Industry in Gladstone should be more diversified 3.14Q4_2 The Gladstone region needs to attract more industrial development 2.90Q4_4 Gladstone currently has too many industries 2.17
The results in Figure 2.10 show the mean values for each of the statement for the selected suburbs.The chart shows a level of variability across the different suburbs of Gladstone and suggests a needto examine the data in more detail.
Figure 2.10 Support for industry development by suburb (mean values)
The respondents were asked to rate the overall liveability of the Gladstone region on a scale of 1 to10 where one equals poor liveability and ten equals excellent liveability. This measure of theGladstone region is able to be compared with previous surveys conducted in the Mackay,Whitsunday and Isaac region. The comparisons presented in Table 2.7 are meant as a guide only asthe study was conducted more than 12 months apart. However the comparison is still a usefulbenchmark by which to rate the progress of the Gladstone region. Further examination of theliveability performance of the Gladstone region and the role industry plays is recommended infuture studies.
Table 2.7 (q5) Comparison of overall liveability rating (0-10)
Rating of overall liveability MeanWhitsunday Regional Council 7.57Mackay Regional Council 7.43Gladstone Regional Council 6.71Isaac Regional Council 6.67Bowen Basin mining villages 6.59
.00
.50
1.00
1.50
2.00
2.50
3.00
3.50
4.00
4.50
5.00
Q4_1 Q4_2
2010
Centre for Environmental Management 33
right
Q4_5 Industry in Gladstone should be more diversified 3.14Q4_2 The Gladstone region needs to attract more industrial development 2.90Q4_4 Gladstone currently has too many industries 2.17
The results in Figure 2.10 show the mean values for each of the statement for the selected suburbs.The chart shows a level of variability across the different suburbs of Gladstone and suggests a needto examine the data in more detail.
Figure 2.10 Support for industry development by suburb (mean values)
The respondents were asked to rate the overall liveability of the Gladstone region on a scale of 1 to10 where one equals poor liveability and ten equals excellent liveability. This measure of theGladstone region is able to be compared with previous surveys conducted in the Mackay,Whitsunday and Isaac region. The comparisons presented in Table 2.7 are meant as a guide only asthe study was conducted more than 12 months apart. However the comparison is still a usefulbenchmark by which to rate the progress of the Gladstone region. Further examination of theliveability performance of the Gladstone region and the role industry plays is recommended infuture studies.
Table 2.7 (q5) Comparison of overall liveability rating (0-10)
Rating of overall liveability MeanWhitsunday Regional Council 7.57Mackay Regional Council 7.43Gladstone Regional Council 6.71Isaac Regional Council 6.67Bowen Basin mining villages 6.59
Q4_3 Q4_4 Q4_5 Q4_6
Gladstone City
Boyne/Tannum
Calliope
Boyne Valley
Gladstone south
Kinkora
Toolooa
West Gladstone
New Auckland
Clinton
Yarwun/Targinnie
2010
Centre for Environmental Management 33
right
Q4_5 Industry in Gladstone should be more diversified 3.14Q4_2 The Gladstone region needs to attract more industrial development 2.90Q4_4 Gladstone currently has too many industries 2.17
The results in Figure 2.10 show the mean values for each of the statement for the selected suburbs.The chart shows a level of variability across the different suburbs of Gladstone and suggests a needto examine the data in more detail.
Figure 2.10 Support for industry development by suburb (mean values)
The respondents were asked to rate the overall liveability of the Gladstone region on a scale of 1 to10 where one equals poor liveability and ten equals excellent liveability. This measure of theGladstone region is able to be compared with previous surveys conducted in the Mackay,Whitsunday and Isaac region. The comparisons presented in Table 2.7 are meant as a guide only asthe study was conducted more than 12 months apart. However the comparison is still a usefulbenchmark by which to rate the progress of the Gladstone region. Further examination of theliveability performance of the Gladstone region and the role industry plays is recommended infuture studies.
Table 2.7 (q5) Comparison of overall liveability rating (0-10)
Rating of overall liveability MeanWhitsunday Regional Council 7.57Mackay Regional Council 7.43Gladstone Regional Council 6.71Isaac Regional Council 6.67Bowen Basin mining villages 6.59
Gladstone City
Boyne/Tannum
Calliope
Boyne Valley
Gladstone south
Kinkora
Toolooa
West Gladstone
New Auckland
Clinton
Yarwun/Targinnie
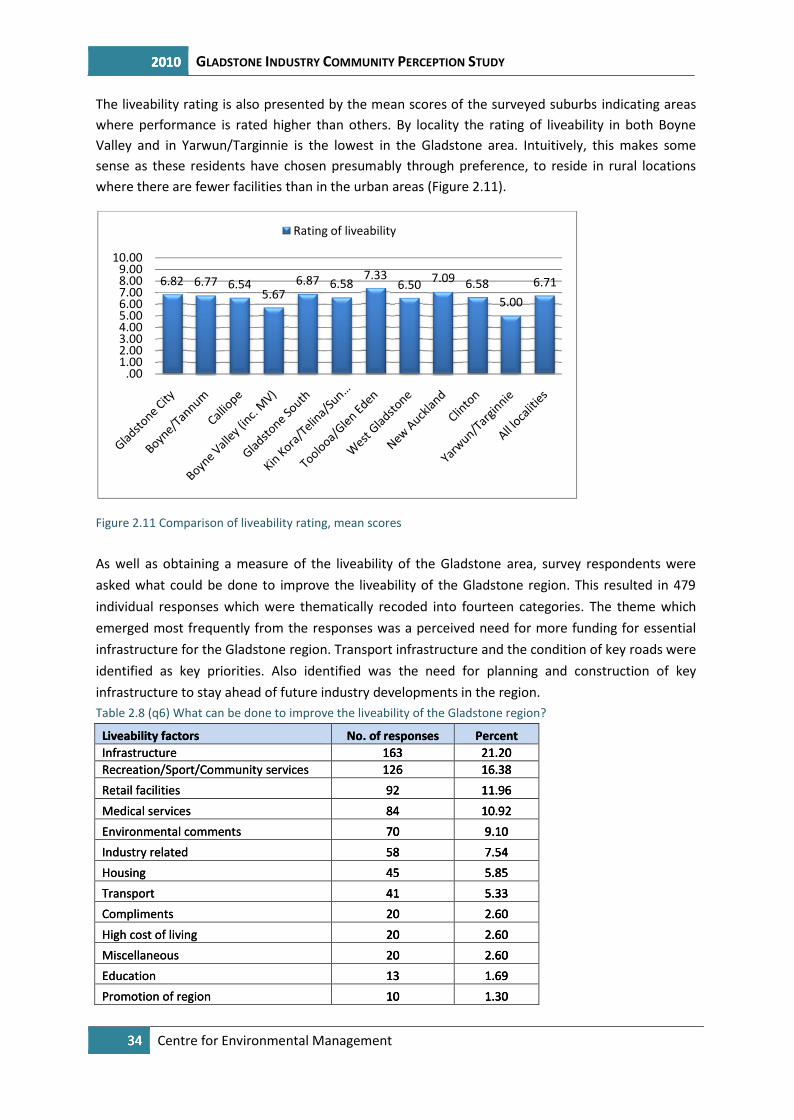
2010 GLADSTONE INDUSTRY COMMUNITY PERCEPTION STUDY
34 Centre for Environmental Management
The liveability rating is also presented by the mean scores of the surveyed suburbs indicating areaswhere performance is rated higher than others. By locality the rating of liveability in both BoyneValley and in Yarwun/Targinnie is the lowest in the Gladstone area. Intuitively, this makes somesense as these residents have chosen presumably through preference, to reside in rural locationswhere there are fewer facilities than in the urban areas (Figure 2.11).
Figure 2.11 Comparison of liveability rating, mean scores
As well as obtaining a measure of the liveability of the Gladstone area, survey respondents wereasked what could be done to improve the liveability of the Gladstone region. This resulted in 479individual responses which were thematically recoded into fourteen categories. The theme whichemerged most frequently from the responses was a perceived need for more funding for essentialinfrastructure for the Gladstone region. Transport infrastructure and the condition of key roads wereidentified as key priorities. Also identified was the need for planning and construction of keyinfrastructure to stay ahead of future industry developments in the region.Table 2.8 (q6) What can be done to improve the liveability of the Gladstone region?
Liveability factors No. of responses PercentInfrastructure 163 21.20Recreation/Sport/Community services 126 16.38Retail facilities 92 11.96Medical services 84 10.92Environmental comments 70 9.10Industry related 58 7.54Housing 45 5.85Transport 41 5.33Compliments 20 2.60High cost of living 20 2.60Miscellaneous 20 2.60Education 13 1.69Promotion of region 10 1.30
6.82 6.77 6.545.67
.001.002.003.004.005.006.007.008.009.00
10.00
Rating of liveability
2010 GLADSTONE INDUSTRY COMMUNITY PERCEPTION STUDY
34 Centre for Environmental Management
The liveability rating is also presented by the mean scores of the surveyed suburbs indicating areaswhere performance is rated higher than others. By locality the rating of liveability in both BoyneValley and in Yarwun/Targinnie is the lowest in the Gladstone area. Intuitively, this makes somesense as these residents have chosen presumably through preference, to reside in rural locationswhere there are fewer facilities than in the urban areas (Figure 2.11).
Figure 2.11 Comparison of liveability rating, mean scores
As well as obtaining a measure of the liveability of the Gladstone area, survey respondents wereasked what could be done to improve the liveability of the Gladstone region. This resulted in 479individual responses which were thematically recoded into fourteen categories. The theme whichemerged most frequently from the responses was a perceived need for more funding for essentialinfrastructure for the Gladstone region. Transport infrastructure and the condition of key roads wereidentified as key priorities. Also identified was the need for planning and construction of keyinfrastructure to stay ahead of future industry developments in the region.Table 2.8 (q6) What can be done to improve the liveability of the Gladstone region?
Liveability factors No. of responses PercentInfrastructure 163 21.20Recreation/Sport/Community services 126 16.38Retail facilities 92 11.96Medical services 84 10.92Environmental comments 70 9.10Industry related 58 7.54Housing 45 5.85Transport 41 5.33Compliments 20 2.60High cost of living 20 2.60Miscellaneous 20 2.60Education 13 1.69Promotion of region 10 1.30
5.676.87 6.58
7.336.50 7.09 6.58
5.006.71
Rating of liveability
2010 GLADSTONE INDUSTRY COMMUNITY PERCEPTION STUDY
34 Centre for Environmental Management
The liveability rating is also presented by the mean scores of the surveyed suburbs indicating areaswhere performance is rated higher than others. By locality the rating of liveability in both BoyneValley and in Yarwun/Targinnie is the lowest in the Gladstone area. Intuitively, this makes somesense as these residents have chosen presumably through preference, to reside in rural locationswhere there are fewer facilities than in the urban areas (Figure 2.11).
Figure 2.11 Comparison of liveability rating, mean scores
As well as obtaining a measure of the liveability of the Gladstone area, survey respondents wereasked what could be done to improve the liveability of the Gladstone region. This resulted in 479individual responses which were thematically recoded into fourteen categories. The theme whichemerged most frequently from the responses was a perceived need for more funding for essentialinfrastructure for the Gladstone region. Transport infrastructure and the condition of key roads wereidentified as key priorities. Also identified was the need for planning and construction of keyinfrastructure to stay ahead of future industry developments in the region.Table 2.8 (q6) What can be done to improve the liveability of the Gladstone region?
Liveability factors No. of responses PercentInfrastructure 163 21.20Recreation/Sport/Community services 126 16.38Retail facilities 92 11.96Medical services 84 10.92Environmental comments 70 9.10Industry related 58 7.54Housing 45 5.85Transport 41 5.33Compliments 20 2.60High cost of living 20 2.60Miscellaneous 20 2.60Education 13 1.69Promotion of region 10 1.30
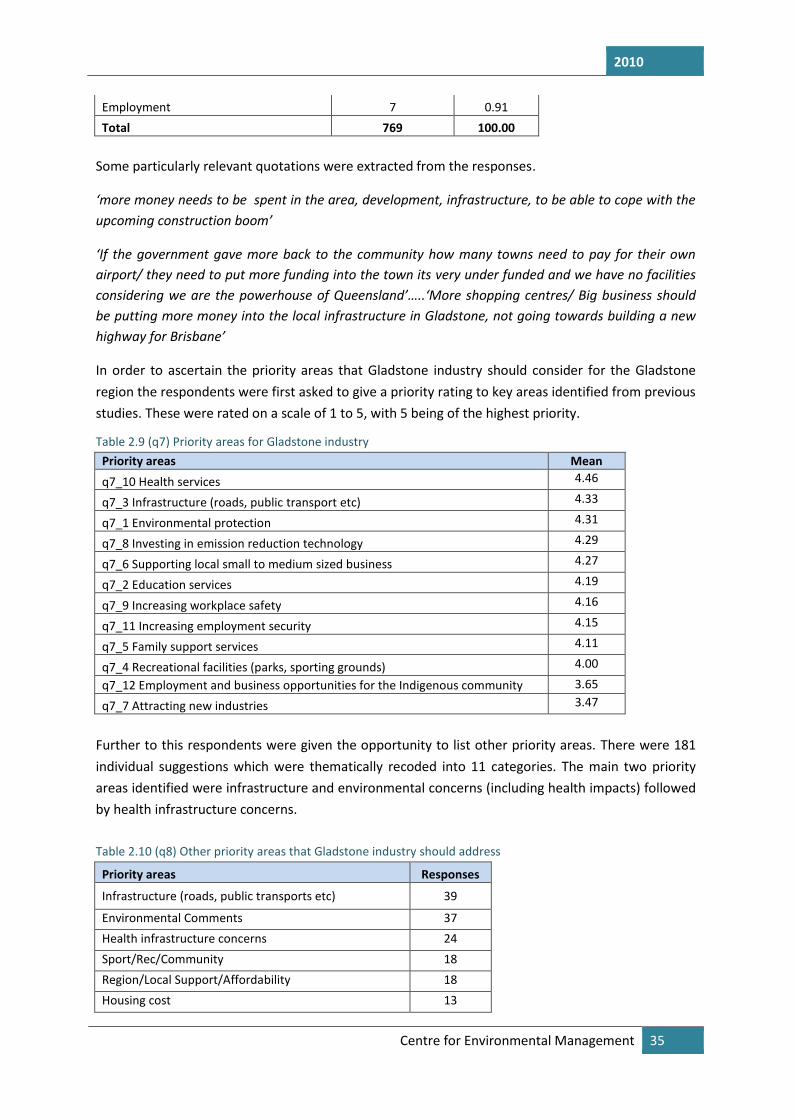
2010
Centre for Environmental Management 35
Employment 7 0.91Total 769 100.00
Some particularly relevant quotations were extracted from the responses.
‘more money needs to be spent in the area, development, infrastructure, to be able to cope with theupcoming construction boom’
‘If the government gave more back to the community how many towns need to pay for their ownairport/ they need to put more funding into the town its very under funded and we have no facilitiesconsidering we are the powerhouse of Queensland’…..‘More shopping centres/ Big business shouldbe putting more money into the local infrastructure in Gladstone, not going towards building a newhighway for Brisbane’
In order to ascertain the priority areas that Gladstone industry should consider for the Gladstoneregion the respondents were first asked to give a priority rating to key areas identified from previousstudies. These were rated on a scale of 1 to 5, with 5 being of the highest priority.
Table 2.9 (q7) Priority areas for Gladstone industryPriority areas Meanq7_10 Health services 4.46
q7_3 Infrastructure (roads, public transport etc) 4.33
q7_1 Environmental protection 4.31
q7_8 Investing in emission reduction technology 4.29
q7_6 Supporting local small to medium sized business 4.27
q7_2 Education services 4.19
q7_9 Increasing workplace safety 4.16
q7_11 Increasing employment security 4.15
q7_5 Family support services 4.11
q7_4 Recreational facilities (parks, sporting grounds) 4.00
q7_12 Employment and business opportunities for the Indigenous community 3.65
q7_7 Attracting new industries 3.47
Further to this respondents were given the opportunity to list other priority areas. There were 181individual suggestions which were thematically recoded into 11 categories. The main two priorityareas identified were infrastructure and environmental concerns (including health impacts) followedby health infrastructure concerns.
Table 2.10 (q8) Other priority areas that Gladstone industry should address
Priority areas Responses
Infrastructure (roads, public transports etc) 39
Environmental Comments 37Health infrastructure concerns 24Sport/Rec/Community 18Region/Local Support/Affordability 18Housing cost 13
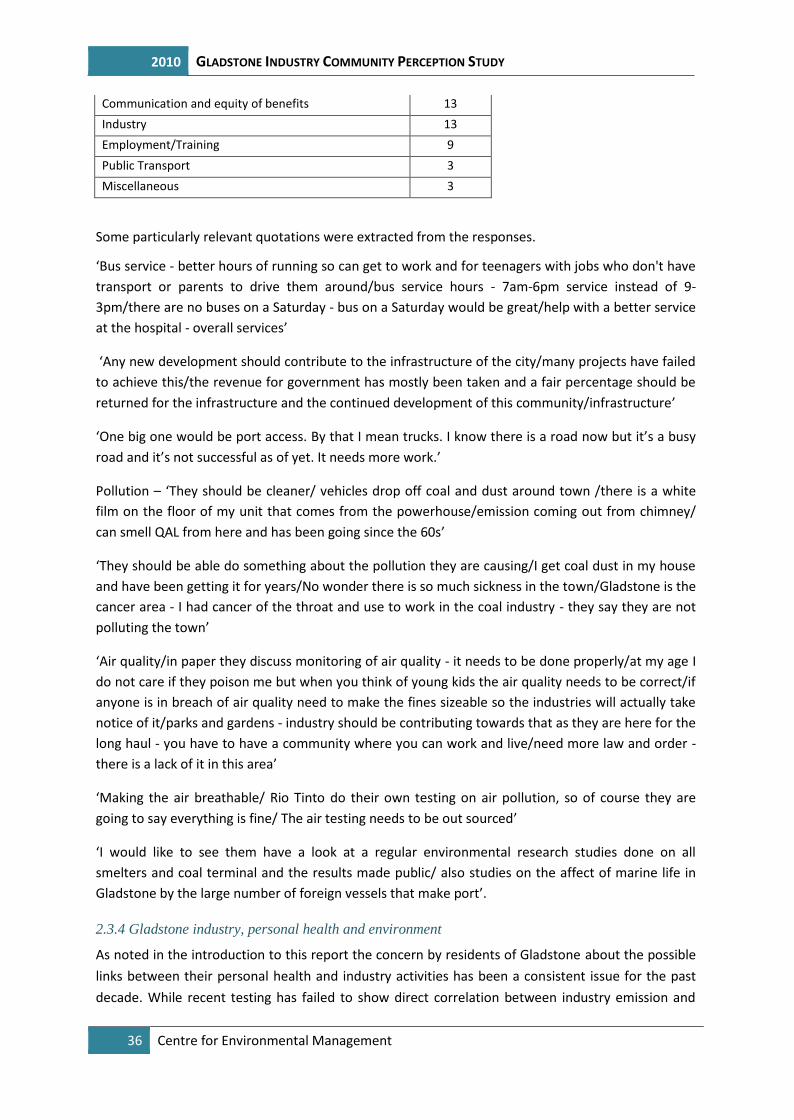
2010 GLADSTONE INDUSTRY COMMUNITY PERCEPTION STUDY
36 Centre for Environmental Management
Communication and equity of benefits 13Industry 13Employment/Training 9Public Transport 3Miscellaneous 3
Some particularly relevant quotations were extracted from the responses.
‘Bus service - better hours of running so can get to work and for teenagers with jobs who don't havetransport or parents to drive them around/bus service hours - 7am-6pm service instead of 9-3pm/there are no buses on a Saturday - bus on a Saturday would be great/help with a better serviceat the hospital - overall services’
‘Any new development should contribute to the infrastructure of the city/many projects have failedto achieve this/the revenue for government has mostly been taken and a fair percentage should bereturned for the infrastructure and the continued development of this community/infrastructure’
‘One big one would be port access. By that I mean trucks. I know there is a road now but it’s a busyroad and it’s not successful as of yet. It needs more work.’
Pollution – ‘They should be cleaner/ vehicles drop off coal and dust around town /there is a whitefilm on the floor of my unit that comes from the powerhouse/emission coming out from chimney/can smell QAL from here and has been going since the 60s’
‘They should be able do something about the pollution they are causing/I get coal dust in my houseand have been getting it for years/No wonder there is so much sickness in the town/Gladstone is thecancer area - I had cancer of the throat and use to work in the coal industry - they say they are notpolluting the town’
‘Air quality/in paper they discuss monitoring of air quality - it needs to be done properly/at my age Ido not care if they poison me but when you think of young kids the air quality needs to be correct/ifanyone is in breach of air quality need to make the fines sizeable so the industries will actually takenotice of it/parks and gardens - industry should be contributing towards that as they are here for thelong haul - you have to have a community where you can work and live/need more law and order -there is a lack of it in this area’
‘Making the air breathable/ Rio Tinto do their own testing on air pollution, so of course they aregoing to say everything is fine/ The air testing needs to be out sourced’
‘I would like to see them have a look at a regular environmental research studies done on allsmelters and coal terminal and the results made public/ also studies on the affect of marine life inGladstone by the large number of foreign vessels that make port’.
2.3.4 Gladstone industry, personal health and environment
As noted in the introduction to this report the concern by residents of Gladstone about the possiblelinks between their personal health and industry activities has been a consistent issue for the pastdecade. While recent testing has failed to show direct correlation between industry emission and
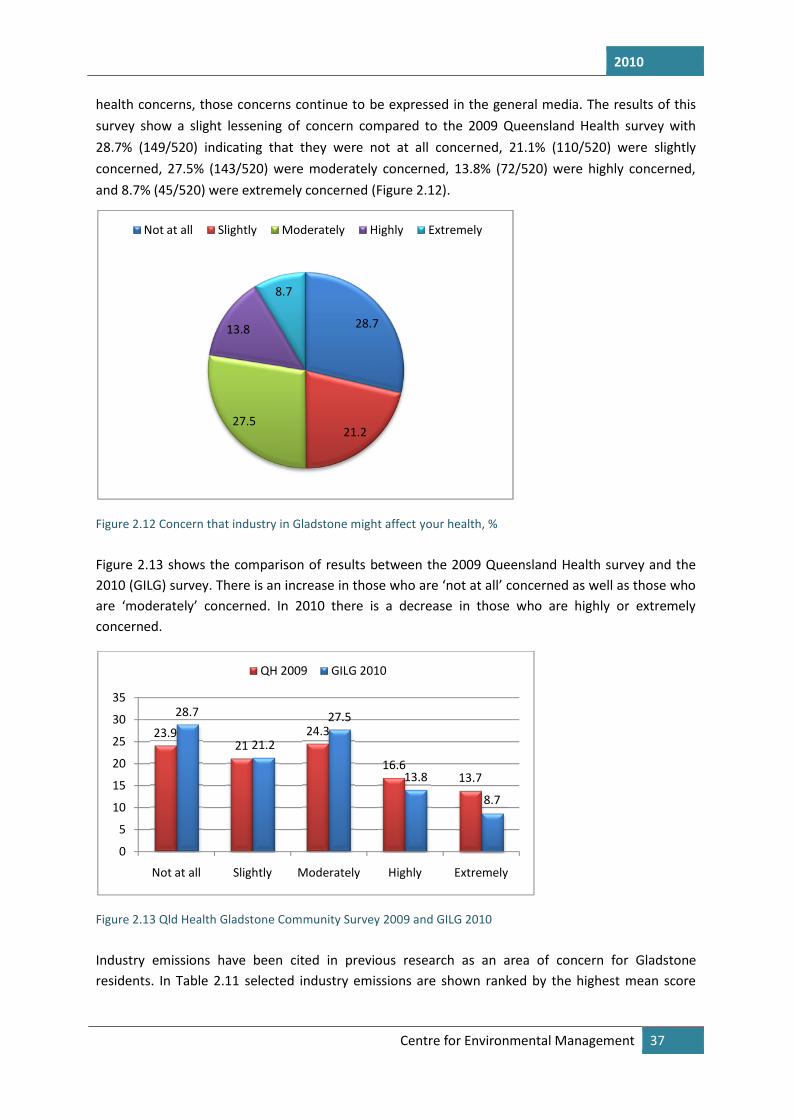
2010
Centre for Environmental Management 37
health concerns, those concerns continue to be expressed in the general media. The results of thissurvey show a slight lessening of concern compared to the 2009 Queensland Health survey with28.7% (149/520) indicating that they were not at all concerned, 21.1% (110/520) were slightlyconcerned, 27.5% (143/520) were moderately concerned, 13.8% (72/520) were highly concerned,and 8.7% (45/520) were extremely concerned (Figure 2.12).
Figure 2.12 Concern that industry in Gladstone might affect your health, %
Figure 2.13 shows the comparison of results between the 2009 Queensland Health survey and the2010 (GILG) survey. There is an increase in those who are ‘not at all’ concerned as well as those whoare ‘moderately’ concerned. In 2010 there is a decrease in those who are highly or extremelyconcerned.
Figure 2.13 Qld Health Gladstone Community Survey 2009 and GILG 2010
Industry emissions have been cited in previous research as an area of concern for Gladstoneresidents. In Table 2.11 selected industry emissions are shown ranked by the highest mean score
27.5
13.8
8.7
Not at all Slightly Moderately
23.921
28.7
21.2
0
5
10
15
20
25
30
35
Not at all Slightly
QH 2009
2010
Centre for Environmental Management 37
health concerns, those concerns continue to be expressed in the general media. The results of thissurvey show a slight lessening of concern compared to the 2009 Queensland Health survey with28.7% (149/520) indicating that they were not at all concerned, 21.1% (110/520) were slightlyconcerned, 27.5% (143/520) were moderately concerned, 13.8% (72/520) were highly concerned,and 8.7% (45/520) were extremely concerned (Figure 2.12).
Figure 2.12 Concern that industry in Gladstone might affect your health, %
Figure 2.13 shows the comparison of results between the 2009 Queensland Health survey and the2010 (GILG) survey. There is an increase in those who are ‘not at all’ concerned as well as those whoare ‘moderately’ concerned. In 2010 there is a decrease in those who are highly or extremelyconcerned.
Figure 2.13 Qld Health Gladstone Community Survey 2009 and GILG 2010
Industry emissions have been cited in previous research as an area of concern for Gladstoneresidents. In Table 2.11 selected industry emissions are shown ranked by the highest mean score
28.7
21.2
8.7
Moderately Highly Extremely
24.3
16.613.7
27.5
13.8
8.7
Moderately Highly Extremely
QH 2009 GILG 2010
2010
Centre for Environmental Management 37
health concerns, those concerns continue to be expressed in the general media. The results of thissurvey show a slight lessening of concern compared to the 2009 Queensland Health survey with28.7% (149/520) indicating that they were not at all concerned, 21.1% (110/520) were slightlyconcerned, 27.5% (143/520) were moderately concerned, 13.8% (72/520) were highly concerned,and 8.7% (45/520) were extremely concerned (Figure 2.12).
Figure 2.12 Concern that industry in Gladstone might affect your health, %
Figure 2.13 shows the comparison of results between the 2009 Queensland Health survey and the2010 (GILG) survey. There is an increase in those who are ‘not at all’ concerned as well as those whoare ‘moderately’ concerned. In 2010 there is a decrease in those who are highly or extremelyconcerned.
Figure 2.13 Qld Health Gladstone Community Survey 2009 and GILG 2010
Industry emissions have been cited in previous research as an area of concern for Gladstoneresidents. In Table 2.11 selected industry emissions are shown ranked by the highest mean score
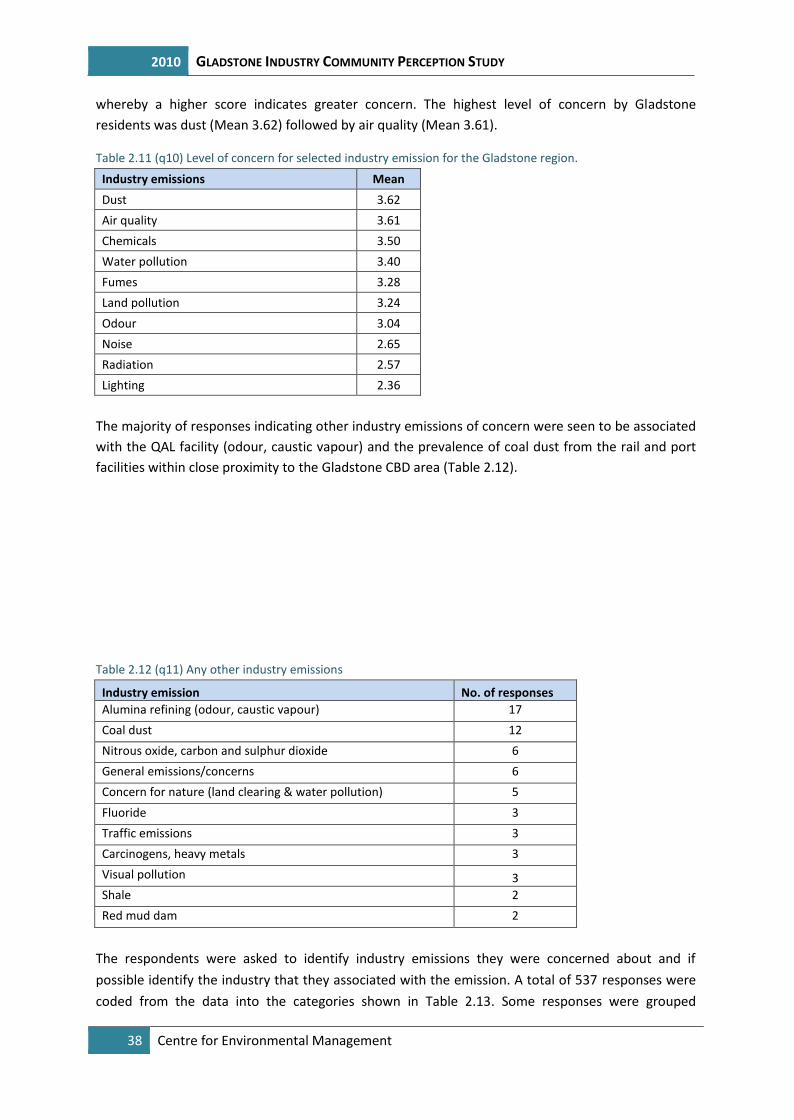
2010 GLADSTONE INDUSTRY COMMUNITY PERCEPTION STUDY
38 Centre for Environmental Management
whereby a higher score indicates greater concern. The highest level of concern by Gladstoneresidents was dust (Mean 3.62) followed by air quality (Mean 3.61).
Table 2.11 (q10) Level of concern for selected industry emission for the Gladstone region.
Industry emissions MeanDust 3.62Air quality 3.61Chemicals 3.50Water pollution 3.40Fumes 3.28Land pollution 3.24Odour 3.04Noise 2.65Radiation 2.57Lighting 2.36
The majority of responses indicating other industry emissions of concern were seen to be associatedwith the QAL facility (odour, caustic vapour) and the prevalence of coal dust from the rail and portfacilities within close proximity to the Gladstone CBD area (Table 2.12).
Table 2.12 (q11) Any other industry emissions
Industry emission No. of responsesAlumina refining (odour, caustic vapour) 17Coal dust 12Nitrous oxide, carbon and sulphur dioxide 6General emissions/concerns 6Concern for nature (land clearing & water pollution) 5Fluoride 3Traffic emissions 3Carcinogens, heavy metals 3Visual pollution 3Shale 2Red mud dam 2
The respondents were asked to identify industry emissions they were concerned about and ifpossible identify the industry that they associated with the emission. A total of 537 responses werecoded from the data into the categories shown in Table 2.13. Some responses were grouped
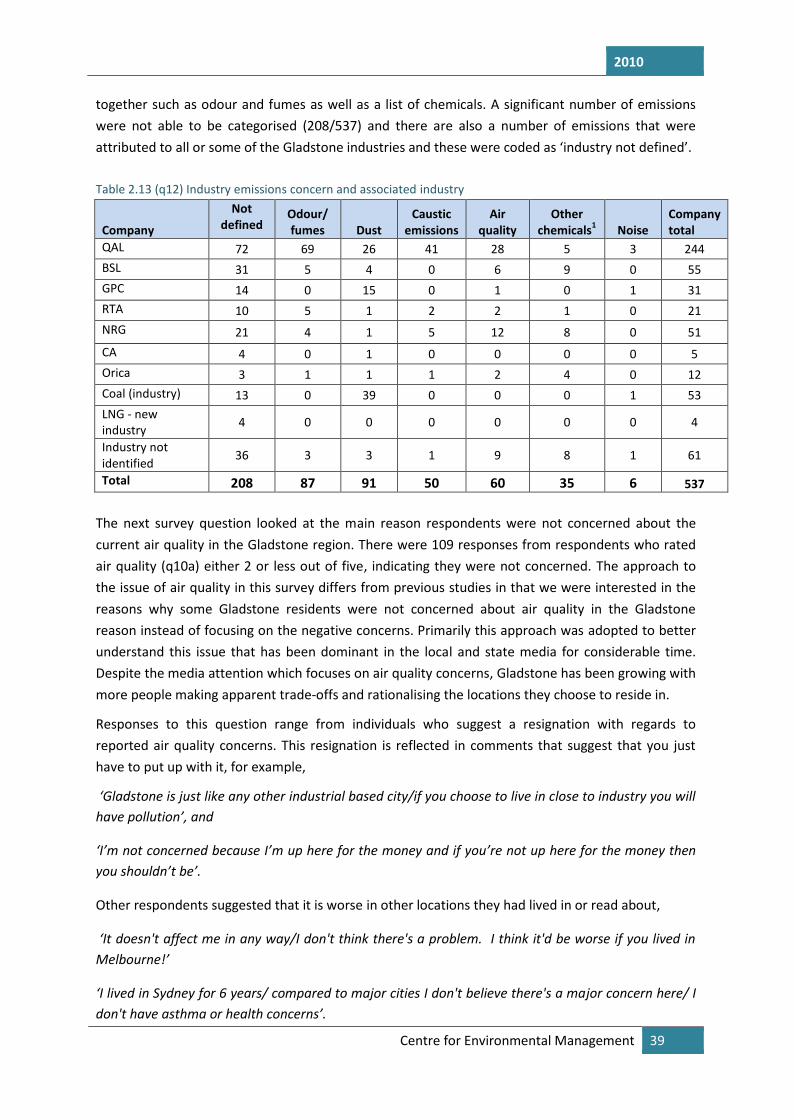
2010
Centre for Environmental Management 39
together such as odour and fumes as well as a list of chemicals. A significant number of emissionswere not able to be categorised (208/537) and there are also a number of emissions that wereattributed to all or some of the Gladstone industries and these were coded as ‘industry not defined’.
Table 2.13 (q12) Industry emissions concern and associated industry
Company
Notdefined
Odour/fumes Dust
Causticemissions
Airquality
Otherchemicals1 Noise
Companytotal
QAL 72 69 26 41 28 5 3 244BSL 31 5 4 0 6 9 0 55GPC 14 0 15 0 1 0 1 31RTA 10 5 1 2 2 1 0 21NRG 21 4 1 5 12 8 0 51CA 4 0 1 0 0 0 0 5Orica 3 1 1 1 2 4 0 12Coal (industry) 13 0 39 0 0 0 1 53LNG - newindustry 4 0 0 0 0 0 0 4
Industry notidentified 36 3 3 1 9 8 1 61
Total 208 87 91 50 60 35 6 537
The next survey question looked at the main reason respondents were not concerned about thecurrent air quality in the Gladstone region. There were 109 responses from respondents who ratedair quality (q10a) either 2 or less out of five, indicating they were not concerned. The approach tothe issue of air quality in this survey differs from previous studies in that we were interested in thereasons why some Gladstone residents were not concerned about air quality in the Gladstonereason instead of focusing on the negative concerns. Primarily this approach was adopted to betterunderstand this issue that has been dominant in the local and state media for considerable time.Despite the media attention which focuses on air quality concerns, Gladstone has been growing withmore people making apparent trade-offs and rationalising the locations they choose to reside in.
Responses to this question range from individuals who suggest a resignation with regards toreported air quality concerns. This resignation is reflected in comments that suggest that you justhave to put up with it, for example,
‘Gladstone is just like any other industrial based city/if you choose to live in close to industry you willhave pollution’, and
‘I’m not concerned because I’m up here for the money and if you’re not up here for the money thenyou shouldn’t be’.
Other respondents suggested that it is worse in other locations they had lived in or read about,
‘It doesn't affect me in any way/I don't think there's a problem. I think it'd be worse if you lived inMelbourne!’
‘I lived in Sydney for 6 years/ compared to major cities I don't believe there's a major concern here/ Idon't have asthma or health concerns’.
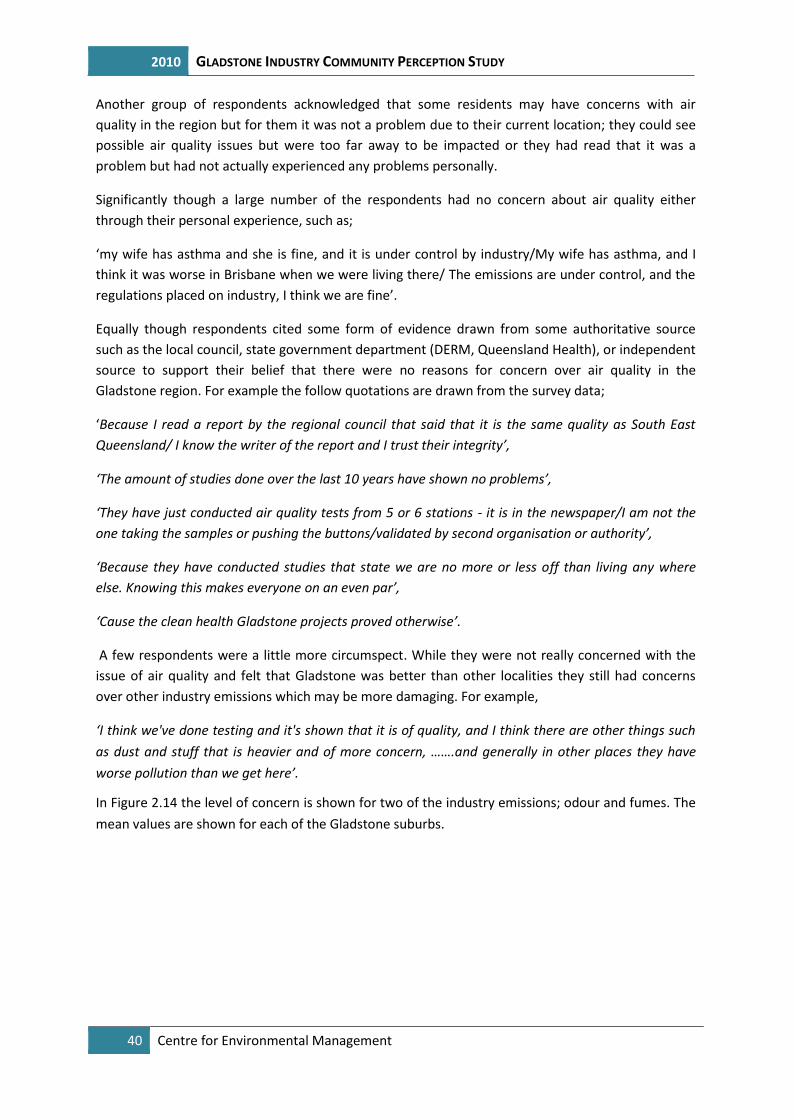
2010 GLADSTONE INDUSTRY COMMUNITY PERCEPTION STUDY
40 Centre for Environmental Management
Another group of respondents acknowledged that some residents may have concerns with airquality in the region but for them it was not a problem due to their current location; they could seepossible air quality issues but were too far away to be impacted or they had read that it was aproblem but had not actually experienced any problems personally.
Significantly though a large number of the respondents had no concern about air quality eitherthrough their personal experience, such as;
‘my wife has asthma and she is fine, and it is under control by industry/My wife has asthma, and Ithink it was worse in Brisbane when we were living there/ The emissions are under control, and theregulations placed on industry, I think we are fine’.
Equally though respondents cited some form of evidence drawn from some authoritative sourcesuch as the local council, state government department (DERM, Queensland Health), or independentsource to support their belief that there were no reasons for concern over air quality in theGladstone region. For example the follow quotations are drawn from the survey data;
‘Because I read a report by the regional council that said that it is the same quality as South EastQueensland/ I know the writer of the report and I trust their integrity’,
‘The amount of studies done over the last 10 years have shown no problems’,
‘They have just conducted air quality tests from 5 or 6 stations - it is in the newspaper/I am not theone taking the samples or pushing the buttons/validated by second organisation or authority’,
‘Because they have conducted studies that state we are no more or less off than living any whereelse. Knowing this makes everyone on an even par’,
‘Cause the clean health Gladstone projects proved otherwise’.
A few respondents were a little more circumspect. While they were not really concerned with theissue of air quality and felt that Gladstone was better than other localities they still had concernsover other industry emissions which may be more damaging. For example,
‘I think we've done testing and it's shown that it is of quality, and I think there are other things suchas dust and stuff that is heavier and of more concern, …….and generally in other places they haveworse pollution than we get here’.
In Figure 2.14 the level of concern is shown for two of the industry emissions; odour and fumes. Themean values are shown for each of the Gladstone suburbs.
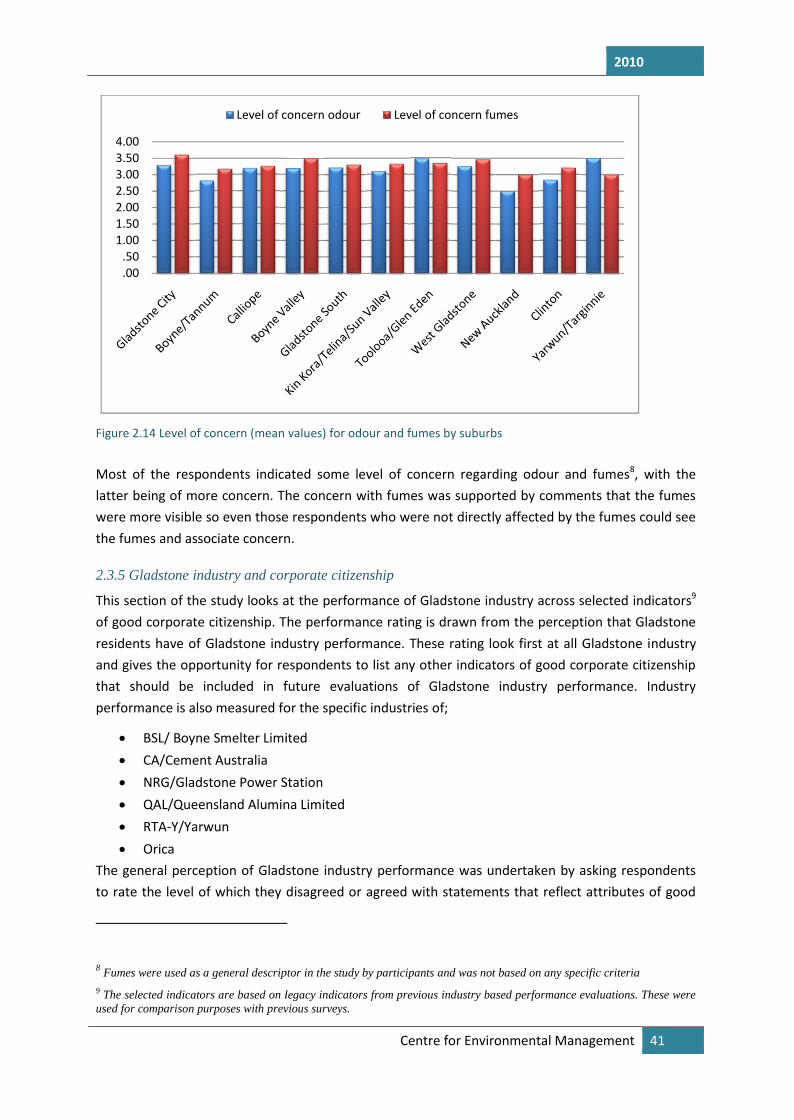
2010
Centre for Environmental Management 41
Figure 2.14 Level of concern (mean values) for odour and fumes by suburbs
Most of the respondents indicated some level of concern regarding odour and fumes8, with thelatter being of more concern. The concern with fumes was supported by comments that the fumeswere more visible so even those respondents who were not directly affected by the fumes could seethe fumes and associate concern.
2.3.5 Gladstone industry and corporate citizenship
This section of the study looks at the performance of Gladstone industry across selected indicators9
of good corporate citizenship. The performance rating is drawn from the perception that Gladstoneresidents have of Gladstone industry performance. These rating look first at all Gladstone industryand gives the opportunity for respondents to list any other indicators of good corporate citizenshipthat should be included in future evaluations of Gladstone industry performance. Industryperformance is also measured for the specific industries of;
BSL/ Boyne Smelter Limited CA/Cement Australia NRG/Gladstone Power Station QAL/Queensland Alumina Limited RTA-Y/Yarwun Orica
The general perception of Gladstone industry performance was undertaken by asking respondentsto rate the level of which they disagreed or agreed with statements that reflect attributes of good
8 Fumes were used as a general descriptor in the study by participants and was not based on any specific criteria
9 The selected indicators are based on legacy indicators from previous industry based performance evaluations. These wereused for comparison purposes with previous surveys.
.00
.501.001.502.002.503.003.504.00
Level of concern odour
2010
Centre for Environmental Management 41
Figure 2.14 Level of concern (mean values) for odour and fumes by suburbs
Most of the respondents indicated some level of concern regarding odour and fumes8, with thelatter being of more concern. The concern with fumes was supported by comments that the fumeswere more visible so even those respondents who were not directly affected by the fumes could seethe fumes and associate concern.
2.3.5 Gladstone industry and corporate citizenship
This section of the study looks at the performance of Gladstone industry across selected indicators9
of good corporate citizenship. The performance rating is drawn from the perception that Gladstoneresidents have of Gladstone industry performance. These rating look first at all Gladstone industryand gives the opportunity for respondents to list any other indicators of good corporate citizenshipthat should be included in future evaluations of Gladstone industry performance. Industryperformance is also measured for the specific industries of;
BSL/ Boyne Smelter Limited CA/Cement Australia NRG/Gladstone Power Station QAL/Queensland Alumina Limited RTA-Y/Yarwun Orica
The general perception of Gladstone industry performance was undertaken by asking respondentsto rate the level of which they disagreed or agreed with statements that reflect attributes of good
8 Fumes were used as a general descriptor in the study by participants and was not based on any specific criteria
9 The selected indicators are based on legacy indicators from previous industry based performance evaluations. These wereused for comparison purposes with previous surveys.
Level of concern odour Level of concern fumes
2010
Centre for Environmental Management 41
Figure 2.14 Level of concern (mean values) for odour and fumes by suburbs
Most of the respondents indicated some level of concern regarding odour and fumes8, with thelatter being of more concern. The concern with fumes was supported by comments that the fumeswere more visible so even those respondents who were not directly affected by the fumes could seethe fumes and associate concern.
2.3.5 Gladstone industry and corporate citizenship
This section of the study looks at the performance of Gladstone industry across selected indicators9
of good corporate citizenship. The performance rating is drawn from the perception that Gladstoneresidents have of Gladstone industry performance. These rating look first at all Gladstone industryand gives the opportunity for respondents to list any other indicators of good corporate citizenshipthat should be included in future evaluations of Gladstone industry performance. Industryperformance is also measured for the specific industries of;
BSL/ Boyne Smelter Limited CA/Cement Australia NRG/Gladstone Power Station QAL/Queensland Alumina Limited RTA-Y/Yarwun Orica
The general perception of Gladstone industry performance was undertaken by asking respondentsto rate the level of which they disagreed or agreed with statements that reflect attributes of good
8 Fumes were used as a general descriptor in the study by participants and was not based on any specific criteria
9 The selected indicators are based on legacy indicators from previous industry based performance evaluations. These wereused for comparison purposes with previous surveys.
2010 GLADSTONE INDUSTRY COMMUNITY PERCEPTION STUDY
42 Centre for Environmental Management
corporate citizenship. A five point rating scale is used with one (1) indicating the respondentdisagreed with the statement about Gladstone industry performance and five (5) which indicatedagreement with the statement. Table 2.14 shows the mean score for each of the attributes rankedfrom the highest (agree) to lowest (disagree). The highest rating is given to Gladstone industryhaving a long term commitment to the Gladstone industry (Mean 4.02), followed by the industrybeing known locally as a good employer (Mean 3.99). The lowest two ratings are that Gladstoneindustry communicates clearly and openly with the community (Mean 3.18) and is trustworthy andbelieved by the local community (Mean 3.07). While these attributes score the lowest rating,average ratings for these categories are relatively high, scoring over 3 out of 5. This indicates thatmore people agree that Gladstone industry is performing well than disagree.
Table 2.14 (q14) General perception of the performance of Gladstone industry10.
Corporate citizenship indicators MeanHas a long term commitment to the Gladstone community 4.02
Is known locally as a good employer 3.99
Supports the local community 3.86
Generally, has a good reputation within the region 3.67
Acts in line with the expectations that I have of Gladstone industry 3.50
Is concerned and sensitive to the needs of the local Indigenous communities 3.47
Demonstrates care for the local environment 3.30
Communicates clearly and openly with the Gladstone community 3.18
Is trustworthy and believed by the local community 3.07
Survey respondents were also given the opportunity to list any other requirements of being a goodcorporate citizen that should be considered when making an evaluation of Gladstone industry. Afterthe responses were separated into ‘like categories’, there were 259 individual responses with thehighest number (n=54) related to the quantity and quality of community support given by Gladstoneindustry (Table 2.15). While most of the comments simply referred to providing local communitysupport others elaborated on the need to account for the quality of support beyond simple dollarterms. For example one respondent commented,
‘they seem to get behind the local sort of events around the place/they have their little petorganisations - they will give some funding to one organisation and not to others/like to see them getbehind sporting organisations and junior sport - a lot of those services are very second rate’.
Other comments related to the need to maintain high environmental protection standards. Thisextended to ensuring a high level of transparency in their actions and that this was communicatedclearly and included a commentary on the state of local infrastructure and future planning. One ofthe comments gives a good insight into how residents are aware of the global implications that canimpact on local industry and suggests a more collaborative approach is needed by industry.
10 A statistical test for linearity indicates that there is a relationship between these factors at the 0.05 level however therelationship is not statistically significant at the 0.05 level.
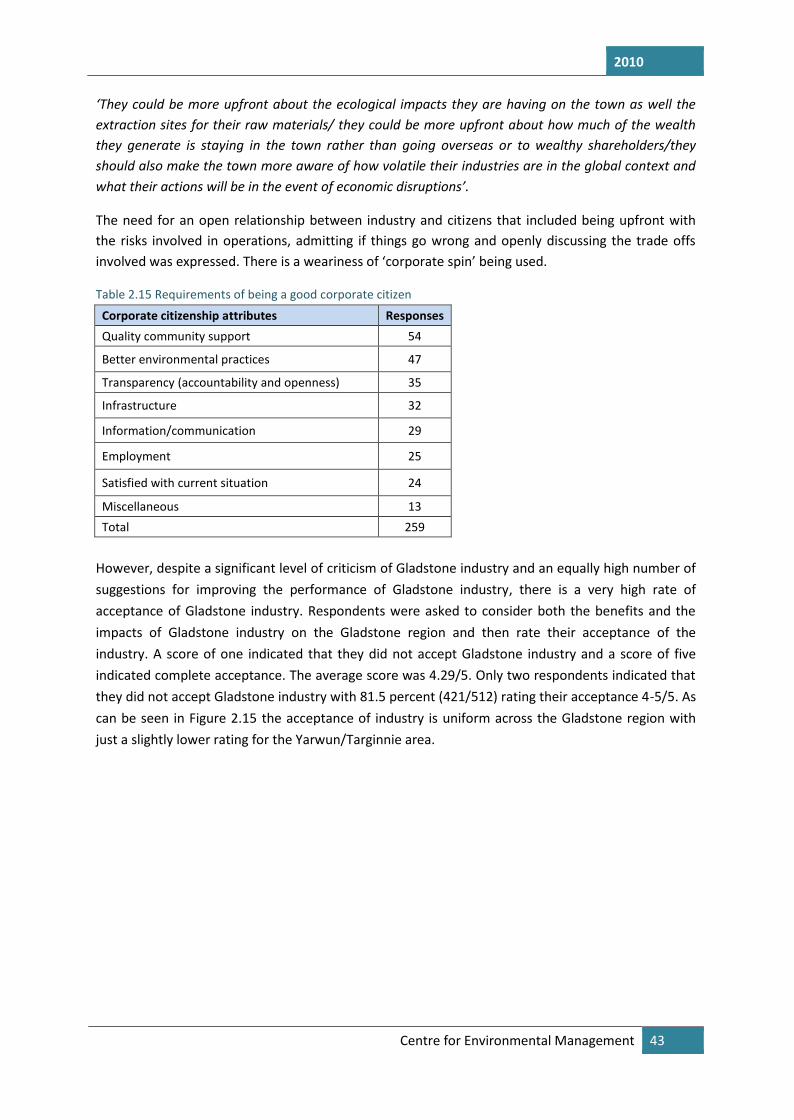
2010
Centre for Environmental Management 43
‘They could be more upfront about the ecological impacts they are having on the town as well theextraction sites for their raw materials/ they could be more upfront about how much of the wealththey generate is staying in the town rather than going overseas or to wealthy shareholders/theyshould also make the town more aware of how volatile their industries are in the global context andwhat their actions will be in the event of economic disruptions’.
The need for an open relationship between industry and citizens that included being upfront withthe risks involved in operations, admitting if things go wrong and openly discussing the trade offsinvolved was expressed. There is a weariness of ‘corporate spin’ being used.
Table 2.15 Requirements of being a good corporate citizen
Corporate citizenship attributes ResponsesQuality community support 54
Better environmental practices 47
Transparency (accountability and openness) 35
Infrastructure 32
Information/communication 29
Employment 25
Satisfied with current situation 24
Miscellaneous 13Total 259
However, despite a significant level of criticism of Gladstone industry and an equally high number ofsuggestions for improving the performance of Gladstone industry, there is a very high rate ofacceptance of Gladstone industry. Respondents were asked to consider both the benefits and theimpacts of Gladstone industry on the Gladstone region and then rate their acceptance of theindustry. A score of one indicated that they did not accept Gladstone industry and a score of fiveindicated complete acceptance. The average score was 4.29/5. Only two respondents indicated thatthey did not accept Gladstone industry with 81.5 percent (421/512) rating their acceptance 4-5/5. Ascan be seen in Figure 2.15 the acceptance of industry is uniform across the Gladstone region withjust a slightly lower rating for the Yarwun/Targinnie area.
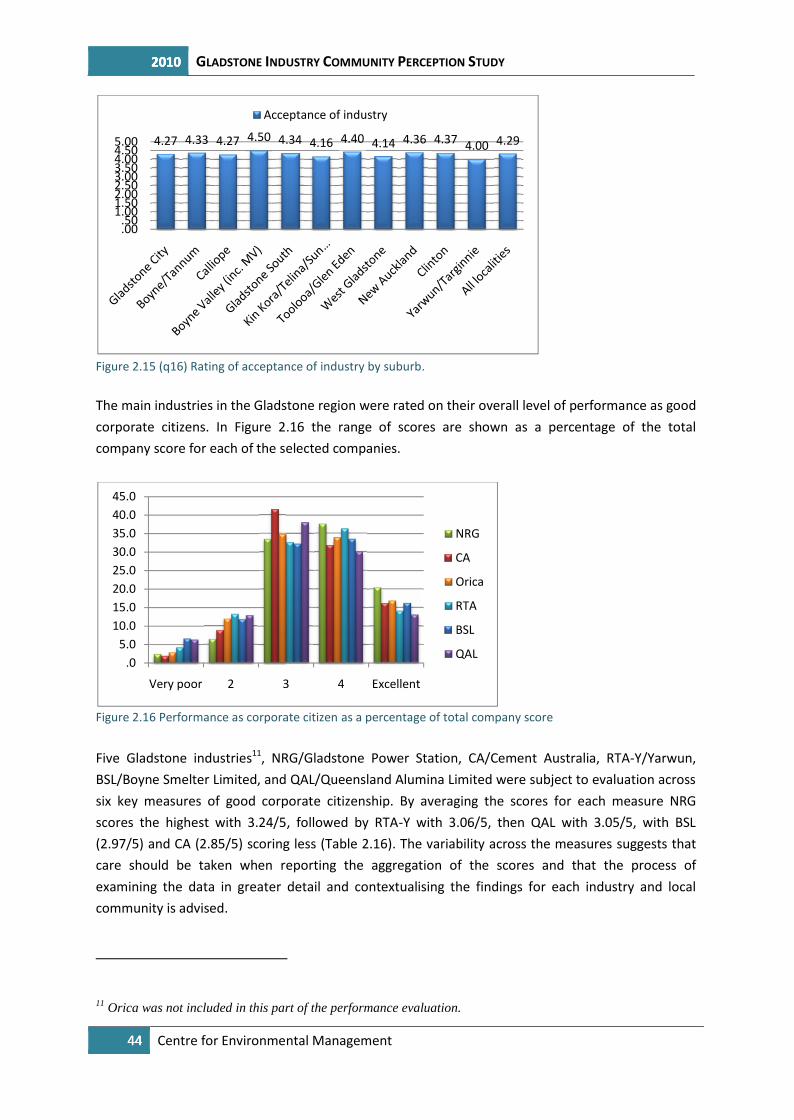
2010 GLADSTONE INDUSTRY COMMUNITY PERCEPTION STUDY
44 Centre for Environmental Management
Figure 2.15 (q16) Rating of acceptance of industry by suburb.
The main industries in the Gladstone region were rated on their overall level of performance as goodcorporate citizens. In Figure 2.16 the range of scores are shown as a percentage of the totalcompany score for each of the selected companies.
Figure 2.16 Performance as corporate citizen as a percentage of total company score
Five Gladstone industries11, NRG/Gladstone Power Station, CA/Cement Australia, RTA-Y/Yarwun,BSL/Boyne Smelter Limited, and QAL/Queensland Alumina Limited were subject to evaluation acrosssix key measures of good corporate citizenship. By averaging the scores for each measure NRGscores the highest with 3.24/5, followed by RTA-Y with 3.06/5, then QAL with 3.05/5, with BSL(2.97/5) and CA (2.85/5) scoring less (Table 2.16). The variability across the measures suggests thatcare should be taken when reporting the aggregation of the scores and that the process ofexamining the data in greater detail and contextualising the findings for each industry and localcommunity is advised.
11 Orica was not included in this part of the performance evaluation.
4.27 4.33 4.27 4.50 4.34
.00
.501.001.502.002.503.003.504.004.505.00
Acceptance of industry
.05.0
10.015.020.025.030.035.040.045.0
Very poor 2 3
2010 GLADSTONE INDUSTRY COMMUNITY PERCEPTION STUDY
44 Centre for Environmental Management
Figure 2.15 (q16) Rating of acceptance of industry by suburb.
The main industries in the Gladstone region were rated on their overall level of performance as goodcorporate citizens. In Figure 2.16 the range of scores are shown as a percentage of the totalcompany score for each of the selected companies.
Figure 2.16 Performance as corporate citizen as a percentage of total company score
Five Gladstone industries11, NRG/Gladstone Power Station, CA/Cement Australia, RTA-Y/Yarwun,BSL/Boyne Smelter Limited, and QAL/Queensland Alumina Limited were subject to evaluation acrosssix key measures of good corporate citizenship. By averaging the scores for each measure NRGscores the highest with 3.24/5, followed by RTA-Y with 3.06/5, then QAL with 3.05/5, with BSL(2.97/5) and CA (2.85/5) scoring less (Table 2.16). The variability across the measures suggests thatcare should be taken when reporting the aggregation of the scores and that the process ofexamining the data in greater detail and contextualising the findings for each industry and localcommunity is advised.
11 Orica was not included in this part of the performance evaluation.
4.34 4.16 4.40 4.14 4.36 4.37 4.00 4.29
Acceptance of industry
3 4 Excellent
NRG
CA
Orica
RTA
BSL
QAL
2010 GLADSTONE INDUSTRY COMMUNITY PERCEPTION STUDY
44 Centre for Environmental Management
Figure 2.15 (q16) Rating of acceptance of industry by suburb.
The main industries in the Gladstone region were rated on their overall level of performance as goodcorporate citizens. In Figure 2.16 the range of scores are shown as a percentage of the totalcompany score for each of the selected companies.
Figure 2.16 Performance as corporate citizen as a percentage of total company score
Five Gladstone industries11, NRG/Gladstone Power Station, CA/Cement Australia, RTA-Y/Yarwun,BSL/Boyne Smelter Limited, and QAL/Queensland Alumina Limited were subject to evaluation acrosssix key measures of good corporate citizenship. By averaging the scores for each measure NRGscores the highest with 3.24/5, followed by RTA-Y with 3.06/5, then QAL with 3.05/5, with BSL(2.97/5) and CA (2.85/5) scoring less (Table 2.16). The variability across the measures suggests thatcare should be taken when reporting the aggregation of the scores and that the process ofexamining the data in greater detail and contextualising the findings for each industry and localcommunity is advised.
11 Orica was not included in this part of the performance evaluation.
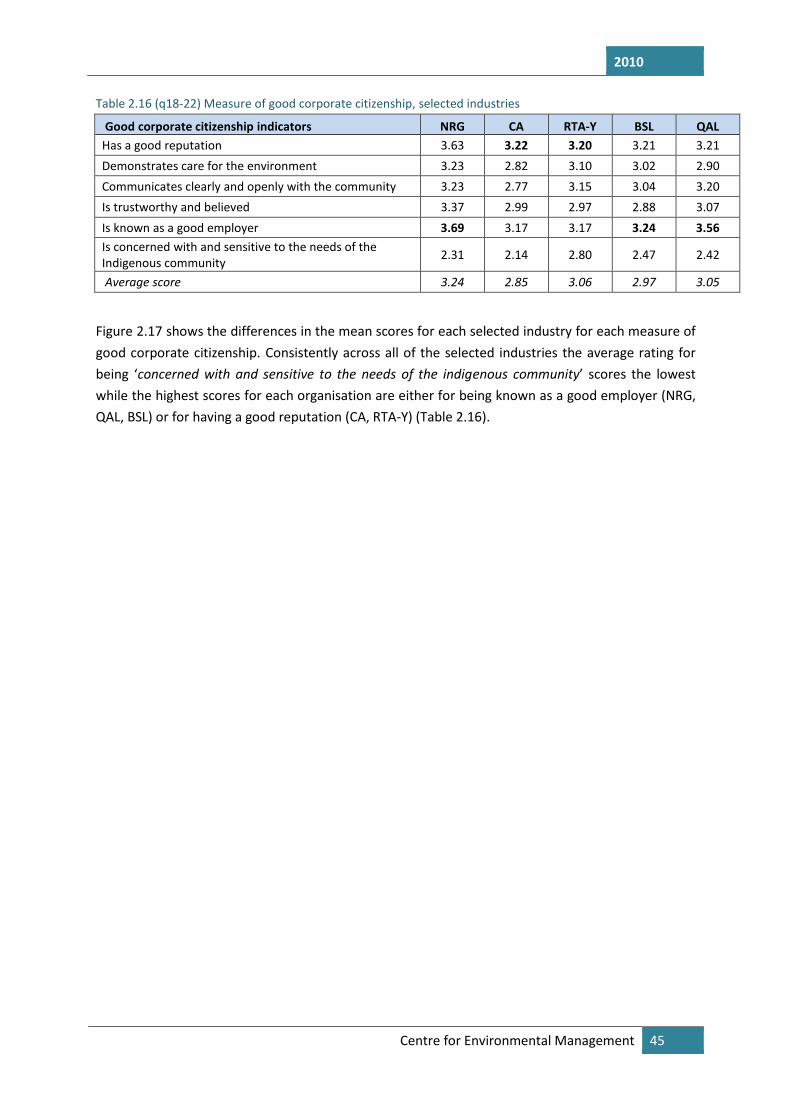
2010
Centre for Environmental Management 45
Table 2.16 (q18-22) Measure of good corporate citizenship, selected industries
Good corporate citizenship indicators NRG CA RTA-Y BSL QALHas a good reputation 3.63 3.22 3.20 3.21 3.21Demonstrates care for the environment 3.23 2.82 3.10 3.02 2.90Communicates clearly and openly with the community 3.23 2.77 3.15 3.04 3.20Is trustworthy and believed 3.37 2.99 2.97 2.88 3.07Is known as a good employer 3.69 3.17 3.17 3.24 3.56Is concerned with and sensitive to the needs of theIndigenous community 2.31 2.14 2.80 2.47 2.42
Average score 3.24 2.85 3.06 2.97 3.05
Figure 2.17 shows the differences in the mean scores for each selected industry for each measure ofgood corporate citizenship. Consistently across all of the selected industries the average rating forbeing ‘concerned with and sensitive to the needs of the indigenous community’ scores the lowestwhile the highest scores for each organisation are either for being known as a good employer (NRG,QAL, BSL) or for having a good reputation (CA, RTA-Y) (Table 2.16).
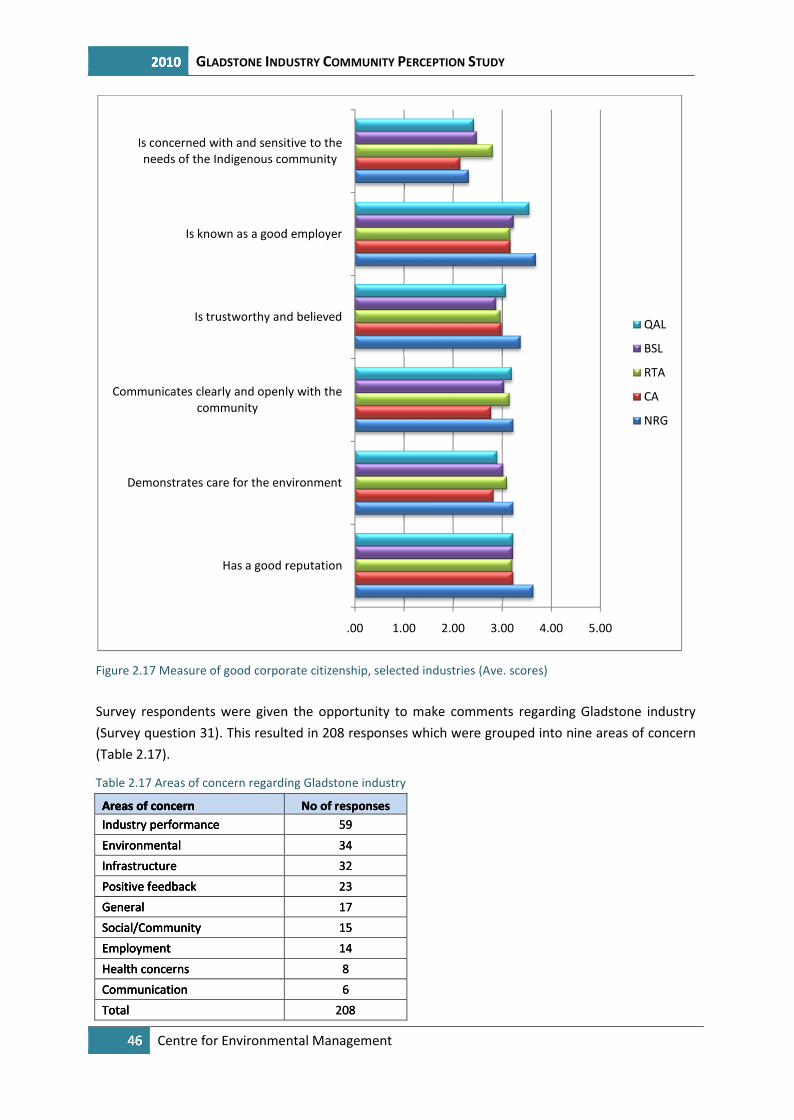
2010 GLADSTONE INDUSTRY COMMUNITY PERCEPTION STUDY
46 Centre for Environmental Management
Figure 2.17 Measure of good corporate citizenship, selected industries (Ave. scores)
Survey respondents were given the opportunity to make comments regarding Gladstone industry(Survey question 31). This resulted in 208 responses which were grouped into nine areas of concern(Table 2.17).
Table 2.17 Areas of concern regarding Gladstone industry
Areas of concern No of responsesIndustry performance 59Environmental 34Infrastructure 32Positive feedback 23General 17Social/Community 15Employment 14Health concerns 8Communication 6Total 208
Has a good reputation
Demonstrates care for the environment
Communicates clearly and openly with thecommunity
Is trustworthy and believed
Is known as a good employer
Is concerned with and sensitive to theneeds of the Indigenous community
2010 GLADSTONE INDUSTRY COMMUNITY PERCEPTION STUDY
46 Centre for Environmental Management
Figure 2.17 Measure of good corporate citizenship, selected industries (Ave. scores)
Survey respondents were given the opportunity to make comments regarding Gladstone industry(Survey question 31). This resulted in 208 responses which were grouped into nine areas of concern(Table 2.17).
Table 2.17 Areas of concern regarding Gladstone industry
Areas of concern No of responsesIndustry performance 59Environmental 34Infrastructure 32Positive feedback 23General 17Social/Community 15Employment 14Health concerns 8Communication 6Total 208
.00 1.00 2.00 3.00 4.00
Has a good reputation
Demonstrates care for the environment
Communicates clearly and openly with thecommunity
Is trustworthy and believed
Is known as a good employer
Is concerned with and sensitive to theneeds of the Indigenous community
2010 GLADSTONE INDUSTRY COMMUNITY PERCEPTION STUDY
46 Centre for Environmental Management
Figure 2.17 Measure of good corporate citizenship, selected industries (Ave. scores)
Survey respondents were given the opportunity to make comments regarding Gladstone industry(Survey question 31). This resulted in 208 responses which were grouped into nine areas of concern(Table 2.17).
Table 2.17 Areas of concern regarding Gladstone industry
Areas of concern No of responsesIndustry performance 59Environmental 34Infrastructure 32Positive feedback 23General 17Social/Community 15Employment 14Health concerns 8Communication 6Total 208
5.00
QAL
BSL
RTA
CA
NRG
2010
Centre for Environmental Management 47
While there is a diversity of views on the current state of Gladstone industry there is a strongacceptance of the important role that industry undertakes in underpinning the Gladstone region’seconomy and the clear links with employment opportunities for current residents and for futuregrowth of the region. In straight forward language,
‘Gladstone lives on industry /there is major industry that employs lots of people /its good for thecommunity/its how people make there living and are able to buy there houses’….and
‘Gladstone wouldn't be on the map if they didn't have industry/ I don’t know why people complain,the small business rely on people in town, and they need employment, which is big industry’.
However this acceptance by the majority of those who commented is qualified by a number ofimportant factors. For example there is acceptance of current industry but also concern about thenew LNG sector;
‘the point that I would like to make is that Gladstone industry up until now have been corporatesensitive. I don’t believe the next generation of companies coming to Gladstone will keep this up’.
There were two issues that produced more negative feedback. This was in relation to the impact onthe environment of Gladstone industry and the other the timely provision of infrastructure such ashealth facilities, employment training and education.
In regards to the environmental impacts of industry there were some concerns expressed of existingindustry practice such as,
‘I don’t believe the air quality reports/they're benchmarks are not a true reflection of the airquality/you only need to go to certain areas to see the houses affected by the coal dust’.
The development of the LNG industry also drew comment,
‘Bringing in the new LNG is a bit of a worry/ dredging the harbour and destroying seagrasses, theirboats blocking the harbour/ environmental impacts on Port Curtis - there was no communityconsultation/ worried about explosions as it'll be close to town/ impacts on dugongs’, and
‘We're on verge of having a gas industry here and there needs to be more stringent rules onenvironmental issues and pick up their act before they come here’.
Two main points can be gleaned from the comments. First while there is anxiety over the ongoingindustrial developments in the Gladstone region positive actions can be adopted to assist industryand give support to the community. As this comment suggests, cumulative impact planning is animportant step in illustrating a professional best practice approach to future development andongoing monitoring of industry performance.
‘I suppose the region wouldn't be as developed as what it is if it wasn't for the industry/ but theimpacts that they've had on the industry are detrimental/ but they've got to look as a collective onwhat the environmental impacts are/ right now they're only looking at legislation to see what theyare allowed to emit/ they need to get together and reduce what they put out/ when you incorporateall of them together, 20% from each company adds up to a lot/ especially in a minority area wheremany small companies together contribute to more then what one company would produce in aconcentrated area’
2010 GLADSTONE INDUSTRY COMMUNITY PERCEPTION STUDY
48 Centre for Environmental Management
The second area relates to the perception that industry is only concerned with bottom linecompliance with government set environmental standards that rely upon community pressure toensure that they are adequately set and acceptable with community standards. The view was putforward that industry should move beyond simple compliance to become leaders in this area. Forexample,
‘Getting to the level of government standards, get above government standards, what pollutantsthey are putting into the air by the industries which may bring down the cases of cancer in our town’.
The request for more infrastructure is similar to producing a ‘wish list’ for regional communities whooften see extensive infrastructure developments in major urban centres (or have relocated fromthose centres) and feel aggrieved at the relatively slow progress in regional locations. Respondentsto the survey expressed the view that industry,
‘should put more back into the community to make it easier for ratepayers/industry should matchinfrastructure with the size of their plant/a plant of $30 billion - they will put stress on roads, housingrequirements etc - they should fund more and put in a fair share - the tax payer should not have tofund this when industry profits often go overseas’.
Soft and hard infrastructure for the health sector is seen as a high priority as with infrastructure tosupport a greater diversification of economic activity within the region. In addition the timeliness ofinfrastructure is mentioned, in particular, the timely supply of housing to help moderate housingcosts.
Although not reflected in Table 2.17 the issue of communication was predominant in most of thecommentary categories and focused on the need for good quality communication between industry,the community and governments. The comments ranged from straight forward suggestions such as,
‘it would be beneficial if we had more information about what each industry does and how theysupport the community / i.e. a pamphlet indicating how each industry is supporting the community’,
to the perceived need for evidence that community communication is effective and producesoutcomes that improve the situation between industry and the community.
For example;
‘Industry doesn't do a good job of working and engaging with local community. Any engagementneeds to be genuinely listened to. Community concerns are ignored the risk is their level ofacceptance of industry will start to wane. So consulting people has no value, no genuine nature. Thatis actually a real risk. New and current industries need to be genuine and listen to communityconcerns. Benefits could easily be turned around in the absence’.
This final comment presents a good summary of the feedback from the community and suggests away forward for industry,
‘we already have a committee of industry leaders to improve the community present/ future we aretalking about 5000 workers - communicating between now and the future is very hard/presentcommitment - our industry leaders is admirable, respectful/for future development I would hope that
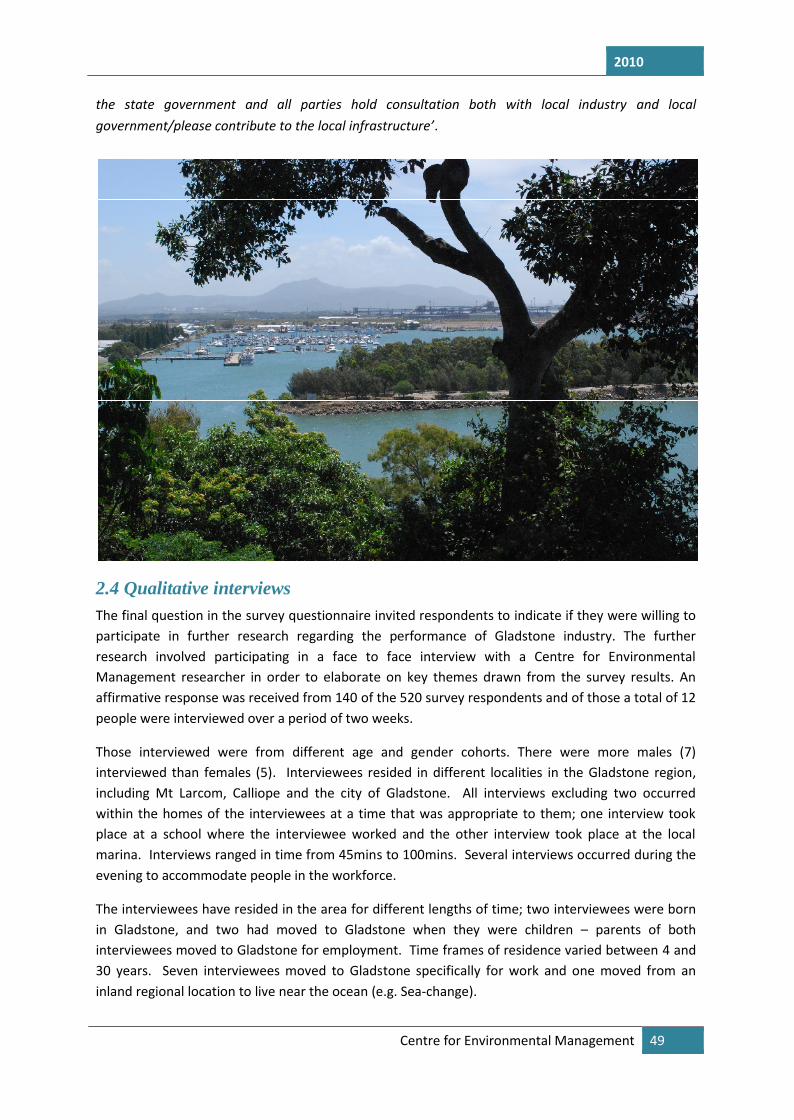
2010
Centre for Environmental Management 49
the state government and all parties hold consultation both with local industry and localgovernment/please contribute to the local infrastructure’.
2.4 Qualitative interviewsThe final question in the survey questionnaire invited respondents to indicate if they were willing toparticipate in further research regarding the performance of Gladstone industry. The furtherresearch involved participating in a face to face interview with a Centre for EnvironmentalManagement researcher in order to elaborate on key themes drawn from the survey results. Anaffirmative response was received from 140 of the 520 survey respondents and of those a total of 12people were interviewed over a period of two weeks.
Those interviewed were from different age and gender cohorts. There were more males (7)interviewed than females (5). Interviewees resided in different localities in the Gladstone region,including Mt Larcom, Calliope and the city of Gladstone. All interviews excluding two occurredwithin the homes of the interviewees at a time that was appropriate to them; one interview tookplace at a school where the interviewee worked and the other interview took place at the localmarina. Interviews ranged in time from 45mins to 100mins. Several interviews occurred during theevening to accommodate people in the workforce.
The interviewees have resided in the area for different lengths of time; two interviewees were bornin Gladstone, and two had moved to Gladstone when they were children – parents of bothinterviewees moved to Gladstone for employment. Time frames of residence varied between 4 and30 years. Seven interviewees moved to Gladstone specifically for work and one moved from aninland regional location to live near the ocean (e.g. Sea-change).
2010 GLADSTONE INDUSTRY COMMUNITY PERCEPTION STUDY
50 Centre for Environmental Management
When asked how long they intended to stay living in Gladstone, seven interviewees had no intentionof leaving the city; one was dependent upon the employment for her grandson; one would like tomove to another Queensland coastal location but would stay in Gladstone for employment; onewanted to move as soon as possible due to ill health and not finding the community a friendly place;one would stay until the ‘kids were finished school’ in 12 – 15 years, and one was undecided.
Comments ranged from, “Another fifty years – I just love it” to
“We are getting out as soon as we can because our health has been crap since we have been here;it’s not a very friendly town. We just don’t like it. It is exceedingly clicky, we lived elsewhere and itwas hugely transient but not clicky. It is strange here”.
As indicated from this comment the participants had varying opinions of Gladstone and thishopefully assisted the authors to question their assumptions regarding the analysis of the surveydata and develop a more nuanced view of Gladstone industry performance.
2.4.1 Key themes
One of key aims of the qualitative interviews was to obtain a better understanding of the ratingsused in the survey questionnaire. The interviews sought clarification of the scores given andattempts were made to connect particular scores with either possible actions or impacts on therespondents in order to give more meaning to the rating system. This was approached by askingeach of the interviewees to discuss the nine attributes of good corporate citizenship that werepresented in the telephone survey (see q14a-i in Appendix 2).
Beyond seeking to benchmark the survey rating system an important question is whether thequalitative exercise has simply resulted in illustrating a set of entrenched values that exist in thecommunity and whether or not there is an opportunity for these values to be transformed throughthe actions of industry.
1. Demonstrates care for the local environment
Interviewee’s answers were varied in relation to how they thought industry demonstrated care forthe environment. Half of the interviewees felt that industry either didn’t care or felt that there wereno clear examples of industry caring to cite. One comment in particular focused on the new LNGindustry that is developing in the Gladstone area and reflects an undercurrent of unease about thepotential rapid developments that could occur with the new industry. This is not dissimilar toconcerns in the Gladstone community with the development of the existing industry although theemphasis here is to a larger extent on environmental impacts. As one respondent commented;
“I am aghast at where LNG has picked to build their plant. It is somewhere that is a breeding groundfor the dugongs (sea cows), it is scary watching it being jeopardised – it is where my boys havecamped, my son had his 18th birthday there, it is a safe and nice place for kids to go. I have not seena lot of evidence that they do care for the environment”.
Equally interviewees thought that industry did display an understanding of the need for standards ofpractice and where aware that their performance was being monitored. One comment illustratedthe community’s sophisticated understanding of the trade-off’s involved in modern industrialpractice by alluding to the acknowledgement that while industry is constrained by technological
2010
Centre for Environmental Management 51
processes there is the perception that industry is working towards better solutions and practices.This is clear in the quote by a respondent;
“Even though they have environmental limits they will strive for world best practice”.
This is an important distinction and highlights a perceived need for clear honest communicationbetween industry and the community that is not based solely on positive feel good stories ofachievement, but are mature exchanges able to discuss ongoing problems that can be sharedequally with the community. For example, community engagement that is also ‘empowering’ for theGladstone community and gives the community a role in the industries future planning.
2. Communicates clearly and openly with the Gladstone community
The second attribute of good corporate citizenship is a measure of industries communityengagement. Overall more interviewees stated that they did not think industry communicatedclearly and openly, with some respondents expressing this as a form of deceptive behaviour with theperception that industry was misleading by either ‘distorting the facts’ or by withholdinginformation.
“They don’t communicate clearly; they don’t talk about issues that they don’t want us to know about.They distort the facts to suit their own agendas and therefore they are lying and lying cannot be clearcommunication”.
However when respondents gave some acknowledgement of good communication practices therewas a tendency for there to remain the criticism that the focus of the information waspredominately ‘good’ news. This approach was identified by one respondent who said;
“I do think they are as upfront as they can be, they couldn’t give the public all the informationbecause I think a lot of people in the public couldn’t cope because some people don’t have thatunderstanding of business processes”.
On the question of the delivery of clear information to the community there was comment that onsome issues there was an overload of information and this had the effect of overwhelming thepublic and causing them to turn off. An example was given of volumes of material in the local libraryand the difficulty of knowing where to start to find the information required. Positive comment wasgiven for the information available on various company websites.
3. Supports the local community
All twelve interviewees believed that industry does offer good support to the local community. Thetypes of support, how to access the support, and the changing nature or decline of industry supportwas mentioned. One of the respondents reflected that;
‘They support sports teams, art projects - you just write to them and money comes out of their ears.My boys play a lot of sport, boxing, footie, when I do the washing the polo shirts would circle thewashing line and every shirt has a different company name on the back’.
2010 GLADSTONE INDUSTRY COMMUNITY PERCEPTION STUDY
52 Centre for Environmental Management
While all interviewees agreed that industry offered good support for the local community, a threadof cynicism and qualification is evident in several of the responses. This often related to the longerterm impacts of industry operations on the local environment. For example,
“The things they are going to give us are temporary and the environment should be something whichmany, many generations to come can enjoy”.
There were also reflections on past practice and a feeling that in the past industry offered more tothe community in the form of hard infrastructure than is the current practice. The substance ofthese claims have not been verified however is does reflect a community sentiment that reflects notonly existing industry practice but also (we suggest) draws on concerns associated with the futuredevelopment of the Gladstone community in light of new industry developments (LNG). As onerespondent reflected,
“ I think there was a lot more of that in the past, there was a lot more infrastructure that wasprovided by the industry - the likes of QEGB (electricity) they actually had houses, so did QAL – theydon’t have houses now”.
4. Is trustworthy and believed by the local community
The question of trustworthiness and being believed by the community brought a variety ofresponses with positive comments generally linked to the employment provided by industry and theevidence of ‘real’ benefits experienced by those employed. There was however evidence of the‘precautionary principle’ in action with respondents noting a level of scepticism with regards to themessages coming from industry. This was more pronounced with regard to environmentalcomments and underpinned by ‘insider’ knowledge of industry through the close relations of thecommunity with workers within the industries. For example as one respondent commented,
‘….I think there would be a fairly high level of cynicism about what they hear or what the companysay is going on I suppose because the community works here and lives here. Most people have abrother or father or sister who works in industry so the whole community knows what is reallyhappening”.
5. Is known locally as a good employer
The majority of interviewees stated that in general, industry is known to be ‘good employers’ andthat this is the main benefit of industry. These benefits are seen as long term and offer a level ofsecurity for families, as one respondent commented;
“To get an apprenticeship with QAL would mean you would be set for life because they are wellrecognised within the industry sector”.
The perception of industry as a good employer whilst good overall differed when particularindustries where mentioned. Without singling out any of the industries there is the perception isthat industry are good employers when it suits their needs but are limited with their support ofworkers outside of the workplace and there is the recollection of when industry downturns haveoccurred. The treatment of workers who had been laid off during production down turns wasmentioned and those negative sentiments can linger within the community for considerable time.There were also comments regarding a perception of an increase in the number of contractors
2010
Centre for Environmental Management 53
working for industry and the changing nature of the ‘employment contract’ with workersexperiencing more mobility with their employment. Opportunities for career advancement withemployment in large (national and international) organisations were seen as beneficial.
Two comments presented here focus more on the concerns of workers than the generalacknowledgement that overall the industries are seen as good employers.
“Oh yeah, they are good employers; the social aspect of their employment leaves a lot to be desired.They employ people but there is no other input here, like supporting housing and that sort of stuff”
“I have friends who worked with QAL and they thought QAL was the best employer until they bothlost their jobs and were treated very unjustly”.
6. Has a long term commitment to the Gladstone community
Most of the respondents believed that Gladstone industry had illustrated its commitment to thecommunity by the length of time that they had remained operating successfully in the area. Typicalof the responses was;
“If you look at QAL – they arrived in 1967 and have been employing maybe 1500 people since then,so that’s 45 years or so. Long term commitment they have been providing jobs for all those years”.
One interviewee however felt that the older more established companies had a long termcommitment to the community but newer companies like LNG may not have that commitment.
“The older ones obviously, the new ones – there is a lot of concern about LNG”
Of note to the researchers was the element of realism and typical understatement of therespondents which pointed out the expected limits of industry commitment to the community whichpremised on continued profits is contingent on the utility of the workforce to the industry. This wasexpressed eloquently by one respondent who said,
“While they are making money they have a vested interest in the community here so they haveobligations that they have to meet but if for any reason a plant had to shut down then that would beit, if they stopped making money that would be it. I don’t think there would be any obligation to helpthe community out in any way”.
7. Is concerned and sensitive to the needs of the local Indigenous communities
There were only two interviewees who believed that industry in generally does display concern andsensitivity to the needs of the local Indigenous communities through direct action. That said therewas reference to industry policies and induction processes that included reference to indigenousvalues and sensitivities. There was an element of industry being tokenistic in its attempt to engagewith the indigenous community and this was partly justified by barriers emanating from theindigenous community more than from industry.
Some praise was given for the efforts of industrial project proponents in relation to local indigenousengagement although this was viewed as part of a set of compliance issues. As one respondent putit,
2010 GLADSTONE INDUSTRY COMMUNITY PERCEPTION STUDY
54 Centre for Environmental Management
“They are more sensitive to that now but I think it’s because of obligation more than anything thatthey do it”.
8. Generally, has a good reputation within the region
When asked if industry had a good reputation in the region the majority of interviewees answeredto the affirmative and commented that since industrial development in Gladstone people havecontinually migrated to the area. Despite some set backs the population has continued to grow andmost people have an awareness of what to expect from Gladstone. Again respondents wereunderstated in praising industry and preferred to attribute a good reputation within the region tothe size of the industries and their careful image management. Typical comments were,
“Yes because of the hype of providing employment”
“Yes, the perception is that you have to have it”
“I think so, they are big employers and they don’t want to be seen to do the wrong thing”.
9. Acts in line with the expectations that I have of Gladstone industry
In exploring this measure of good corporate performance the responses were much polarised andreflected the respondent’s relationship to industry and whether they derived any direct benefit fromindustry. That industry provided employment and through this the opportunities for some workersto undertake training and to advance careers was a dominant area in which expectations were beingmet. However beyond direct employment there were viewpoints that broad expectation of industry(where they exist) were not being completely met. Whether this is due to the expectations beingoverly ambitious is hard to ascertain although the areas of concern were centred on infrastructure,social justice issues and public transportation options. These areas tended to drift intoresponsibilities that were arguably the responsibility of government agencies and not directcompany concerns. Having said that the expectations of the Gladstone community is in a state offlux and persistent media reporting of the new industrial developments associated with the LNGsector may have heightened expectations beyond a reasonable level.
During the interviews opinions were sought of three key themes associated with Gladstone industry;corporate citizenship, the general liveability of Gladstone, and the status of the Gladstone area interms of environmental health and the health of individuals.
Theme 1: Corporate citizenship
A discussion was initiated around the concept of corporate citizenship with the objective ofevaluating the attributes used in the phone survey to measure corporate citizenship performance. Inaddition participants were asked if other attributes of corporate citizenship should be included inany future measurement of industry performance. This line of questioning generated someinteresting responses from the interviewees. The comments are summarised here; fourinterviewees stated that the level, quality and nature of industry contribution to local infrastructureshould form a basis of the measurement of corporate citizenship. Two interviewees discussedapplying a greater emphasis on social responsibility and the support of social services. Two
2010
Centre for Environmental Management 55
interviewees believe that there should be a focus on ethical business practices. Four intervieweeswere unsure of any other benchmark for corporate citizenship.
One comment that illustrated possible future measures of corporate citizenship spoke of existingactivities such as industry tours and open days but suggested that measures of a more serious andtangible nature be included such as; ‘supplying accommodation options or assisting in thedevelopment of community co-ops to support workers’. Also any measures to alleviate against risinghousing costs.
When asked about their expectations of industry the interviewee’s answers shared commonthemes. Care for the environment, particularly air quality, a commitment to support and care forthe community, safety for all residents and employees, recycling and managing waste products in asustainable manner and contributing to the infrastructure were constant themes filtered throughmost answers.
“I would like to see the pollution out of the air, I would like to see all of the waste products carefullyretained and recycled and not leached into waterways”.
“My expectation is that they (industry) act in a safe manner so that the things they are producingdon’t affect me”.
“That they provide a safe work place for employees, meet their environmental obligations, they act ina fair and ethical manner (they actually look after their employees and don’t take advantage ofthem)”.
“My greatest expectation would be that industry gives back to the community and creates well beingfor its employees, giving it as much life as it can”.
After discussing expectations of industry, interviewees were asked if they felt that industry metthose expectations. In general interviewees stated that they felt industry did meet thoseexpectations especially in relation to the opportunities given for employment and job relatedtraining, for example;
“I think they do, my boys got apprenticeships with them. They meet our expectations and I feel thatif you could put a proposal together and have the right people to push it something could be done –this is a small community – I have never asked them to, but it is a tiny population here”.
On the other hand four interviewees stated they did not believe that industry met their expectationsand this was primarily related to environmental concerns as one respondent stated;
“Not all of industry – there is a lot of doubt around an environmental report – there is delay in thatreport - they are not being transparent with that report. Potentially they could be polluting the BITSarea. It’s poor business, because a small of community reputation is worth a thousand percent paysfor itself. If you have a good relationship with your local community they will be much more forgivingwhen times are hard that if you are sneaky or not transparent and then when things do come outthey are much more harsh”.
2010 GLADSTONE INDUSTRY COMMUNITY PERCEPTION STUDY
56 Centre for Environmental Management
As this comment suggests there were sentiments among the research participants that suggested alost opportunity for industry on some occasions. It was suggested that greater effort to openlycommunicate would result in better outcomes for industry. Again it was the environment thatappeared to be a tipping point for shifting sentiments from the positive economic benefits tonegative impacts of industry practice.
Theme 2: Liveability
During the phone survey interviews, questions were asked about key liveability factors. The face toface interviews sought to expand upon these and examine the issue of liveability in Gladstone inmore detail.
Hard and soft infrastructure were seen as key measures of liveability with medical services,education, transport, housing, sporting facilities and retail services rating relatively highly for severalinterviewees.
As far as liveability all of the services are here, everything you need is here it might not be as much asyou would like but the necessities are here. We even have a lovely little entertainment centre, I lovethe theatre. We do have stuff here that is good it’s not just a little hick town with nothing”.
However there were areas where improvements were needed as mentioned here;
“We have everything within ten minutes except maybe major furniture shops. We have everythinghere; mum and dad loved coming here because it was five minutes to the races, hospital, airport,doctor, and dentist”.
The sense of community and belonging were also seen as key liveability factors for the Gladstonecommunity although there was acknowledgement that social isolation was experienced. Otherissues that interviewees felt were key liveability factors ‘missing’ in the Gladstone area include cleanair; transport, accommodation and a variety of retail outlets.
Three interviewees rated the natural environment and weather as important – the reef, the bush,Gatchombe Heads and the harbour.
Where respondents were located in relation to the services that are available and how they weresituated social and financially was important for their outlook on liveability. For example onerespondent commented,
“Housing and services particularly mental health services; transport – especially out here, without alicence or a car and when you are unemployed you can’t run a car”.
This contrasted with another respondent who described a community, in which there is;
“… a fair sense of support and community and family in Gladstone. It might not have all the servicesand all the bells and whistles but there is family here. Even for someone like myself who doesn’t havefamily here, it doesn’t take long to get family here”.
2010
Centre for Environmental Management 57
All interviewees expressed the view that more industry would impact on the Gladstone region andthat the current infrastructure would not cope with the influx of people and use associated withmore industry development. Two interviewees voiced concern about specific new industrydevelopment issues including problems associated with the possibility of a fly-in fly-out work force.Two interviewees expressed concern about environmental issues associated with more industry.However the importance of industry and the impact of new industry development on Gladstone’slongevity were also highlighted.
For example in relation to the fly-in fly out work force issue;
“The proposed construction methods, you could almost describe them as anti social with the fly in flyout mentality. Those big influxes of short term residents put a big strain on local services while thosepeople are not here to contribute to the maintenance of those services. Some of the aspects ofenvironmental effects are not fully known”.
Interestingly almost half of the interviewees responded that they will not directly benefit from moreindustry in relation to employment opportunities or increased business activity however housingvalue increases were seen as a benefit to existing home owners. Also the benefits to other family orcommunity members were mentioned. For example,
“It will probably keep me employed, my husband employed, my grandson an apprenticeship and weare just one family so many more families will have those opportunities”.
Theme 3: Health – Environment and people
Interviewees were asked about health concerns that they believed were specifically linked toindustry. More than half of the interviewees responded that they had no health concerns related toindustry yet four of those interviewees expressed concern at not knowing if their health wasimpacted upon and that they were just unaware. Of those four interviewees, one specifically residesin Calliope to situate his young family away from industry to avoid any potential health concerns.This reinforces the perception expressed in the survey (and in previous studies) that concern with apossible link between industry emissions and personal health is prevalent despite any clear evidenceof an association.
Of the three interviewees who stated that they did have health related issues, two were unsure iftheir health issues were related to industry activity. One interviewee stated work stress as a healthconcern and that his son had asthma – the issue of working with chemicals and the responsibilityinvolved for the safety of other workers had added to the stress condition. Only one of theinterviewees suggested that they would leave the area because of health concerns and socialreasons were also a factor in this case.
A perception of air quality issues appears more the case than experiential factors as indicated in thefollowing quote from a respondent who resided considerable distance from industrial sites;
“The air quality, that is an ongoing issue – we don’t see it too much in Calliope – but that’s why webought in Calliope because we are away from the prevailing winds and we don’t get any fallout fromindustry”.
2010 GLADSTONE INDUSTRY COMMUNITY PERCEPTION STUDY
58 Centre for Environmental Management
Interviewees were asked if they changed the way they did things for ‘industry’ related issues –emissions, odours etc. Three interviewees stated that they did change the way they did things andnine interviewees said that they didn’t make changes to how they did things. However, of thosenine interviewees two also stated that there were certain areas in the Gladstone region, where theywould not live. One of those interviewees said that while they didn’t specifically change the waythey did things they always wound the car window up when they were driving in certain areas, dueto the odour, indicating a level of reaction. The other interviewee said that in certain prevailingwinds the odour was offensive. These two quotes indicate the impact and show that local residentsare concerned with the perception of their community by visitors and friends.
“No you learn to live with it. We are fortunate where we are but if the wind is blowing in the wrongdirection you get the smell from QAL and it’s just like a sewerage smell and you just wait for the windto change direction. This is the premier real estate area of Gladstone”.
“I avoid certain roads because of the traffic and the danger associated with that so you try to findanother way home in those busy periods. Sometimes if the wind is the other way we will get thesmell from QAL we will shut the windows, it’s when you have friends and visitors from out ofGladstone that they really notice it”.
In relation to specific industries in the Gladstone area three interviewees had no concern with anyspecific industry; nine interviewees expressed concern for specific industries which included: themining of chemicals, coal and caustic emissions, the LNG industry developments, QAL, the use ofNOX, and the main Gladstone industries all rated a general mention. Two interviewees expressedspecific concern at NOX emissions; with one interviewee saying that they were concerned with thetransportation (by road) of hazardous materials and the locating of industry near waterways.
“Yes, mining of chemicals. The type of chemicals they are producing there like cyanide andhydrochloride and others they produce, they produce sulphur too. The scenario is that they are tooclose to our water base, the ocean but particularly the narrows. In case of accidents, leakages intoour waterways, I don’t think there are sufficient precautions taken to prevent that”.
Responses to the question of more industry development in the Gladstone region were mostlyattached with conditions. Only one interviewee said that the region ‘needed it’. Severalinterviewees suggested that infrastructure needed to be upgraded before more industry should beestablished. One interviewee believes that in time to come industry will stretch from the Gladstoneport through to the township of Raglan.
There were also concerns expressed that industry should stop claiming prime agricultural land whileseveral other interviewees stated that as long as industrial practices were socially andenvironmentally responsible then it was acceptable. One interviewee suggested that ‘cleanindustry’ appropriately located would be welcome. The following quotes summarised the generalposition of the interviewees with regards to industrial development in the Gladstone area.
2010
Centre for Environmental Management 59
The comments range from anti industrial development sentiments in which concern is raised overthe protection of agricultural land,
“Stop bringing it in to prime agricultural land, we’ve got to eat so stop wiping out mountains andfarming areas”.
Other comments gave support to more industrial development with conditions associated with goodcorporate citizenship applied,
“Providing they pay for their own infrastructure and sufficient safety factors are built into theirdevelopment there shouldn’t be any objections”.
“I am not opposed to it as long as it’s done in a responsible manner and fits in with communityaspirations”.
A final comment related to the type of industry attracted to the region and reflects possible futureindustrial development aspirations,
“I would like to see some clean industry come; we’ve got a lot of dirty industry so it would be great tosee some clean industry”.
2010 GLADSTONE INDUSTRY COMMUNITY PERCEPTION STUDY
60 Centre for Environmental Management
3.1. CONCLUSION
The combination of the performance of Gladstone industry and the high level of acceptance withinthe Gladstone community indicates that Gladstone industry is performing satisfactorily in the task ofmaintaining a ‘social licence to operate’ in the region. The challenge is for industry to not onlymaintain its satisfactory performance but to maximise its efforts through positive action to increasesupport throughout the community by continuous identification of potential flashpoints forcommunity concern. As the industry presence grows in the Gladstone region so does the risk thatcommunity sentiments will shift in a negative way if appropriate strategies are not adopted andactioned upon.
This is not a simple task as there is the suggestion that for some Gladstone residents the expectationof industry performance will be a shifting aspirational goal that will never be met. Prudentinvestment in the Gladstone community that clearly demonstrates a reflexive best practice modelwill assist to maintain the positive community attitudes. The investment in the maintenance of asatisfactory operating environment needs to be balanced against the difficult task of shifting anentrenched set of relatively negative views of industry.
This report has identified some important areas for consideration by Gladstone industry such as thepriority areas of health infrastructure and urban based facilities as well as balancing environmentalprotection. In relation to good corporate citizenship it is recommended that the benchmarkmeasurement of corporate citizenship be expanded to incorporate sustainability concepts measuredacross five key areas of cultural, economic, environmental, human and social performance. Theindices presented in this report are an illustration of what can be achieved using the legacybenchmark indicators of previous Gladstone industry studies. The indicators can be improved andserve the Gladstone community by providing a clearer measurement of Gladstone industryperformance. It is hoped that this will assist the Gladstone community to develop in a productiveand sustainable way.
2010
Centre for Environmental Management 61
REFERENCES
ABS (Australian Bureau of Statistics) 2002 2001 Census - Community Profile, Commonwealth ofAustralia, Canberra.
ABS (Australian Bureau of Statistics) 2006 Cat. no. 5209.0.55.001 Australian National Accounts:Input-Output Tables - Electronic Publication.
ABS (Australian Bureau of Statistics) 2008 2006 Census - Community Profile, Commonwealth ofAustralia, Canberra.
ABS (Australian Bureau of Statistics) 2008 Cat. no. 5209.0.55.001 Australian National Accounts:Input-Output Tables - Electronic Publication, 2004-05 Final.
ABS (Australian Bureau of Statistics) 2009 Regional Population Growth (Cat no. 3218.0) andunpublished data, collected from Queensland Regional Profiles, Mackay Statistical Division 29August 2009.
Akbar, D, Rolfe, J., Lockie, S. and Ivanova, G. 2009 Housing Stress and Location Choices in BowenBasin Mining Communities – A Case Study of Moranbah, Sustainable Development Indicatorsin the Minerals Industry 2009, Gold Coast, 6-9 July.
Akbar, D. and Rolfe, J. 2008 Development of Bowen Basin Regional Housing Model and itsApplication: a Case Study of Moranbah, A research reports No. 3&4, prepared for theAustralian Coal Association Research Program. Centre for Environmental Management,Central Queensland University, Rockhampton.
Akbar, D., Greer, L and Rolfe, J. 2009 Capitals in Non-Capitals: Liveability in Regional Australia, PacificRegional Science Conference 2009, Gold Coast, 19-22 July.
Akbar, D., Rolfe, J. and Greer, L. 2008 Bowen Basin Regional Housing Demand Forecasting Model:Application to Five Towns, Report prepared for Department of Tourism, RegionalDevelopment and Industry, CQUniversity, Rockhampton.
Case, M., Roper, B., 2010, When QAL Came to Town: Living Through the Construction Years inGladstone 1964-1967, Accessed athttp://espace.library.uq.edu.au/eserv/UQ:210148/p9780646519197_2_183.pdf
Caniglia, F., Bourke, P. and While, A.P. 2010 A Scan of Disadvantage in Queensland 2010 – FromAnalysis to Innovation in Place-based Practice, Centre for Social Justice and Uniting CareQueensland, Brisbane.
DEEWR (Department of Education Employment and Workplace Relations) 2006 Gladstone Skills inDemand Survey November 2006 (online) date accessed 27/8/08 http://www.dewr.gov.au/.
Department of Emergency Services 2008 Strategic Plan 2008 to 2012, Internet entry:http://www.communitysafety.qld.gov.au/CRTI/documents/1018SPES_Strategic_Plan_2008_2012.pdf, accessed on 10 October, 2009.
Department of Mines and Energy 2008 Average Export Price (Fob) per Tonne - A$ [Online] Dateaccessed 01/05/2005 URL: http://www.dme.qld.gov.au/mines/coal_statistics.cfm.
DERM (Department of Environment and Resource Management) 2006 Blueprint for the Bush, QLDGovernment, Internet entry: http://www.derm.qld.gov.au/blueprint/, accessed on 10October 2009.
2010 GLADSTONE INDUSTRY COMMUNITY PERCEPTION STUDY
62 Centre for Environmental Management
DET (Department of Education and Training) 2008a Queensland Skills Plan 2008, QLD Government.Internet entry: http://www.trainandemploy.qld.gov.au/skillsplan/, accessed on 10 October,2009.
DET (Department of Education and Training) 2008b Strategic Plan 2008 to 2012, QLD Government.Internet entry: http://education.qld.gov.au/strategic/planning/, accessed on 10 October,2009.
DET (Department of Education and Training) 2009 Queensland Skills Plan, Internet entry:http://www.trainandemploy.qld.gov.au/resources/about/pdf/highlights-skills-plan-2008.pdf, date accessed 27/08/2009
DEEWR (Department of Education, Employment and Workplace Relations) 2009 Small Area LabourMarkets Australia, June Quarter 2009, Commonwealth Government, Canberra.
DIP (Department of Infrastructure and Planning) 2002 Central Queensland Regional GrowthManagement Framework (CQANM), QLD Government. Internet entry:http://www.dip.qld.gov.au/resources/plan/regional-growth/cqrgfm.pdf, accessed on 10October, 2009.
Mandeville, T. D. and Jensen, R. C. 1978 The impact of major development projects on theGladstone/Calliope, Mackay , Queensland, and Australian economies: An application ofInput-Output analysis. Report to the Department of Commercial and Industrial Developmentand Comalco Limited. Department of Economics, University of Queensland.
Miles, R. L. and Kinnear, S. 2008 Sustainable Regional Development in the Bowen Basin - A StrategicIssues Paper, the Minerals Council of Australia and the Queensland Resources Council andCQUniversity Australia, Rockhampton.
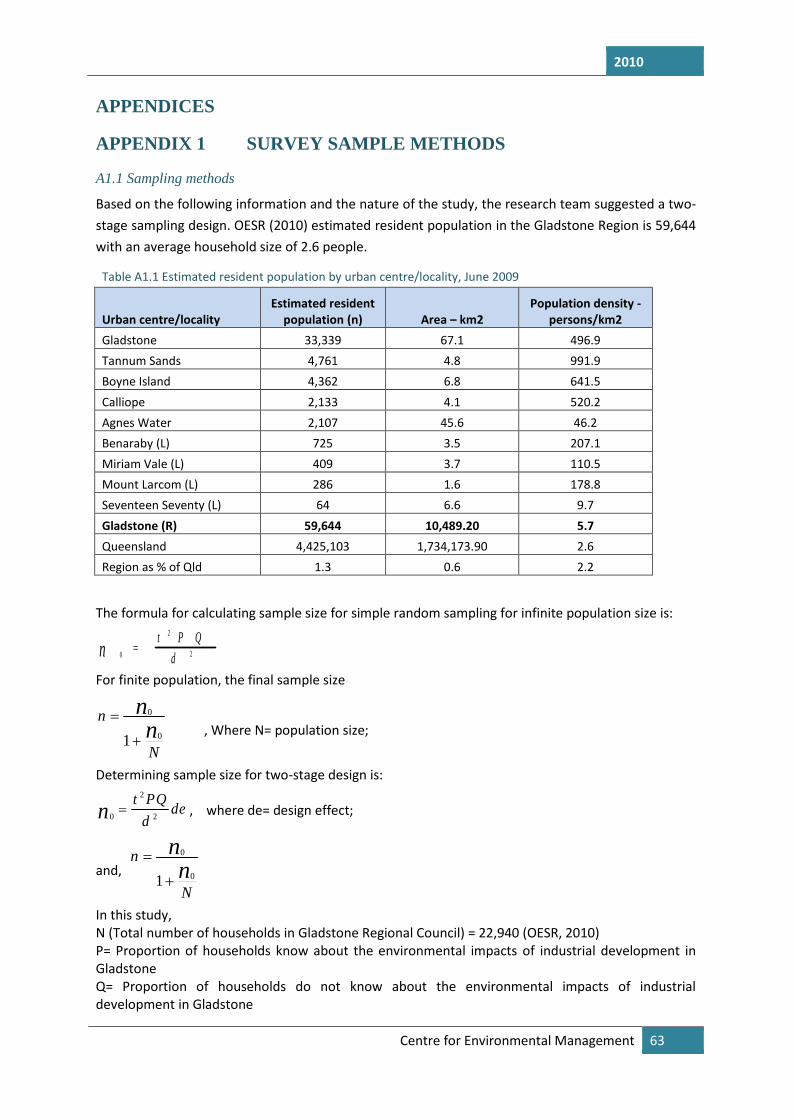
2010
Centre for Environmental Management 63
APPENDICES
APPENDIX 1 SURVEY SAMPLE METHODS
A1.1 Sampling methods
Based on the following information and the nature of the study, the research team suggested a two-stage sampling design. OESR (2010) estimated resident population in the Gladstone Region is 59,644with an average household size of 2.6 people.
Table A1.1 Estimated resident population by urban centre/locality, June 2009
Urban centre/localityEstimated resident
population (n) Area – km2Population density -
persons/km2Gladstone 33,339 67.1 496.9Tannum Sands 4,761 4.8 991.9Boyne Island 4,362 6.8 641.5Calliope 2,133 4.1 520.2Agnes Water 2,107 45.6 46.2Benaraby (L) 725 3.5 207.1Miriam Vale (L) 409 3.7 110.5Mount Larcom (L) 286 1.6 178.8Seventeen Seventy (L) 64 6.6 9.7Gladstone (R) 59,644 10,489.20 5.7Queensland 4,425,103 1,734,173.90 2.6Region as % of Qld 1.3 0.6 2.2
The formula for calculating sample size for simple random sampling for infinite population size is:
2
2
0 d
P Qtn
For finite population, the final sample size
N
nn
n0
0
1
, Where N= population size;
Determining sample size for two-stage design is:
ded
PQtn 2
2
0 , where de= design effect;
and,N
nn
n0
0
1
In this study,N (Total number of households in Gladstone Regional Council) = 22,940 (OESR, 2010)P= Proportion of households know about the environmental impacts of industrial development inGladstoneQ= Proportion of households do not know about the environmental impacts of industrialdevelopment in Gladstone
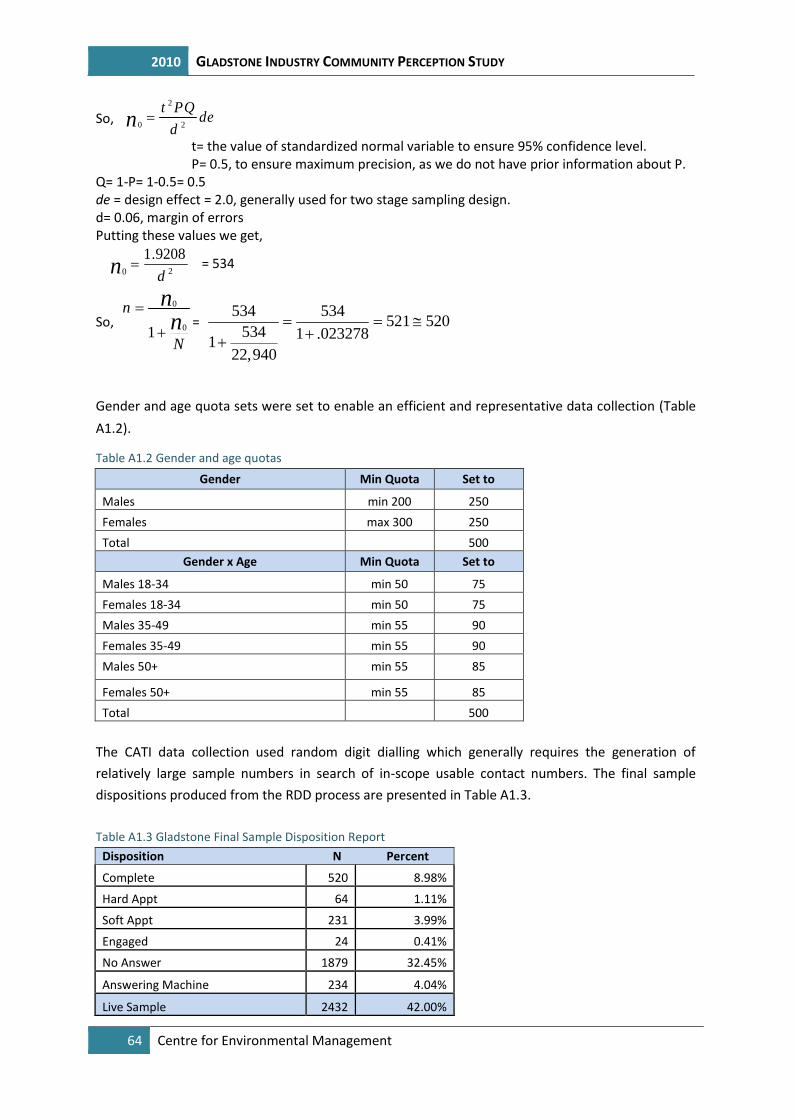
2010 GLADSTONE INDUSTRY COMMUNITY PERCEPTION STUDY
64 Centre for Environmental Management
So, ded
PQtn 2
2
0
t= the value of standardized normal variable to ensure 95% confidence level.P= 0.5, to ensure maximum precision, as we do not have prior information about P.
Q= 1-P= 1-0.5= 0.5de = design effect = 2.0, generally used for two stage sampling design.d= 0.06, margin of errorsPutting these values we get,
20
9208.1
dn = 534
So,N
nn
n0
0
1
=
534 534521 520
534 1 .023278122,940
Gender and age quota sets were set to enable an efficient and representative data collection (TableA1.2).
Table A1.2 Gender and age quotas
Gender Min Quota Set to
Males min 200 250Females max 300 250Total 500
Gender x Age Min Quota Set to
Males 18-34 min 50 75Females 18-34 min 50 75Males 35-49 min 55 90Females 35-49 min 55 90Males 50+ min 55 85
Females 50+ min 55 85Total 500
The CATI data collection used random digit dialling which generally requires the generation ofrelatively large sample numbers in search of in-scope usable contact numbers. The final sampledispositions produced from the RDD process are presented in Table A1.3.
Table A1.3 Gladstone Final Sample Disposition ReportDisposition N Percent
Complete 520 8.98%
Hard Appt 64 1.11%
Soft Appt 231 3.99%
Engaged 24 0.41%
No Answer 1879 32.45%
Answering Machine 234 4.04%
Live Sample 2432 42.00%
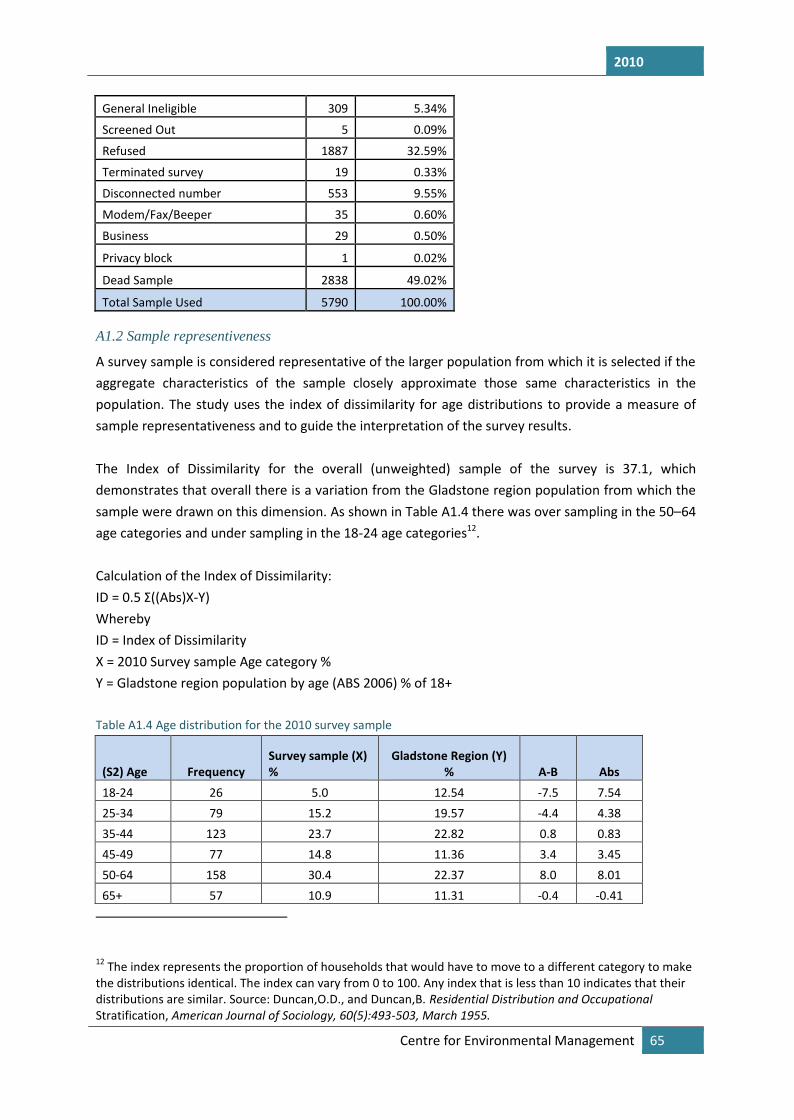
2010
Centre for Environmental Management 65
General Ineligible 309 5.34%
Screened Out 5 0.09%
Refused 1887 32.59%
Terminated survey 19 0.33%
Disconnected number 553 9.55%
Modem/Fax/Beeper 35 0.60%
Business 29 0.50%
Privacy block 1 0.02%
Dead Sample 2838 49.02%
Total Sample Used 5790 100.00%
A1.2 Sample representiveness
A survey sample is considered representative of the larger population from which it is selected if theaggregate characteristics of the sample closely approximate those same characteristics in thepopulation. The study uses the index of dissimilarity for age distributions to provide a measure ofsample representativeness and to guide the interpretation of the survey results.
The Index of Dissimilarity for the overall (unweighted) sample of the survey is 37.1, whichdemonstrates that overall there is a variation from the Gladstone region population from which thesample were drawn on this dimension. As shown in Table A1.4 there was over sampling in the 50–64age categories and under sampling in the 18-24 age categories12.
Calculation of the Index of Dissimilarity:ID = 0.5 Σ((Abs)X‐Y)WherebyID = Index of DissimilarityX = 2010 Survey sample Age category %Y = Gladstone region population by age (ABS 2006) % of 18+
Table A1.4 Age distribution for the 2010 survey sample
(S2) Age FrequencySurvey sample (X)%
Gladstone Region (Y)% A-B Abs
18-24 26 5.0 12.54 -7.5 7.5425-34 79 15.2 19.57 -4.4 4.3835-44 123 23.7 22.82 0.8 0.8345-49 77 14.8 11.36 3.4 3.4550-64 158 30.4 22.37 8.0 8.0165+ 57 10.9 11.31 -0.4 -0.41
12 The index represents the proportion of households that would have to move to a different category to makethe distributions identical. The index can vary from 0 to 100. Any index that is less than 10 indicates that theirdistributions are similar. Source: Duncan,O.D., and Duncan,B. Residential Distribution and OccupationalStratification, American Journal of Sociology, 60(5):493‐503, March 1955.
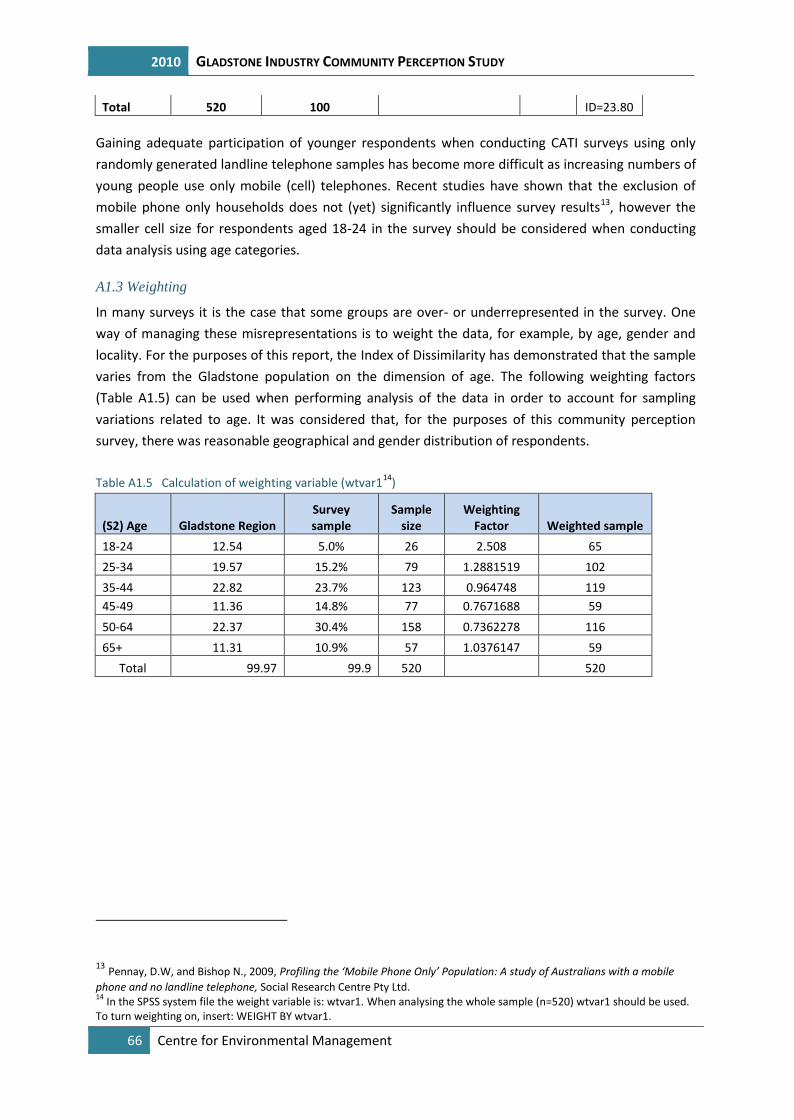
2010 GLADSTONE INDUSTRY COMMUNITY PERCEPTION STUDY
66 Centre for Environmental Management
Total 520 100 ID=23.80
Gaining adequate participation of younger respondents when conducting CATI surveys using onlyrandomly generated landline telephone samples has become more difficult as increasing numbers ofyoung people use only mobile (cell) telephones. Recent studies have shown that the exclusion ofmobile phone only households does not (yet) significantly influence survey results13, however thesmaller cell size for respondents aged 18‐24 in the survey should be considered when conductingdata analysis using age categories.
A1.3 Weighting
In many surveys it is the case that some groups are over- or underrepresented in the survey. Oneway of managing these misrepresentations is to weight the data, for example, by age, gender andlocality. For the purposes of this report, the Index of Dissimilarity has demonstrated that the samplevaries from the Gladstone population on the dimension of age. The following weighting factors(Table A1.5) can be used when performing analysis of the data in order to account for samplingvariations related to age. It was considered that, for the purposes of this community perceptionsurvey, there was reasonable geographical and gender distribution of respondents.
Table A1.5 Calculation of weighting variable (wtvar114)
(S2) Age Gladstone RegionSurveysample
Samplesize
WeightingFactor Weighted sample
18-24 12.54 5.0% 26 2.508 6525-34 19.57 15.2% 79 1.2881519 10235-44 22.82 23.7% 123 0.964748 11945-49 11.36 14.8% 77 0.7671688 5950-64 22.37 30.4% 158 0.7362278 11665+ 11.31 10.9% 57 1.0376147 59
Total 99.97 99.9 520 520
13 Pennay, D.W, and Bishop N., 2009, Profiling the ‘Mobile Phone Only’ Population: A study of Australians with a mobilephone and no landline telephone, Social Research Centre Pty Ltd.14 In the SPSS system file the weight variable is: wtvar1. When analysing the whole sample (n=520) wtvar1 should be used.To turn weighting on, insert: WEIGHT BY wtvar1.
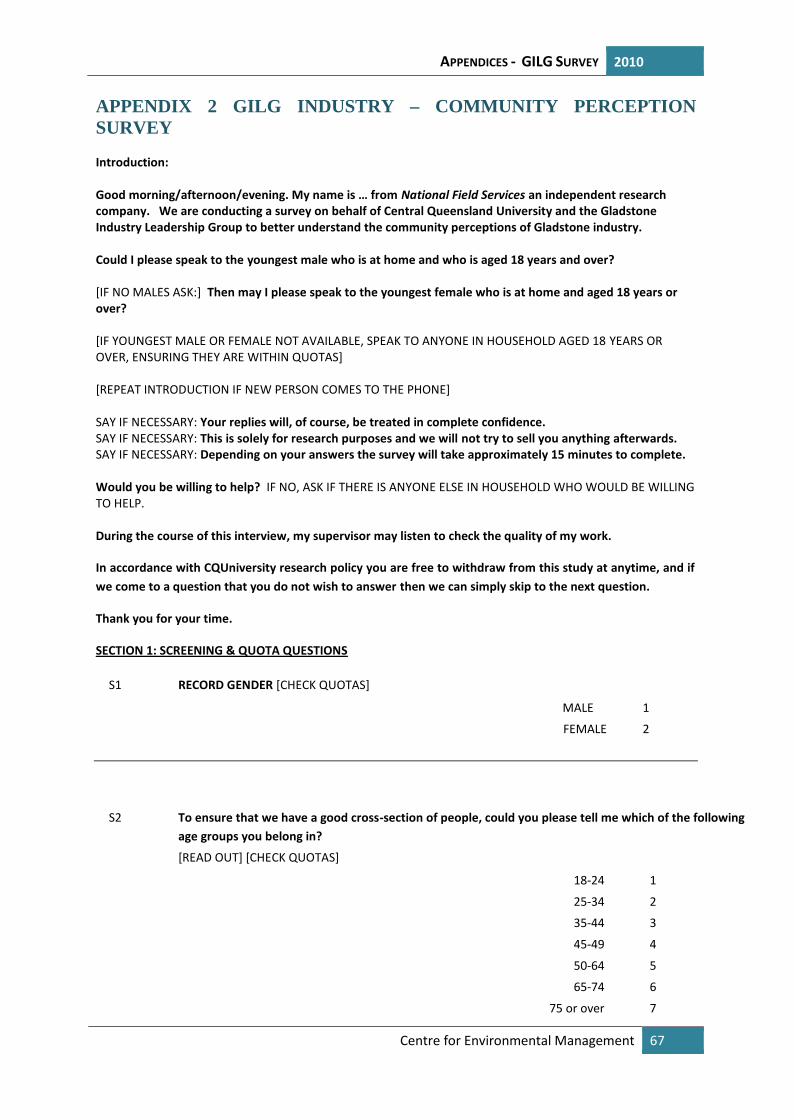
APPENDICES - GILG SURVEY 2010
Centre for Environmental Management 67
APPENDIX 2 GILG INDUSTRY – COMMUNITY PERCEPTIONSURVEY
Introduction:
Good morning/afternoon/evening. My name is … from National Field Services an independent researchcompany. We are conducting a survey on behalf of Central Queensland University and the GladstoneIndustry Leadership Group to better understand the community perceptions of Gladstone industry.
Could I please speak to the youngest male who is at home and who is aged 18 years and over?
[IF NO MALES ASK:] Then may I please speak to the youngest female who is at home and aged 18 years orover?
[IF YOUNGEST MALE OR FEMALE NOT AVAILABLE, SPEAK TO ANYONE IN HOUSEHOLD AGED 18 YEARS OROVER, ENSURING THEY ARE WITHIN QUOTAS]
[REPEAT INTRODUCTION IF NEW PERSON COMES TO THE PHONE]
SAY IF NECESSARY: Your replies will, of course, be treated in complete confidence.SAY IF NECESSARY: This is solely for research purposes and we will not try to sell you anything afterwards.SAY IF NECESSARY: Depending on your answers the survey will take approximately 15 minutes to complete.
Would you be willing to help? IF NO, ASK IF THERE IS ANYONE ELSE IN HOUSEHOLD WHO WOULD BE WILLINGTO HELP.
During the course of this interview, my supervisor may listen to check the quality of my work.
In accordance with CQUniversity research policy you are free to withdraw from this study at anytime, and ifwe come to a question that you do not wish to answer then we can simply skip to the next question.
Thank you for your time.
SECTION 1: SCREENING & QUOTA QUESTIONS
S1 RECORD GENDER [CHECK QUOTAS]
MALE 1
FEMALE 2
S2 To ensure that we have a good cross-section of people, could you please tell me which of the followingage groups you belong in?
[READ OUT] [CHECK QUOTAS]
18-24 1
25-34 2
35-44 3
45-49 4
50-64 5
65-74 6
75 or over 7
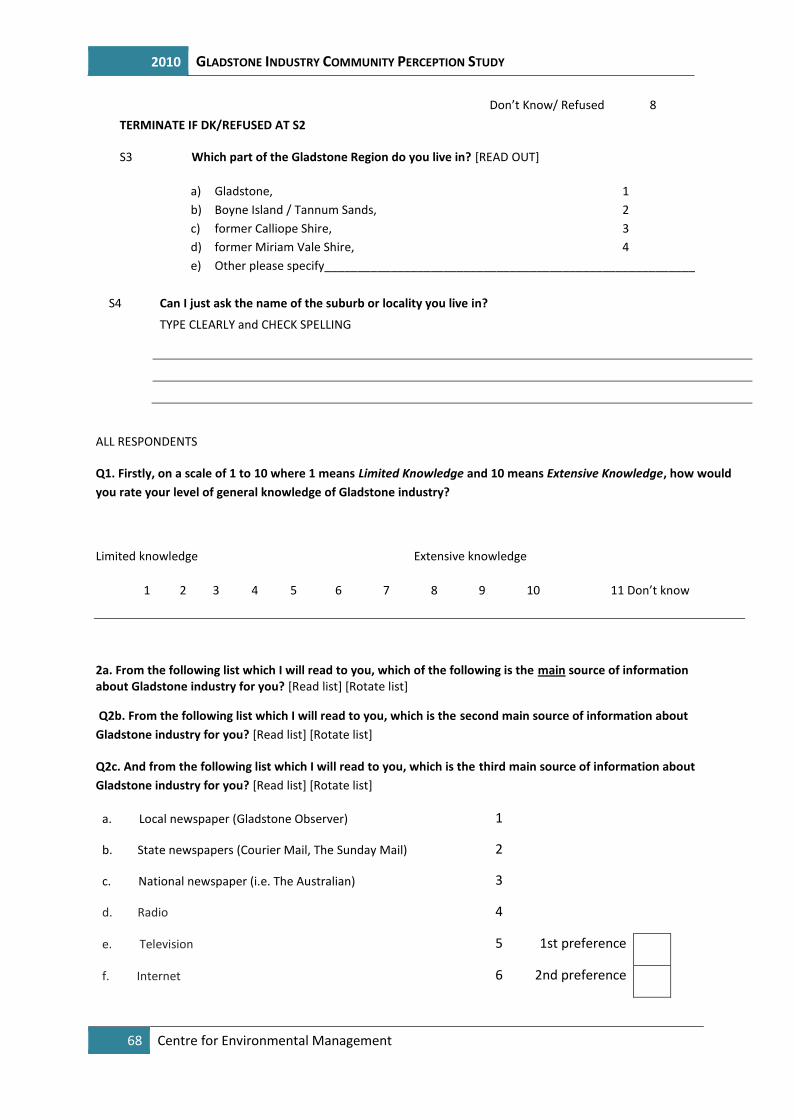
2010 GLADSTONE INDUSTRY COMMUNITY PERCEPTION STUDY
68 Centre for Environmental Management
Don’t Know/ Refused 8TERMINATE IF DK/REFUSED AT S2
S3 Which part of the Gladstone Region do you live in? [READ OUT]
a) Gladstone, 1b) Boyne Island / Tannum Sands, 2c) former Calliope Shire, 3d) former Miriam Vale Shire, 4e) Other please specify________________________________________________________
S4 Can I just ask the name of the suburb or locality you live in?
TYPE CLEARLY and CHECK SPELLING
ALL RESPONDENTS
Q1. Firstly, on a scale of 1 to 10 where 1 means Limited Knowledge and 10 means Extensive Knowledge, how wouldyou rate your level of general knowledge of Gladstone industry?
Limited knowledge Extensive knowledge
1 2 3 4 5 6 7 8 9 10 11 Don’t know
2a. From the following list which I will read to you, which of the following is the main source of informationabout Gladstone industry for you? [Read list] [Rotate list]
Q2b. From the following list which I will read to you, which is the second main source of information aboutGladstone industry for you? [Read list] [Rotate list]
Q2c. And from the following list which I will read to you, which is the third main source of information aboutGladstone industry for you? [Read list] [Rotate list]
a. Local newspaper (Gladstone Observer) 1
b. State newspapers (Courier Mail, The Sunday Mail) 2
c. National newspaper (i.e. The Australian) 3
d. Radio 4
e. Television 5 1st preference
f. Internet 6 2nd preference
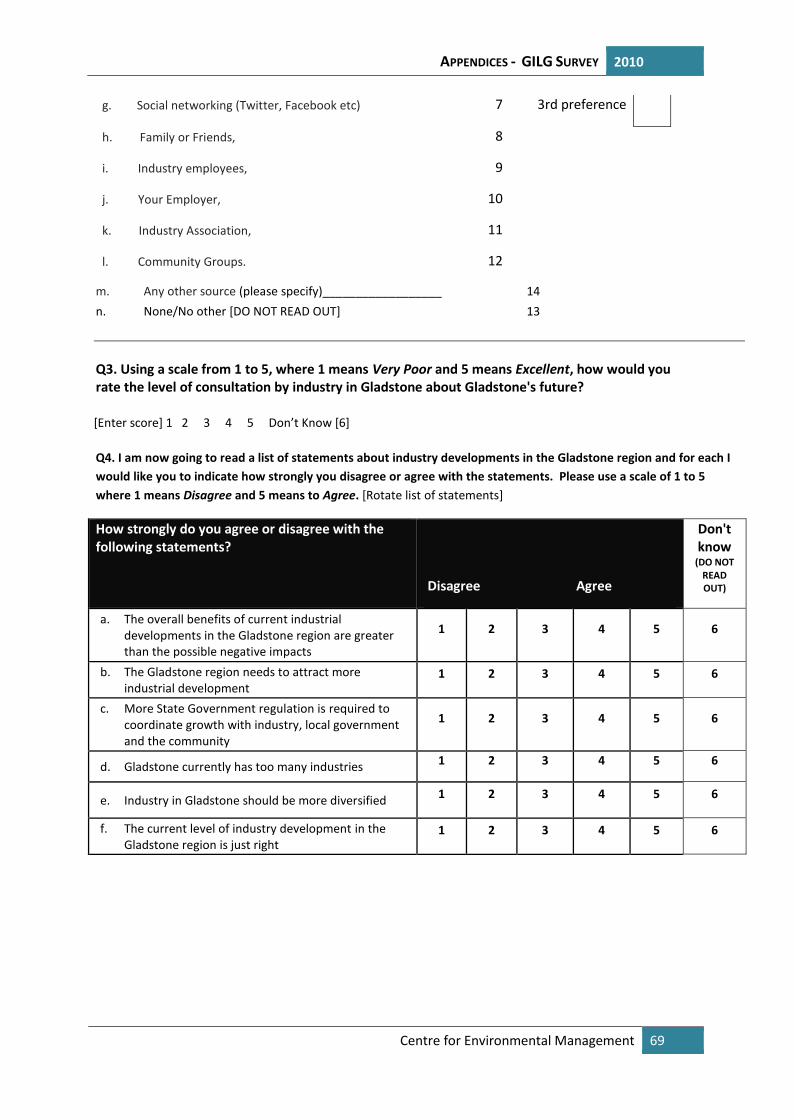
APPENDICES - GILG SURVEY 2010
Centre for Environmental Management 69
g. Social networking (Twitter, Facebook etc) 7 3rd preference
h. Family or Friends, 8
i. Industry employees, 9
j. Your Employer, 10
k. Industry Association, 11
l. Community Groups. 12
m. Any other source (please specify)__________________ 14n. None/No other [DO NOT READ OUT] 13
Q3. Using a scale from 1 to 5, where 1 means Very Poor and 5 means Excellent, how would yourate the level of consultation by industry in Gladstone about Gladstone's future?
[Enter score] 1 2 3 4 5 Don’t Know [6]
Q4. I am now going to read a list of statements about industry developments in the Gladstone region and for each Iwould like you to indicate how strongly you disagree or agree with the statements. Please use a scale of 1 to 5where 1 means Disagree and 5 means to Agree. [Rotate list of statements]
How strongly do you agree or disagree with thefollowing statements?
Disagree Agree
Don'tknow
(DO NOTREADOUT)
a. The overall benefits of current industrialdevelopments in the Gladstone region are greaterthan the possible negative impacts
1 2 3 4 5 6
b. The Gladstone region needs to attract moreindustrial development
1 2 3 4 5 6
c. More State Government regulation is required tocoordinate growth with industry, local governmentand the community
1 2 3 4 5 6
d. Gladstone currently has too many industries 1 2 3 4 5 6
e. Industry in Gladstone should be more diversified 1 2 3 4 5 6
f. The current level of industry development in theGladstone region is just right
1 2 3 4 5 6
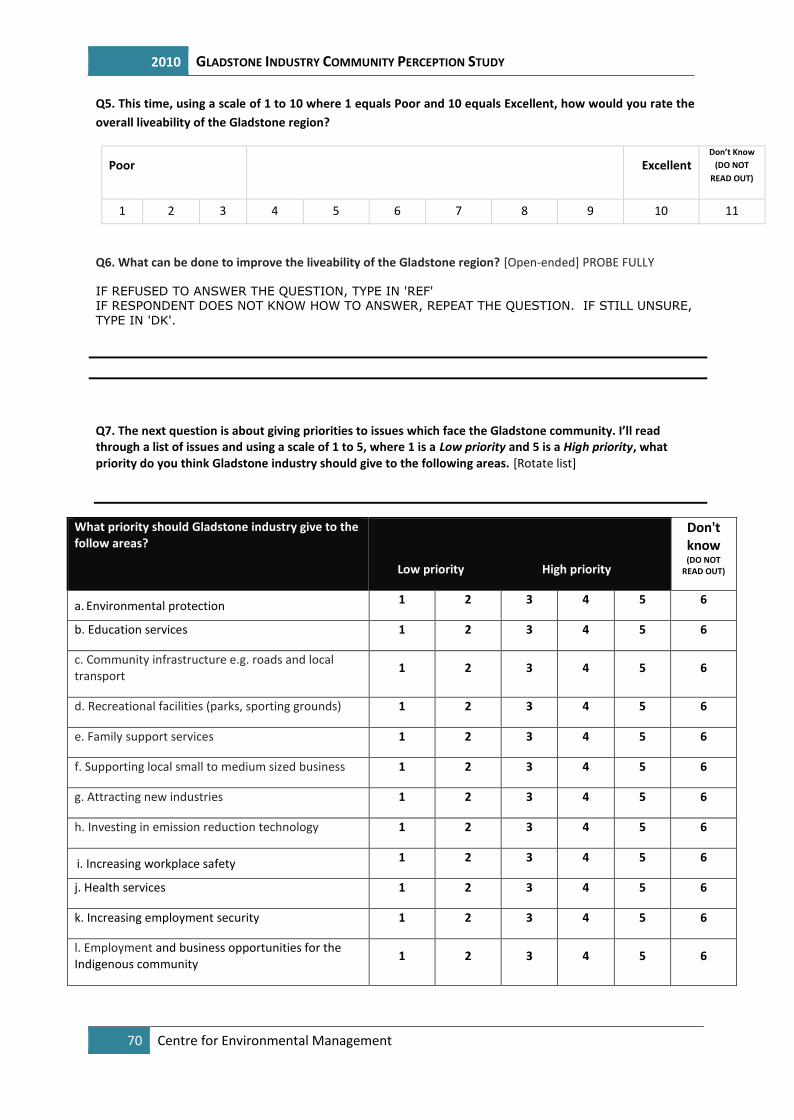
2010 GLADSTONE INDUSTRY COMMUNITY PERCEPTION STUDY
70 Centre for Environmental Management
Q5. This time, using a scale of 1 to 10 where 1 equals Poor and 10 equals Excellent, how would you rate theoverall liveability of the Gladstone region?
Poor ExcellentDon’t Know
(DO NOTREAD OUT)
1 2 3 4 5 6 7 8 9 10 11
Q6. What can be done to improve the liveability of the Gladstone region? [Open-ended] PROBE FULLY
IF REFUSED TO ANSWER THE QUESTION, TYPE IN 'REF'IF RESPONDENT DOES NOT KNOW HOW TO ANSWER, REPEAT THE QUESTION. IF STILL UNSURE,TYPE IN 'DK'.
Q7. The next question is about giving priorities to issues which face the Gladstone community. I’ll readthrough a list of issues and using a scale of 1 to 5, where 1 is a Low priority and 5 is a High priority, whatpriority do you think Gladstone industry should give to the following areas. [Rotate list]
What priority should Gladstone industry give to thefollow areas?
Low priority High priority
Don'tknow(DO NOT
READ OUT)
a. Environmental protection 1 2 3 4 5 6
b. Education services 1 2 3 4 5 6
c. Community infrastructure e.g. roads and localtransport 1 2 3 4 5 6
d. Recreational facilities (parks, sporting grounds) 1 2 3 4 5 6
e. Family support services 1 2 3 4 5 6
f. Supporting local small to medium sized business 1 2 3 4 5 6
g. Attracting new industries 1 2 3 4 5 6
h. Investing in emission reduction technology 1 2 3 4 5 6
i. Increasing workplace safety 1 2 3 4 5 6
j. Health services 1 2 3 4 5 6
k. Increasing employment security 1 2 3 4 5 6
l. Employment and business opportunities for theIndigenous community 1 2 3 4 5 6
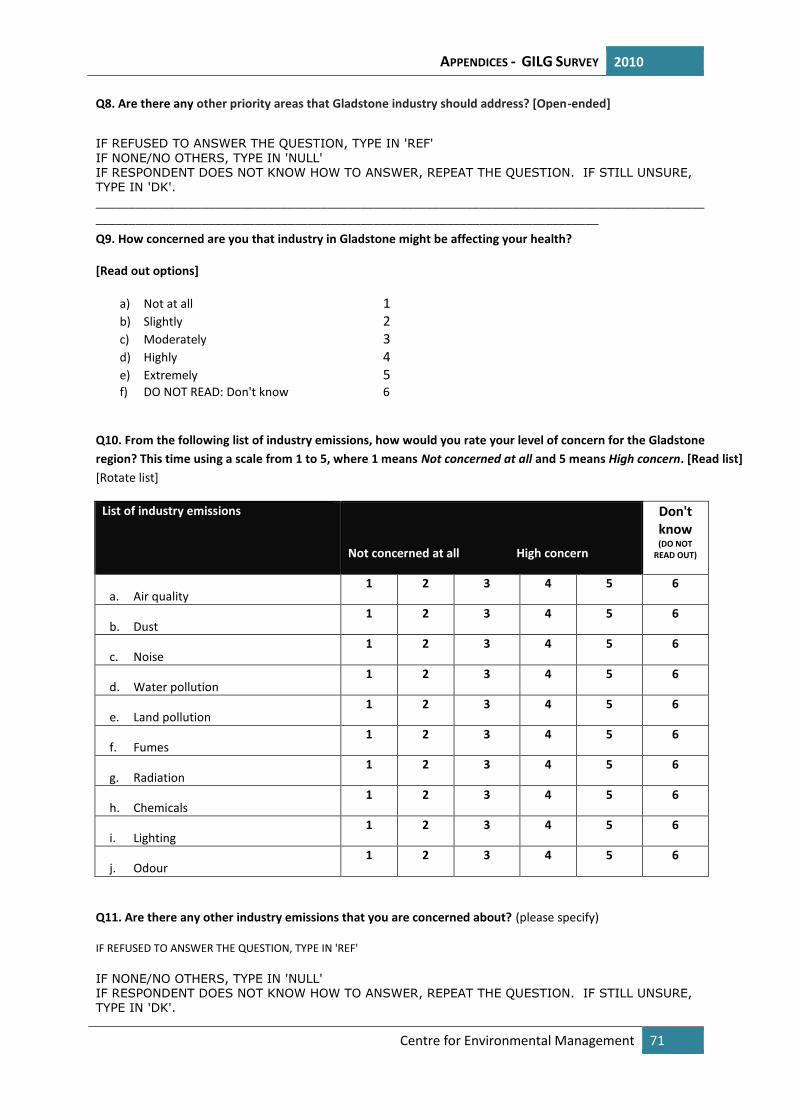
APPENDICES - GILG SURVEY 2010
Centre for Environmental Management 71
Q8. Are there any other priority areas that Gladstone industry should address? [Open-ended]
IF REFUSED TO ANSWER THE QUESTION, TYPE IN 'REF'IF NONE/NO OTHERS, TYPE IN 'NULL'IF RESPONDENT DOES NOT KNOW HOW TO ANSWER, REPEAT THE QUESTION. IF STILL UNSURE,TYPE IN 'DK'.________________________________________________________________________________________________________________________________________________________________________Q9. How concerned are you that industry in Gladstone might be affecting your health?
[Read out options]
a) Not at all 1b) Slightly 2c) Moderately 3d) Highly 4e) Extremely 5f) DO NOT READ: Don't know 6
Q10. From the following list of industry emissions, how would you rate your level of concern for the Gladstoneregion? This time using a scale from 1 to 5, where 1 means Not concerned at all and 5 means High concern. [Read list][Rotate list]
List of industry emissions
Not concerned at all High concern
Don'tknow(DO NOT
READ OUT)
a. Air quality1 2 3 4 5 6
b. Dust1 2 3 4 5 6
c. Noise1 2 3 4 5 6
d. Water pollution1 2 3 4 5 6
e. Land pollution1 2 3 4 5 6
f. Fumes1 2 3 4 5 6
g. Radiation1 2 3 4 5 6
h. Chemicals1 2 3 4 5 6
i. Lighting1 2 3 4 5 6
j. Odour1 2 3 4 5 6
Q11. Are there any other industry emissions that you are concerned about? (please specify)
IF REFUSED TO ANSWER THE QUESTION, TYPE IN 'REF'
IF NONE/NO OTHERS, TYPE IN 'NULL'IF RESPONDENT DOES NOT KNOW HOW TO ANSWER, REPEAT THE QUESTION. IF STILL UNSURE,TYPE IN 'DK'.
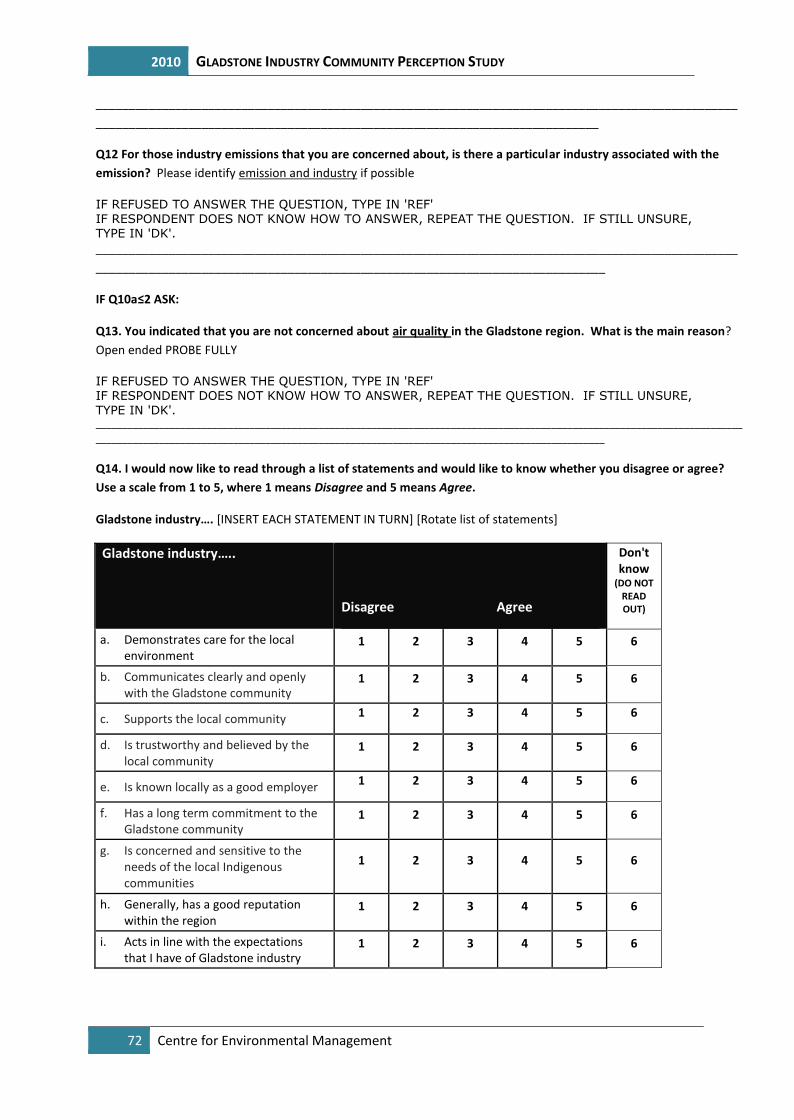
2010 GLADSTONE INDUSTRY COMMUNITY PERCEPTION STUDY
72 Centre for Environmental Management
_____________________________________________________________________________________________________________________________________________________________________________
Q12 For those industry emissions that you are concerned about, is there a particular industry associated with theemission? Please identify emission and industry if possible
IF REFUSED TO ANSWER THE QUESTION, TYPE IN 'REF'IF RESPONDENT DOES NOT KNOW HOW TO ANSWER, REPEAT THE QUESTION. IF STILL UNSURE,TYPE IN 'DK'.______________________________________________________________________________________________________________________________________________________________________________
IF Q10a≤2 ASK:
Q13. You indicated that you are not concerned about air quality in the Gladstone region. What is the main reason?Open ended PROBE FULLY
IF REFUSED TO ANSWER THE QUESTION, TYPE IN 'REF'IF RESPONDENT DOES NOT KNOW HOW TO ANSWER, REPEAT THE QUESTION. IF STILL UNSURE,TYPE IN 'DK'.__________________________________________________________________________________________________________________________________________________________________________________________________________________________
Q14. I would now like to read through a list of statements and would like to know whether you disagree or agree?Use a scale from 1 to 5, where 1 means Disagree and 5 means Agree.
Gladstone industry…. [INSERT EACH STATEMENT IN TURN] [Rotate list of statements]
Gladstone industry…..
Disagree Agree
Don'tknow
(DO NOTREADOUT)
a. Demonstrates care for the localenvironment
1 2 3 4 5 6
b. Communicates clearly and openlywith the Gladstone community
1 2 3 4 5 6
c. Supports the local community 1 2 3 4 5 6
d. Is trustworthy and believed by thelocal community
1 2 3 4 5 6
e. Is known locally as a good employer 1 2 3 4 5 6
f. Has a long term commitment to theGladstone community
1 2 3 4 5 6
g. Is concerned and sensitive to theneeds of the local Indigenouscommunities
1 2 3 4 5 6
h. Generally, has a good reputationwithin the region
1 2 3 4 5 6
i. Acts in line with the expectationsthat I have of Gladstone industry
1 2 3 4 5 6
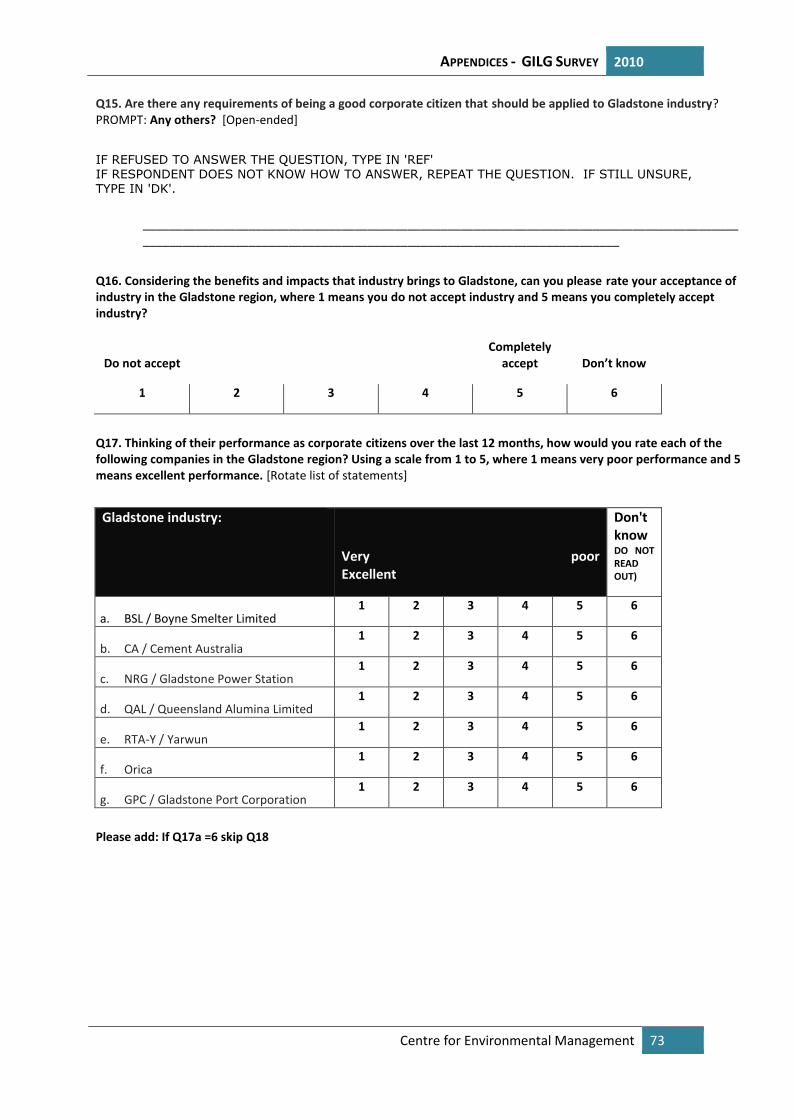
APPENDICES - GILG SURVEY 2010
Centre for Environmental Management 73
Q15. Are there any requirements of being a good corporate citizen that should be applied to Gladstone industry?PROMPT: Any others? [Open-ended]
IF REFUSED TO ANSWER THE QUESTION, TYPE IN 'REF'IF RESPONDENT DOES NOT KNOW HOW TO ANSWER, REPEAT THE QUESTION. IF STILL UNSURE,TYPE IN 'DK'.
__________________________________________________________________________________________________________________________________________________________________
Q16. Considering the benefits and impacts that industry brings to Gladstone, can you please rate your acceptance ofindustry in the Gladstone region, where 1 means you do not accept industry and 5 means you completely acceptindustry?
Do not acceptCompletely
accept Don’t know
1 2 3 4 5 6
Q17. Thinking of their performance as corporate citizens over the last 12 months, how would you rate each of thefollowing companies in the Gladstone region? Using a scale from 1 to 5, where 1 means very poor performance and 5means excellent performance. [Rotate list of statements]
Gladstone industry:
Very poorExcellent
Don'tknowDO NOTREADOUT)
a. BSL / Boyne Smelter Limited1 2 3 4 5 6
b. CA / Cement Australia1 2 3 4 5 6
c. NRG / Gladstone Power Station1 2 3 4 5 6
d. QAL / Queensland Alumina Limited1 2 3 4 5 6
e. RTA-Y / Yarwun1 2 3 4 5 6
f. Orica1 2 3 4 5 6
g. GPC / Gladstone Port Corporation1 2 3 4 5 6
Please add: If Q17a =6 skip Q18
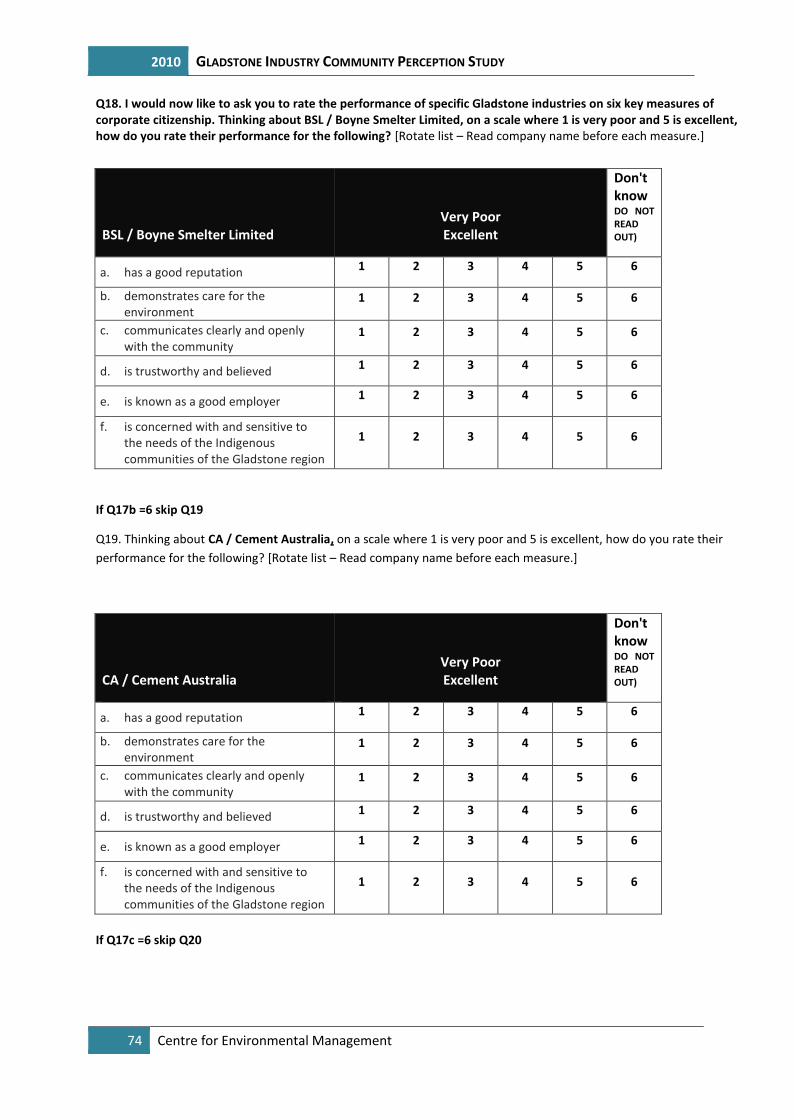
2010 GLADSTONE INDUSTRY COMMUNITY PERCEPTION STUDY
74 Centre for Environmental Management
Q18. I would now like to ask you to rate the performance of specific Gladstone industries on six key measures ofcorporate citizenship. Thinking about BSL / Boyne Smelter Limited, on a scale where 1 is very poor and 5 is excellent,how do you rate their performance for the following? [Rotate list – Read company name before each measure.]
BSL / Boyne Smelter LimitedVery PoorExcellent
Don'tknowDO NOTREADOUT)
a. has a good reputation 1 2 3 4 5 6
b. demonstrates care for theenvironment
1 2 3 4 5 6
c. communicates clearly and openlywith the community
1 2 3 4 5 6
d. is trustworthy and believed 1 2 3 4 5 6
e. is known as a good employer 1 2 3 4 5 6
f. is concerned with and sensitive tothe needs of the Indigenouscommunities of the Gladstone region
1 2 3 4 5 6
If Q17b =6 skip Q19
Q19. Thinking about CA / Cement Australia, on a scale where 1 is very poor and 5 is excellent, how do you rate theirperformance for the following? [Rotate list – Read company name before each measure.]
CA / Cement AustraliaVery PoorExcellent
Don'tknowDO NOTREADOUT)
a. has a good reputation 1 2 3 4 5 6
b. demonstrates care for theenvironment
1 2 3 4 5 6
c. communicates clearly and openlywith the community
1 2 3 4 5 6
d. is trustworthy and believed 1 2 3 4 5 6
e. is known as a good employer 1 2 3 4 5 6
f. is concerned with and sensitive tothe needs of the Indigenouscommunities of the Gladstone region
1 2 3 4 5 6
If Q17c =6 skip Q20
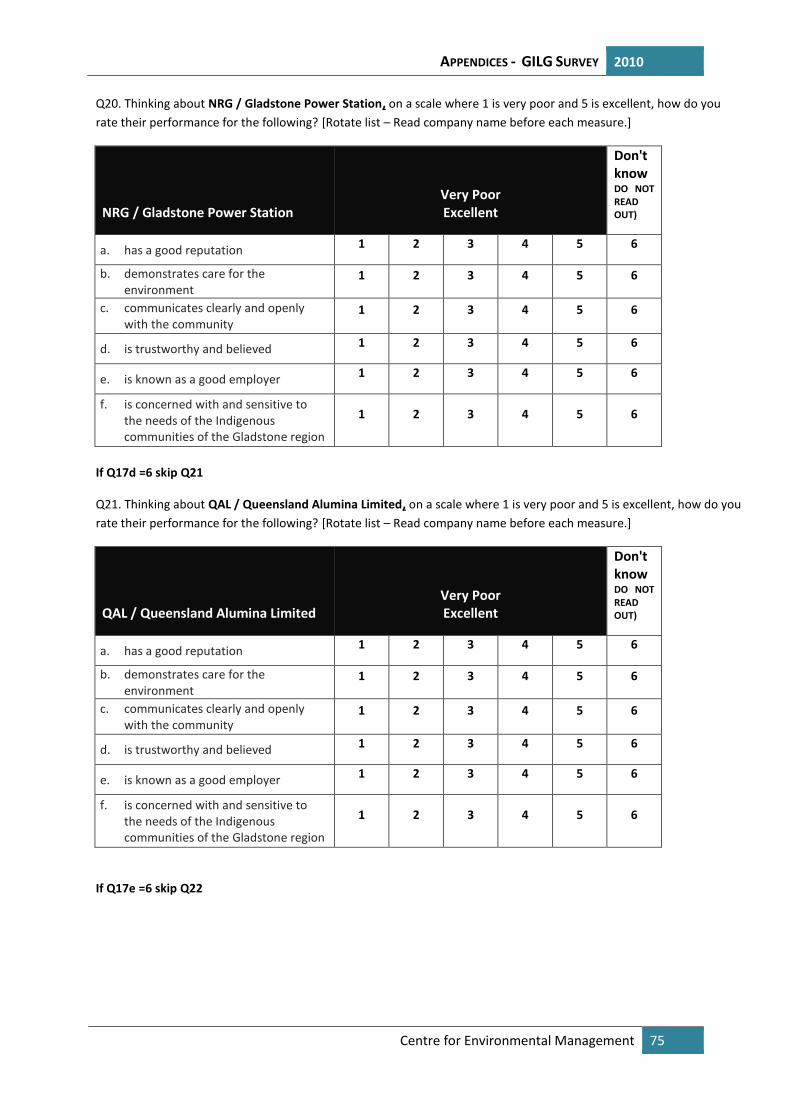
APPENDICES - GILG SURVEY 2010
Centre for Environmental Management 75
Q20. Thinking about NRG / Gladstone Power Station, on a scale where 1 is very poor and 5 is excellent, how do yourate their performance for the following? [Rotate list – Read company name before each measure.]
NRG / Gladstone Power StationVery PoorExcellent
Don'tknowDO NOTREADOUT)
a. has a good reputation 1 2 3 4 5 6
b. demonstrates care for theenvironment
1 2 3 4 5 6
c. communicates clearly and openlywith the community
1 2 3 4 5 6
d. is trustworthy and believed 1 2 3 4 5 6
e. is known as a good employer 1 2 3 4 5 6
f. is concerned with and sensitive tothe needs of the Indigenouscommunities of the Gladstone region
1 2 3 4 5 6
If Q17d =6 skip Q21
Q21. Thinking about QAL / Queensland Alumina Limited, on a scale where 1 is very poor and 5 is excellent, how do yourate their performance for the following? [Rotate list – Read company name before each measure.]
QAL / Queensland Alumina LimitedVery PoorExcellent
Don'tknowDO NOTREADOUT)
a. has a good reputation 1 2 3 4 5 6
b. demonstrates care for theenvironment
1 2 3 4 5 6
c. communicates clearly and openlywith the community
1 2 3 4 5 6
d. is trustworthy and believed 1 2 3 4 5 6
e. is known as a good employer 1 2 3 4 5 6
f. is concerned with and sensitive tothe needs of the Indigenouscommunities of the Gladstone region
1 2 3 4 5 6
If Q17e =6 skip Q22
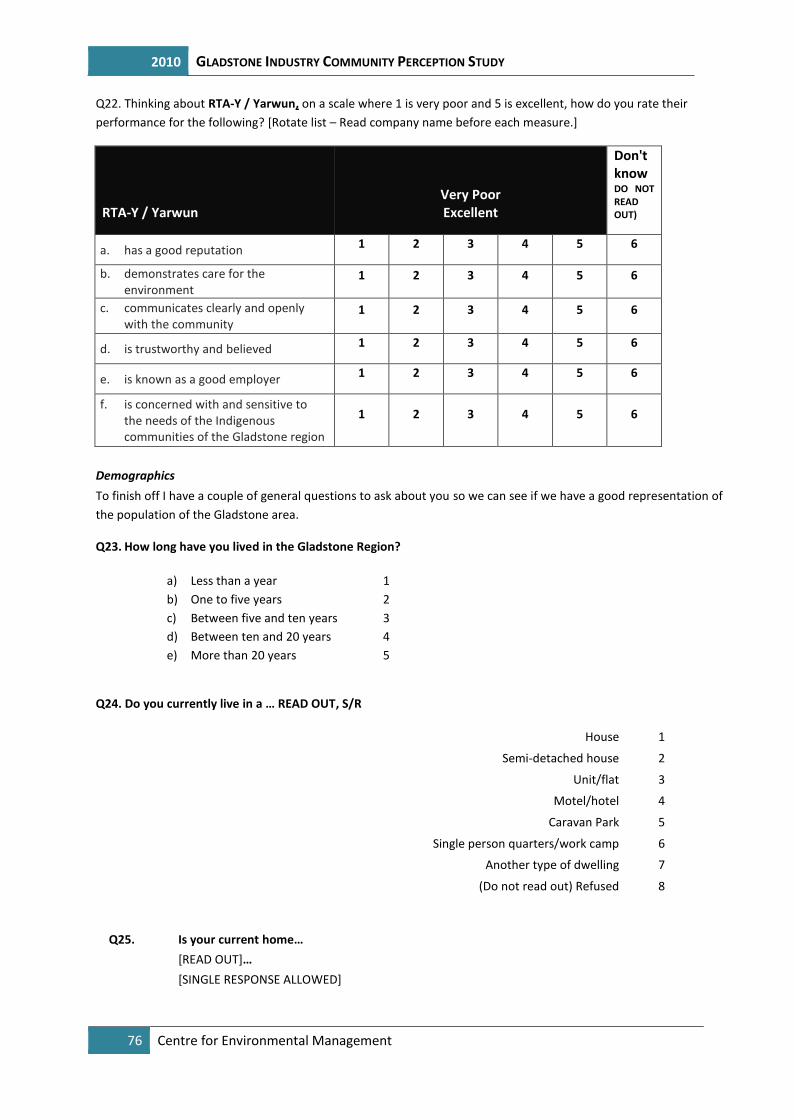
2010 GLADSTONE INDUSTRY COMMUNITY PERCEPTION STUDY
76 Centre for Environmental Management
Q22. Thinking about RTA-Y / Yarwun, on a scale where 1 is very poor and 5 is excellent, how do you rate theirperformance for the following? [Rotate list – Read company name before each measure.]
RTA-Y / YarwunVery PoorExcellent
Don'tknowDO NOTREADOUT)
a. has a good reputation 1 2 3 4 5 6
b. demonstrates care for theenvironment
1 2 3 4 5 6
c. communicates clearly and openlywith the community
1 2 3 4 5 6
d. is trustworthy and believed 1 2 3 4 5 6
e. is known as a good employer 1 2 3 4 5 6
f. is concerned with and sensitive tothe needs of the Indigenouscommunities of the Gladstone region
1 2 3 4 5 6
DemographicsTo finish off I have a couple of general questions to ask about you so we can see if we have a good representation ofthe population of the Gladstone area.
Q23. How long have you lived in the Gladstone Region?
a) Less than a year 1b) One to five years 2c) Between five and ten years 3d) Between ten and 20 years 4e) More than 20 years 5
Q24. Do you currently live in a … READ OUT, S/R
House 1
Semi-detached house 2
Unit/flat 3
Motel/hotel 4
Caravan Park 5
Single person quarters/work camp 6
Another type of dwelling 7
(Do not read out) Refused 8
Q25. Is your current home…[READ OUT]…[SINGLE RESPONSE ALLOWED]
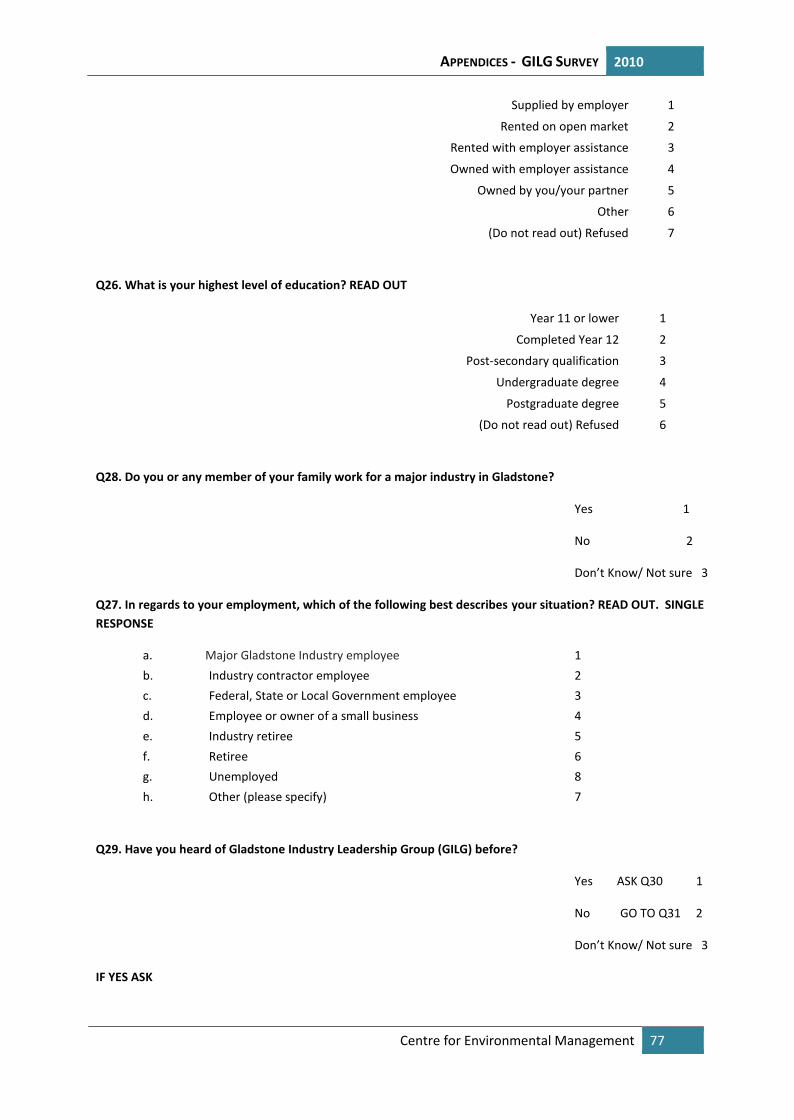
APPENDICES - GILG SURVEY 2010
Centre for Environmental Management 77
Supplied by employer 1
Rented on open market 2
Rented with employer assistance 3
Owned with employer assistance 4
Owned by you/your partner 5
Other 6
(Do not read out) Refused 7
Q26. What is your highest level of education? READ OUT
Year 11 or lower 1
Completed Year 12 2
Post-secondary qualification 3
Undergraduate degree 4
Postgraduate degree 5
(Do not read out) Refused 6
Q28. Do you or any member of your family work for a major industry in Gladstone?
Yes 1
No 2
Don’t Know/ Not sure 3
Q27. In regards to your employment, which of the following best describes your situation? READ OUT. SINGLERESPONSE
a. Major Gladstone Industry employee 1b. Industry contractor employee 2c. Federal, State or Local Government employee 3d. Employee or owner of a small business 4e. Industry retiree 5f. Retiree 6g. Unemployed 8h. Other (please specify) 7
Q29. Have you heard of Gladstone Industry Leadership Group (GILG) before?
Yes ASK Q30 1
No GO TO Q31 2
Don’t Know/ Not sure 3
IF YES ASK
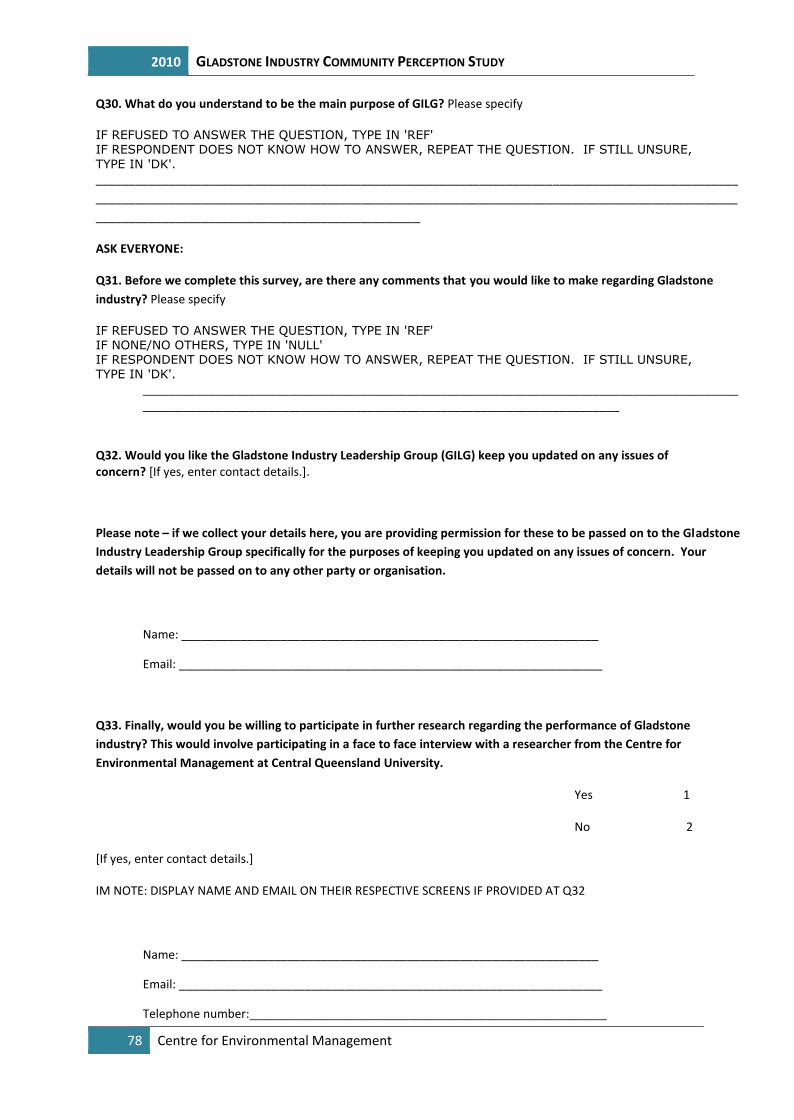
2010 GLADSTONE INDUSTRY COMMUNITY PERCEPTION STUDY
78 Centre for Environmental Management
Q30. What do you understand to be the main purpose of GILG? Please specify
IF REFUSED TO ANSWER THE QUESTION, TYPE IN 'REF'IF RESPONDENT DOES NOT KNOW HOW TO ANSWER, REPEAT THE QUESTION. IF STILL UNSURE,TYPE IN 'DK'.___________________________________________________________________________________________________________________________________________________________________________________________________________________________________________________
ASK EVERYONE:
Q31. Before we complete this survey, are there any comments that you would like to make regarding Gladstoneindustry? Please specify
IF REFUSED TO ANSWER THE QUESTION, TYPE IN 'REF'IF NONE/NO OTHERS, TYPE IN 'NULL'IF RESPONDENT DOES NOT KNOW HOW TO ANSWER, REPEAT THE QUESTION. IF STILL UNSURE,TYPE IN 'DK'.
__________________________________________________________________________________________________________________________________________________________________
Q32. Would you like the Gladstone Industry Leadership Group (GILG) keep you updated on any issues ofconcern? [If yes, enter contact details.].
Please note – if we collect your details here, you are providing permission for these to be passed on to the GladstoneIndustry Leadership Group specifically for the purposes of keeping you updated on any issues of concern. Yourdetails will not be passed on to any other party or organisation.
Name: _______________________________________________________________
Email: ________________________________________________________________
Q33. Finally, would you be willing to participate in further research regarding the performance of Gladstoneindustry? This would involve participating in a face to face interview with a researcher from the Centre forEnvironmental Management at Central Queensland University.
Yes 1
No 2
[If yes, enter contact details.]
IM NOTE: DISPLAY NAME AND EMAIL ON THEIR RESPECTIVE SCREENS IF PROVIDED AT Q32
Name: _______________________________________________________________
Email: ________________________________________________________________
Telephone number:______________________________________________________
APPENDICES - GILG SURVEY 2010
Centre for Environmental Management 79
Thank-you for your time today.
IF ASKED: If you have any queries about Gladstone Industry Leadership Group, please contact:
Kurt Heidecker
CEO, Gladstone Industry Leadership Group
Phone: 0438 184 476
Email: [email protected]
CLOSE
ALL RESPONDENTS
Just to remind you my name is.... from National Field Services. Could I please have your name so that we can re-contact you if necessary as part of our quality control to validate that this interview actually took place?
Yes 1
No 2IF YES TO RECONTACT
May I please have your NAME? RECORD NAME. IF ALREADY PROVIDED AT Q32 OR Q33, DISPLAY ON SCREEN FORPURPOSES OF CONFIRMING
NAME:
Once the validation period has finished, please be assured that your name and contact details will be removed fromyour responses to this survey. After that time we will no longer be able to identify the responses provided by you.However, for the period that your name and contact details remain with your survey responses, which will beapproximately 3 months, you will be able to contact us and to request you have access to your information
IF YES TO RECONTACT
Can I just confirm that I have dialed the correct phone number: [PHONE NUMBER]
Number is CORRECT 1
Number is WRONG 2IF WRONG TO DIALED NUMBER
Please can I have the correct telephone number to re-contact you on?
INTERVIEWER: RECORD NUMBER WITH AREA CODE, NO SPACES OR DASHES & LEADING ZERO
PHONE NUMBER: ________________________
ALL RESPONDENTS
As this is market research, it is carried out in compliance with the Privacy Act. The information you providedwill be used only for research purposes. As mentioned earlier this research was conducted on behalf ofCentral Queensland University.
2010 GLADSTONE INDUSTRY COMMUNITY PERCEPTION STUDY
80 Centre for Environmental Management
THAT'S THE END OF THE INTERVIEW, THANK YOU VERY MUCH FOR YOUR HELP.
PLEASE BE ASSURED THIS IS GENUINE MARKET RESEARCH.
IF YOU HAVE ANY QUERIES, YOU CAN CALL MY SUPERVISOR ON (02) 9304-4324 OR CALL THE MARKETRESEARCH SOCIETY'S SURVEY LINE ON 1300 364 830
INTERVIEWER I certify this is a true, accurate and complete interview, conducted in accordance with IQCAstandards and the ICC/ESOMAR code of conduct. I also agree to hold in confidence and not disclose to any
other person the content of this questionnaire or any other information relating to this project.
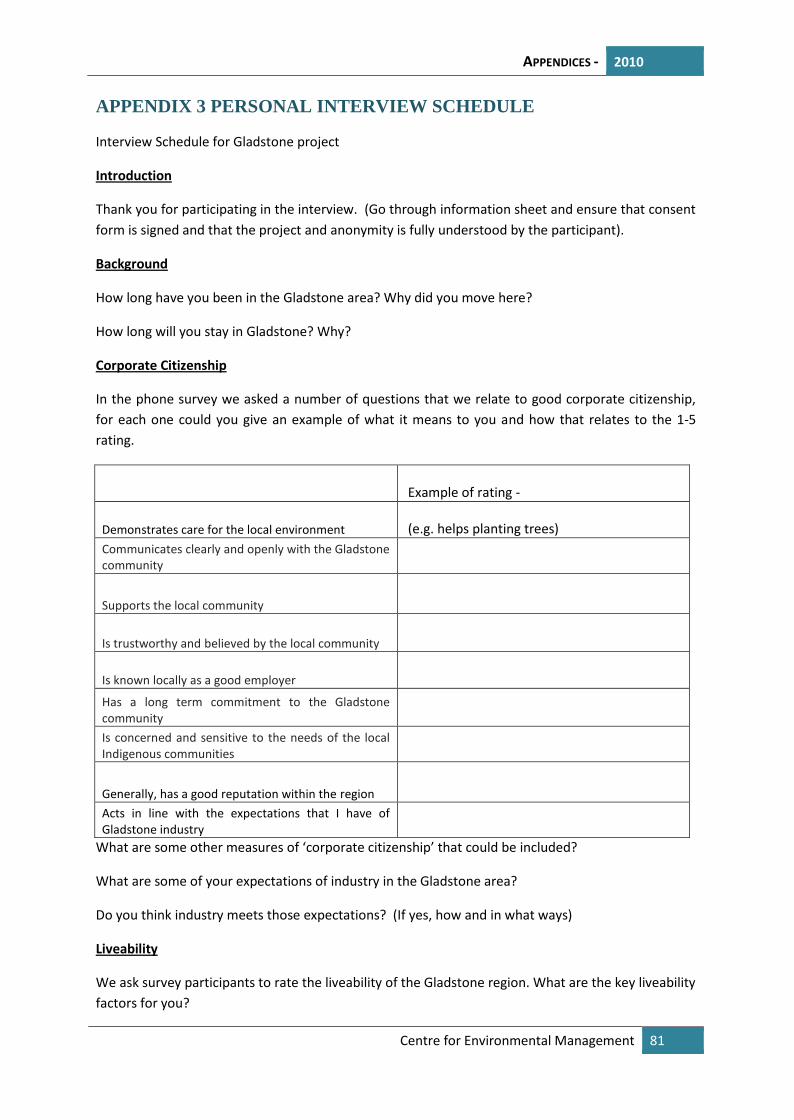
APPENDICES - 2010
Centre for Environmental Management 81
APPENDIX 3 PERSONAL INTERVIEW SCHEDULE
Interview Schedule for Gladstone project
Introduction
Thank you for participating in the interview. (Go through information sheet and ensure that consentform is signed and that the project and anonymity is fully understood by the participant).
Background
How long have you been in the Gladstone area? Why did you move here?
How long will you stay in Gladstone? Why?
Corporate Citizenship
In the phone survey we asked a number of questions that we relate to good corporate citizenship,for each one could you give an example of what it means to you and how that relates to the 1-5rating.
Example of rating -
Demonstrates care for the local environment (e.g. helps planting trees)Communicates clearly and openly with the Gladstonecommunity
Supports the local community
Is trustworthy and believed by the local community
Is known locally as a good employer
Has a long term commitment to the GladstonecommunityIs concerned and sensitive to the needs of the localIndigenous communities
Generally, has a good reputation within the regionActs in line with the expectations that I have ofGladstone industry
What are some other measures of ‘corporate citizenship’ that could be included?
What are some of your expectations of industry in the Gladstone area?
Do you think industry meets those expectations? (If yes, how and in what ways)
Liveability
We ask survey participants to rate the liveability of the Gladstone region. What are the key liveabilityfactors for you?
2010 GLADSTONE INDUSTRY COMMUNITY PERCEPTION STUDY
82 Centre for Environmental Management
Do you think that more industry (like the new gas project) will impact on the liveability of Gladstone?
If so, how do you see that it would impact? (Are there any specific issues that you are worriedabout)
Will you benefit personally from more industrial development?
Health – Environment and People
Do you have any specific health related concerns that are linked to the performance of Gladstoneindustry?
Does Gladstone industry change the way you do things? For example do you avoid certain activitiesbecause of industrial emissions like dust, noise, odour.
Are you concerned about any particular industries in the Gladstone area? What are these concerns?
What are your thoughts on more industrial development in the Gladstone region?
APPENDICES - 2010
Centre for Environmental Management 83
GLADSTONE INDUSTRY COMMUNITY PERCEPTION STUDY
INFORMATION for PARTICIPANTS
What is this research all about?The core focus of this research study is to improve the performance of Gladstone industry. The studyhas involved the collection of data through a telephone survey which looked at the priority issues forthe Gladstone community, the corporate citizenship performance of Gladstone industry and waysthat it can be improved.
Who can participate and what you will be asked to do?
To gain information to assist in a better understanding of community perceptions of Gladstoneindustry performance we are conducting face to face interviews with a selection of the surveyparticipants. Your assistance with this study is greatly appreciated.
During the interview (approx. 1 hour) you will be asked to provide your opinion regarding how youperceive the performance of industry in Gladstone in relation to corporate citizenship, the liveabilityof the region and health related issues.
How will the information I provide be used?
The information gathered from interviews will provide Gladstone industry with perceptive feedbackon its performance in the Gladstone community and offer a mechanism for improvement.
What are my rights?
You are free to withdraw from participating at any time. This means you can withdraw permissionfor the information you have given to be used, even after completing the interview. Your input isanonymous and all answers will be kept strictly confidential. The data gained from this researchproject will be stored for 5 years in accordance with the Code of Conduct for CQUniversity, Australia.
Who do I contact for more information?
For more information about this research project please contact: Mr Lindsay Greer, Ph: 49232373 oremail [email protected]
Alternately you can contact CQUniversity Human Research Ethics Committee on 07 49232607.
2010 GLADSTONE INDUSTRY COMMUNITY PERCEPTION STUDY
84 Centre for Environmental Management
PARTICIPANT CONSENT FORM
GLADSTONE INDUSTRY COMMUNITY PERCEPTION STUDY
I____________________________________________________________________________________________
Have read and understood the information sheet provided and have had any queries answered tomy satisfaction.
I understand I may freely withdraw from participating in this study at any time.
I give consent for the information that I will give in the survey/interview to be recorded andpublished as part of this study, on the understanding that:
Access to information recorded will be limited; and The anonymity of participants will be maintained at all times
Signed __________________________________
Date ______________________________________
GLADSTONE INDUSTRY COMMUNITY PERCEPTION STUDY
I would like to receive a copy of the summary of research results when available.
Name:Address: _____________________________________________________________________________________________Email:____________________________________________

2010
Centre for Environmental Management 85