Embed Size (px)
Citation preview
IACA SMT Committee Technology Chair: Matthew Harris, Crime Analyst, Sonoma County Sheriff's Office
IACA SMT Committee Technology Members:
Bryan Hill, Crime Analyst, Glendale Police Department Travis Taniguchi Ph.D., Senior Research Associate, Police Foundation
Subject Matter Experts:
Noah Fritz Ph.D., Crime Analysis Supervisor, San Diego County Sheriff's Office Wilpen Gorr Ph.D., Professor, Carnegie Mellon University James Lebeau Ph.D., Professor, Southern Illinois University Rebecca Paynich Ph.D., Professor, Curry College Joe Ryan, Crime Analysis Administrator, Jacksonville Sheriff's Office
Suggested Citation:
International Association of Crime Analysts. (2012). GIS Requirements for Crime Analysis (White Paper 2012-01). Overland Park, KS: Author.
International Association of Crime Analysts (IACA)
GIS Software Requirements for Crime Analysis Standards, Methods, & Technology (SMT) Committee White Paper 2012-01 June 2012
1
About the IACA Standards, Methods, and Technology Committee
Through the Standards, Methods, and Technology Committee (SMT), the International Association of Crime
Analysts (IACA) is committed to a continuing process of professionalization through standards and knowledge
development. In 2011, the IACA chartered the SMT Committee for the purpose of defining “analytical
methodologies, technologies, and core concepts relevant to the profession of crime analysis.”i This document
represents the first in a series of white papers produced by the SMT committee. The methodology for formulating
the positions reflected in the white paper series includes 1) development of a draft paper through in-depth
meetings and discussions of Subject Matter Expertsii, 2) review and feedback by the IACA Executive Board, 3)
review and feedback from an independent editor with knowledge of crime analysis, and 4) review and feedback by
IACA members facilitated through the IACA website (www.iaca.net). Any questions about this process can be
directed to the chair of the SMT Committee at [email protected].
Overview
As part of the efforts of the SMT committee of the IACA, this document has been prepared to address the
requirements of mapping software otherwise referred to as geographic information systems (GIS) as used by law
enforcement agencies for crime analysis. This document describes the current state of the art for GIS in crime
analysis, and outlines functionality that is required of GIS software used for crime analysis. The primary intended
use of this paper is to provide crime analysts, administrators, and other key decision-makers the fundamental
software requirements for successful GIS in crime analysis.
This document does not cover everything there is to know about GIS software or its uses, however it does explain
some of the key applications and functionality an analyst will need when entering this world of geographic
analysis. At the end of this paper, you will find a list of relevant literature covering these topics in detail and
throughout you will find endnotes that point you directly to key readings in those publications on specific topics.
We have also included a checklist that can be used as a starting point for evaluating GIS software (Appendix A).
Comprehensive mapping systems are complex and the theoretical, statistical and practical assumptions that are
made while using GIS are intricate. Crime analysts need adequate training in several key areas in order to use it
effectively. GIS is among the largest application software packages in existence with many complex interfaces,
tools, and work flows for spatial data processing, map making, and statistical analysis. Application of GIS in any
business or government office is generally performed by professionals with specialized training. Many
organizations use GIS occasionally for special projects, but GIS for crime analysis must become part of the fabric
of police organizations. GIS, as a consistent and integrated piece of crime analysis and police operations, can be
employed to produce regular daily reports, analyze information for special projects or issues, or to evaluate needs
and assess results. Hence, GIS for police must be treated as a functional system, and not just a tool, that is fully
integrated with an agency’s mission and operations.
Recommendation 1, GIS training: Law Enforcement agencies wishing to make use of mapping software should
ensure that their crime analysts are provided adequate GIS and crime analysis training with regular updates as
technology changes. Crime analysts not only need to think about crime theory, they must also keep in mind user
requirements and skill level, good data processing practices, and basics of map making, among many other factors.
Municipal GIS departments, local schools and universities and the internet are good locations to look for cost

2
effective training programs. Importantly, when purchasing GIS software it is wise to invest in training from the
vendor to ensure analysts and executives have a clear understanding and expectation of system capabilities.
GIS for crime analysis has two identifiable sub categories: (1) data processing to obtain and prepare data, and (2)
crime mapping and analysis itself to produces maps and information for different audiences. Figure 1 shows this
typical framework for GIS software within a law enforcement agency.
Data Processing
An effective mapping system allows crime analysts to create permanent, standard map layersiii that are reused for
data processing, analysis, and mapping as well as dynamic map layers that are continuously updated as time
passes. Building and maintaining these map layers is a significant part of the workload of the crime analyst.
Process 1: Create and Maintain Map Layers
Process 1 includes building and maintaining the standard map layers (often called operational layers) that
represent a police jurisdiction’s important features used in producing crime maps, such as streets and patrol
district boundaries. The sources for these map layers generally come from data suppliers like federal government
agencies such as the US Census Bureau and US Geological Survey; and state and local government agencies, such
as engineering, zoning, and planning departments. Standard map layers may need to be transformed and
enhanced for use by law enforcement agencies. For example, police zones and patrol areas may need to be
created as aggregates of census tract boundary layers or digitized by tracing streets for boundaries, and the
boundary of the jurisdiction may need to be extracted from a county map layer of places or minor civil divisions.
As these boundaries change, the map layers will also need to be modified accordingly.
3
After the basemap for the crime analysis GIS is prepared and in use; there will be need for updates and additions.
For example, streets generally need editing over time to make corrections, add missing data (where new streets
were added for instance), and fix locations that do not get placed on the map (or geocode) correctly. Patrol zones
are occasionally redrawn as crime patterns change or police budgets are tightened. At some point, additional
features of a jurisdiction will be needed, such as boundaries and locations for zoning, census, and schools or
crime-prone locations such as bars, ATM machines, and check cashing businesses.
Recommendation 2, Geoprocessing, digitizing, and editing: Comprehensive GIS software needs to include
geoprocessing tools including extracting and clipping features from larger collections, merging map layers, editing
spatial and attribute features of map layers, heads-up digitizing using map layers such as streets for guidelines, and
aggregating areas to create larger areas. These tools are necessary to create and maintain map layers.
Occasionally analysts need to create new, unique data layers. It is currently difficult in GIS to create new data and
attributes. For example, when an analyst needs to add point locations with attributes to a map they need to (1)
create a new layer (2) add the layer to the map (3) start an edit session (allows the analyst to make a map layer) (4)
add the necessary fields to the attribute table (the data behind the layer) (5) add the points, lines or polygons to
the map (6) go into the table view to add the attributes (7) save the edit sessioniv.
Recommendation 3, Streamlined data creation steps: Ideally GIS software should have a data creation tool
and/or wizard that simplifies data creation steps. Crime Analysts work in tactical environments where they work with
data in real time leaving little room for cumbersome multi-step processes.
Process 2: Update Geocoded Files
An important and central feature of GIS for crime analysis is that new incident data flow continuously from
computer aided dispatch (CAD) and records management systems (RMS) into a crime analysis GIS. Handing such
data requires more than merely adding data to the map; it requires complex data processing tools and
procedures. The end results are master crime map layers that are the sole source for most crime mapping and
analysis. These master map layers are organizational assets that require standardization and documentation.
Additionally, the analyst must be able to store data about the data, called metadata (i.e.; when it was created, by
whom, it’s frequency of updates etc.).
Recommendation 4, Master map layers and aggregate data tables: The single sources of most crime mapping
and analysis should be master map layers for crime incident points and space and time series data and these layers
should be updated using good data management practices, and schedules. GIS software needs to allow for storage
and updating of metadata.
Data comes in a variety of formats such as DBF, CSV, and Excel tables as well as Open Database Connectivity
(ODBC) connections to data in Oracle, SQL, and MS Access tables. An analyst must be able to get data from a
table or ODBC connection to display within the GIS. GIS have several different possible formats for GIS data and
your data needs to be converted to a supported format. A requirement of getting data into a GIS format is
assigning geographic coordinates that identify where the data should be represented on the map.
A key component to mapping data involves understanding and defining map projectionsv. Essentially, map
projections are used to tell the computer where to place data from a spherical globe onto a flat map surface.
Further definition of projections and coordinate systems is outside the scope of this document and can be found
4
in our relevant literature. Crime analysts should seek additional information and training on this topic and need to
be able to create master map layers that have compatible coordinate systems and projections. Fortunately, most
GIS software allows the analyst to easily convert data to make it compatible with the other layers he/she is
working with.
Recommendation 5, Handling Map Projections: GIS software should be capable of handling data with various
projections within the same map document, systems should also be capable of recognizing separate map projections
and automatically rectify as layers are added to the map.
Geocodingvi is the critical and complex process of accurately placing crime incident locations, arrest locations, and
other locations of interest on maps. GIS uses a matching algorithm that allows for differences between addresses
entered into police records (source data) and addresses stored in basemap layers (reference data) that must be
matched. Rules are included that can be tuned for the degree of difference allowed between the source and the
reference data. Alias tables that allow place names (such as Miami International Airport) instead of street
addresses are often part of the geocoding processes as well as the use of street intersections as geocodable
locations. In addition to standard address locators, composite address locators allow for geocoding from multiple
sources such as streets, parcels, and buildings for improved accuracy.
Recommendation 6, Geocoding tools and address locators: GIS software should come with a geocoding tool that
guides the user through the geocoding process in a clear and concise process they should also support the creation
and editing of composite address locators.
It is often necessary to “clean” source address data before geocoding; for example, to replace “block-of locations”
with middle-of-the-block street addresses. During the geocoding process the crime analyst must determine the
level of accuracy necessary for their analysis, complete accuracy is ideal, but the time and effort needed to achieve
perfection (if possible) must be weighed against the benefit to the analysis.
Recommendation 7, Data collection and accuracy: Agencies may need to establish policies for data entry, and
maintenance. Analysts need to be concerned about the accuracy of both the data being matched (calls, reports,
arrests, address info, etc.) and the data being matched on (streets, parcels, buildings, zip codes, etc.) For the highest
level of accuracy, address data should be audited for completeness and conformity to standards, and a feedback loop
established with line personnel.
Many modern RMS, CAD and other law enforcement data systems automatically geocode data and store the
coordinates within their database. Even if this is the case, the crime analyst may have to review the geocoded data
for accuracy on a regular basis to ensure that their analyses are accurate. The process of adding data to a map
that already has geographic coordinates is another example of a multi-step process with room for improvement in
many GIS software systems.
Recommendation 8, Geocoded data import: Point data imported into the GIS system that has already been
assigned spatial attributes (X/Y, Latitude/Longitude) should immediately have full functionality with a one step
import process. Current systems allow you to connect to data but restrict full GIS functionality until the user has
completed a multi-step process to convert to a GIS format.
As stated above, analysts are sometimes tasked with analyzing events that occur across multiple jurisdictions and
in these situations traditional methods of geocoding addresses through the use of local address locators can be
5
insufficient. In addition, users lacking underlying standard map layers outside their jurisdictional areas must spend
time attempting to locate the appropriate data and create a new address locatorvii
. Cloud based geocoding and
mapping services are emerging and may be sufficient to handle mapping external crime data.
Recommendation 9, Online resources: A comprehensive GIS should include access to online address locators,
allowing for matching beyond what locally stored GIS data can provide. Systems that facilitate access to online
repositories of data such as street networks, points of interest, or land use help analysts to focus on analysis and
move away from data hunting.
Besides point map layers for crime incidents, some maps need aggregate data, such as monthly crime counts by
patrol district used to produce choroplethviii
maps (depicting crime levels or changes through color shading). Such
data, “space and time series data,” need to be kept in master tables and created using the following typical work
flow: (1) geocode crime incident data, (2) join the geocoded crime incident data to the area map of interest (e.g.,
patrol districts) to assign area identifiers to crime points, (3) count the number of incidents per area in a table, (4)
and append the new space and time series data to the master table. Good GIS software packages come with tools
to allow analysts to build automation processes to perform these repetitive tasks for them.
Recommendation 10, Automation tools: GIS software must have a good macro-building facility. Processing data
from its source through to master map layers or tables is a very time consuming and error-prone process. Ideal
systems would include an enhanced automation building tool similar to the record tool that is available in MS Excel.
Process 3: Download and Process External Data
This process outlines working with additional data that has not already been discussed. An example could be
census tract data of populations in a police jurisdiction. An analyst may need to examine contextual factors related
to crime. For example, an analysis may show areas with low “human capital” that have high crime rates
(populations with low educational attainment, low income, high incidence of single-parent households, and so forth).
Another example is location and characteristics of public and private schools.
In addition, modern GIS must also be able to support a wide range of data that may not have existed a few years
ago. For crime analysts, these types of data might include automatic vehicle locator (AVL) data, license plate
reader data (LPR), or cell phone data. Availability of these data sources is becoming increasingly common in law
enforcement agencies yet tools to manage the data are often insufficient. Along with being capable and ready to
use these data in a GIS, the analyst and vendors should seek ways to automate the process and implementation of
this newly developed data.
Recommendation 11, Data import - Case studies or vendor developed tools: For certain data types (Cell phone,
LPR, AVL, GPS, etc.) there are relatively few companies as compared to the number of crime mapping professionals.
Software vendors, leading law enforcement organizations, associations, and academics should produce and make
available a set of case studies or tools for use throughout the crime mapping community. Crime analysts also need
knowledge and skills of the methods for obtaining data, data cleaning, and means of importing into the crime
analysis GIS as these resources can't cover every possible data source.

6
Crime Mapping and Analysis
Outputs of a GIS system are driven by user requirements. For example, field officers need up-to-date hot spot, or
pin maps of crimes in and near their patrol districts to get an integrated view of current crimes and crime patterns
(including crimes committed during their time not working-tactical level). Management need maps to aid in
decision making that allow for scanning the entire jurisdiction for emerging problems and then drilling down to
details for diagnosis and design of potential interventions (strategic or administrative level). All persons within the
agency may need reference maps, such as beat maps, street maps, justice court boundaries and the like
(administrative level). The base requirements and agency needs can be determined by reviewing best practices in
leading law enforcement agencies, reviewing the literature, and conducting requirement studies and research with
users.
Process 4: Produce Regular Maps
A number of different kinds of maps need to be produced periodically; for example, field officers’ pin maps or hot
spot maps are needed at the start of every shift if not on demand at any time with up-to-date data. Rather than
creating each map from scratch with an interactive GIS interface, such maps are often standardized and produced
with a high level of automation.
Crime maps need to follow the principals of good map making (cartographyix) and use state-of-art GIS tools.
Current systems have recently made this process much easier by allowing analysts to connect to online mapping
sources for base maps. These sources automatically eliminate many of the cartographic issues that analysts have
faced in the past. Using good design methods and processes as well as always keeping the audience for the map
foremost in their minds when creating maps, enables the message of the map to be presented to the user without
any confusion.
Recommendation 12, Cartographic principals and design tools: GIS Software should have tools that facilitate
producing maps with sound cartographic design and assist with color issues faced when printing (grey scale and
printer variationsx). Comprehensive GIS software should have resources, such as samples or tutorials, on proper
cartography. Crime analysts must have an understanding of cartographic principals and good map design.
A key component to cartography is display choices (symbolization and classification) made for each data layer
added to the map. These choices can be simple such as making parks green and water blue, or more complex
such as deciding what threshold level to declare a hot-spot. Symbolization and classification choices have a drastic
impact on how data is interpreted and each of these choices needs special attention especially when it comes to
crime data. Highlighted below are just a few of many issues that crime analysts face when it comes to displaying
data.
Graduated point mapsxi allow analysts to show the relative magnitude of problems at specific locations. This type
of aggregation is vital to crime mapping as typical point maps simply stack points on top of one another and hide
the fact that multiple incidents occurred at a single location. Current systems allow users to symbolize data with
graduated points but may drop the attribute data from the incidents or require multiple steps for the user.
Additionally, incidents are often represented by a single location, but in reality, may take place across many
discrete locations. For example, a traffic stop that becomes a failure to yield has numerous locations including the
location where the stop was first attempted, the route along which the pursuit occurred, and the location where
7
the vehicle was finally stopped. Current systems allow users to create linked points but may require multiple steps
or additional software to accomplish this.
Recommendation 13, Symbolization and classification: GIS software should have the capability to intuitively
display various data types with a wide variety of choices. Systems should provide users the ability to display
graduated point maps or a starburst pattern denoting multiple events in a single step process. Additionally systems
should be able to intuitively display data which occurred at multiple locations related to the same incident in a single
step process. A good symbology and classification tool is vitally important to crime mapping and should be evaluated
as such. It is highly recommended for crime analysts to review the relevant readings related to cartography to
understand how the choices they will need to make.
Analysts need a method of creating fast and efficient reports that are pleasing to the eye and provide the content
their audience needs. These reports can include ones that are highly customized, formatted and ready for
distribution, or data only reports based on attributes from map layers. Reports typically need to be replicated on a
regular basis or called when a subset of the data was selected or queried. Reporting tools vary among existing GIS
software packages from built in reporting tools to the ability to export, or link to an external reporting tool such as
Excel, Access, Crystal Reports, and many others.
Recommendation 14, GIS reporting tool: GIS software should include a reporting tool which allows the user to
create reports based on data within their GIS. These reports should then have the ability to be updated on demand or
as an automated tool. The ability to place the map of the geographic area in question on the face sheet of the report
automatically for automated emailing notification systems the like would be ideal.
With the knowledge that any system is unlikely to contain all the tools that an analyst may ever need, robust
systems should have a simple and intuitive method of exporting data. These exports should be available for both
spatial data as well as tabular data.
Recommendation 15, Data export formats: Systems should allow for the exported data to be saved in the
following file formats .mdb, .accdb, .xlsx, .xls, .dbf, .csv, .txt, .pdf, .kml, .xml as well as .shp, or other standard GIS
formats including geodatabase.
Process 5: Make Ad Hoc Queries/Maps
A number of information needs are not anticipated but are driven by ad hoc circumstances. Examples might be
maps that need to be created on a serial criminal to explain, understand or predict offending, and maps requested
by public officials or the media for a variety of purposes. The master crime incident layers and standard map layers
provide the capacity to quickly and accurately produce such maps.
Analysts frequently need to aggregate data by a given point, line, or polygon to understand problems unique to
that location. As the science of crime analysis evolves so do the methods for aggregating crime data; this section
discusses methods currently available in off the shelf GIS Software.
A typical procedure for data aggregation and choropleth mapping is to perform a spatial joinxii
of point data (calls,
reports, arrests, etc.) to polygons (beats, neighborhoods, census tracts, etc.) Essentially, a spatial join takes
information from one or more layers and appends it, or adds the count of data to another layer allowing the
analyst to perform a variety of analyses within the new “joined” layer. For example this tool allows crime analysts

8
to search for drug incidents that occurred at/or near schools and then join that data to the schools layer for
further analysis. Spatial queries are similar to spatial joins with the key difference being that queries are used for
retrieving data and not permanently creating a new map layer. Current industry standard systems handle these
task efficiently as they are typical tasks for GIS software.
Recommendation 16, Spatial join and spatial query tools: GIS software should have a tool to perform spatial
joins and queries with an acceptable workflow. These functions are some of the most important reasons for investing
in a GIS and should be evaluated as such.
Analysts frequently perform queries on the attribute tables of data. These queries generally use Structured Query
Language (SQL) to select and filter data. Systems that streamline this process allow the analyst to work quickly and
efficiently.
When connected to ODBC data sources, crime analysts are often required to build unique search queries to find
the data they need. A robust query tool within the GIS software is vital to crime analysis. Most systems are good at
handling data when presented in de-normalized form (i.e. single table data). These systems are not as good at
handling normalized data that are stored in relational databasesxiii
.
Recommendation 17, Complex query design tool: Many GIS software packages have graphical user interfaces for
building and running attribute queries, thereby relieving the crime analyst of writing SQL queries. Nevertheless,
crime analysts need to know some SQL skills such as using OR connectors to extract records for subsets of code
values, AND connectors for joint criteria, and wild card characters for extracting information using partial knowledge
of text values. Ideally systems should come with a query builder that has the ability to create complex SQL
statements including joins and unions similar to the MS Access query design tool.
Process 6: Conduct Advanced Analysis
More and more advanced tools are becoming available to crime analysts. Examples are time series analysis of
crime trends and seasonality, crime risk surface analysis (risk terrain modelingxiv
), cluster analysis for data mining,
hot spot methods including kernel density smoothing and significance testing, and crime detection and
forecasting methods. The focus of this document however is on the core GIS software and not extensions or
software used to perform many of these tasks. Advanced techniques that are typically performed by crime
analysts and should be expected of core software are covered in the paragraphs below.
Density surfaces are a method of generalizing point data into smoothed regions of higher and lower
concentrationsxv
. This is useful when the analyst wants his/her audience to focus on broader regions of activity
rather than specific incidents. Many current systems require that analysts use an additional software package to
create density surface layers.
Recommendation 18, Density surface functionality: Ideally density functionality should be a core GIS tool, not
requiring additional software or extensions. However, this is not the case with many GIS systems and analysts should
look to all available options for creating a density surface.
In a few cases the agency staff and the analyst may want to see how the data shifts temporally (based on time)
over a period of time. This can currently be accomplished in many GIS applications, but it is not always an easy
process without the aid of an additional vendor product. Temporal animationxvi
can reveal issues with crime

9
moving within the analysis area, and can show the degree of movement. It can also be used to measure diffusion
(benefit extends outward of a high crime targeted area) and displacement (crime moves outward from a high
crime targeted area) of crime.
Recommendation 19, Temporal animation: Systems should have the ability to display temporal data as a part of
an animated sequence of events. Systems should be evaluated on the ease with which animations can be performed
and integrated into the analyst’s workflow. Map animation should also be easily exported as any standard movie file
such as .avi, .mov, .mp4, etc.
Summary
The need for GIS analysis of data within a police department is varied and continues to grow as the field of crime
analysis grows and technology changes. Academic research into new methods for predicting or forecasting crime
continues to flourish and new procedures and insights are contributed to the field constantly. Additionally,
analysts are doing their own research or research in conjunction with grants with academic institutions, and the
future for GIS is bright.
Analysts need to maintain a high degree of skill to continue this research. Their goal should always be to provide
actionable knowledge to police command. The analyst needs to be well trained, be able to understand and edit
data, provide insight to policies and procedures to ensure data accuracy, and maintain accurate geocoding layers.
The analyst should know how to geocode addresses data, and automate geocoding and other processes to save
time and effort. The analyst must be able to work with a variety of external data, be able to learn and work with
new and advanced data types, and work toward improving their skills through review of academic research.
To that end, the optimal GIS software allows for analysts to conduct automated processing, basic and advanced
spatial analysis, produce a variety of maps for a variety of purposes (and audiences), and be user friendly in doing
all of this. GIS should not be viewed as just a tool, but should be an integrated component of an agency’s mission
and daily operations. Thus, GIS, should be able to connect with the data that already exists within an agency’s
records management system, and enhance the analysis capabilities that already exist. Additionally it should allow
analysts to reach out to other law enforcement agencies, government and private partners to enhance data
sharing for public safety.xvii

10
Relevant Literature
Boba, R. (2009). Crime Analysis with Crime Mapping, Vol 2. Sage: Los Angeles.
Chainey, S & Ratcliffe, J (2005). GIS and Crime Mapping, John Wiley & Sons Ltd., The Atrium, Southern Gate,
Chichester, West Sussex PO19 8SQ England
Eck, J, Chainey, S, Cameron, J, Leitner, M & Wilson (2005). Mapping Crime; Understanding Hotspots, National
Institute of Justice, NCJ 209393.
Gorr, W, Kurland, K (2012). GIS Tutorial for Crime Analysis, ESRI Press, Redlands CA 92373
Harries, K. (1999). Mapping Crime; Principles and Practice, National Institute of Justice, Gran No. 98-LB-VX-009,
NCJ 178919.
Hicks, S, Fritz, N, Bair, S & Helms, D (2008). Crime Mapping in Exploring Crime Analysis; readings on essential skills
(pp.283-308), International Association of Crime Analysts (IACA), Overland Park, KS 66212
Leipnik, M. R., & Albert, D. P. (2003). How law enforcement agencies can make geographic information
technologies work for them. In M. R. Leipnik & D. P. Albert (Eds.), GIS in law enforcement: Implementation issues
and case studies (pp. 3–8). New York: Taylor & Francis.
Paynich, R & Hill, B (2010). Fundamentals of Crime Mapping, Jones and Bartlett Publishers, Sudbury, MA 01776
i This quote comes from the mission statement as written in the Standards, Methods, and Technology Strategic Plan completed April 2011 ii Subject Matter Experts are identified by the Standards, Methods, and Technology Committee based on special knowledge
obtained through publications, presentations, and practical experience and their willingness to participate. iii Boba, R. (2009, chapter 6)
iv Many of these steps are vendor specific. Specific and detailed instructions can be obtained in formal training and a variety
of texts for each GIS software package. v Harries (1999 pp. 3-13) & Hicks, Fritz, Bair & Helms (2008 pp. 286-291)
vi Chainey & Ratcliffe (2005. pp 46-63)
vii Paynich & Hill 2010, pp. 77-82)
viii Eck, Chainey, Cameron, Leitner & Wilson (2005 pp. 35-40)
ix Harries (1999 pp. 3-13) & Gorr (2012 pp. 55-58)
x Each printer has a slightly different variation of color and one map produced on two separate printers can appear vastly
different. Analysts can adjust for this if the software allows them to print a color pallet. xi Paynich & Hill 2010, p. 375)
xii Paynich & Hill 2010, p.247-252.
xiii A database that maintains a set of separate, related files (tables), but combines data elements from the files for queries
and reports when required.(PC Magazine) xiv
See http://www.rutgerscps.org/rtm/ for more information. xv
Hicks, Fritz, Bair & Helms (2008 pp. 301-303) & Eck, Chainey, Cameron, Leitner & Wilson (2005 pp. 40-43) xvi
Gorr (2012 pp.107-108) xvii
Leipknick M. R. & Albert D. P (2003)

Appendix A
# GIS Evaluation Checklist Yes No
Vendor provides formal training
In person training
Multimedia - online training
System includes the following geoprocessing tools:
Extracting and clipping features
Merging map layers
Editing spatial and attribute features of map layers
Heads-up digitizing
Aggregating areas to create larger areas
3 System includes a data creation tool and/or wizard that simplifies data creation
steps
System has tool for data management and metadata compilation
System is capable of working with standard vector "point" layers
System is capable of working with standard vector "line" layers
System is capable of working with standard vector "polygon" layers
System is capable of working with aerial images, satellite images and other raster
data
5 System allows data with different geographic projections to be displayed on the
same map
System has a geocoding tool
System has a composite address locator
System has a online address locator
7 Vendor supplies documentation for the basic policies and procedures to ensuring
data accuracy
8 System allows import of data with XY coordinates with full functionality in a one
step process
9 System includes access to online repositories of reference data
System has macro-building, or easy to use programming process capabilities for
automating repetitive tasks
System includes a record tool similar to that available in MS Excel
Vendor provides case studies for importing advanced data types (as shown
below):
Cell Phone
GPS, AVL
LPR
XML,KML, KMZ
Other
1
11
10
2
6
4
Page 1 of 2
Appendix A
# GIS Evaluation Checklist Yes No
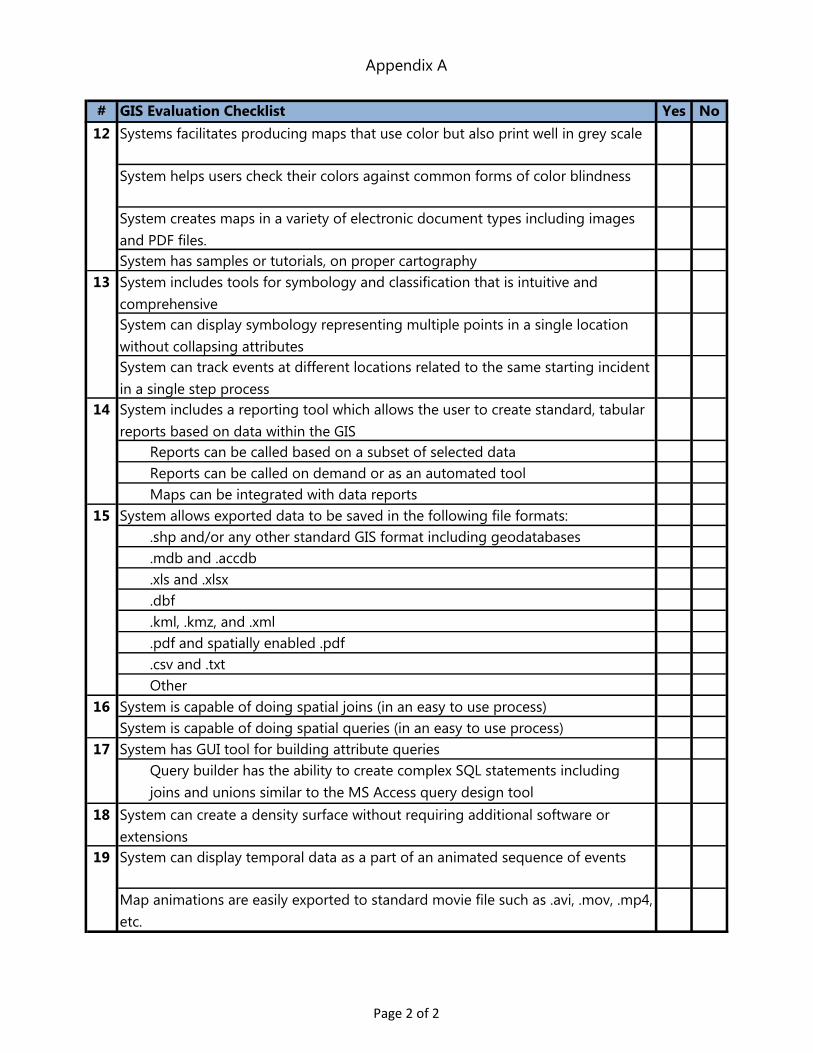
Systems facilitates producing maps that use color but also print well in grey scale
System helps users check their colors against common forms of color blindness
System creates maps in a variety of electronic document types including images
and PDF files.
System has samples or tutorials, on proper cartography
System includes tools for symbology and classification that is intuitive and
comprehensive
System can display symbology representing multiple points in a single location
without collapsing attributes
System can track events at different locations related to the same starting incident
in a single step process
System includes a reporting tool which allows the user to create standard, tabular
reports based on data within the GIS
Reports can be called based on a subset of selected data
Reports can be called on demand or as an automated tool
Maps can be integrated with data reports
System allows exported data to be saved in the following file formats:
.shp and/or any other standard GIS format including geodatabases
.mdb and .accdb
.xls and .xlsx
.dbf
.kml, .kmz, and .xml
.pdf and spatially enabled .pdf
.csv and .txt
Other
System is capable of doing spatial joins (in an easy to use process)
System is capable of doing spatial queries (in an easy to use process)
System has GUI tool for building attribute queries
Query builder has the ability to create complex SQL statements including
joins and unions similar to the MS Access query design tool
18 System can create a density surface without requiring additional software or
extensions
System can display temporal data as a part of an animated sequence of events
Map animations are easily exported to standard movie file such as .avi, .mov, .mp4,
etc.
19
16
17
12
14
15
13
Page 2 of 2


![A Descriptive Analysis of Serious Crime Trends from 1965 ...isps.yale.edu/sites/default/.../12/48yearsofcrime...Importantly, the present report [as of 9 December 2013] analyzes data](https://img.pdfslide.us/doc/110x75/5f1cd32fd7345a50cf038dbe/a-descriptive-analysis-of-serious-crime-trends-from-1965-ispsyaleedusitesdefault1248yearsofcrime.jpg)