Embed Size (px)
Citation preview
1
1
Lecture 06
Raster and Vector Data Models
Part (1)
2
Points
LineArea
Vector Raster
Points
LineArea
( x,y )
X
Y
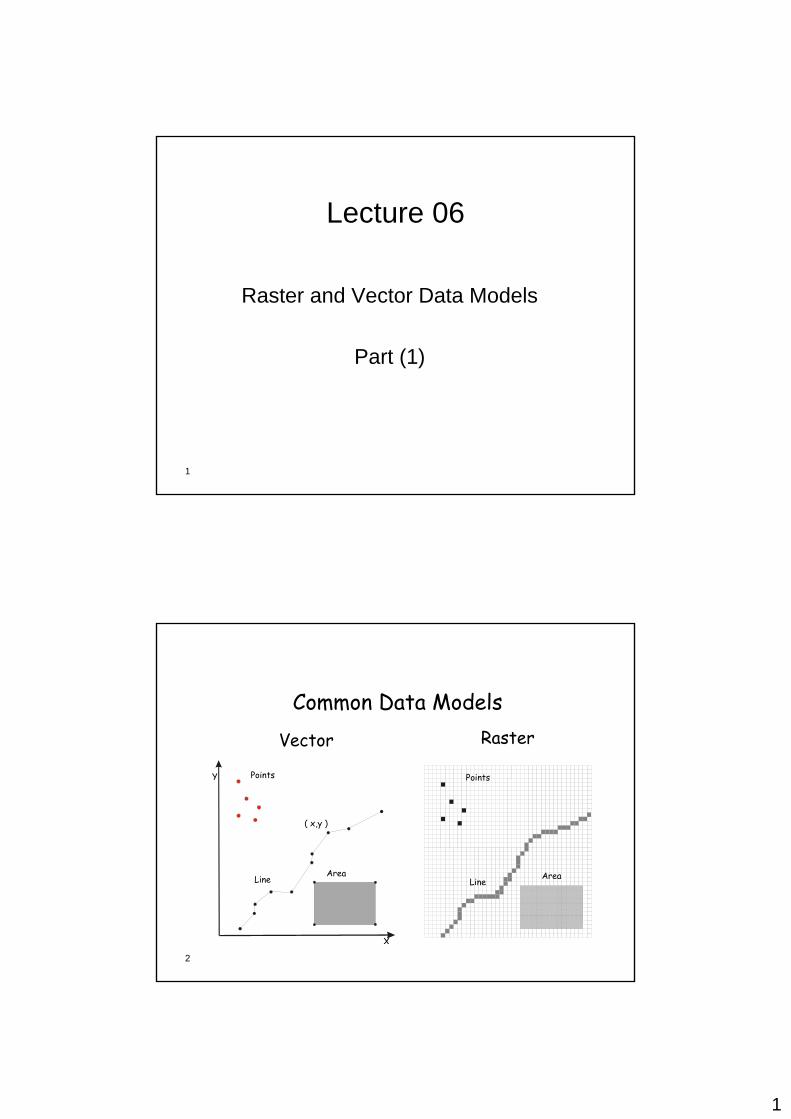
Common Data Models
2
3
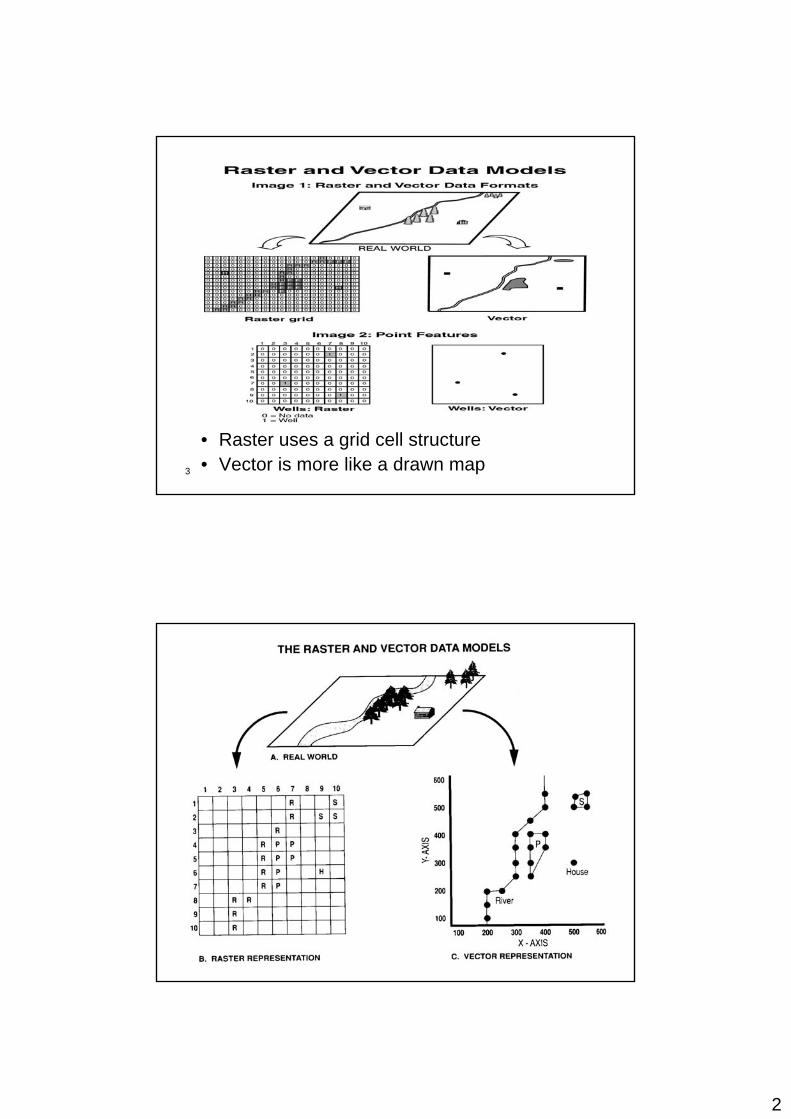
• Raster uses a grid cell structure• Vector is more like a drawn map
4
3
5
6
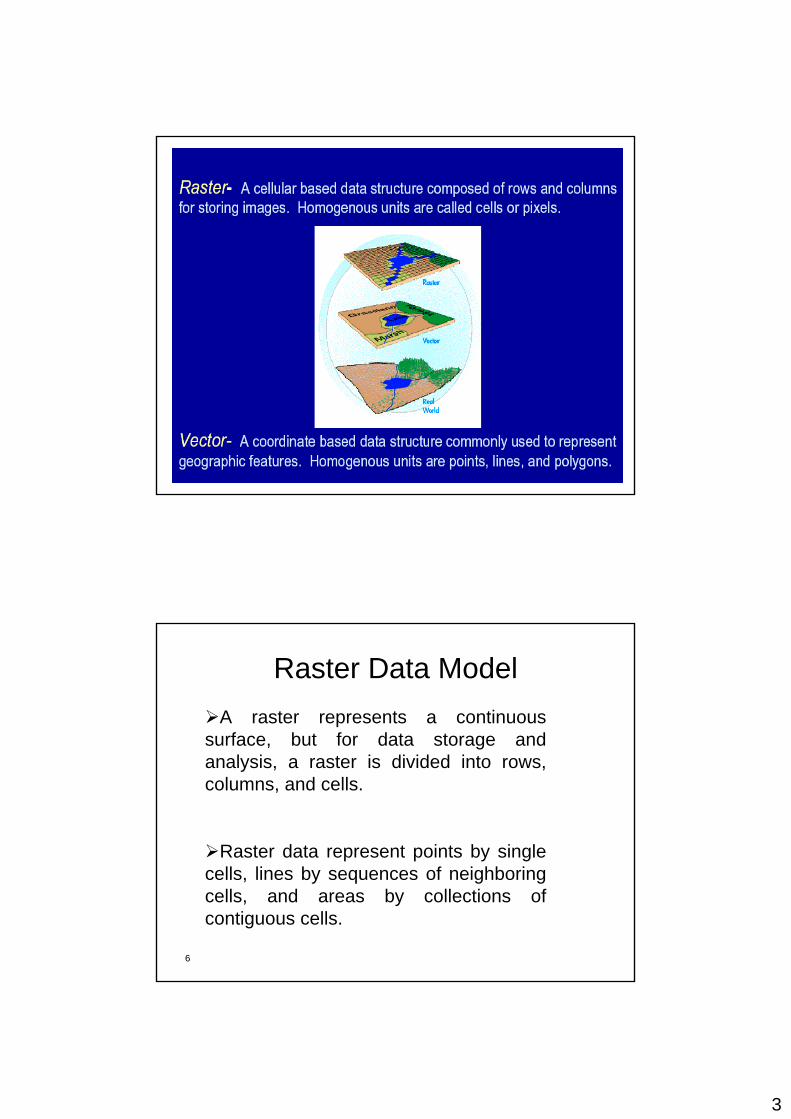
Raster Data ModelA raster represents a continuous
surface, but for data storage and analysis, a raster is divided into rows, columns, and cells.
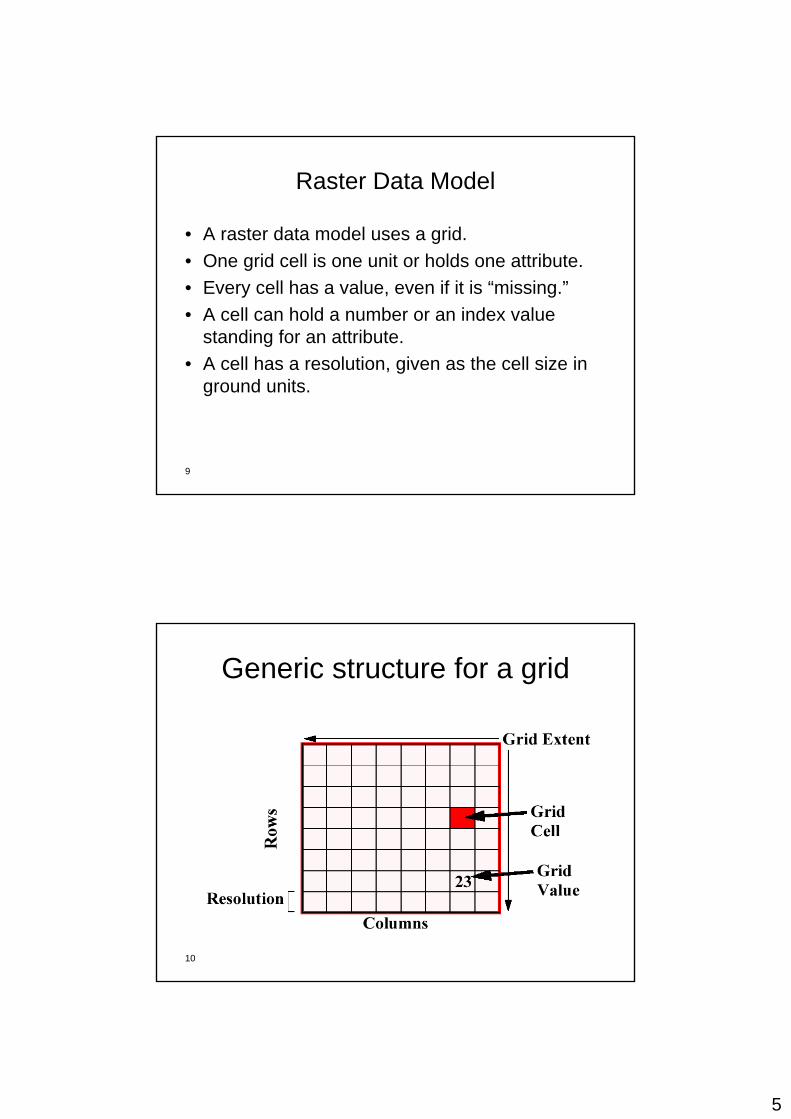
Raster data represent points by single cells, lines by sequences of neighboring cells, and areas by collections of contiguous cells.
4
7
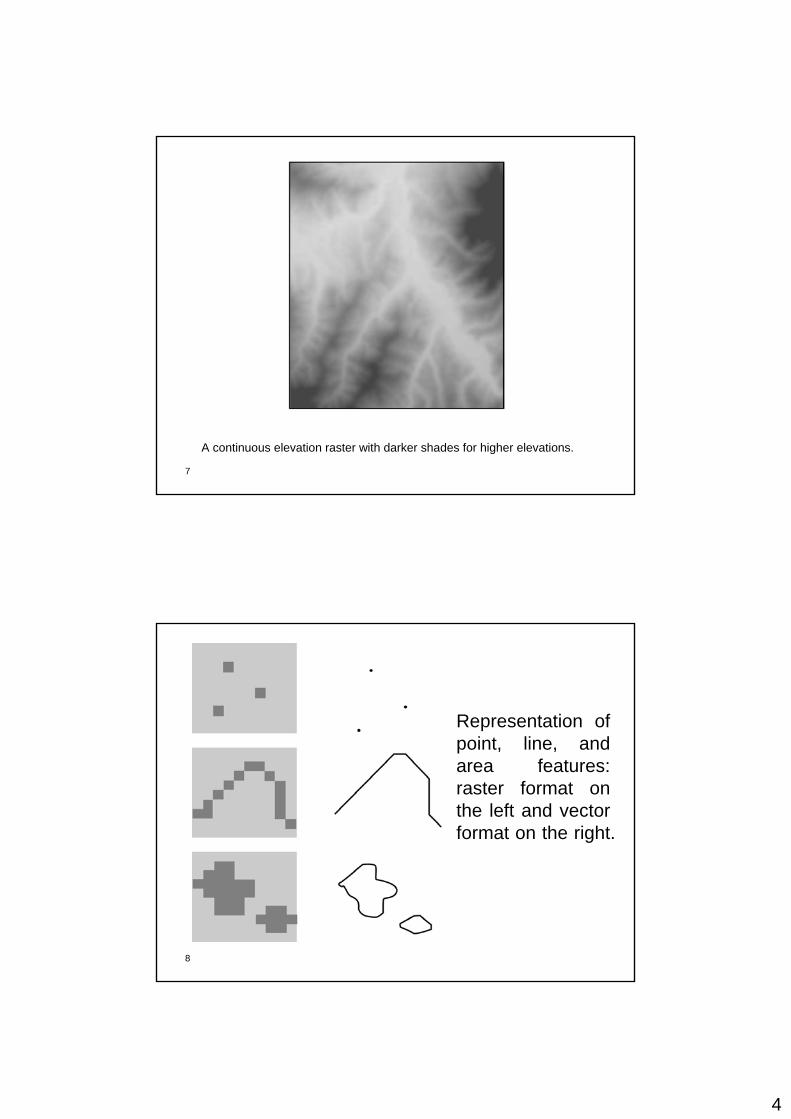
A continuous elevation raster with darker shades for higher elevations.
8
Representation of point, line, and area features: raster format on the left and vector format on the right.
5
9
Raster Data Model
• A raster data model uses a grid.• One grid cell is one unit or holds one attribute. • Every cell has a value, even if it is “missing.”• A cell can hold a number or an index value
standing for an attribute.• A cell has a resolution, given as the cell size in
ground units.
10
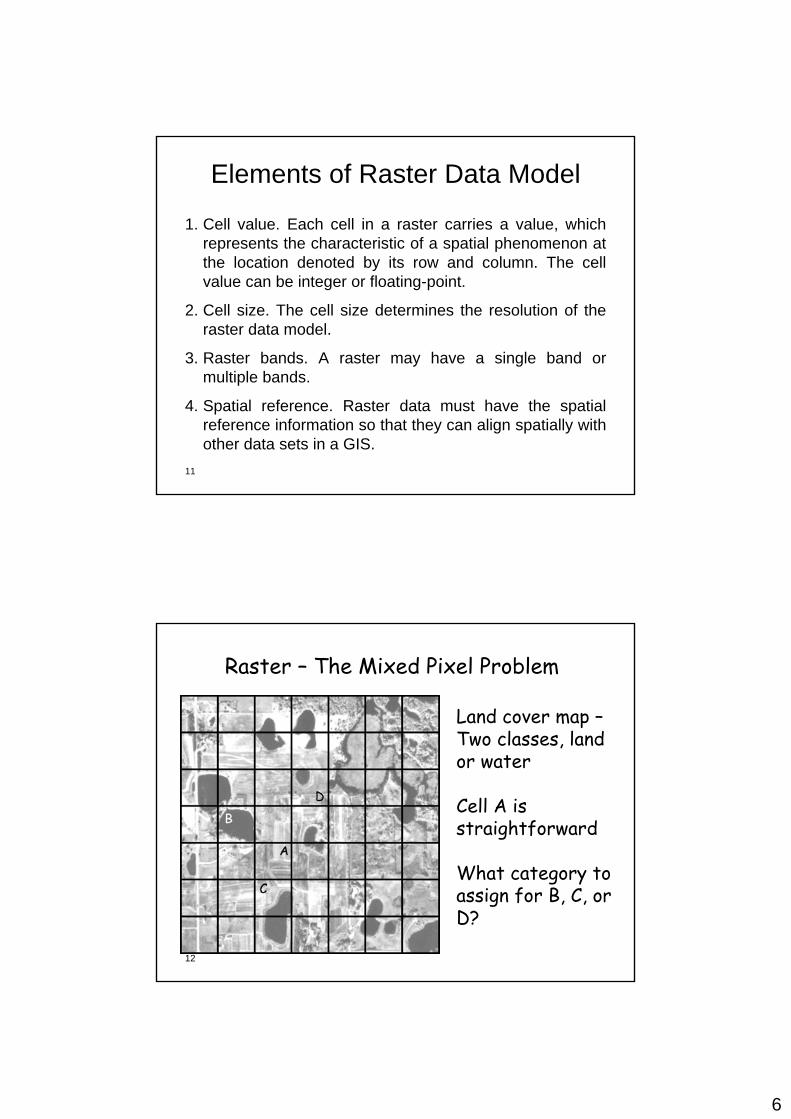
Generic structure for a grid
6
11
Elements of Raster Data Model
1. Cell value. Each cell in a raster carries a value, which represents the characteristic of a spatial phenomenon at the location denoted by its row and column. The cell value can be integer or floating-point.
2. Cell size. The cell size determines the resolution of the raster data model.
3. Raster bands. A raster may have a single band or multiple bands.
4. Spatial reference. Raster data must have the spatial reference information so that they can align spatially with other data sets in a GIS.
12
Raster – The Mixed Pixel Problem
Land cover map –Two classes, land or water
Cell A is straightforward
What category to assign for B, C, or D?
7
13
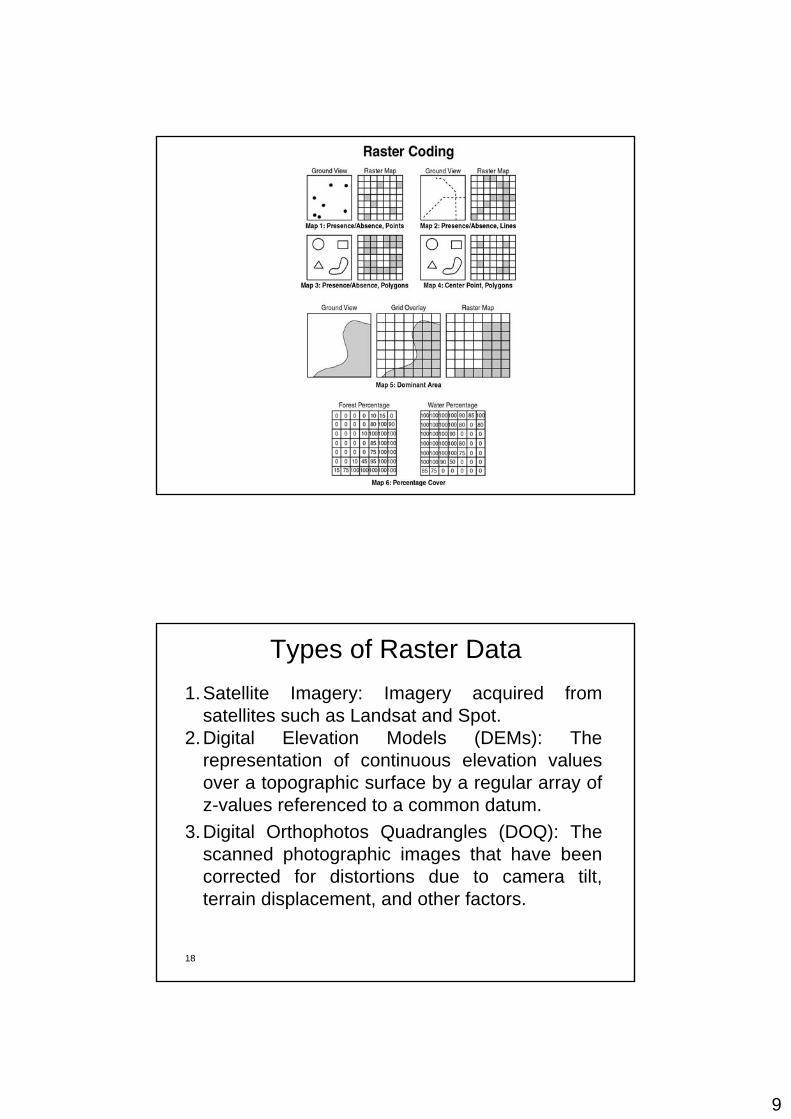
Raster Coding
In the data entry process, maps can be digitized or scanned at a selected cell size and each cell assigned a code or a value.The methods for assigning cell codes are:
1. Presence/Absence2. Cell Center3. Dominant Area4. Percent Coverage (advanced method)
14
Presence/Absence
The most basic method is to record a feature if some of it occurs in the cell space.
The only practical way of coding point and line features, because they don’t take up much area of a cell.
8
15
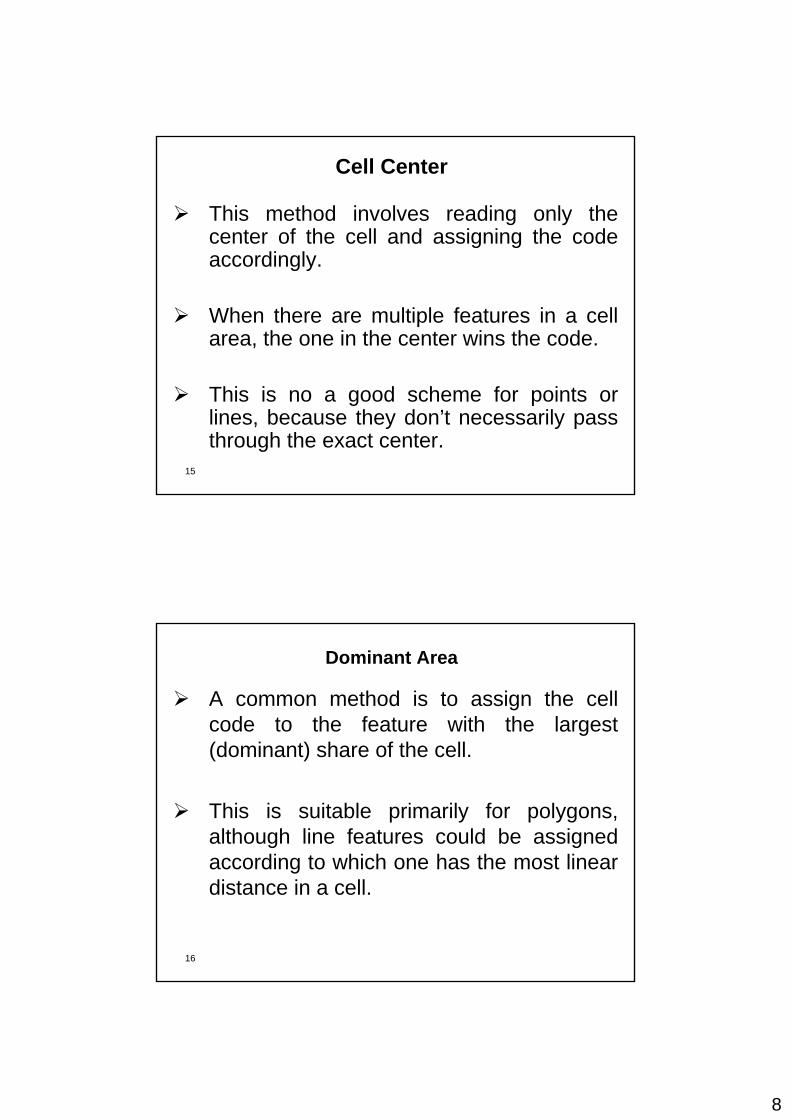
Cell Center
This method involves reading only the center of the cell and assigning the code accordingly.
When there are multiple features in a cell area, the one in the center wins the code.
This is no a good scheme for points or lines, because they don’t necessarily pass through the exact center.
16
Dominant Area
A common method is to assign the cell code to the feature with the largest (dominant) share of the cell.
This is suitable primarily for polygons, although line features could be assigned according to which one has the most linear distance in a cell.
9
17
18
Types of Raster Data1.Satellite Imagery: Imagery acquired from
satellites such as Landsat and Spot.2.Digital Elevation Models (DEMs): The
representation of continuous elevation values over a topographic surface by a regular array of z-values referenced to a common datum.
3.Digital Orthophotos Quadrangles (DOQ): The scanned photographic images that have been corrected for distortions due to camera tilt, terrain displacement, and other factors.
10
19
Types of Raster Data (continued)
4. Bi-Level Scanned Files: The scanned images containing values of 1 and 0, they are usually scanned from paper maps.
5. Digital Raster Graphics (DRGs): The scanned images of USGS topographic maps.
6. Graphic Files: Maps, photographs, and images can be stored as raster graphic files such as TIFF (tagged image file format), GIDF( graphics interchange format), and JPEG( joint photographic expert group).
20
Types of Raster Data (continued)
7. GIS Software-Specific Raster Data: GIS packages use raster data that are imported from DEMs, satellite images, scanned images, graphic files, and ASCII files or are converted from vector data. The GIS software packages store raster data in different formats, for example, ArcGIS stores raster data in the ESRI Grid format.
11
21
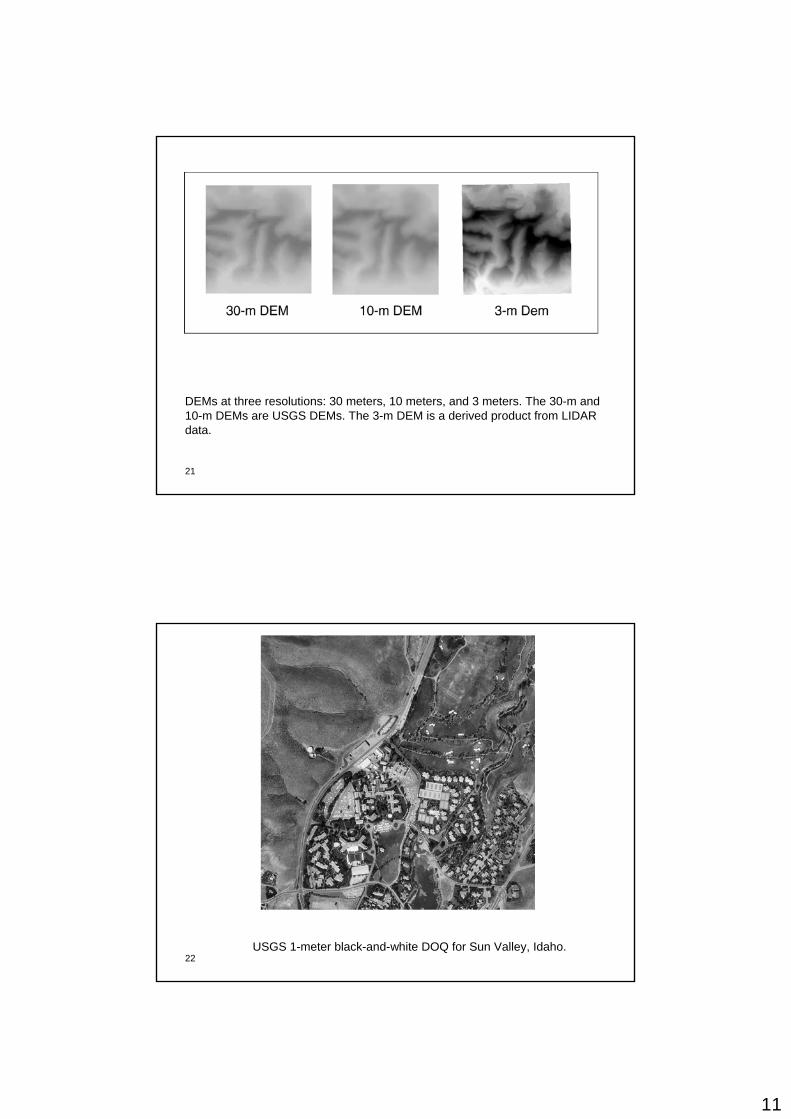
DEMs at three resolutions: 30 meters, 10 meters, and 3 meters. The 30-m and 10-m DEMs are USGS DEMs. The 3-m DEM is a derived product from LIDAR data.
22USGS 1-meter black-and-white DOQ for Sun Valley, Idaho.
12
23
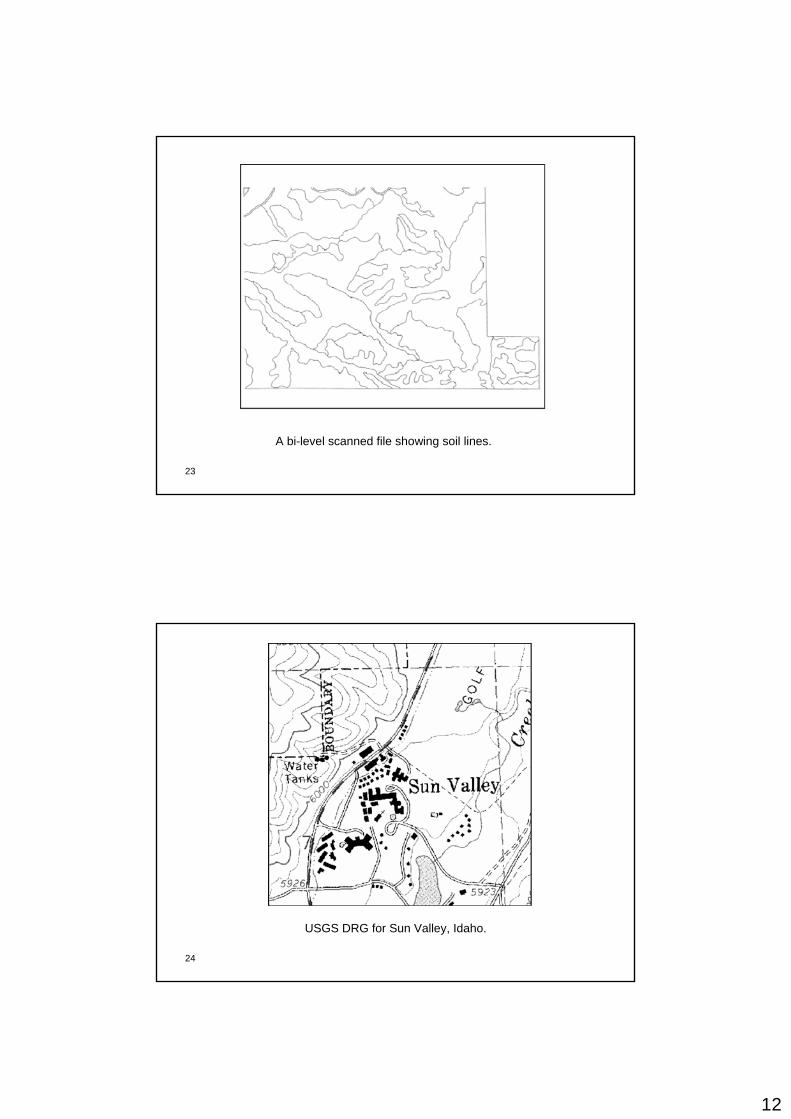
A bi-level scanned file showing soil lines.
24
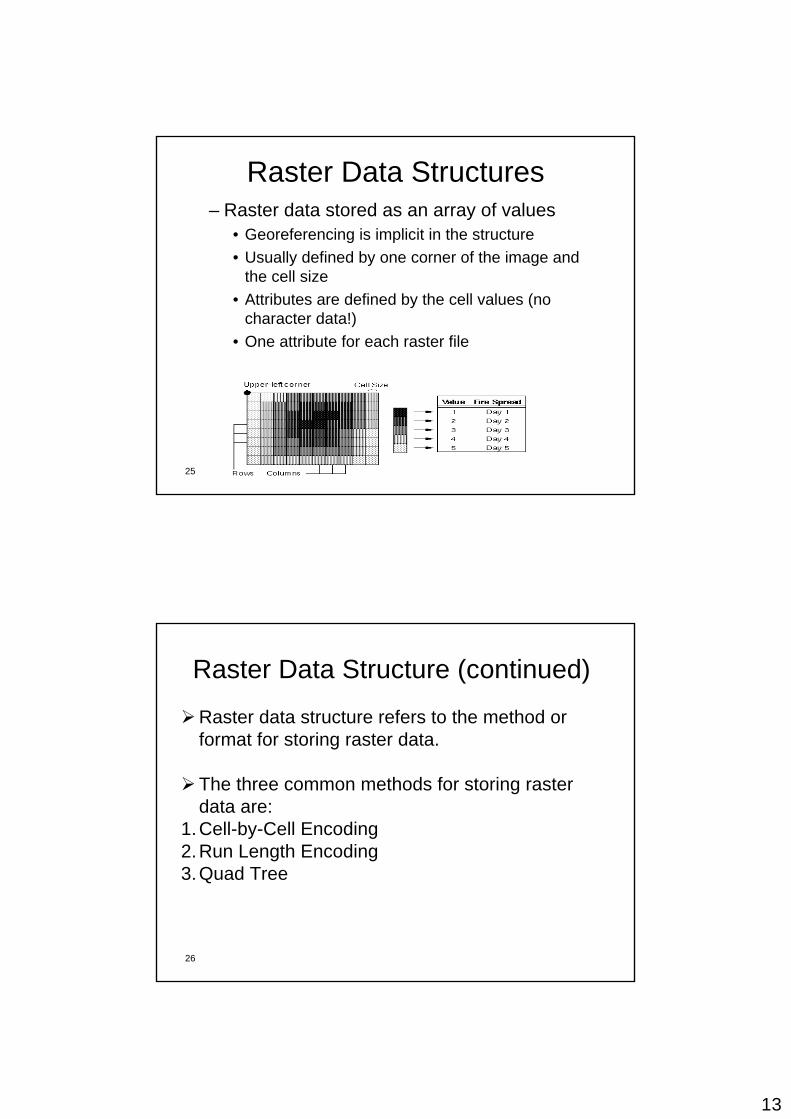
USGS DRG for Sun Valley, Idaho.
13
25
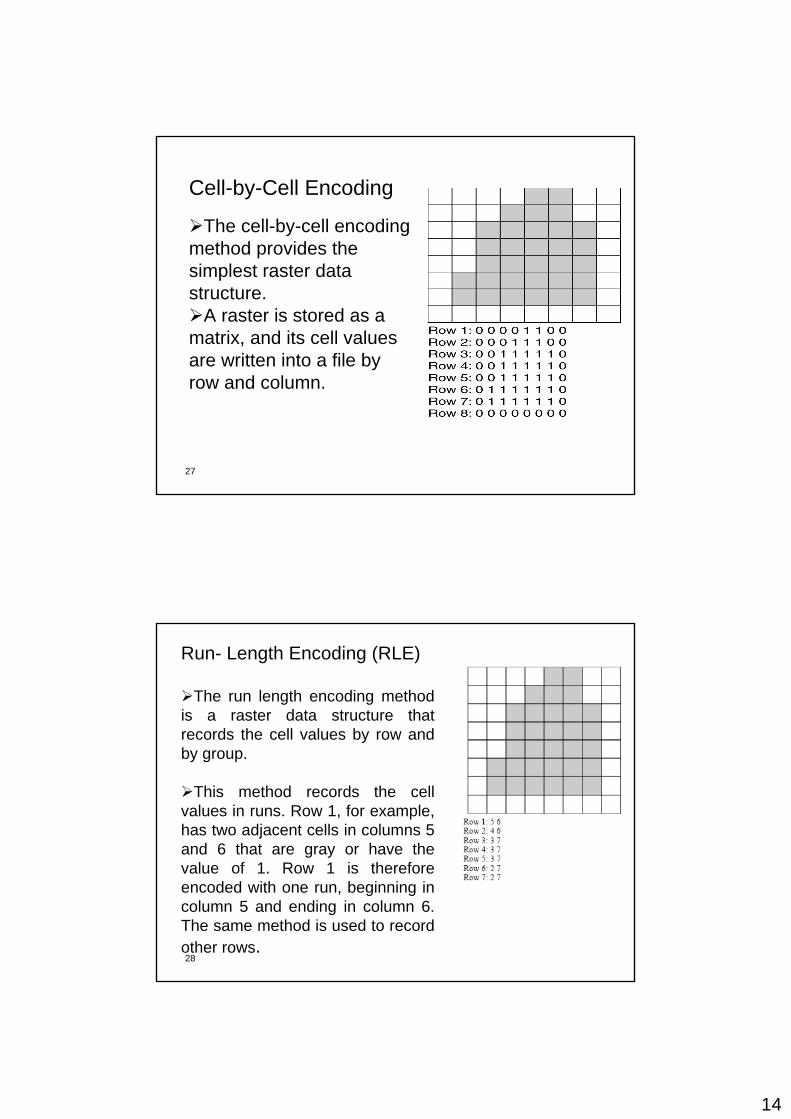
Raster Data Structures– Raster data stored as an array of values
• Georeferencing is implicit in the structure• Usually defined by one corner of the image and
the cell size• Attributes are defined by the cell values (no
character data!)• One attribute for each raster file
26
Raster Data Structure (continued)
Raster data structure refers to the method or format for storing raster data.
The three common methods for storing raster data are:
1.Cell-by-Cell Encoding2.Run Length Encoding3.Quad Tree
14
27
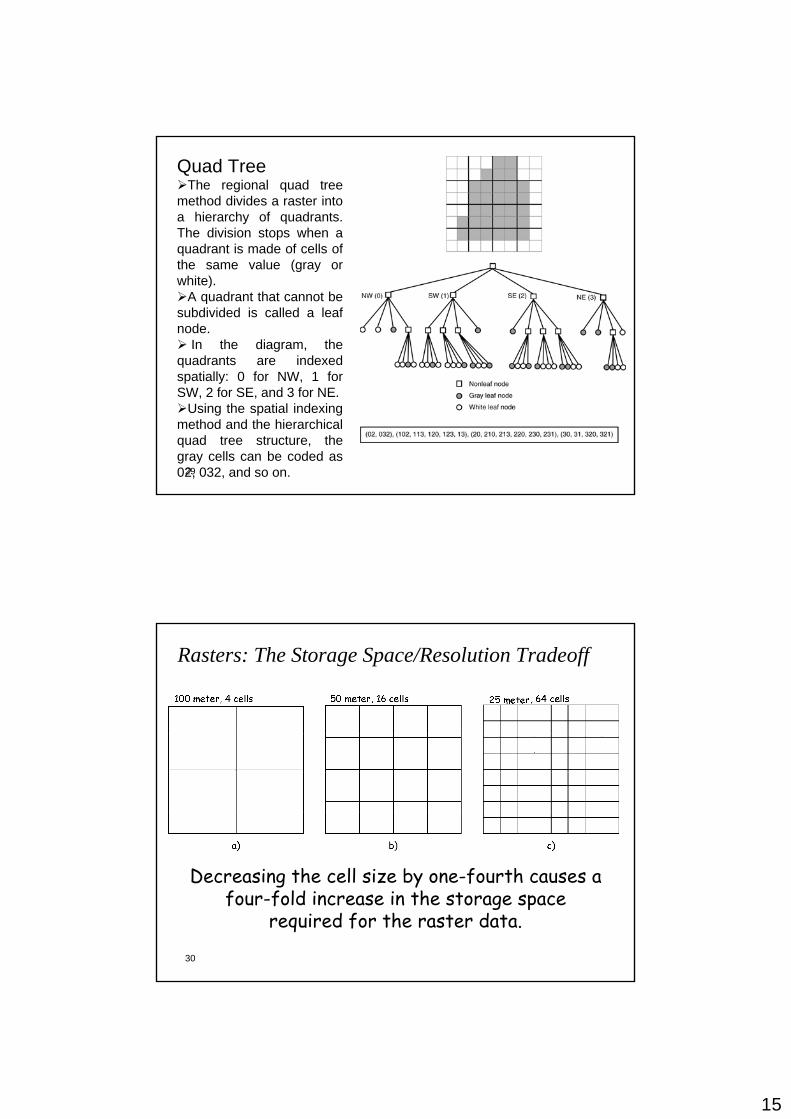
Cell-by-Cell Encoding
The cell-by-cell encoding method provides the simplest raster data structure.
A raster is stored as a matrix, and its cell values are written into a file by row and column.
28
Run- Length Encoding (RLE)
The run length encoding method is a raster data structure that records the cell values by row and by group.
This method records the cell values in runs. Row 1, for example, has two adjacent cells in columns 5 and 6 that are gray or have the value of 1. Row 1 is therefore encoded with one run, beginning in column 5 and ending in column 6. The same method is used to record other rows.
15
29
Quad TreeThe regional quad tree
method divides a raster into a hierarchy of quadrants. The division stops when a quadrant is made of cells of the same value (gray or white).
A quadrant that cannot be subdivided is called a leaf node.
In the diagram, the quadrants are indexed spatially: 0 for NW, 1 for SW, 2 for SE, and 3 for NE.
Using the spatial indexing method and the hierarchical quad tree structure, the gray cells can be coded as 02, 032, and so on.
30
Rasters: The Storage Space/Resolution Tradeoff
Decreasing the cell size by one-fourth causes a four-fold increase in the storage space
required for the raster data.
16
31
Raster Data CompressionData compression refers to the reduction of data
volume.
A variety of techniques are available for image compression. Compression techniques can be lossless or lossy.
Lossless Compression: One type of data compression that allows the original image to be precisely reconstructed.
Lossy Compression: One type of data compression that can achieve high compression ratios but cannot reconstruct fully the original image .
32
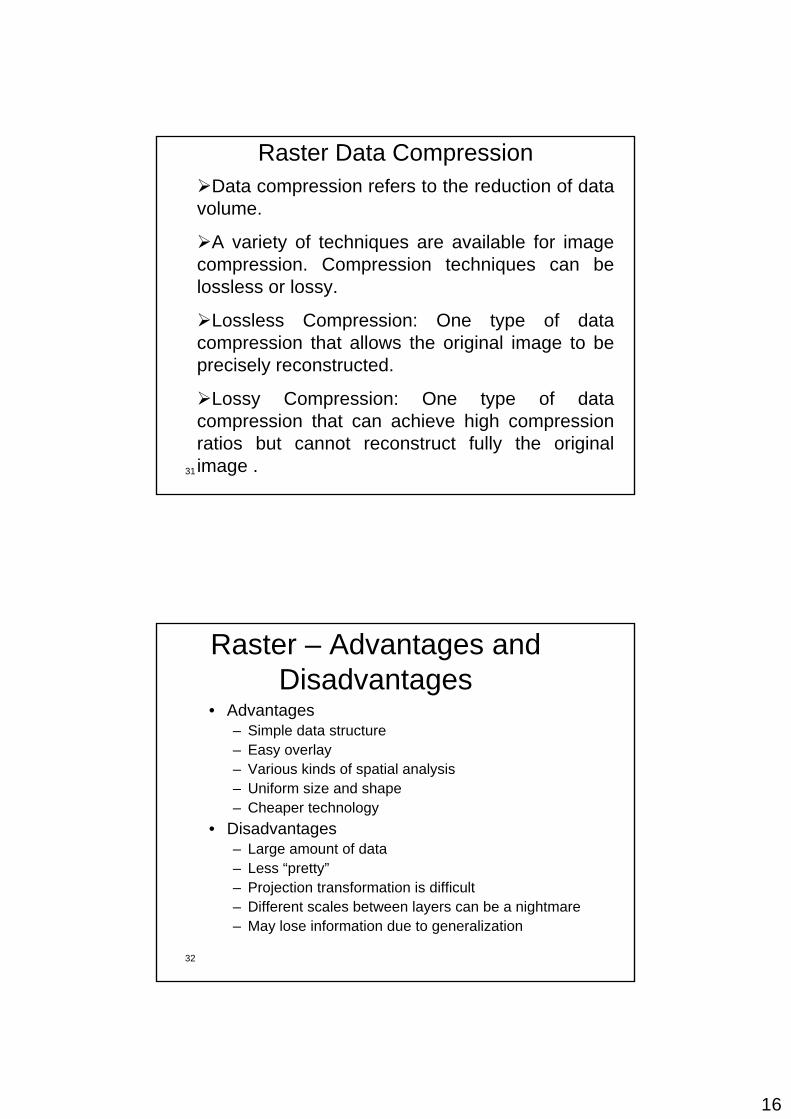
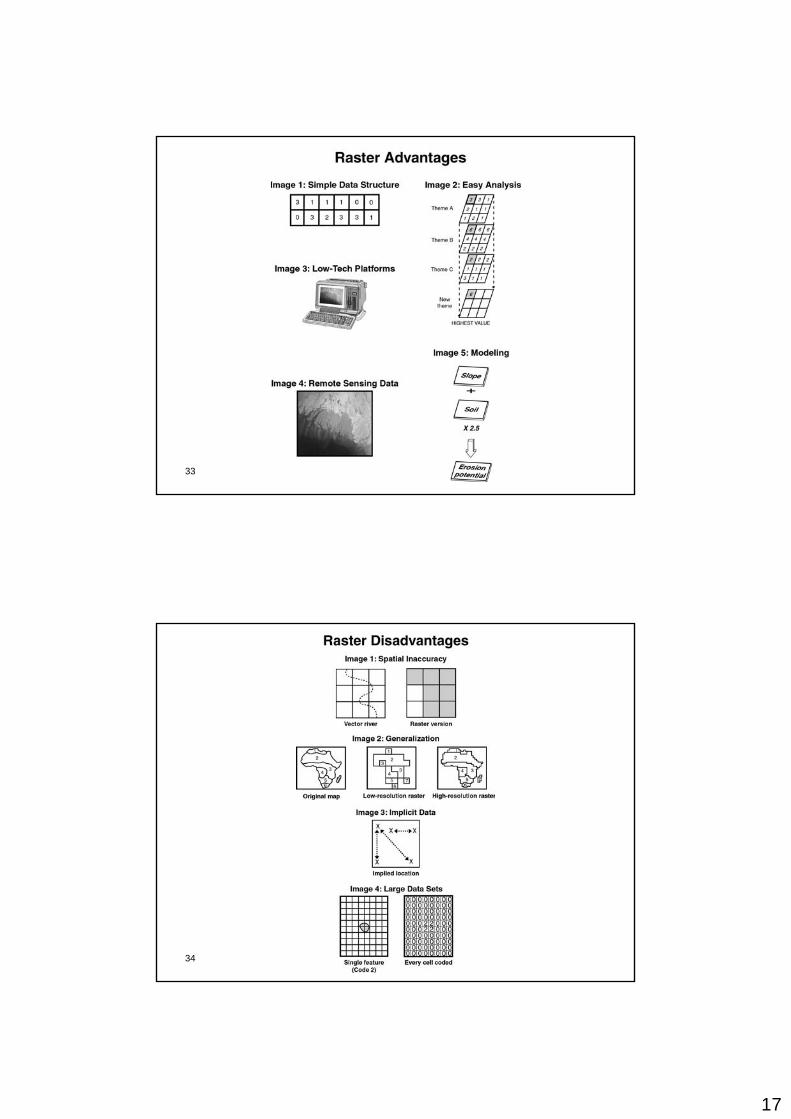
Raster – Advantages and Disadvantages
• Advantages– Simple data structure– Easy overlay– Various kinds of spatial analysis– Uniform size and shape– Cheaper technology
• Disadvantages– Large amount of data– Less “pretty”– Projection transformation is difficult– Different scales between layers can be a nightmare– May lose information due to generalization
17
33
34