Embed Size (px)
DESCRIPTION
This is the final turn-in for my final project in GIS for International Crises, Development, and the Environment – Fall 2013.
Citation preview

MAPPING NEED FOR PRESCHOOL ACCESS
IN NEW JERSEY
Photo by Brett Davishttp://www.flickr.com/photos/brettdavis/
MATTHEW BURKE

ABSTRACTUntil the mid-1980s, New Jersey’s schools were in decline. Unfair funding formulas ensured that children in the state’s poorest districts were entitled to the least educational opportunity and entered Kindergarten at a considerable disadvantage compared to their wealthier neighbors. A series of court decisions not only changed the funding mechanism to a fairer one, but also established universal preschool in New Jersey’s neediest districts.
Universal preschool not only brought disadvantaged students up to speed in terms of educational attainment at Kindergarten entry, but also is supposed to generate a public return on investment of up to $13 for every dollar spent by saving public expenditures and increasing tax revenue over the lifetimes of preschoolers served.
This project measures and maps statewide “need” for preschool’s beneficial effects and determines whether public policy of the 1980s and 1990s has been successful in mitigating an assortment of risk factors which are strongest in New Jersey’s Newark and Camden urban centers in its northeast and southwest, respectively, as well as throughout rural South Jersey.
Risk analyses find that, while current preschool enrollment is enough to reduce need in the areas where it is strongest, shifting it throughout the interior of the state, there should still be focus on the Newark and Camden areas as well as on South Jersey. These results indicate that while New Jersey is on the right track, more should be done to strengthen the state’s national standing and secure its future.
State of New Jersey
Abbott v. Burke. 100 N.J. 269, 495 A.2d 376, N.J., 1985.HighScope Educational Research Foundation

INTRODUCTIONThis project is an attempt to measure and map “need” for preschool education in New Jersey, as well as an evaluation of existing programs’ success in “leveling the playing field.” New Jersey is a state of stark internal contrasts: between industry and agriculture; urban and suburban; rich and poor; have-lots and have-nots. Historically, these divides have been wide enough to harbor problems and tensions that stealthily trickle in and steadily grow. Too often, New Jersey’s children get caught in the middle.
In the 1980s, state law had required that municipalities fund 67% of their own school budgets using locally-generated tax revenue. In “property-poor” school districts, like Newark, Jersey City, and Camden, where high rates of crime and poverty in the wake of New Jersey’s industrial decline had significantly driven down property values, public schools became woefully underfunded. Consequently, bad schools hastened urban New Jersey’s downward spiral as students dropped out and turned to crime and public assistance to get by.
In 1985, New Jersey courts began a years-long process of ending this feedback loop and intervened to equalize school funding across all of the state’s districts. Poor, urban schools would now receive just as much funding as wealthy, suburban schools. By 1990, the state had identified 31 “Abbott Districts” to target for improvement, named after the 1985 lawsuit Abbott v. Burke.
In 1998, the courts mandated that high-quality preschool education be freely and universally provided in Abbott Districts, after finding that students in New Jersey’s poorer districts
entered Kindergarten well behind their wealthier, suburban peers, in terms of educational attainment. The mandate recognized that investing in early education not only would close this learning gap at Kindergarten entry, but also would generate a public return on investment—as high as $13 for every public dollar invested, according to the Perry Preschool Study—in the form of reduced spending on remedial education and in-grade retention, since preschool students are less likely to be held back or require special education programs; increased income tax revenue, since single parents are able to re-enter the workforce while their children are in school and also because preschool students earn more later in life; consequent reduced spending on public assistance and welfare programs; and reduced spending on law enforcement and incarceration, since it has been found that preschool students are as much as 80% less likely to become repeat offenders later in life.
By identifying the areas of New Jersey where the “need” for these public savings is greatest—in other words, where low education, low income, and high reliance on welfare and public assistance represent opportunities for municipalities to increase revenue and cut expenditures—we can visualize whether Abbott districts have been appropriately designated and whether there are non-Abbott districts with extant need. Then, by adjusting this “need” for current preschool enrollment—in other words, the extent to which the need has already been met—we can determine whether the Abbott decisions were successful in reducing inequality in the state, as well as target areas where programs should be strengthened and increased in number.
Abbott v. Burke. 100 N.J. 269, 495 A.2d 376, N.J., 1985.; Columbia University Teachers College; Education Law Center; HighScope Educational Research Foundation

DATAThis project makes exclusive use of data from the U.S. Census Bureau’s American Community Survey 2011 five-year estimates at the census tract level.
Specific measures include:
• Median income.
• Percent of households with single householders, no spouse present, and children aged under 18 years.
• Percent with less than 9th grade education; percent with less than high school diploma; full population and 18-24 years old only.
• Percent receiving public assistance; percent receiving SNAP benefits; with and without children aged five years and younger.
• Percent unemployed; percent not in labor force.
• Median gross rent.
• Percent aged under five years.
• Percent of 3- and 4-year-olds enrolled in school.
• Percent of unmarried women giving birth in last year; all, 20-34, and 15-19.
New Jersey’s 31Abbott Districts

METHODOLOGY AND ANALYSESThe Perry Preschool Study identifies four domains in which public benefit can be realized. For an average of $15,166 spent on each enrolled child, the study found that $7,303 per child was returned in the form of education savings; $14,078 per child in the form of income tax revenue; $2,768 per child in the form of welfare savings; and a staggering $171,473 per child in the form of crime savings.
Census data were identified which could be categorized into each of these four domains of public benefit, with the exception, unfortunately, of crime savings, for which data are sparsely available and largely incongruous. “Risk” indices were created on the basis of these data to standardize need within each domain and overall. These indices were then sorted into the three remaining domains—education, income, and welfare, as well as an “other” domain for the somewhat uncategorizablevariable of percent of population aged under five years—and then weighted according to the distribution of public benefit as found by the Perry Preschool Study: education indices four times, income indices seven times, welfare indices once, and “other” indices four times (the average of the other weightings). The weighted total of all indices was then divided into quintiles and called the “total preschool need index.”
Another total need index was created which reduced the initial total need index by a factor roughly equivalent to the percentage of 3- and 4-year-olds currently enrolled in preschool. This second, adjusted index, also split into quintiles, represented unmet need for preschool across New Jersey. The distribution of need as measured by the adjusted and initial indices were compared both at the census tract and aggregated at the municipality level. The Abbott districts were overlaid on the total index maps in order to gauge whether they had been successful in alleviating some of the need within their borders.
Indices created include:
Education Domain – weighted 4x• Dropout risk index
Income Domain – weighted 7x• Household income quintile within the State of New Jersey• Work need index• Child in poverty risk index
Welfare Domain – weighted 1x• Welfare index• Child in poverty risk index (as above; counted in both
Income and Welfare domains).• Rent burden index• Single parent index• Single parent risk index
Other – weighted 4x• Preschool-age children index• Current preschool enrollment index
Total indices• Total preschool need index• Adjusted total preschool need index
To aggregate census tract level data by municipality, the total indices per census tract were multiplied by census tract population and added together within each municipality, then divided by total municipality population to obtain an average per-capita index within each municipality.
SEE APPENDIX A (INDICES) FOR INDIVIDUAL INDEX CALCULATIONS, DESCRIPTIONS, AND ILLUSTRATIONS.

RESULTSThe project made some simple, but poignant, findings. First, it was found that areas of New Jersey which most desperately need the public benefits of preschool overlap considerably with the Abbott Districts as drawn in the 1980s and -90s. More generally, New Jersey’s two most urban areas—the northeastern area surrounding Newark and close to New York; and the southwestern area surrounding Camden and close to Philadelphia—as well as much of rural, isolated South Jersey. However, particularly in South Jersey, many non-Abbott Districts appear just as needy.
Second, when adjusted for current enrollment, the picture changed. The areas where the need for preschool’s public effects is greatest when need is reduced by the extent to which it is already met are much more scattered throughout the state when viewed at the census tract level, both within and without the borders of the Abbott Districts. A residual pattern, still focused on the urban cores of Northeastern and Southwestern New Jersey, as well as rural South Jersey, is evident when aggregated at the municipal level, but it is much more evenly distributed throughout the interior of the state than when not accounting for existing enrollment.
These findings indicate that, while the Abbott decisions and the universal preschool programs they gave rise to have likely been successful there is still room for improvement. An expansion of the Abbott program to include 50%—or even all—of New Jersey’s school districts, would almost certainly prime the state’s young children for success later in life, and would help to build a stronger New Jersey.

REFERENCESAbbott v. Burke. 100 N.J. 269, 495 A.2d 376, N.J., 1985.
Columbia University Teachers College. “New Jersey Abbott Preschool Program”. Accessed 23 November, 2013. http://blogs.tc.columbia.edu/transitions/files/2010/09/30.New-Jersey_Abbott-Preschool-Program_profile_.pdf
Education Law Center. “The History of Abbott v. Burke”. Accessed 23 November, 2013. http://www.edlawcenter.org/cases/abbott-v-burke/abbott-history.html.
HighScope Educational Research Foundation. “HighScopePerry Preschool Study; Lifetime Effects: The HighScopePerry Preschool Study Through Age 40 (2005)”. Accessed 23 November, 2013. http://www.highscope.org/content.asp?contentid=219
U.S. Census Bureau. 2013 TIGER/Line Shapefiles.
U.S. Census Bureau. American Community Survey, 2011 five-year estimates. Tables B01, B19301, B25063, B25064, DP02, DP03, DP04, DP05, S0101, S1101, S1201, S1301, S1401, S1501. Generated using American FactFinder on 23 November, 2013. http://factfinder2.census.gov.
NJ Department of Environmental Protection (NJDEP), Office of Information Resources Management (OIRM), Bureau of Geographic Information Systems (BGIS). “Municipalities of New Jersey (Clipped to Coast), Version 20090116” GIS Shapefile. Accessed 23 November 2013. http://www.state.nj.us/dep/gis/digidownload/metadata/statewide/muncoast.htm

APPENDIX A: INDICES

HighMedium
Low
DROPOUT RISK INDEX1 (low) to 3 (high).
Percentage of population not having attained a high school diploma + percentage of population not having attained a high school diploma and aged 18-24 (weighting younger dropouts more heavily).
1: 0-10%; 2: 10-20%; 3: >20%.
U.S. Census Bureau. American Community Survey, 2011 five‐year estimates.

HighestHigh-middle
MiddleLow-middle
Lowest
HOUSEHOLDINCOMEQUINTILEWithin the State of New Jersey.
1 (lowest) to 5 (highest).
U.S. Census Bureau. American Community Survey, 2011 five‐year estimates.

HighHigh-medium
MediumLow-medium
Low
WORK NEED INDEX1 (low) to 5 (high).
Percent actively unemployed (1: 0-5%; 2: 6-10%; 3: >10%) + percent not in labor force (1: 0-29%; 2: 30-35%; 3: >35%).
U.S. Census Bureau. American Community Survey, 2011 five‐year estimates.
HighMedium
Low
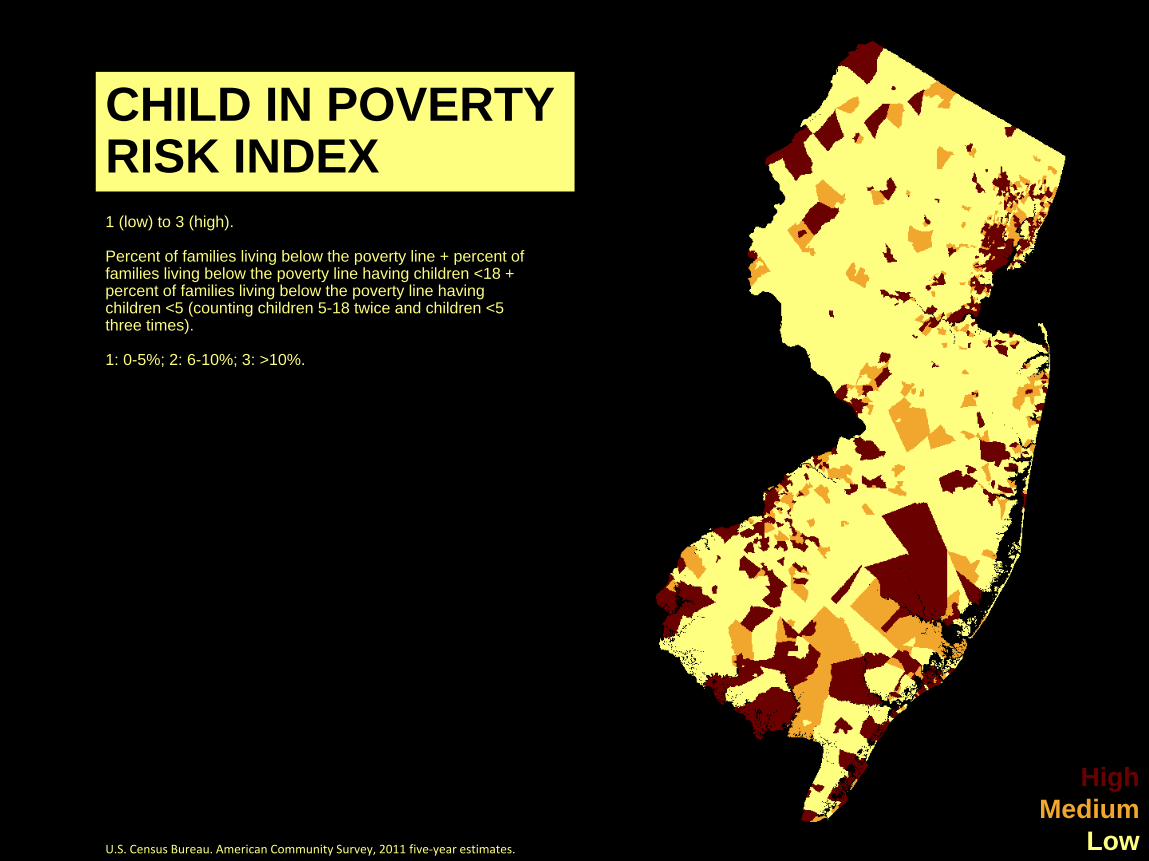
CHILD IN POVERTY RISK INDEX1 (low) to 3 (high).
Percent of families living below the poverty line + percent of families living below the poverty line having children <18 + percent of families living below the poverty line having children <5 (counting children 5-18 twice and children <5 three times).
1: 0-5%; 2: 6-10%; 3: >10%.
U.S. Census Bureau. American Community Survey, 2011 five‐year estimates.

HighMedium
Low
WELFARE INDEX1 (low) to 3 (high).
Percent receiving SNAP benefits + percent receiving other public assistance.
1: 0-2%; 2: 3-5%; 3: >5%.
U.S. Census Bureau. American Community Survey, 2011 five‐year estimates.

HighMedium
Low
RENT BURDENINDEX1 (low) to 3 (high).
Gross median rent.
1: <$850; 2: $851-1350; 3: >$1350.
U.S. Census Bureau. American Community Survey, 2011 five‐year estimates.

HighMedium
Low
SINGLE PARENTINDEX1 (low) to 3 (high).
Percent of households with male householders, no spouse present, and children <18 + percent of households with female householders, no spouse present, and children <18 (current single parents).
1: 0-5%; 2: 6-10%; 3: >10%.
U.S. Census Bureau. American Community Survey, 2011 five‐year estimates.

HighMedium
Low
SINGLE PARENTRISK INDEX1 (low) to 3 (high).
Percentage of unmarried women aged 15-50 giving birth in last year + percentage of unmarried women aged 20-34 giving birth in last year + 2*(percentage of unmarried women aged 15-19 giving birth in last year (weighting single mothers <35 twice and single mothers <20 three times).
1: 0-1%; 2: 2-30%; 3: >30%.
U.S. Census Bureau. American Community Survey, 2011 five‐year estimates.

HighMedium
Low
PRESCHOOL-AGE CHILDREN INDEX1 (low) to 3 (high).
Percentage of population under five years old.
1: 0-4%; 2: 5-10%; 3: >10%.
U.S. Census Bureau. American Community Survey, 2011 five‐year estimates.

HighHigh-medium
MediumLow-medium
Low
TOTAL PRESCHOOL NEED INDEX1 (lowest quintile) to 5 (highest quintile).
4*(sum of all education domain factors) + 7*(sum of all income domain factors, using the inverse of household income quintile) + 1*(sum of all welfare domain factors) + 4*(preschool-age children index).
Composite values divided into quintiles.
Shown with Abbott Districts overlain.
U.S. Census Bureau. American Community Survey, 2011 five‐year estimates.

HighHigh-medium
MediumLow-medium
Low
Municipalities Census tracts
HighHigh-medium
MediumLow-medium
LowU.S. Census Bureau. American Community Survey, 2011 five‐year estimates.

HighHigh-medium
MediumLow-medium
Low
CURRENT PRESCHOOL ENROLLMENT INDEX1 (low) to 5 (high).
Percentage of 3- and 4-year-olds enrolled in school.
1: 0-25%; 2: 26-50%; 3: 51-75%; 4: 76-95%; 5: 96-100%.
U.S. Census Bureau. American Community Survey, 2011 five‐year estimates.

HighHigh-medium
MediumLow-medium
Low
ADJUSTED TOTAL PRESCHOOL NEED INDEX1 (lowest quintile) to 5 (highest quintile).
Total preschool need index * (1.2-(0.2*(current preschool enrollment index))) (reduces total preschool need index by 20% for each level of current enrollment above level 1).
Composite values divided into quintiles.
Shown with Abbott Districts overlain.
U.S. Census Bureau. American Community Survey, 2011 five‐year estimates.

Municipalities Census tracts
HighHigh-medium
MediumLow-medium
LowU.S. Census Bureau. American Community Survey, 2011 five‐year estimates.