Embed Size (px)
Citation preview
1
GIS Applications in the Environment & Geomorphology
GIS• Geographic Information Systems (or
Sciences)– Systems implies a software program or suite of
programs– Sciences implies the theoretical framework,
programming, processes and platform
What is GIS?
• An tool that is used to analyze any data or set of data that is spatial in its distribution
Red areas of southern Florida are susceptible to a five-meter rise of sea
level, based on elevation. Yellow denotes urban areas.
GIS
• Many disciplines contribute to GIS– Geography, cartography, geology, computer
programming...• Disciplines who use GIS in their work
include: – Geography, geology, criminal justice,
sociology, meteorology, political science, archeology…
GIS is used to…
• Facilitate communication between different entities
• Solve problems• Make decisions• Understand past and present situations• Anticipate future scenarios
Using GIS in Geology
• Geomorphology: mass movements (slope stability, old deposits), channel erosion, barrier island movement
• Environment: soil erosion, land use/land cover change, flood zones– Inventories: landslide location, new construction,
septic tank location, flora and fauna distribution, flooding history, regional geology, groundwater
2
How does GIS work?
• As a tool, researchers look at how multiple variables intersect with each other– Analyzing HOW the variables interact is done
in GIS • Analyzing often done through a series of
maps– Advantage of GIS is that is can be instantly
updated
• Can use spatial data, nonspatial data, and images
How does GIS work?
GIS and Remote Sensing• Two tools work together very well. • Remote sensing is acquisition of
information of an object or phenomenon, with a device not in actual contact with the object – Photographs or satellite images are the most
common– Collect information without being there
China’s Quake Lake
Formosat image © 2008 Dr. Cheng-Chien Liu, National Cheng-Kung University and Dr. An-Ming Wu, National Space Organization, Taiwan.
0.5 meter resolution = 1.6 feet
3
Basic analysis tools
• Overlay – stacking data on top of each other
• Buffers – drawing a bubble around a variable
Overlays
• The most fundamental analysis tool in GIS• Display 2 or more variables spatially to
understand and interpret their relationship– Example: Topography and vegetation; land
use and landslides; hurricane storm surge and residences
Erosion potential model-Colby College
Land useSoil SeriesRoad type
Erosion impact map-Colby College
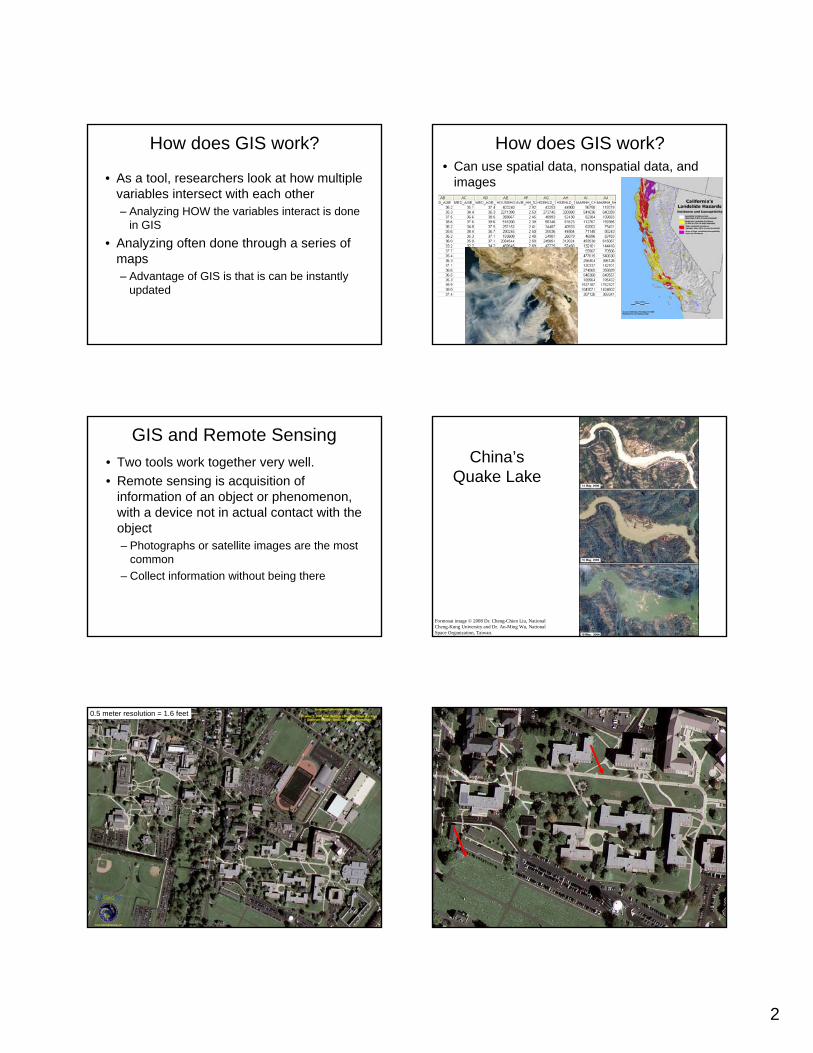
Erosion impact map-Colby College Overlay example: landslides• Mapped Pleistocene landslides using
aerial photographs and an image that shows the elevation of the area
4
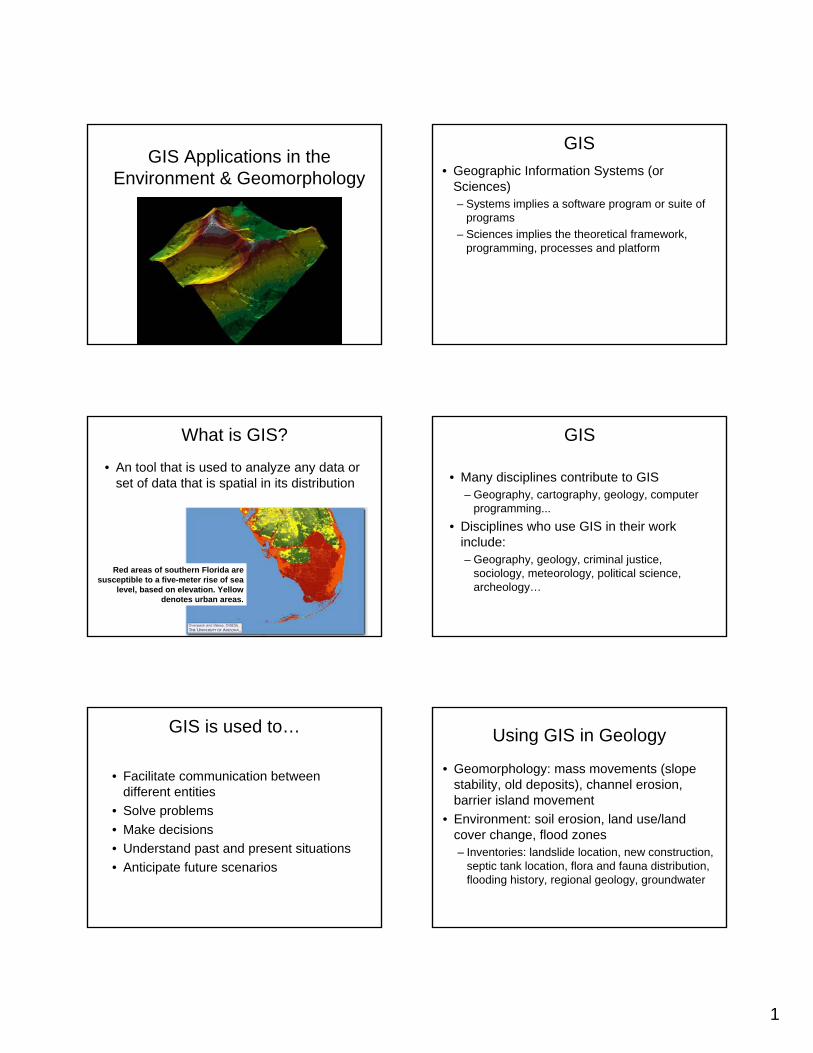
Digital Elevation Models
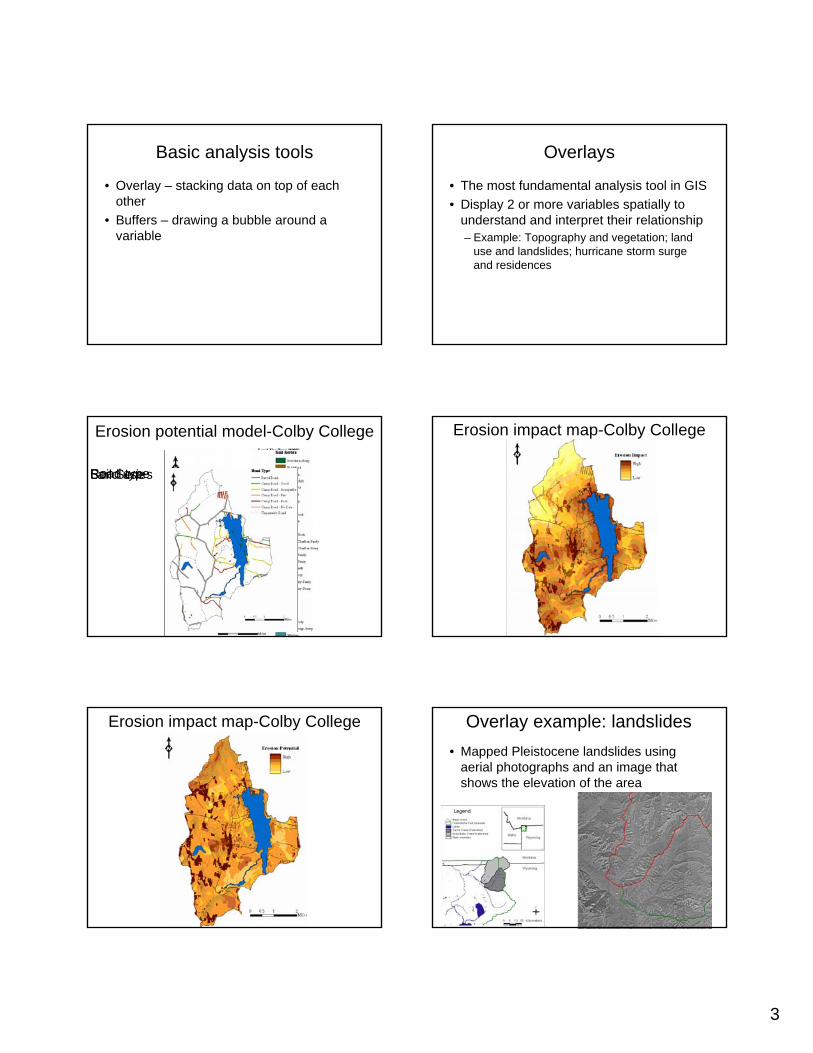
Landslides• Aspect – direction of a slope
Landslides: Lewis Overthrust Fault
• Fault in northwestern Montana where older deposits are over younger deposits
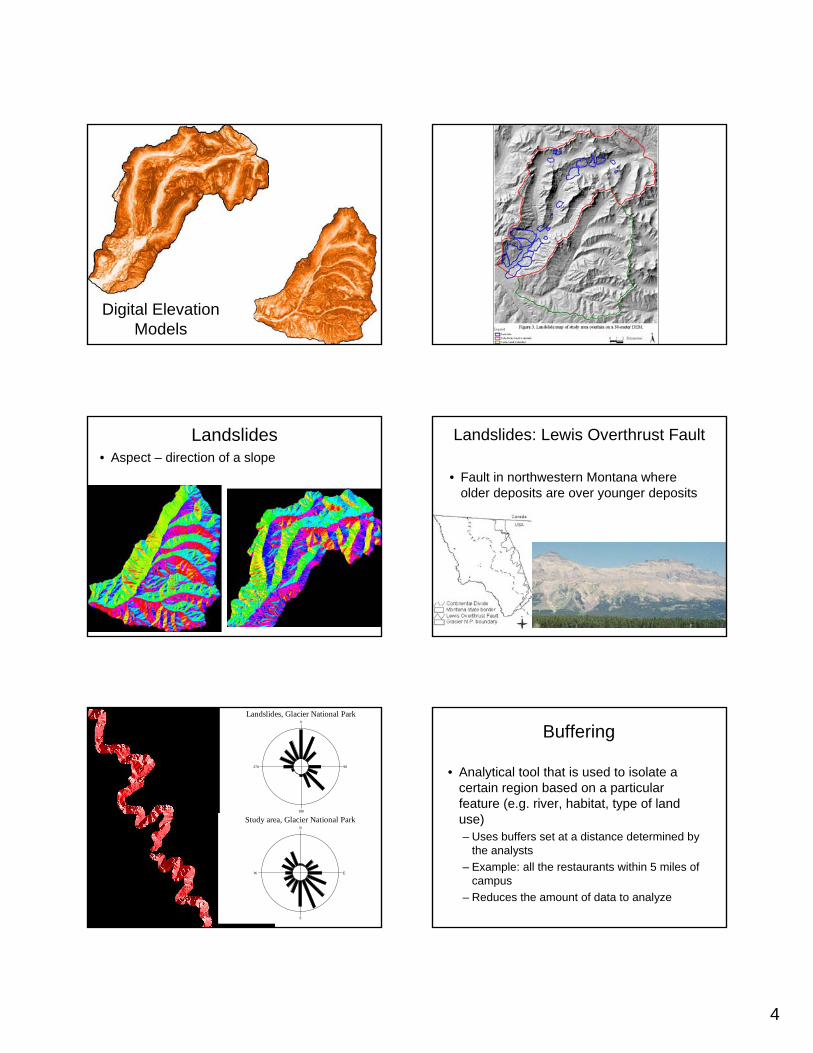
Landslides, Glacier National Park0
90
180
270
Study area, Glacier National ParkN
E
S
W
Buffering
• Analytical tool that is used to isolate a certain region based on a particular feature (e.g. river, habitat, type of land use)– Uses buffers set at a distance determined by
the analysts– Example: all the restaurants within 5 miles of
campus– Reduces the amount of data to analyze
5
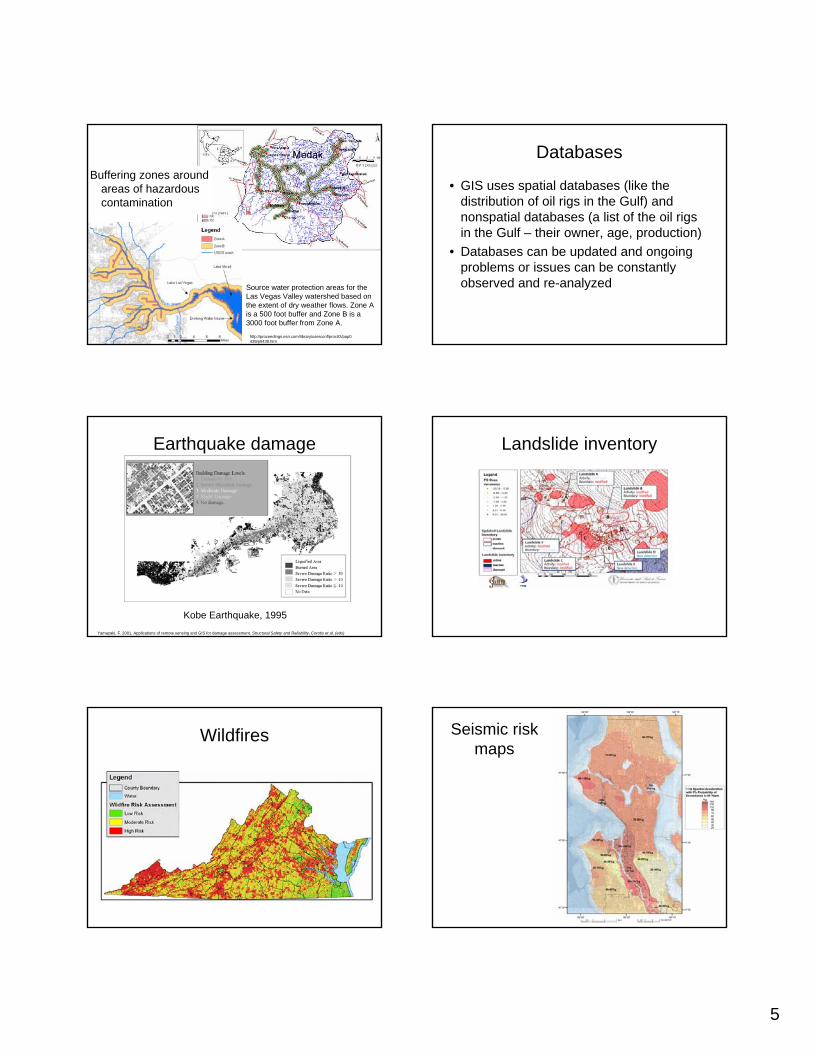
Buffering zones around areas of hazardous contamination
Source water protection areas for the Las Vegas Valley watershed based on the extent of dry weather flows. Zone A is a 500 foot buffer and Zone B is a 3000 foot buffer from Zone A.
http://proceedings.esri.com/library/userconf/proc02/pap0439/p0439.htm
Databases
• GIS uses spatial databases (like the distribution of oil rigs in the Gulf) and nonspatial databases (a list of the oil rigs in the Gulf – their owner, age, production)
• Databases can be updated and ongoing problems or issues can be constantly observed and re-analyzed
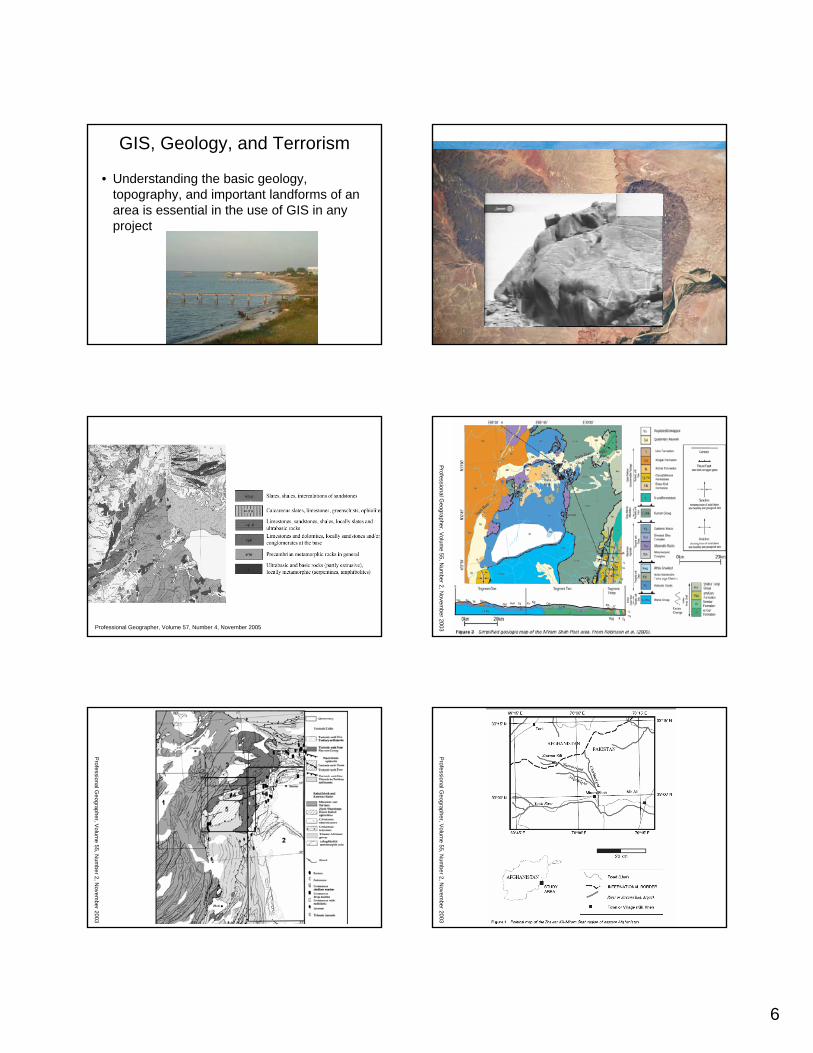
Earthquake damage
Kobe Earthquake, 1995Yamazaki, F. 2001. Applications of remote sensing and GIS for damage assessment. Structural Safety and Reliability, Corotis et al. (eds)
Landslide inventory
Wildfires Seismic risk maps
6
GIS, Geology, and Terrorism
• Understanding the basic geology, topography, and important landforms of an area is essential in the use of GIS in any project
Professional Geographer, Volume 57, Number 4, November 2005
Professional G
eographer, Volum
e 55, Num
ber 2, Novem
ber 2003
Professional G
eographer, Volum
e 55, Num
ber 2, Novem
ber 2003
Professional G
eographer, Volum
e 55, Num
ber 2, Novem
ber 2003
7
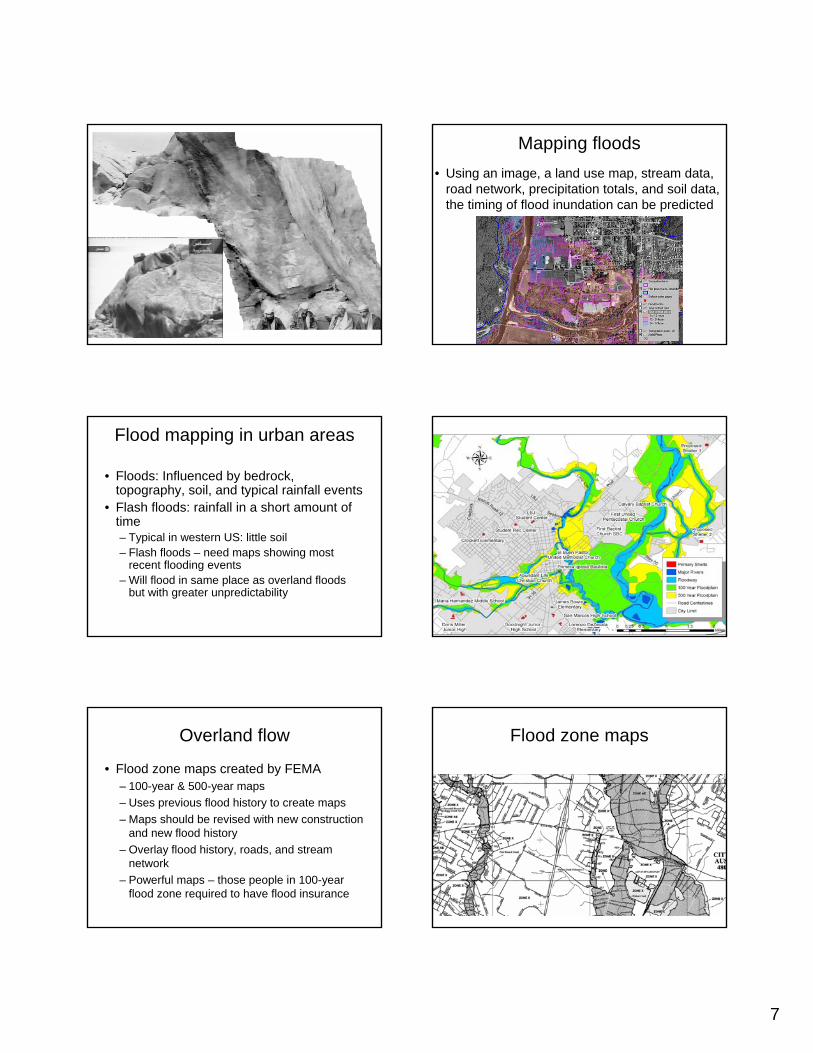
Mapping floods• Using an image, a land use map, stream data,
road network, precipitation totals, and soil data, the timing of flood inundation can be predicted
Flood mapping in urban areas
• Floods: Influenced by bedrock, topography, soil, and typical rainfall events
• Flash floods: rainfall in a short amount of time– Typical in western US: little soil – Flash floods – need maps showing most
recent flooding events– Will flood in same place as overland floods
but with greater unpredictability
Overland flow
• Flood zone maps created by FEMA– 100-year & 500-year maps– Uses previous flood history to create maps– Maps should be revised with new construction
and new flood history– Overlay flood history, roads, and stream
network– Powerful maps – those people in 100-year
flood zone required to have flood insurance
Flood zone maps
8
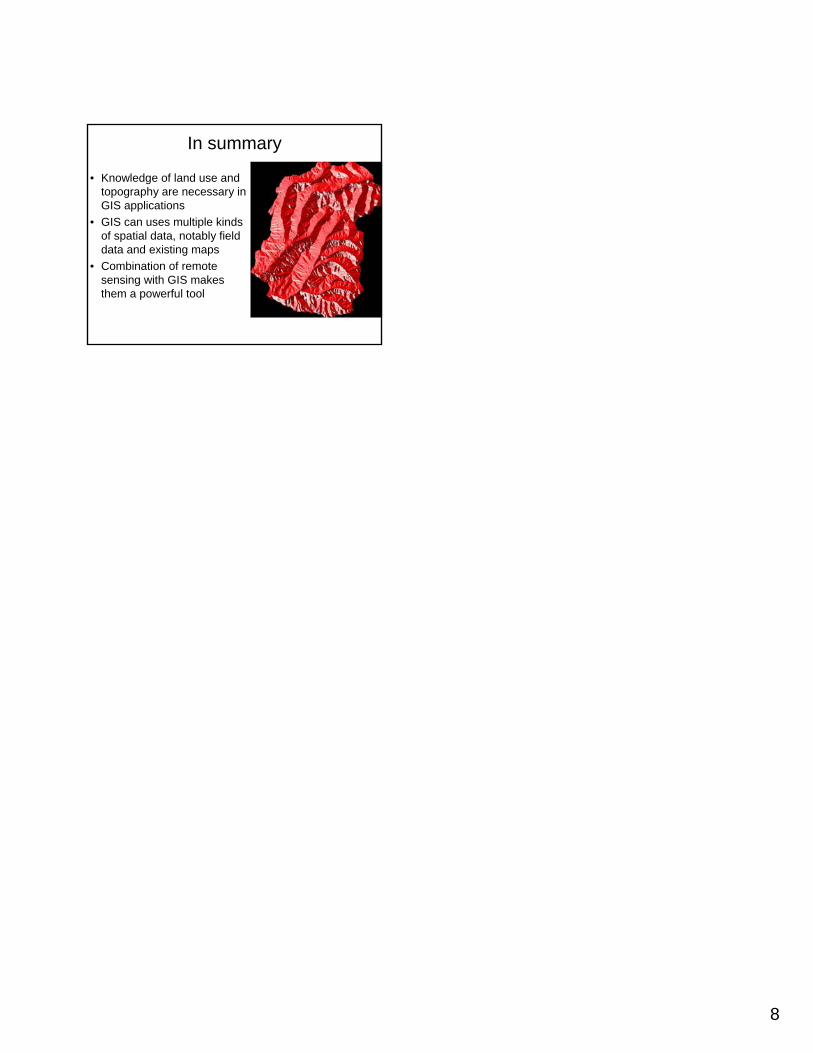
In summary
• Knowledge of land use and topography are necessary in GIS applications
• GIS can uses multiple kinds of spatial data, notably field data and existing maps
• Combination of remote sensing with GIS makes them a powerful tool