Embed Size (px)
Citation preview

39
GIS-Based Safety Bus Stops
GIS-Based Safety Bus Stops—Serdang and Seri Kembangan
Case StudyKhaled Hazaymeh
University Putra Malaysia
Abstract
Enhancing a bus transit system is a possible solution to the growth of congestion in urban areas. Issues related to the safety of bus passengers, either on board or during their travel to a bus stop, should be considered. This article presents a GIS method to identify risky bus stops on a single bus route in the Serdang and Seri Kempangan area according to three attributes: location, characteristics, and surface. The aim is to improve the safety of bus stops in the area. Results show that GIS is a good tool to achieve the purpose of this study.
IntroductionEnhancing a bus transit system is a possible solution to the growth of congestion in urban areas. Bus transit market potential cannot be explored to its full extent unless issues related to the safety of bus passengers, either on board or during their travel to a bus stop, and accessibility to bus stops are addressed (Pulugurtha and Vanapalli 2008, Hamby and Thompson 2006).
Personal safety is an important issue in an effective transit system because it greatly impacts transit users. The real safety of transit users and their perception
Journal of Public Transportation, Vol. 12, No. 2, 2009
40
of their safety are often crucial factors in the decision to use or not to use transit (Vogel and Pettinari 2002).
At a minimum, bus stops should have safety amenities such as lighting, curbs, and shelter. Lighting is crucial for visibility and safety throughout the day and night. In transit environments, lighting should illuminate the faces of people. Curbs should be clearly designated and assigned as “no parking” areas. The shelter should be large enough for sidewalks and visually disruptive. In this paper, a shelter was con-sidered a risk factor because of weather conditions in the area of study (rain and thunderstorms)—pedestrians seeking cover at a shelter may suddenly jump into the street when their bus arrives. Thus, a level of risk may occur for pedestrians and vehicles.
Bus stops should be at safe locations, no more than 50 meters after a traffic light or road intersection (Higher Committee of Planning Cities 2000). They should not be located on sloped surfaces. Stops that are not located within a distance of 50m after a traffic light or road intersection, that do not have lighting, curbs, and shel-ters, and that are located on a sloped surface are considered unsafe.
Pulugurtha and Vanapalli (2008) developed a Geographic Information System (GIS)-based methodology to assist decisionmakers in identifying and ranking bus stops in high auto-pedestrian collision areas. The GIS-based methodology is illus-trated by using 2000-2002 auto-pedestrian collision data, traffic volumes, bus stop coverage, transit ridership data, and street centerline coverage for the Las Vegas metropolitan area.
Vogel and Pettinari (2002) focus on the design of transit environments as they consider the personal safety of transit users and address the nature of the larger environment in which the transit stop or station is located. Issues of access also are addressed because the characteristics of the pathways leading to and from transit stops are integral parts of the transit environment.
Studies such as the one by Moudon and Hess (2003) show a strong relationship between autos and pedestrians. Providing appropriate pedestrian facilities along bus transit corridors makes access to transit systems more effective.
This study aims to enhance public transportation service in an identified area by determining bus stops that may cause risk for pedestrians or vehicles. It also describes a step-by-step approach for validation of bus stop safety using the geo-processing tools available with ArcGIS 9.2.
41
GIS-Based Safety Bus Stops
Data and Area of StudyThe data required to identify the safety of bus stops include road network maps, bus routes, bus stop locations, traffic light locations, and road intersections. The road network map was obtained from Google Map and was geo-referenced to the WGS84 coordinate system, then transformed to the Kertau coordinate system.
The locations and the attributes of bus stops, traffic lights, and road intersections were obtained by means of GPS techniques and ground surveys. Table 1 shows the attributes of these features. The area of study was limited to a single bus route, T432, which serves the area between Serdang KTM Komuter, Bandar Puncak Jalil of Serdang, and Seri Kembangan city.
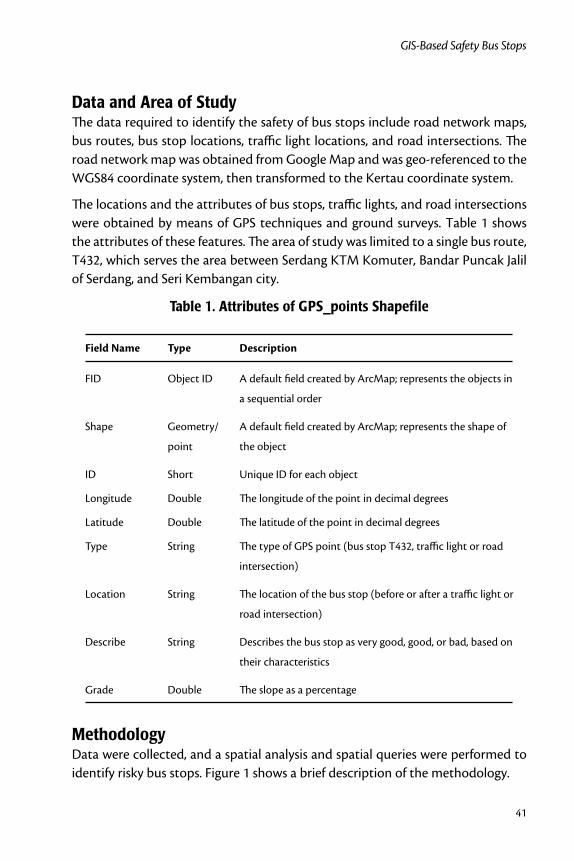
Table 1. Attributes of GPS_points Shapefile
field Name Type Description
FID Object ID A default field created by ArcMap; represents the objects in
a sequential order
Shape Geometry/ A default field created by ArcMap; represents the shape of
point the object
ID Short Unique ID for each object
Longitude Double The longitude of the point in decimal degrees
Latitude Double The latitude of the point in decimal degrees
Type String The type of GPS point (bus stop T432, traffic light or road
intersection)
Location String The location of the bus stop (before or after a traffic light or
road intersection)
Describe String Describes the bus stop as very good, good, or bad, based on
their characteristics
Grade Double The slope as a percentage
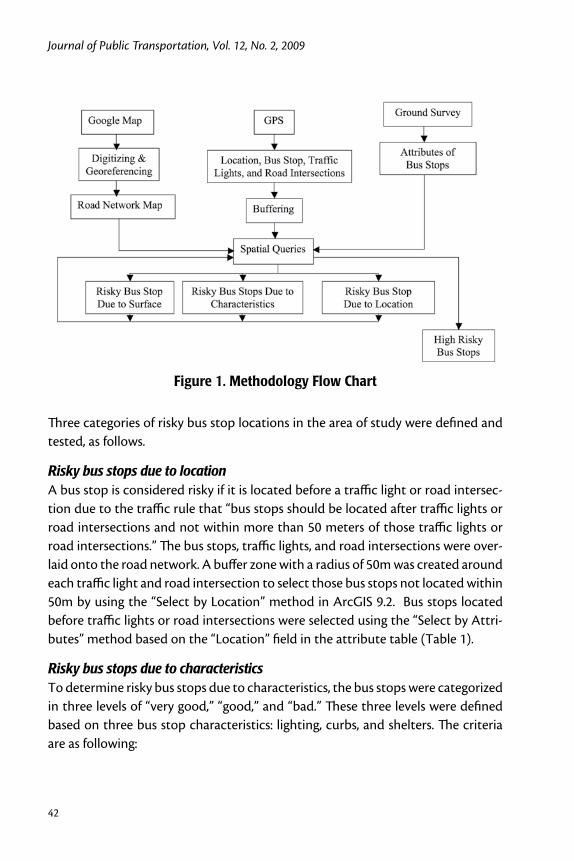
MethodologyData were collected, and a spatial analysis and spatial queries were performed to identify risky bus stops. Figure 1 shows a brief description of the methodology.
Journal of Public Transportation, Vol. 12, No. 2, 2009
42
Figure 1. Methodology Flow Chart
Three categories of risky bus stop locations in the area of study were defined and tested, as follows.
Risky bus stops due to locationA bus stop is considered risky if it is located before a traffic light or road intersec-tion due to the traffic rule that “bus stops should be located after traffic lights or road intersections and not within more than 50 meters of those traffic lights or road intersections.” The bus stops, traffic lights, and road intersections were over-laid onto the road network. A buffer zone with a radius of 50m was created around each traffic light and road intersection to select those bus stops not located within 50m by using the “Select by Location” method in ArcGIS 9.2. Bus stops located before traffic lights or road intersections were selected using the “Select by Attri-butes” method based on the “Location” field in the attribute table (Table 1).
Risky bus stops due to characteristicsTo determine risky bus stops due to characteristics, the bus stops were categorized in three levels of “very good,” “good,” and “bad.” These three levels were defined based on three bus stop characteristics: lighting, curbs, and shelters. The criteria are as following:
43
GIS-Based Safety Bus Stops
If the bus stop has all three characteristics, it is described as “very good.”•
If the bus stop has one or two characteristics, it is described as “good.”•
If the bus stop has none of the characteristics, it is described as “bad.” A •“bad” bus stop is considered a risky bus stop.
A field of attributes was added to the table of attributes and named •“Describe.” It was filled with the description levels. The “bad” bus stops were selected by using the “Select by Attributes” method based on the “describe” field in the table of attributes (Table 1).
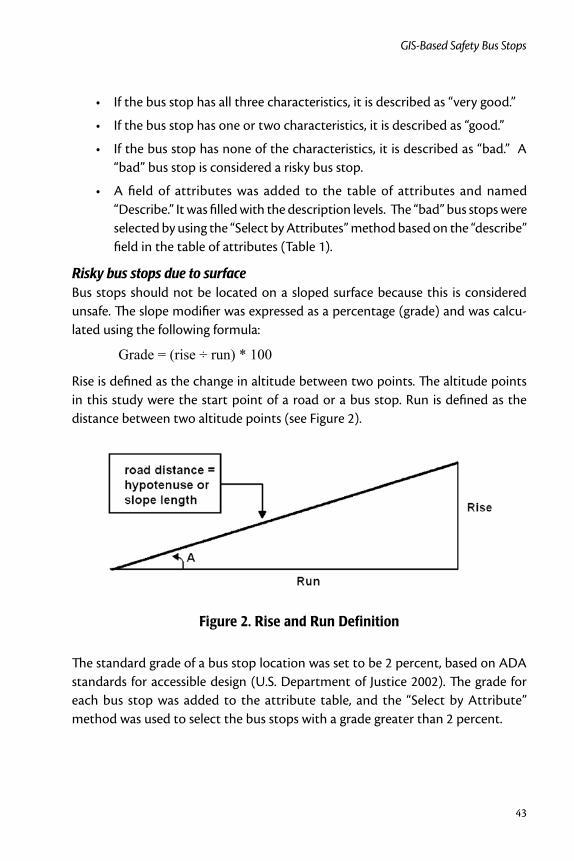
Risky bus stops due to surfaceBus stops should not be located on a sloped surface because this is considered unsafe. The slope modifier was expressed as a percentage (grade) and was calcu-lated using the following formula:
Grade = (rise ÷ run) * 100
Rise is defined as the change in altitude between two points. The altitude points in this study were the start point of a road or a bus stop. Run is defined as the distance between two altitude points (see Figure 2).
Figure 2. Rise and Run Definition
The standard grade of a bus stop location was set to be 2 percent, based on ADA standards for accessible design (U.S. Department of Justice 2002). The grade for each bus stop was added to the attribute table, and the “Select by Attribute” method was used to select the bus stops with a grade greater than 2 percent.
Journal of Public Transportation, Vol. 12, No. 2, 2009
44
High-Risk Bus StopsHigh-risk bus stops were defined as any bus stop that has two or three of the three categories of risk. The “Select by Attribute” method was used to select the bus stops with two or more categories of risk.
Results and DiscussionRisky bus stops due to locationRisky bus stops due to location were identified in a two-step process: the bus stops that intersect the buffer zone (50 meters) were selected, and then the bus stops that are located before traffic lights or road intersections were selected. The SQL query statement that selects the bus stops that intersect the buffer zone was made by using the “Select by Location” method as follows:
(“bus stop”) features that (“intersect”) features in (“buffer zone 50”)
The result of this query showed that there is no bus stop within the buffer zone in the study area. This did not mean, however, that all bus stops are risky because some are located in a straightaway where there are no traffic lights or road inter-sections. Thus, the second step, which selects the bus stops that are located before traffic lights or road intersections, is taken. The SQL query statement that selects the bus stops that are located before the traffic lights or road intersections is:
(“Location” = “before traffic light” OR “Location” = “before intersection”)
The result of this query shows that there are two bus stops in the study area with locations before a traffic light or road intersection and that are not within 50 meters of the traffic light or road intersection, and thus may cause risk for pedes-trians or for vehicles, according to these two criteria. Figure 3 shows risky bus stops due to location.
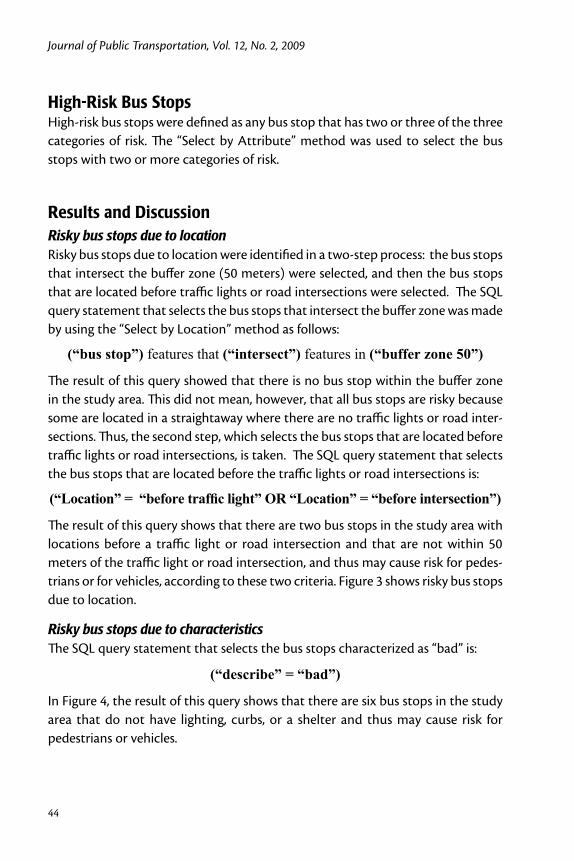
Risky bus stops due to characteristicsThe SQL query statement that selects the bus stops characterized as “bad” is:
(“describe” = “bad”)
In Figure 4, the result of this query shows that there are six bus stops in the study area that do not have lighting, curbs, or a shelter and thus may cause risk for pedestrians or vehicles.

45
GIS-Based Safety Bus Stops
Figure 3. Risky Bus Stops Due to Location
Journal of Public Transportation, Vol. 12, No. 2, 2009
46
Figure 4. Risky Bus Stops Due To Characteristics
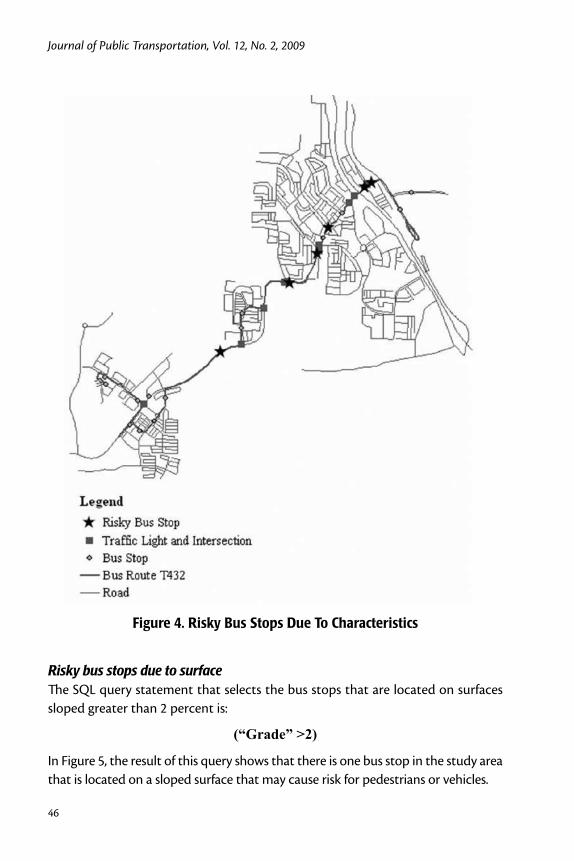
Risky bus stops due to surfaceThe SQL query statement that selects the bus stops that are located on surfaces sloped greater than 2 percent is:
(“Grade” >2)
In Figure 5, the result of this query shows that there is one bus stop in the study area that is located on a sloped surface that may cause risk for pedestrians or vehicles.
47
GIS-Based Safety Bus Stops
Figure 5. Risky Bus Stops Due To Surface
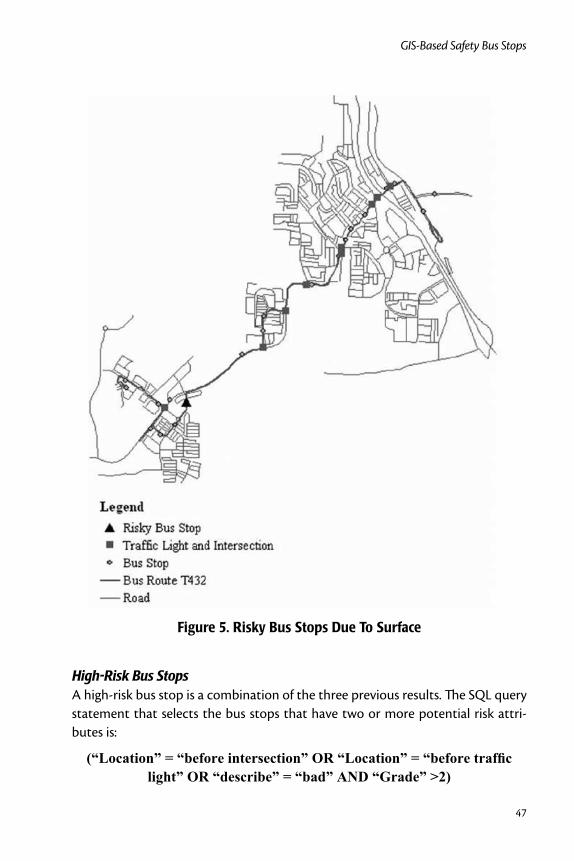
High-Risk Bus StopsA high-risk bus stop is a combination of the three previous results. The SQL query statement that selects the bus stops that have two or more potential risk attri-butes is:
(“Location” = “before intersection” OR “Location” = “before traffic light” OR “describe” = “bad” AND “Grade” >2)
Journal of Public Transportation, Vol. 12, No. 2, 2009
48
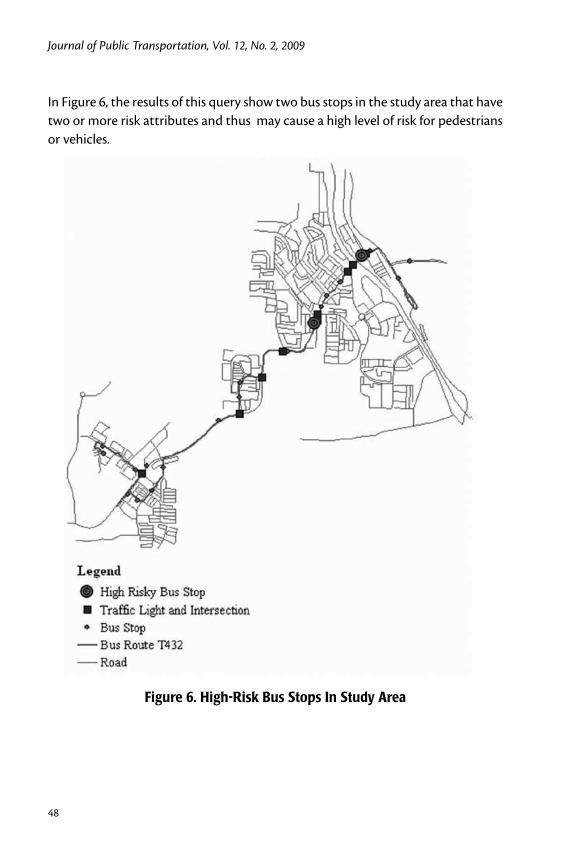
In Figure 6, the results of this query show two bus stops in the study area that have two or more risk attributes and thus may cause a high level of risk for pedestrians or vehicles.
Figure 6. High-Risk Bus Stops In Study Area
49
GIS-Based Safety Bus Stops
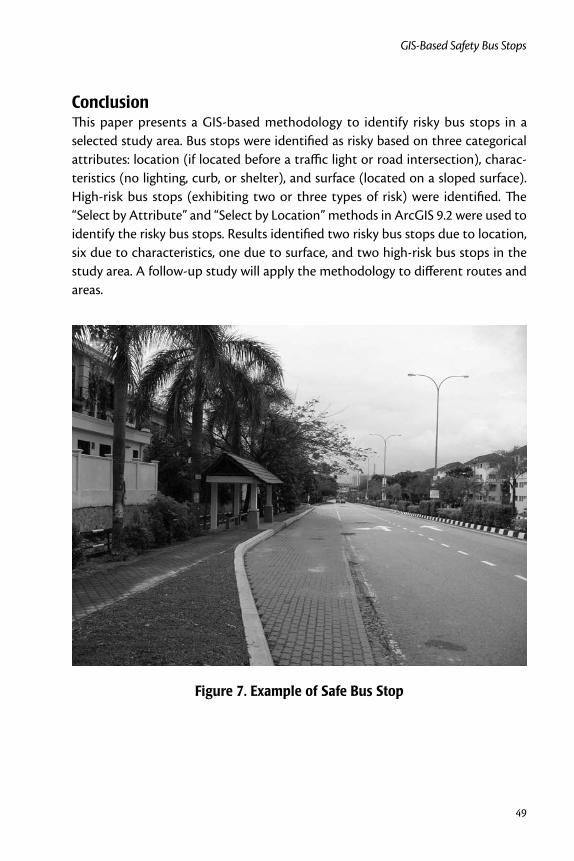
Conclusion This paper presents a GIS-based methodology to identify risky bus stops in a selected study area. Bus stops were identified as risky based on three categorical attributes: location (if located before a traffic light or road intersection), charac-teristics (no lighting, curb, or shelter), and surface (located on a sloped surface). High-risk bus stops (exhibiting two or three types of risk) were identified. The “Select by Attribute” and “Select by Location” methods in ArcGIS 9.2 were used to identify the risky bus stops. Results identified two risky bus stops due to location, six due to characteristics, one due to surface, and two high-risk bus stops in the study area. A follow-up study will apply the methodology to different routes and areas.
Figure 7. Example of Safe Bus Stop
Journal of Public Transportation, Vol. 12, No. 2, 2009
50
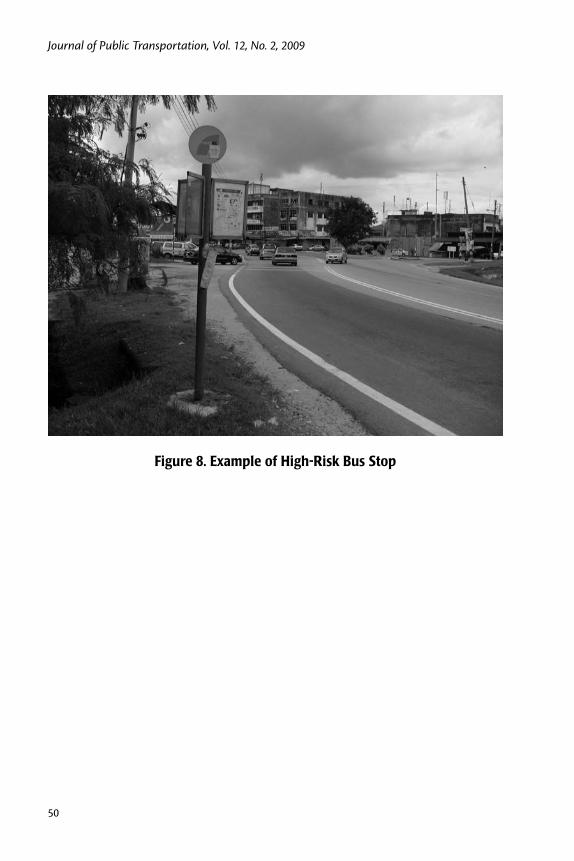
Figure 8. Example of High-Risk Bus Stop
51
GIS-Based Safety Bus Stops
References
Hamby, B., and K. Thompson. 2006. New toolkit provides practical tools to build better bus stops. ITE Journal 76 (9): 22–26.
Higher Committee of Planning Cities. 2000. Urban Planning Standards. Muscat, Sultanate of Oman (Arabic Edition).
http://www.ci.madison.wi.us/statestreet/ProbsandOpps.htm (September - 15 - 2008)
KFH Group. 2003. Arlington County bus stop design standards. Arlington County, Department of Public Works.
Pulugurtha, S., and V. Vanapalli. 2008. Hazardous bus stops identification: An illus-tration using GIS. Journal of Public Transportation 11: 65-83.
Moudon, A. W., and P. M. Hess. 2003. Pedestrian safety and transit corridors. Final Report (# WA-RD 556.1). Seattle, WA: Washington State Transportation Cen-ter (TRAC), University of Washington.
U.S. Department of Justice. 2002. ADA Standards for Accessible Design. Section 10.2, Bus Stops and Terminals. http://www.ada.gov/adastd94.pdf.
Vogel, M., and J. Pettinari. 2002. Personal safety and transit: Paths, environments, stops, and stations. Final Report (#CTS 02-05), Minneapolis, Minnesota: Cen-ter for Transportation Studies.
Volinski, J., and L. E. Tucker. 2003. Public transportation synthesis series: Safer stops for vulnerable customers. Final Report (# NCTR-473-13), Tampa, FL: National Center for Transit Research, University of South Florida.
About the Author
Khaled Hazaymeh ([email protected]) is with the GIS and Remote Sensing section of the Department of Civil Engineering at University Putra Malaysia. He has an MS in Geographical Information Systems (GIS) and Remote Sensing (RS) from University Putra Malaysia and a BA in Geography and Spatial Planning from Yarmouk University in Jordan. His research interests include transport services plan-ning and management, the socio-economic impacts of transportation congestion, and urban planning applications.