Embed Size (px)
Citation preview
GIS-Based Models and GIS-Tools forSustainable Transport Planning
in Israel and Palestine
("GIS-Verkehrsplanung")PL 188/6-2
Phase 21 March 1999 – 31 March 2001
Final Report
31 March 2001
Prof. Dr. Lutz PlümerInstitut für Kartographie undGeoinformation, Universität Bonn
Prof. Dr. Michael WegenerInstitut für RaumplanungUniversität Dortmund
Prof. Dr. Ilan SalomonDepartment of GeographyHebrew University of Jerusalem
Prof. Dr. Jad Elias IsaacApplied Research Institute JerusalemBethlehem
GIS-Based Models and GIS Tools 2
Table of Contents
1 Introduction ................................................................................................................ 3
2 Context and Project Operation ................................................................................. 5
3 Results ......................................................................................................................... 9
3.1 The Modelling System ....................................................................................... 93.1.1 Analytical Framework ............................................................................ 93.1.2 Interface between ArcInfo and EMME/2 ............................................... 113.1.3 Network Extension Tool ........................................................................ 14
3.2 The Integrated Database ..................................................................................... 203.2.1 Digital Terrain Model ............................................................................. 203.2.2 Road Network Database ......................................................................... 223.2.3 Zone System ........................................................................................... 273.2.4 Socio-Economic Data ............................................................................. 27
3.3 Policy Scenarios ................................................................................................. 303.3.1 Background ............................................................................................ 303.3.2 Policy Analysis ....................................................................................... 313.3.3 Definition of Scenarios ........................................................................... 353.3.4 Simulation Results ................................................................................. 38
4 Conclusions and Future Work .................................................................................. 46
5 Appendix ..................................................................................................................... 48
Appendix 1: Co-operation Partners .............................................................................. 48
Appendix 2: Staff ......................................................................................................... 49
Appendix 3: Theses and Publications .......................................................................... 50
Appendix 4: Setting Up the D-GPS ............................................................................. 51
Appendix 5: Completing the DTM .............................................................................. 52
Appendix 6: Traffic Flows ........................................................................................... 53
GIS-Based Models and GIS Tools 3
1 Introduction
The objective of the trilateral (German-Israeli-Palestinian) project "GIS-Based Models andGIS-Tools for Sustainable Transport Planning in Israel and Palestine" was the developmentand adaptation of GIS-based models and GIS tools for sustainable, i.e. resource preserving,transport planning in a regional context that, because of its high dynamics and the currentpolitical conditions, puts high demands on the flexibility of the methods to be applied.
Sustainable transport planning in Israel and the emerging Palestinian state faces major uncer-tainties and challenges. With rising income levels and car ownership, problems of road con-gestion, air pollution and traffic noise are expected to multiply in this densely populated re-gion. While on the Israeli side massive road construction has replicated trends in other devel-oped countries, the transport infrastructure in the Palestinian territories has been neglected fordecades. The by-pass roads built by the Israeli authorities to link Israeli settlements with Is-rael and the restrictions on travel by Palestinians aggravate the problems of inequity in mobil-ity. Air pollution generated by traffic in the conurbations of central Israel is transmitted to theWest Bank due to prevailing air flows. These conditions have made transport planning pro-posals for Israel and the West Bank highly sensitive conflict-laden issues.
The trilateral project was to contribute to the rational solution of these conflicts by providingstate-of-the-art tools to assist in the rational assessment of the long-term equity and environ-mental implications of alternative transport planning policies for the West Bank and adjacentareas of Israel and Jordan. In view of the need to reach significant results in a short time, andin line with the recommendations of the reviewers of the proposal, the focus was on the ad-aptation of existing rather than on the development of new models.
The project was conducted in two phases. Project Phase 1 started in March 1997 and ended inFebruary 1999. Phase 2 started in March 1999 and officially ended in February 2000. How-ever, because of difficulties in communication between the project partners caused by externalcircumstances, the actual work was not completed before March 2001.
- Phase 1. The first, and most important, achievement of Phase 1 was the development of anintegrated, homogeneous database from a variety of heterogeneous data sources providingall data required for computer-based transport planning in the study area consisting of fourcomponents: a digital terrain model, a road network database, a system of traffic analysisand land use zones, and socio-economic data for these zones. In addition, a set of modelsand tools required for sustainable transport planning in the study area will was developed: asoftware interface for the data exchange between a geographic information system and atransport planning package, a meso-meteorological model and a tool for designing roadnetwork extensions. To lay the ground for the simulation of transport policies in Phase 2 ofthe project, a range of transport policies and their major assets and consequences were ana-lysed and combinations of policies or 'policy packages' were defined. In addition, exogenousscenarios reflecting long-term socio-economic trends or policies in other policy fields wereidentified. The results of Phase 1 were summarised in a report to the Deutsche Forschungs-gemeinschaft dated 15 September 1998.
- Phase 2. The proposal for Phase 2 proposed an extension of the model framework by sub-models for public transport and paratransit, freight transport and meso-scale and local envi-ronmental impacts as well as extensive applications of the extended model framework to alarge number of policy scenarios. However, instead of this larger three-year project, only a
GIS-Based Models and GIS Tools 4
one-year extension of the project with a much reduced set of tasks was approved by theDFG. The only remaining objective of Phase 2 of the project was to complete, test and ap-ply the integrated spatial database and the models and tools developed in Phase 1 to asmaller number of policy scenarios in order to demonstrate the usefulness and applicabilityof the developed framework.
Despite this reduction of tasks, work on Phase 2 started in an atmosphere of great optimismwith regard to the success of the project. Final preparations for the model simulations, such asrefinements of the integrated database, model calibration runs and discussions on the policyscenarios to be simulated were conducted during 1999. For the end of the project a majorworkshop in Bethlehem or Jerusalem with invited experts and decision makers from both theIsraeli and Palestinian side was planned.
However, the re-intensification of conflict between Israeli and Palestinians and the outbreakof the "Second Intifada" in the year 2000 had its impact on the project. Communication be-tween the Israeli and Palestinian project partners was becoming increasingly difficult, so thatagreement on the policy scenarios to be simulated was not reached until early 2001. There ispresently no prospect that the planned workshop in Bethlehem or Jerusalem will take place.
These externally imposed difficulties have prevented the project to reach its ultimate goal toserve the planning practice in the West Bank and support the co-operation of Israeli and Pal-estinian researchers and planners in the joint pursuit of sustainable transport.
This report therefore has the limited function to present the tools developed and the resultsachieved so far in the hope that further collaboration with the Israeli and Palestinian partnerswill be possible in the not too far future.
GIS-Based Models and GIS Tools 5
2 Context and Project Operation
The objective of the trilateral (German-Israeli-Palestinian) project "GIS-Based Models andGIS-Tools for Sustainable Transport Planning in Israel and Palestine" was the developmentand adaptation of GIS-based models and GIS tools for sustainable, i.e. resource preserving,transport planning in a regional context that, because of its high dynamics and the currentpolitical conditions, puts high demands on the flexibility of the methods to be applied.
Sustainable transport planning in Israel and the emerging Palestinian state faces major uncer-tainties and challenges. With rising income levels and car ownership, problems of road con-gestion, air pollution and traffic noise are expected to multiply in this densely populated re-gion. While on the Israeli side massive road construction has replicated trends in other devel-oped countries, the transport infrastructure in the Palestinian territories has been neglected fordecades. The by-pass roads built by the Israeli authorities to link Jewish settlements with Is-rael and the restrictions on travel by Palestinians aggravate the problems of inequity in mobil-ity. Air pollution generated by traffic in the conurbations of central Israel is transmitted to theWest Bank due to prevailing air flows. These conditions have made transport planning pro-posals for Israel and the West Bank highly sensitive conflict-laden issues.
The trilateral project was to contribute to the rational solution of these conflicts by providingstate-of-the-art tools to assist in the rational assessment of the long-term equity and environ-mental implications of alternative transport planning policies.
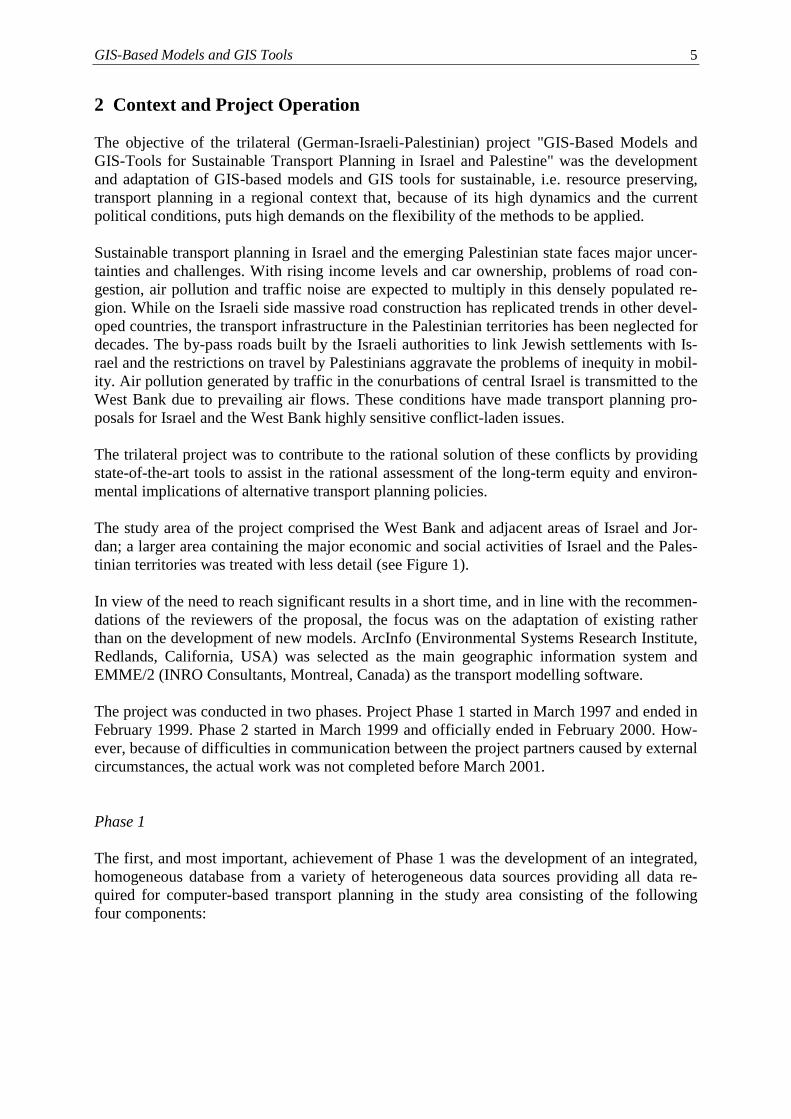
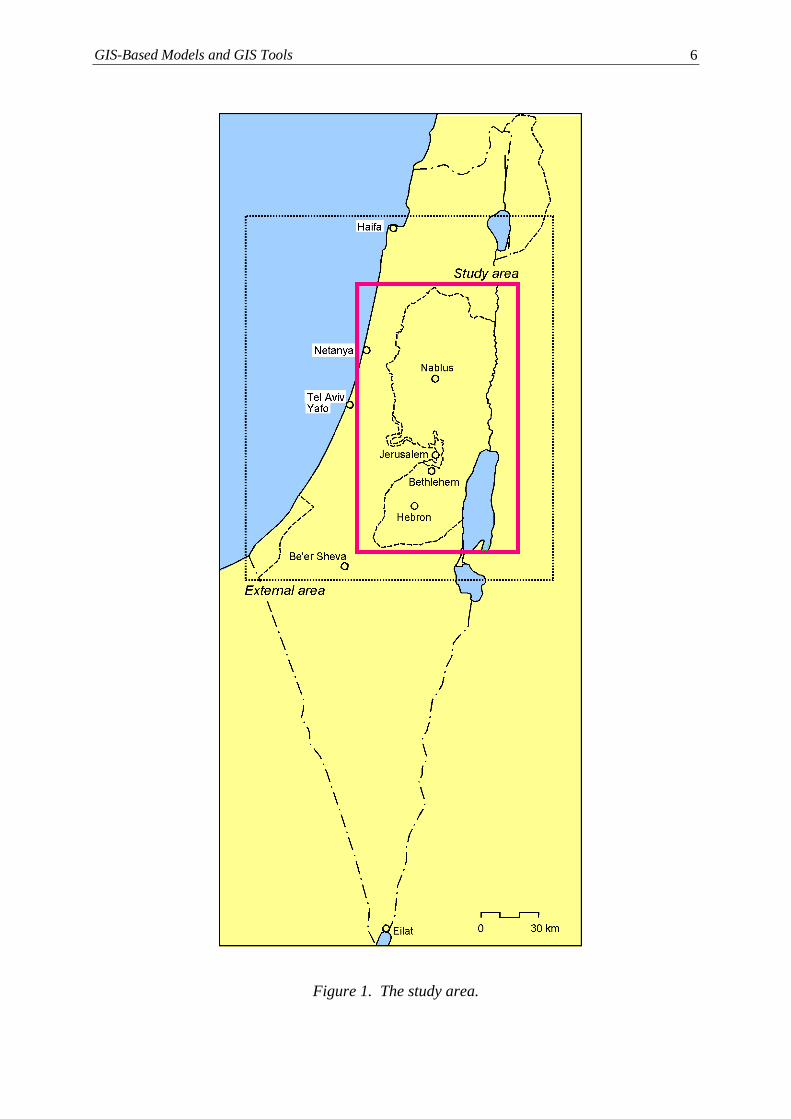
The study area of the project comprised the West Bank and adjacent areas of Israel and Jor-dan; a larger area containing the major economic and social activities of Israel and the Pales-tinian territories was treated with less detail (see Figure 1).
In view of the need to reach significant results in a short time, and in line with the recommen-dations of the reviewers of the proposal, the focus was on the adaptation of existing ratherthan on the development of new models. ArcInfo (Environmental Systems Research Institute,Redlands, California, USA) was selected as the main geographic information system andEMME/2 (INRO Consultants, Montreal, Canada) as the transport modelling software.
The project was conducted in two phases. Project Phase 1 started in March 1997 and ended inFebruary 1999. Phase 2 started in March 1999 and officially ended in February 2000. How-ever, because of difficulties in communication between the project partners caused by externalcircumstances, the actual work was not completed before March 2001.
Phase 1
The first, and most important, achievement of Phase 1 was the development of an integrated,homogeneous database from a variety of heterogeneous data sources providing all data re-quired for computer-based transport planning in the study area consisting of the followingfour components:
GIS-Based Models and GIS Tools 6
Figure 1. The study area.
GIS-Based Models and GIS Tools 7
- a digital terrain model based on three panchromatic SPOT stereo scenes taken in Octo-ber/November 1997 describing the mountainous relief of almost the entire study area (seeFigure 1) at a very high level of detail and accuracy;
- an integrated and homogeneous road network database containing all major Israeli and Pal-estinian roads in the study area derived from several partial network databases of differentorigins, coordinate systems and precision;
- an integrated system of traffic analysis and land use zones consisting of 104 zones in theWest Bank and 155 zones in Israel extracted from existing sources and made geometricallyhomogeneous with the digital terrain model and the road network database;
- socio-economic data such as population, households, economically active persons, car own-ership, work places and built-up areas.
In addition to the integrated spatial database, a set of models and tools required for sustainabletransport planning in the study area was developed:
- a software interface for the two-way data exchange between the geographic informationsystem ArcInfo and the transport planning package EMME/2 consisting of conversion toolswritten in the ArcInfo macro language AML;
- a meso-meteorological model to predict air flows at an intermediate scale (4x4 km2) for anarea from the Syrian border in the north to Eilat in the south and a subsequent air pollutiondispersion model (1x1 km2) calculating pollution in each grid cell from vehicle emissionsbased on registered vehicle density;
- a tool for selecting road network extensions that minimise a cost function between twopoints consisting of a prototype integrating the digital terrain model and the network datausing constrained Delaunay triangulation and the interactive identification of intermediateor Steiner points.
To lay the ground for the simulation of transport policies in Phase 2 of the project, the rangeof transport policies and their major assets and consequences were analysed. Four categoriesof policies were identified: transport technology policies, transport infrastructure policies,transport regulation policies and transport taxation policies. To take account of synergies (aswell as of negative interactions) between policies, combinations of policies, or 'policy pack-ages', were defined.
In addition, exogenous scenarios reflecting long-term socio-economic trends or policies inother policy fields were identified. Four types of possible exogenous scenarios were identi-fied: political scenarios, economic scenarios, population scenarios and land use scenarios. A'policy scenario' to be simulated with the model system developed in the project is therefore acombination of a political scenario, an economic scenario, a population scenario, a land usescenario and a transport policy package.
The results of Phase 1 were summarised in a report to the Deutsche Forschungsgemeinschaftdated 15 September 1998.
GIS-Based Models and GIS Tools 8
Phase 2
The proposal for Phase 2 proposed an extension of the model framework by submodels forpublic transport and paratransit, freight transport and meso-scale and local environmental im-pacts as well as extensive applications of the extended model framework to a large number ofpolicy scenarios. However, instead of this larger three-year project, only a one-year extensionof the project with a much reduced set of tasks was approved by the DFG.
The only remaining objective of Phase 2 was to complete, test and apply the integrated spatialdatabase and the models and tools developed in Phase 1 to a smaller number of policy sce-narios in order to demonstrate the usefulness and applicability of the developed framework.During Phase 2, the four project partners performed the following tasks:
- The Palestinian partner, the Applied Research Institute of Jerusalem (ARIJ), collaboratedwith the Israeli partner, the Department of Geography of Hebrew University (DG), in final-ising the system of traffic analysis zones (Section 3.2.3) and updating the road network da-tabase to include checkpoints and road links prohibited for Palestinian vehicles (Section3.2.2). In addition, ARIJ extended the digital terrain model developed in Phase 1 to includethe missing north-western part of the West Bank (Section 3.2.1) and updated the demo-graphic data to accommodate the Palestinian census data (Section 3.2.4). In several meet-ings, members of ARIJ and DG discussed and finally agreed on three policy scenarios to besimulated in Phase 2 (Section 3.3.3).
- The Israeli partner, the Department of Geography of Hebrew University, collaborated withARIJ in finalising the system of traffic analysis zones (Section 3.2.3), in updating the roadnetwork database to include checkpoints and road links prohibited for Palestinian vehicles(Section 3.2.2) and in the definition of the three policy scenarios to be simulated (Section3.3.3). Based on the implementation of the three policy scenarios in ArcInfo by IRPUD(Section 3.3.3), DG conducted the simulation of the three policy scenarios using the trans-port model EMME/2 (Section 3.3.4).
- The Institute of Spatial Planning of Dortmund University (IRPUD) extended the softwaremodules of the two-way interface between ArcInfo and EMME/2 to include the new dataitems described above (Section 3.1.2). IRPUD entered the road network updates andchanges of socio-economic and network data for the three policy scenarios provided byARIJ and DG into ArcInfo and, after several iterations and cross-checks, converted them toEMME/2 input format using the ArcInfo-EMME/2 interface (Section 3.3.3). After thesimulation, IRPUD converted the EMME/2 results of the three policy scenarios to ArcInfousing the EMME/2-ArcInfo interface and prepared the result maps presented in this report(Section 3.3.4).
- The Institute of Cartography and Geoinformation of the University of Bonn (IKG) devel-oped the network extension tool (Section 3.1.3) and was in charge of overall project co-ordination.
Communication between all four project partners – besides the personal meetings betweenARIJ and DG – was conducted via e-mail and the common project server maintained at IKG.The planned concluding workshop involving planners and decision makers of both the Pales-tinian and Israeli side was not conducted because of the political situation.
GIS-Based Models and GIS Tools 9
3 Results
The description of the results of the project in this section is structured in three parts. The firstpart (Section 3.1) presents the modelling system developed and used in the project. The sec-ond part (Section 3.2) describes the integrated database. The third part (Section 3.3) presentsthe results of the three policy scenarios. The presentation focuses on the results of Phase 2,results of Phase 1 are referred to only where necessary.
3.1 The Modelling System
The integrated modelling system originally envisaged and partially developed in Phase 1 ofthe project was more comprehensive than the one actually used in Phase 2. In order to explainthe context of the components actually used, first the intended analytical framework is pre-sented (Section 3.1.1). Subsequently, the modules implemented and used in Phase 2 are pre-sented: the interface between ArcInfo and EMME/2 (Section 3.1.2) and the network analysistool (Section 3.1.3).
3.1.1 Analytical Framework
During Phase 1 of the project, an integrated model system for forecasting environmental im-pacts of transport policy scenarios in the study area was developed.
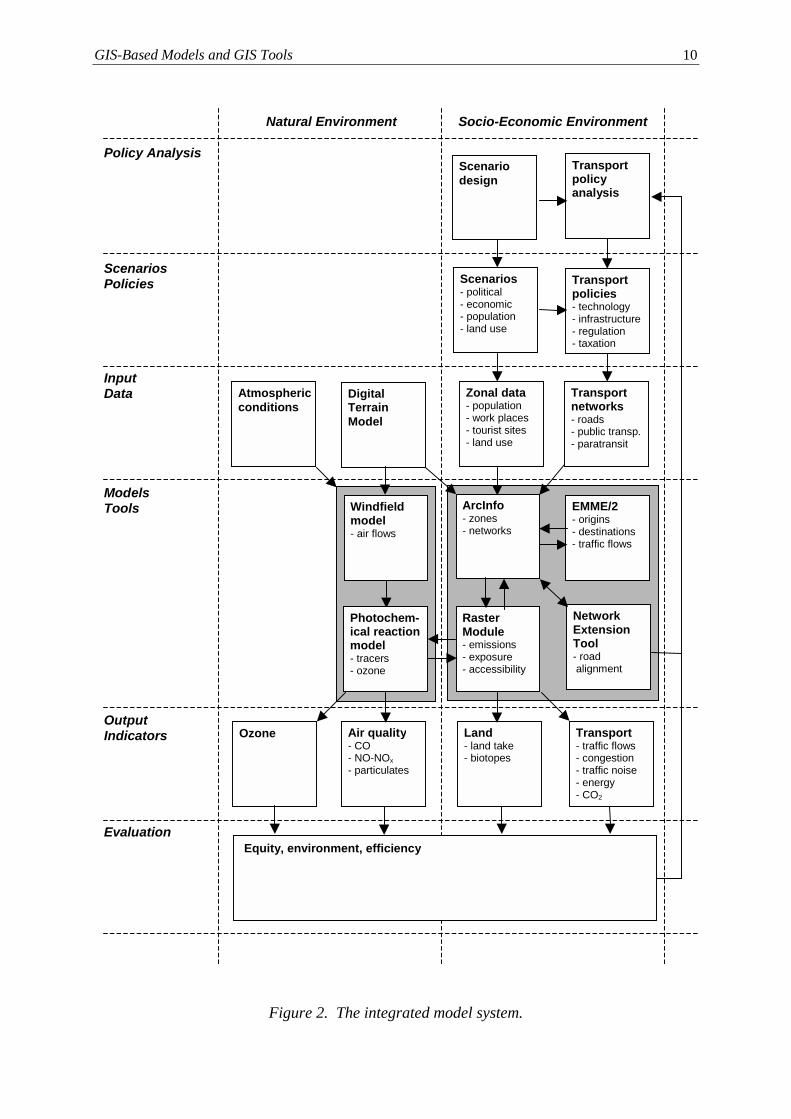
Figure 2 is a diagrammatic representation of the structure of the proposed system of modelsand tools as seen from the perspective of the user. Transport policies are entered at the PolicyAnalysis level subject to assumptions about political, economic, population and land use sce-narios and are modelled using the integrated model system. The results of the simulations areconverted to raster cells for processing in air quality or traffic noise models or to the triangu-lation used for the design of network extensions. The indicators produced by the transportmodel and the environmental sub-models are evaluated with respect to sustainability criteriasuch as equity, environment and efficiency.
The components of the integrated model system are:
- ArcInfo. The geographical information system ArcInfo (Environmental Systems ResearchInstitute, Redlands, California, USA) is used to maintain, edit, plot and facilitate the spatialdatabase. In that, ArcInfo serves as the core tool of the modelling system providing and re-ceiving data to and from other (sub-)models, such as EMME/2, the Network Extension Tooland the Raster Module.
- EMME/2. The transport simulation model EMME/2 (INRO Consultants, Montreal, Canada)is used to model the specified scenarios to derive information on traffic flows, congestionand travel times.
- Raster Module. The results of the simulations are converted into ArcInfo format from whichthey are converted to raster cells for further processing in the Raster Module. This module isdesigned to simulate social and environmental impacts of the transport flows modelled.
GIS-Based Models and GIS Tools 10
Figure 2. The integrated model system.
Policy Analysis
ScenariosPolicies
InputData
ModelsTools
OutputIndicators
Evaluation
Scenariodesign
Transportpolicyanalysis
Scenarios- political- economic- population- land use
Transportpolicies- technology- infrastructure- regulation- taxation
Atmosphericconditions
DigitalTerrainModel
Zonal data- population- work places- tourist sites- land use
Transportnetworks- roads- public transp.- paratransit
Windfieldmodel- air flows
ArcInfo- zones- networks
EMME/2- origins- destinations- traffic flows
RasterModule- emissions- exposure- accessibility
NetworkExtensionTool- road alignment
Ozone Air quality- CO- NO-NOx- particulates
Transport- traffic flows- congestion- traffic noise- energy- CO2
Land- land take- biotopes
Equity, environment, efficiency
Natural Environment Socio-Economic Environment
Photochem-ical reactionmodel- tracers- ozone
GIS-Based Models and GIS Tools 11
- Network Extension Tool. Based on information provided by ArcInfo, the Network ExtensionTool determines road optimum alignments for new road projects. The tool minimises a costfunction between two or more locations by (i) integrating the digital terrain model and thenetwork data by constrained Delaunay triangulation and (ii) automatic identification of in-termediate or Steiner points.
- Windfield Model. A meso-meteorological model was developed to predict wind flows on anintermediate scale based on equations for horizontal motion, continuity, temperature andrelative humidity within the atmosphere.
- Photochemical Reaction Model. This model simulates trace movements and photochemicalreactions leading to ozone concentrations.
The indicators produced by the integrated model system are finally evaluated with respect tosustainability, i.e. with respect to equity, environment and efficiency.
Because of reduced time frame of Phase 2, of the above comprehensive modelling framework,only the interface between ArcInfo and EMME/2 and the network extension tool were im-plemented in Phase 2 of the project. They are described below.
3.1.2 Interface between ArcInfo and EMME/2
In order to take advantage of the superior data organisation of geographic information sys-tems, a software interface for the two-way exchange of data between ArcInfo and EMME/2was developed. The software performs two-way conversion between the different representa-tions of network and zonal data of the two software packages. The interface consists of thefollowing four conversion tools written in the ArcInfo Macro Language (AML):
- The macro arc2emme performs the transfer of network data from an ArcInfo coverage toEMME/2 batch file format
- The macro emme2arc performs the conversion of EMME/2 network data from EMME/2batch file format to an ARC/INFO coverage.
- The macro tab2matrix converts ARC/INFO Polygon Attribute Tables (PAT) to EMME/2origin or destination matrices.
- The macro matrix2tab converts EMME/2 origin, destination and origin-destination matricesto ARC/INFO Polygon Attribute Tables (PAT).
All conversion operations preserve all relevant information and attributes throughout thetransformation process. All macros are executed from the Arc prompt within ArcInfo. Twoadditional macros serve as shell for the conversion tools:
- The macro trnets controls conversion from ArcInfo to EMME/2. It extracts scenario datafrom the ArcInfo database and calls the macros to convert them to EMME/2 format.
- The macro putback controls conversion from EMME/2 to ArcInfo. It extracts EMME/2 re-sults from the EMME/2 database and calls the macros to convert them to ArcInfo format.
GIS-Based Models and GIS Tools 12
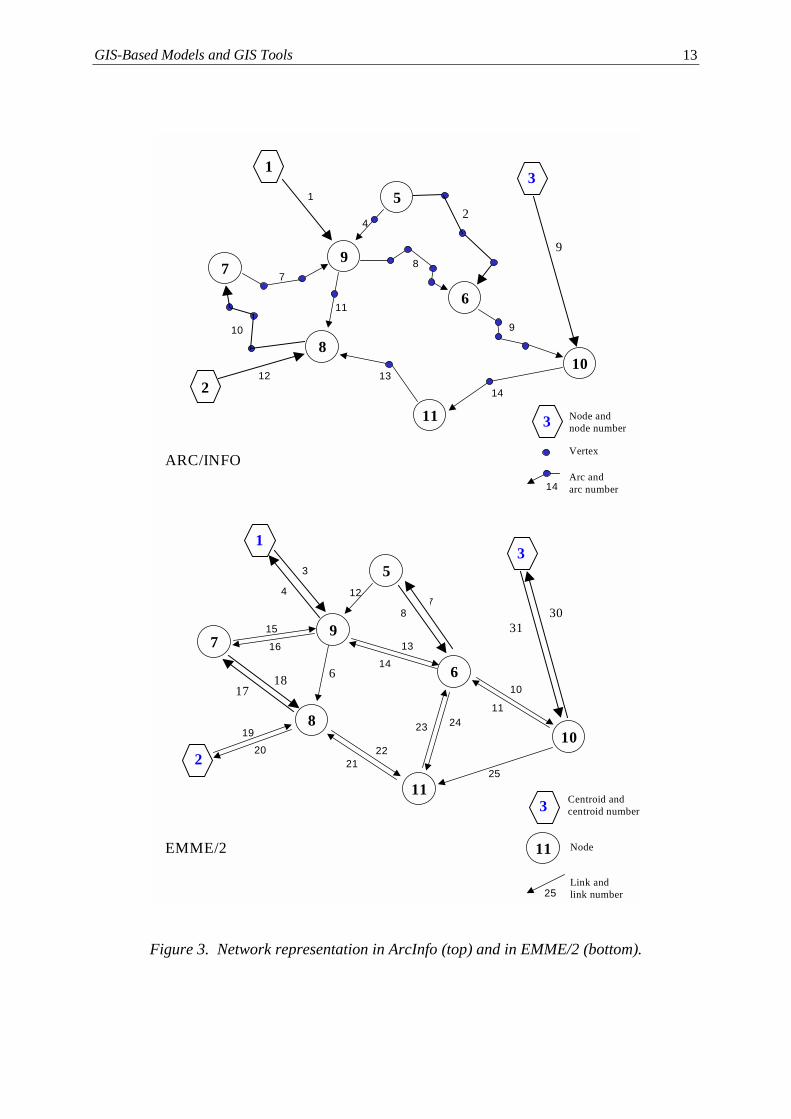
The macros take account of different approaches of network representation within ArcInfoand EMME/2. A road network in ArcInfo consists of nodes and links. The alignment of thelinks can be described in great detail with up to 500 intermediate vertices (Figure 3, top). TheArcInfo network is based on real-world co-ordinates. Information about the network can beoverlaid with other geographic information (e.g. land use). The user can design her own net-work information system with a relational database management system. Every spatial ele-ment has an attribute table with a set of predefined items used by the system. This table canbe expanded with user-defined items.
The EMME/2 network, too, consists of nodes and links (see Figure 3, bottom). However, theEMME/2 network is only a generalised representation of the real network. The geographicposition of the nodes is not defined in real-world co-ordinates, and the links do not representthe alignment between nodes. The whole network can be established in a model-specific co-ordinate system. Each link has its own attributes (e.g. number of lanes or travel time). Everyelement of the network has a special set of attributes. Moreover, collections of links such astransit lines may be defined. All roads - except one-way roads - are represented by two links.Nodes, links, turns and transit lines may have up to three additional user-defined attributes.
The comparison of the two network representations of ArcInfo and EMME/2 in Figure 3shows that the network in ArcInfo is more detailed. Furthermore, ArcInfo links are not as-signed a specific direction in terms of driving directions (of course, ArcInfo uses internal arcorientation as well) whereas in EMME/2 each link is attributed with a direction. The ArcInfodata model does not limit the number of attributes associated with a data item.
When building an interface between ArcInfo and EMME/2, two main implications have to besolved: the way links are represented and network aggregation and conflation:
- Network representation. By transferring the network from ArcInfo to EMME/2 each two-way ArcInfo link is represented as two one-way links in EMME/2. In addition, the attributesassociated with the two directions have to be transferred to the two links in EMME/2. Forthe reverse case, when results of EMME/2 are to be transferred to ArcInfo, the attributes ofthe two EMME/2 links must be transferred to one arc in ArcInfo. Different values for bothdirections must be stored in two items in the Arc Attribute Table.
- Network aggregation and conflation. Building a transport information system for the studyarea involves a detailed road network where all sorts of roads are stored in the GIS. For thepurpose of transport modelling, however, it is sufficient to consider major roads between thetransport zones only. Therefore, a network aggregation process is required before the net-work can be converted from ArcInfo to EMME/2. From the complete network with variouscategories of roads so-called ‘strategic links’ are selected (step 1), i.e. the most importantroad links in the study area. These strategic links are transferred to a new coverage, whereasthe remaining road categories are excluded (step 2). In the third and final step redundantnodes, i.e. nodes without intersections or changes in attribute characteristics are deleted be-fore the network is transferred from ArcInfo to EMME/2 (step 3). When re-converting re-sults of EMME/2 to ArcInfo, the same steps must be performed in the reverse direction. Theresults of EMME/2 have to be converted first to the aggregated ArcInfo coverage and thenin a second step to the original full road network. This process is called conflation.
GIS-Based Models and GIS Tools 13
Figure 3. Network representation in ArcInfo (top) and in EMME/2 (bottom).
10
7
5
8
9
6
11
1
4
78
910
11
12 1314
Node andnode number
Vertex
Arc andarc number
10
7
5
8
9
6
11
3
47
8
10
11
12
13
14
15
16
1920
2122
23 24
25
11 Node
Link andlink number
Centroid andcentroid number
ARC/INFO
EMME/2
14
25
9
2
3031
1718 6
31
2
3
3
31
2
GIS-Based Models and GIS Tools 14
3.1.3 Network Extension Tool
The aim of the network extension tool is to connect multiple locations with least constructionand travel cost. Shortest-path algorithms are not suitable to connect more than two locations.The proposed network extension tool introduces Steiner points, additional vertices to the net-work. Finding optimal Steiner Points is known to be NP-hard, i.e. algorithms which guaranteeoptimal solutions are exponential in the worst case. Thus powerful heuristics are needed.
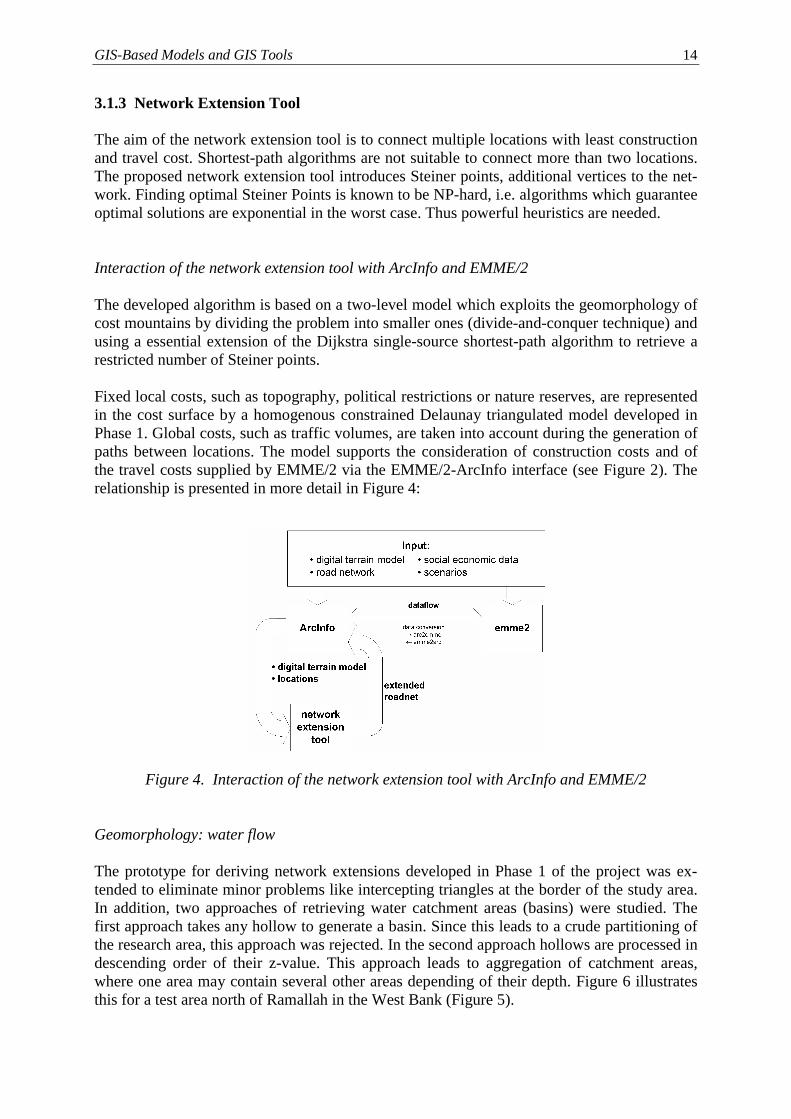
Interaction of the network extension tool with ArcInfo and EMME/2
The developed algorithm is based on a two-level model which exploits the geomorphology ofcost mountains by dividing the problem into smaller ones (divide-and-conquer technique) andusing a essential extension of the Dijkstra single-source shortest-path algorithm to retrieve arestricted number of Steiner points.
Fixed local costs, such as topography, political restrictions or nature reserves, are representedin the cost surface by a homogenous constrained Delaunay triangulated model developed inPhase 1. Global costs, such as traffic volumes, are taken into account during the generation ofpaths between locations. The model supports the consideration of construction costs and ofthe travel costs supplied by EMME/2 via the EMME/2-ArcInfo interface (see Figure 2). Therelationship is presented in more detail in Figure 4:
Figure 4. Interaction of the network extension tool with ArcInfo and EMME/2
Geomorphology: water flow
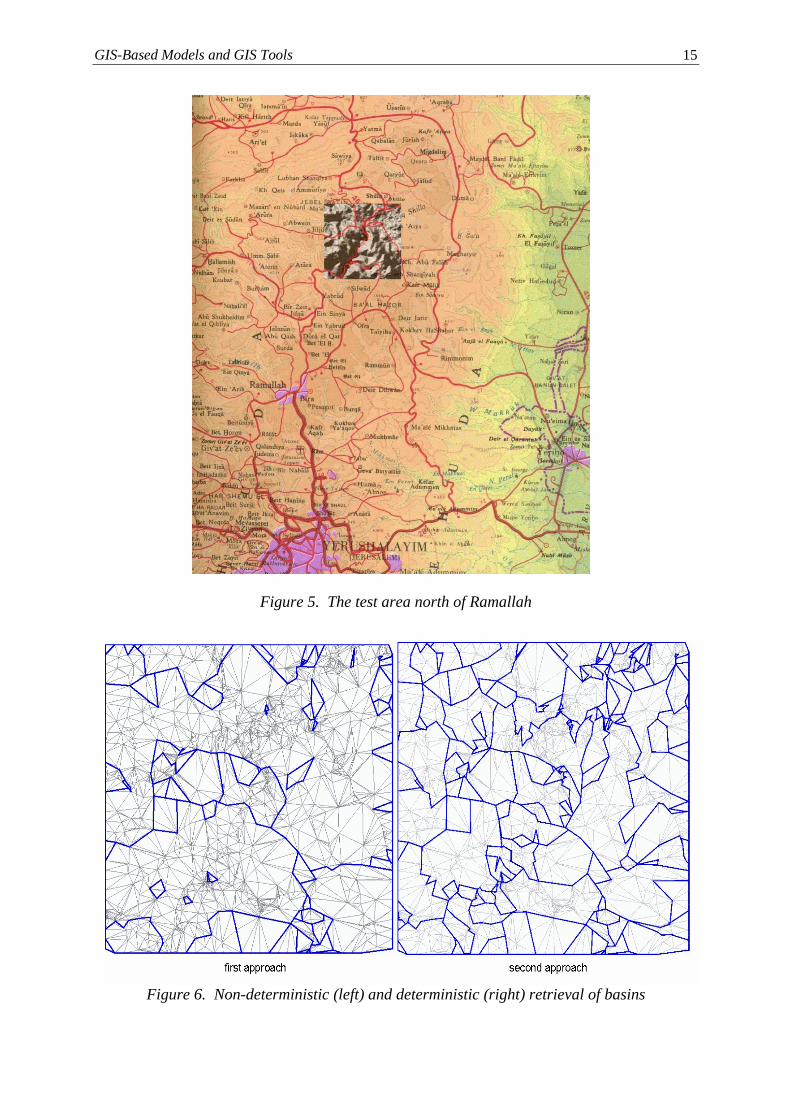
The prototype for deriving network extensions developed in Phase 1 of the project was ex-tended to eliminate minor problems like intercepting triangles at the border of the study area.In addition, two approaches of retrieving water catchment areas (basins) were studied. Thefirst approach takes any hollow to generate a basin. Since this leads to a crude partitioning ofthe research area, this approach was rejected. In the second approach hollows are processed indescending order of their z-value. This approach leads to aggregation of catchment areas,where one area may contain several other areas depending of their depth. Figure 6 illustratesthis for a test area north of Ramallah in the West Bank (Figure 5).
GIS-Based Models and GIS Tools 15
Figure 5. The test area north of Ramallah
Figure 6. Non-deterministic (left) and deterministic (right) retrieval of basins
GIS-Based Models and GIS Tools 16
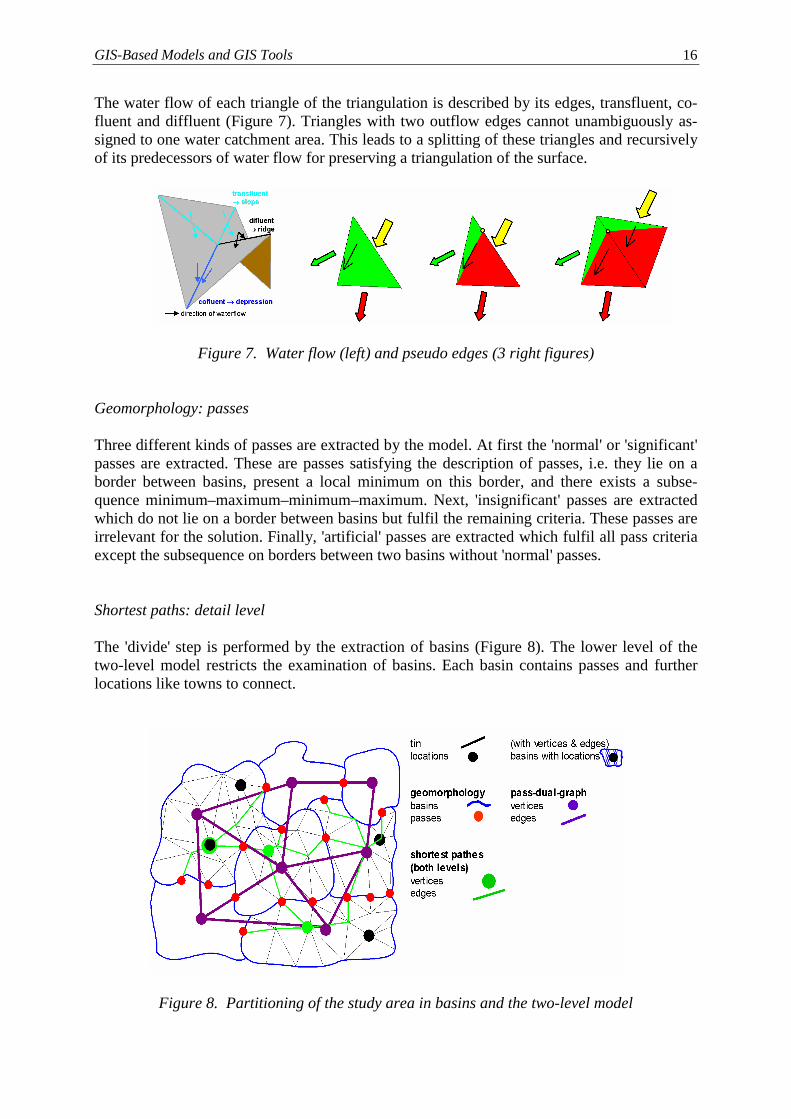
The water flow of each triangle of the triangulation is described by its edges, transfluent, co-fluent and diffluent (Figure 7). Triangles with two outflow edges cannot unambiguously as-signed to one water catchment area. This leads to a splitting of these triangles and recursivelyof its predecessors of water flow for preserving a triangulation of the surface.
Figure 7. Water flow (left) and pseudo edges (3 right figures)
Geomorphology: passes
Three different kinds of passes are extracted by the model. At first the 'normal' or 'significant'passes are extracted. These are passes satisfying the description of passes, i.e. they lie on aborder between basins, present a local minimum on this border, and there exists a subse-quence minimum–maximum–minimum–maximum. Next, 'insignificant' passes are extractedwhich do not lie on a border between basins but fulfil the remaining criteria. These passes areirrelevant for the solution. Finally, 'artificial' passes are extracted which fulfil all pass criteriaexcept the subsequence on borders between two basins without 'normal' passes.
Shortest paths: detail level
The 'divide' step is performed by the extraction of basins (Figure 8). The lower level of thetwo-level model restricts the examination of basins. Each basin contains passes and furtherlocations like towns to connect.
Figure 8. Partitioning of the study area in basins and the two-level model
GIS-Based Models and GIS Tools 17
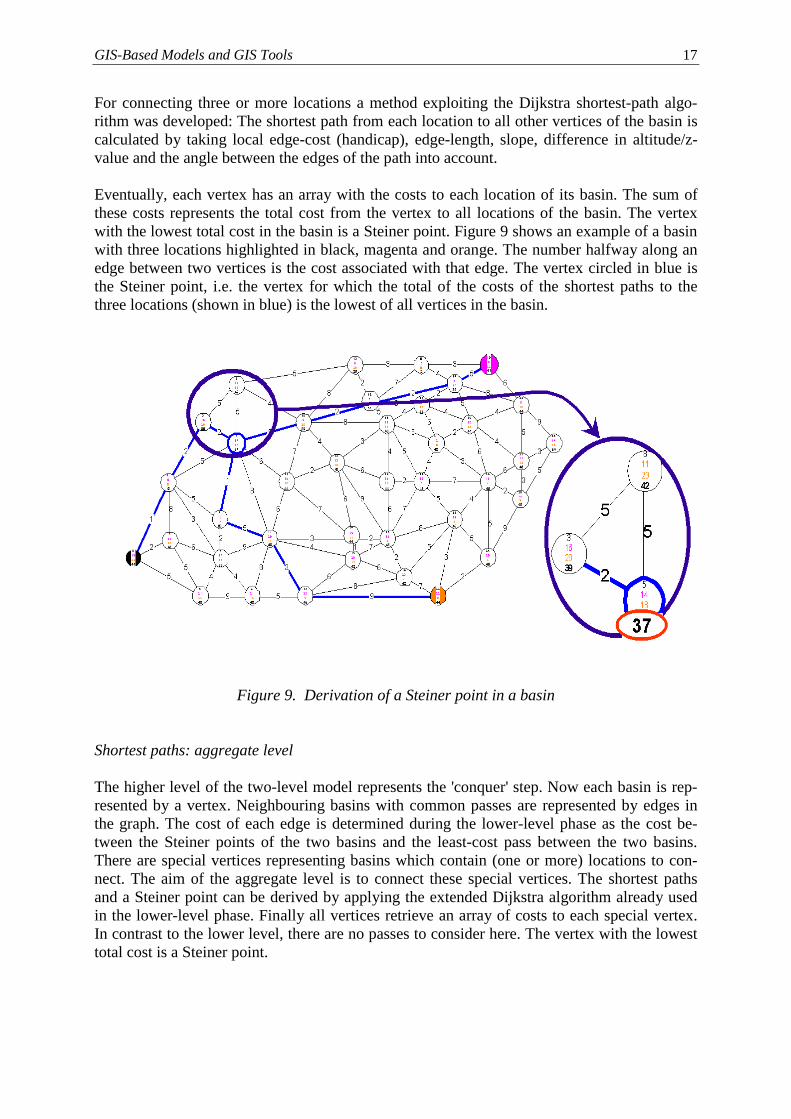
For connecting three or more locations a method exploiting the Dijkstra shortest-path algo-rithm was developed: The shortest path from each location to all other vertices of the basin iscalculated by taking local edge-cost (handicap), edge-length, slope, difference in altitude/z-value and the angle between the edges of the path into account.
Eventually, each vertex has an array with the costs to each location of its basin. The sum ofthese costs represents the total cost from the vertex to all locations of the basin. The vertexwith the lowest total cost in the basin is a Steiner point. Figure 9 shows an example of a basinwith three locations highlighted in black, magenta and orange. The number halfway along anedge between two vertices is the cost associated with that edge. The vertex circled in blue isthe Steiner point, i.e. the vertex for which the total of the costs of the shortest paths to thethree locations (shown in blue) is the lowest of all vertices in the basin.
Figure 9. Derivation of a Steiner point in a basin
Shortest paths: aggregate level
The higher level of the two-level model represents the 'conquer' step. Now each basin is rep-resented by a vertex. Neighbouring basins with common passes are represented by edges inthe graph. The cost of each edge is determined during the lower-level phase as the cost be-tween the Steiner points of the two basins and the least-cost pass between the two basins.There are special vertices representing basins which contain (one or more) locations to con-nect. The aim of the aggregate level is to connect these special vertices. The shortest pathsand a Steiner point can be derived by applying the extended Dijkstra algorithm already usedin the lower-level phase. Finally all vertices retrieve an array of costs to each special vertex.In contrast to the lower level, there are no passes to consider here. The vertex with the lowesttotal cost is a Steiner point.
GIS-Based Models and GIS Tools 18
Running time
The running time of deriving Steiner points at the detail level is O(vb² lb) per basin, where vbrepresents the number of vertices and lb the number of locations, passes included, per basin.At the aggregate level the running time for deriving Steiner points is O(b² lh), where b repre-sents the number of basins and lh the number of locations. The total running time is O(b² lh +b (vb² lb)) plus the running time of the extraction of the geomorphology O(vt), where vt is thetotal number of vertices. Thus the running time is O(vt
4) in the worst case.
Interfaces
Since the digital terrain model (DTM) data of the project are held in ArcInfo, the networkextension tool supports the import of triangulated irregular network (TIN) data in ArcInfo'snet-file format. Parameters, such as the weights of edge length, slope factor and angle factorand which nodes are to be connected are imported as well.
The results of the network extension tool, the extended networks, are exported to ArcInfoemploying the concept of simple features, a standardised interoperable data format defined byOpenGIS (Open GIS Consortium).
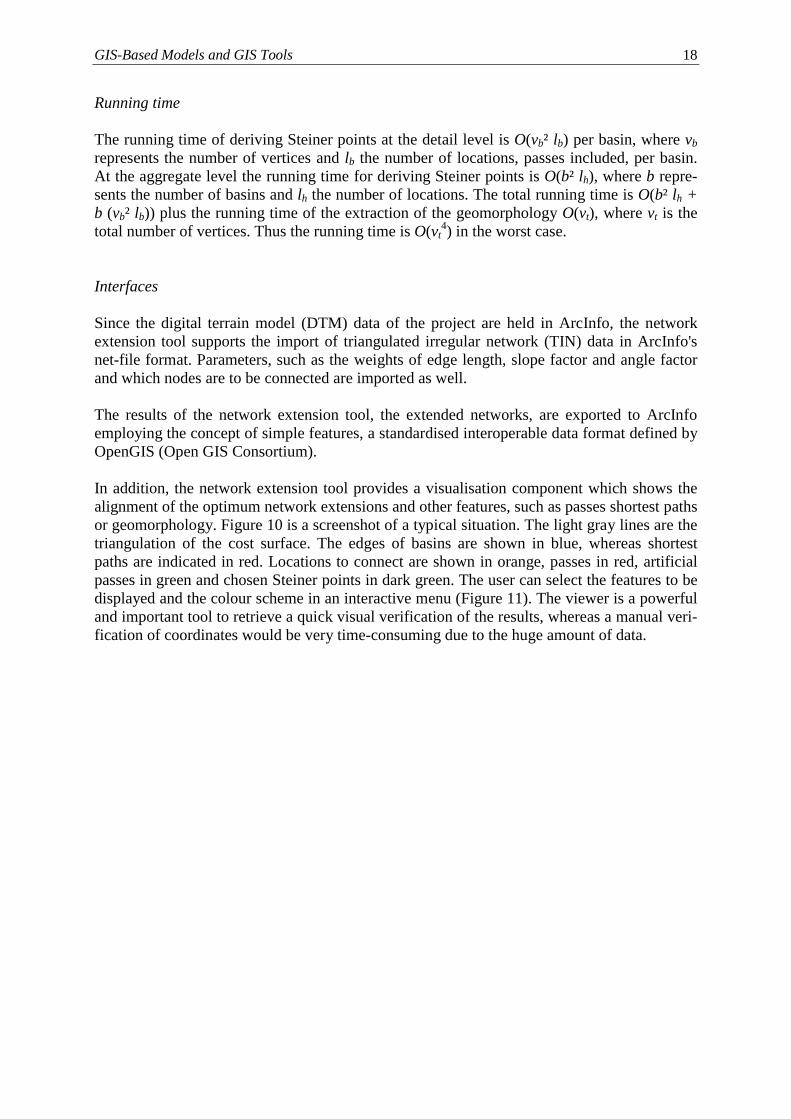
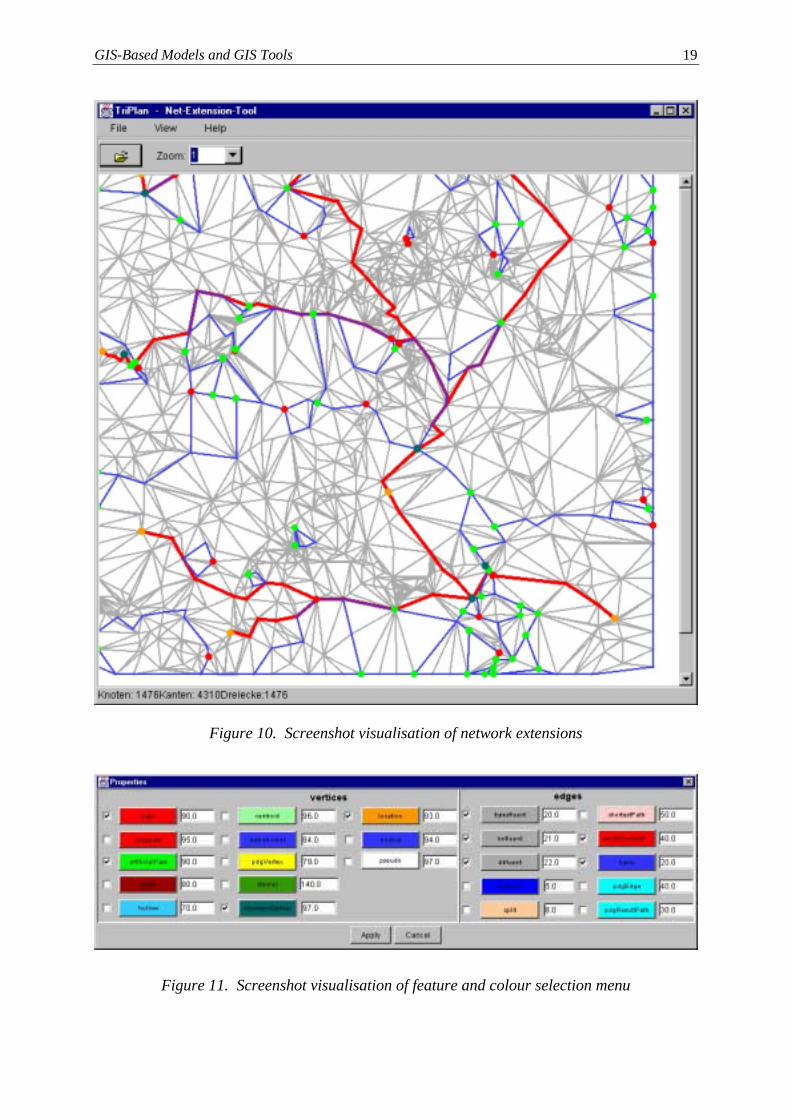
In addition, the network extension tool provides a visualisation component which shows thealignment of the optimum network extensions and other features, such as passes shortest pathsor geomorphology. Figure 10 is a screenshot of a typical situation. The light gray lines are thetriangulation of the cost surface. The edges of basins are shown in blue, whereas shortestpaths are indicated in red. Locations to connect are shown in orange, passes in red, artificialpasses in green and chosen Steiner points in dark green. The user can select the features to bedisplayed and the colour scheme in an interactive menu (Figure 11). The viewer is a powerfuland important tool to retrieve a quick visual verification of the results, whereas a manual veri-fication of coordinates would be very time-consuming due to the huge amount of data.
GIS-Based Models and GIS Tools 19
Figure 10. Screenshot visualisation of network extensions
Figure 11. Screenshot visualisation of feature and colour selection menu
GIS-Based Models and GIS Tools 20
3.2 The Integrated Database
The integrated database for computer-based transport planning developed in Phase 1 of theproject consisted of four components:
- a digital terrain model based on three panchromatic SPOT stereo scenes taken in Octo-ber/November 1997 describing the mountainous relief of almost the entire study area at avery high level of detail and accuracy;
- an integrated and homogeneous road network database containing all major Israeli and Pal-estinian roads in the study area derived from several partial network databases of differentorigins, coordinate systems and precision;
- an integrated system of traffic analysis and land use zones consisting of 116 zones in theWest Bank and 155 zones in Israel extracted from existing sources and made geometricallyhomogeneous with the digital terrain model and the road network database;
- socio-economic data such as population, households, economically active persons, car own-ership, work places and built-up areas.
This database was described in the report on Phase 1. In this section, only the updates of thedatabase necessary to conduct the scenario simulations presented in Section 3.3 will be de-scribed.
3.2.1 Digital Terrain Model
The digital terrain model developed in Phase 1 of the project was processed to accommodatefor the missed section in the north-western part of the West Bank. Appendix 4 explains thetechnical procedure followed to produce and integrate the DTM.
The DTM developed in Phase 1 was extracted from three stereo pairs SPOT scenes acquiredfor the year 1997. Unfortunately, the three scenes did not cover the north-western part of theWest Bank. The integration of the whole area was carried out in Phase 2. The missing datawere substituted from contour maps that were digitised and registered in the GIS projectionused for the other maps in the project (UTM WGS84). The integration of the data involvedthree major steps. The first step was cleaning the digitised contours for the missing area. Thesecond step involved creating a grid out from the cleaned contours using the GRID functionof ArcInfo. The third step was linking the new grid to the DTM developed in Phase 1. Theresolution of the new DTM is 20 metres. Because the contours for the missing area are 20metres in resolution, it was considered important to adopt this resolution for the whole DTM.
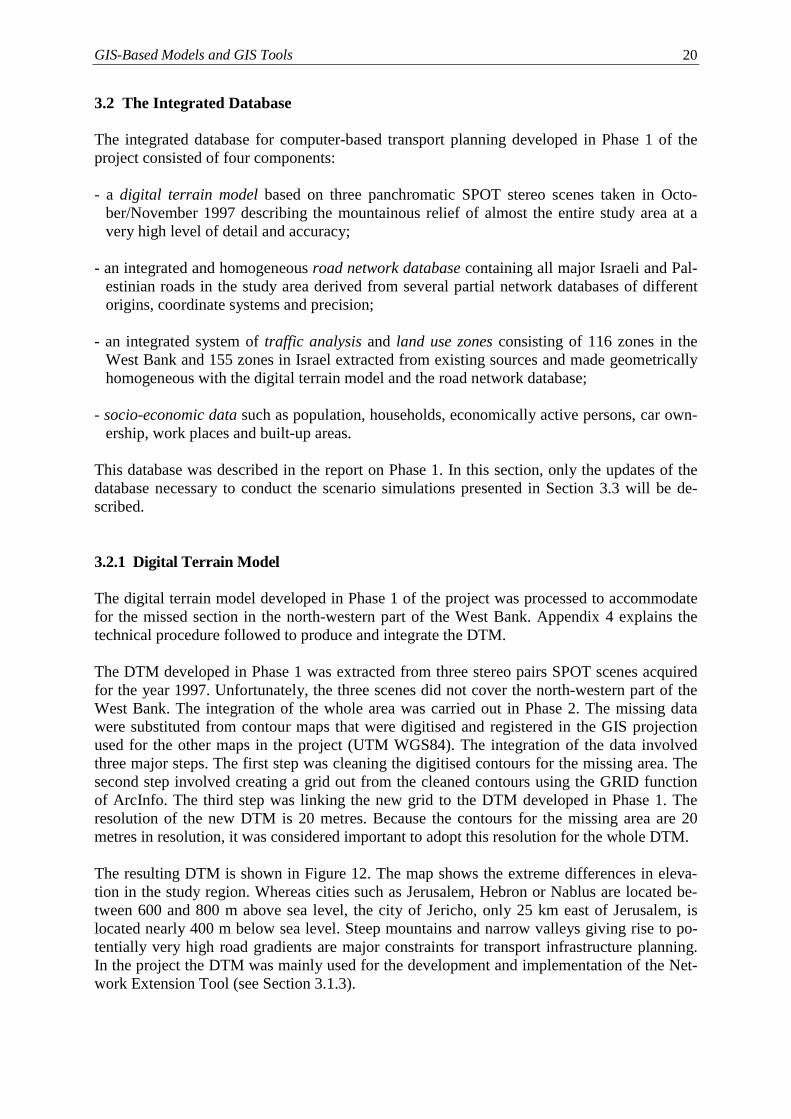
The resulting DTM is shown in Figure 12. The map shows the extreme differences in eleva-tion in the study region. Whereas cities such as Jerusalem, Hebron or Nablus are located be-tween 600 and 800 m above sea level, the city of Jericho, only 25 km east of Jerusalem, islocated nearly 400 m below sea level. Steep mountains and narrow valleys giving rise to po-tentially very high road gradients are major constraints for transport infrastructure planning.In the project the DTM was mainly used for the development and implementation of the Net-work Extension Tool (see Section 3.1.3).
GIS-Based Models and GIS Tools 21
Figure 12. The digital terrain model
GIS-Based Models and GIS Tools 22
3.2.2 Road Network Data
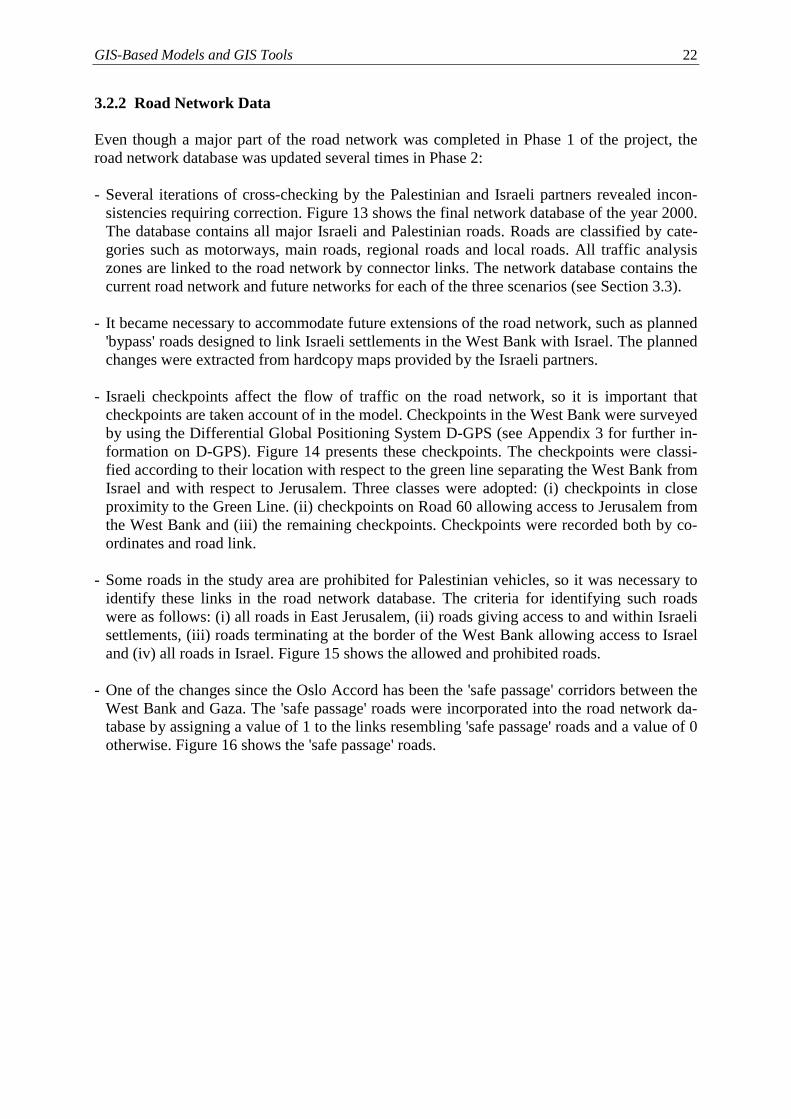
Even though a major part of the road network was completed in Phase 1 of the project, theroad network database was updated several times in Phase 2:
- Several iterations of cross-checking by the Palestinian and Israeli partners revealed incon-sistencies requiring correction. Figure 13 shows the final network database of the year 2000.The database contains all major Israeli and Palestinian roads. Roads are classified by cate-gories such as motorways, main roads, regional roads and local roads. All traffic analysiszones are linked to the road network by connector links. The network database contains thecurrent road network and future networks for each of the three scenarios (see Section 3.3).
- It became necessary to accommodate future extensions of the road network, such as planned'bypass' roads designed to link Israeli settlements in the West Bank with Israel. The plannedchanges were extracted from hardcopy maps provided by the Israeli partners.
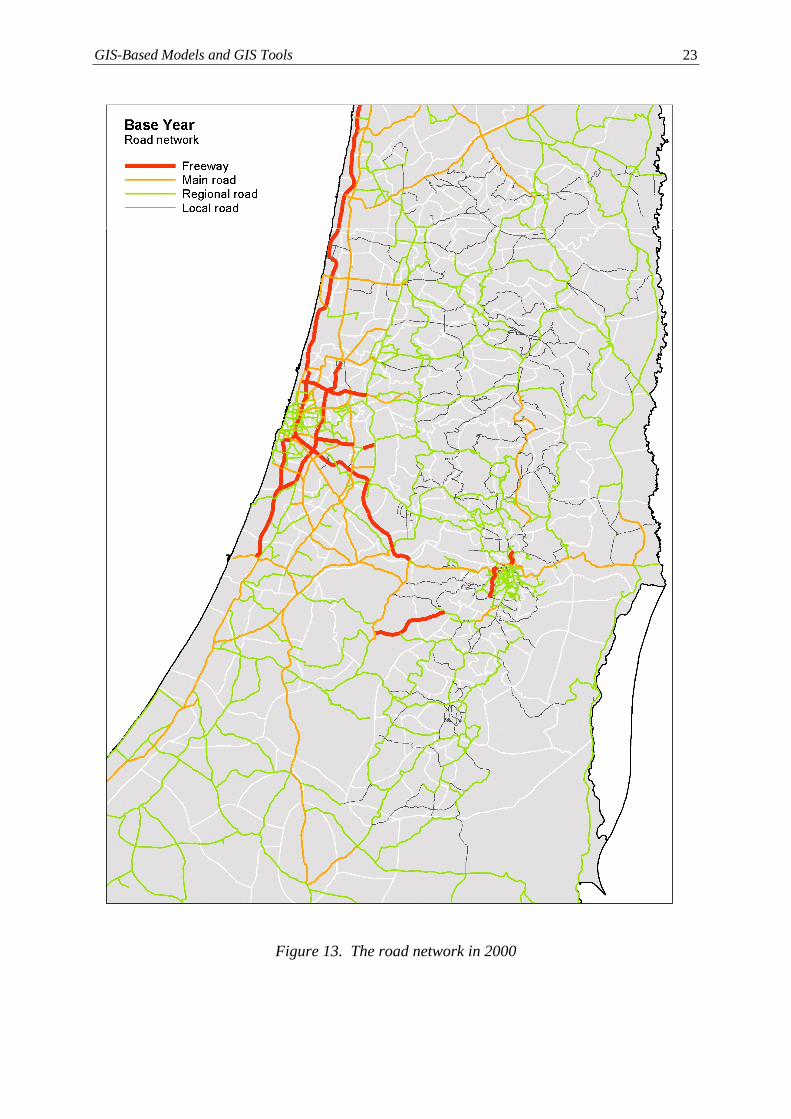
- Israeli checkpoints affect the flow of traffic on the road network, so it is important thatcheckpoints are taken account of in the model. Checkpoints in the West Bank were surveyedby using the Differential Global Positioning System D-GPS (see Appendix 3 for further in-formation on D-GPS). Figure 14 presents these checkpoints. The checkpoints were classi-fied according to their location with respect to the green line separating the West Bank fromIsrael and with respect to Jerusalem. Three classes were adopted: (i) checkpoints in closeproximity to the Green Line. (ii) checkpoints on Road 60 allowing access to Jerusalem fromthe West Bank and (iii) the remaining checkpoints. Checkpoints were recorded both by co-ordinates and road link.
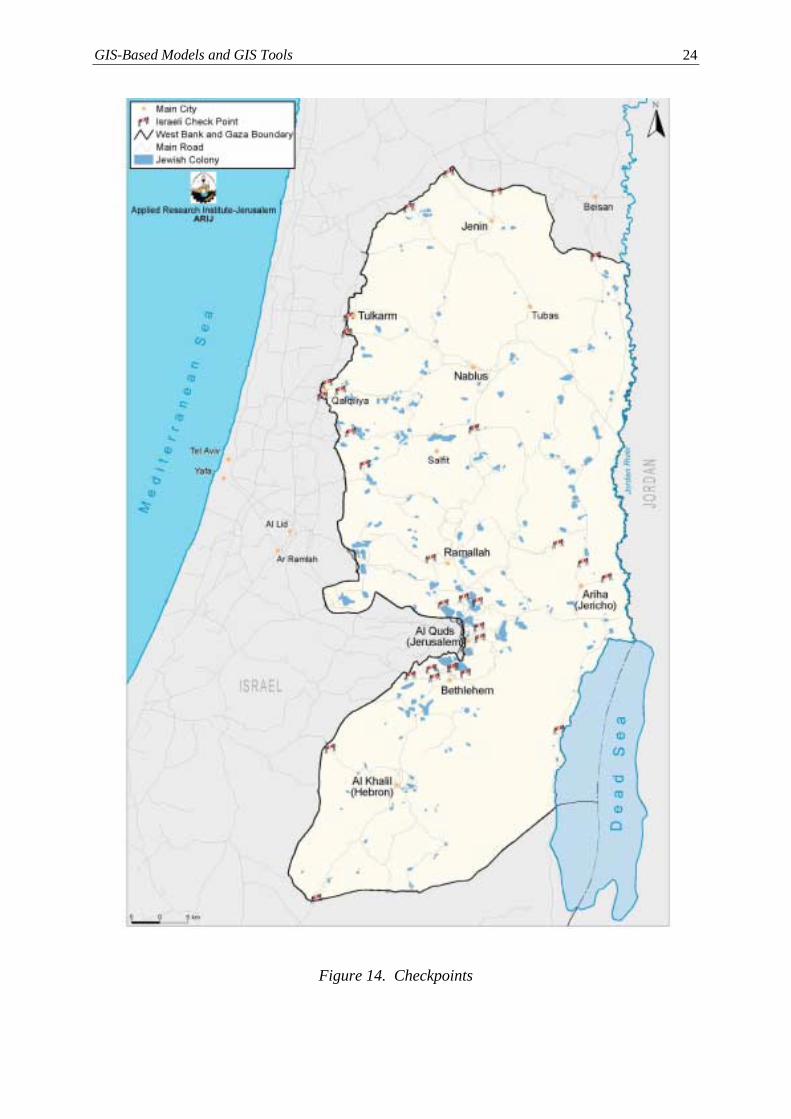
- Some roads in the study area are prohibited for Palestinian vehicles, so it was necessary toidentify these links in the road network database. The criteria for identifying such roadswere as follows: (i) all roads in East Jerusalem, (ii) roads giving access to and within Israelisettlements, (iii) roads terminating at the border of the West Bank allowing access to Israeland (iv) all roads in Israel. Figure 15 shows the allowed and prohibited roads.
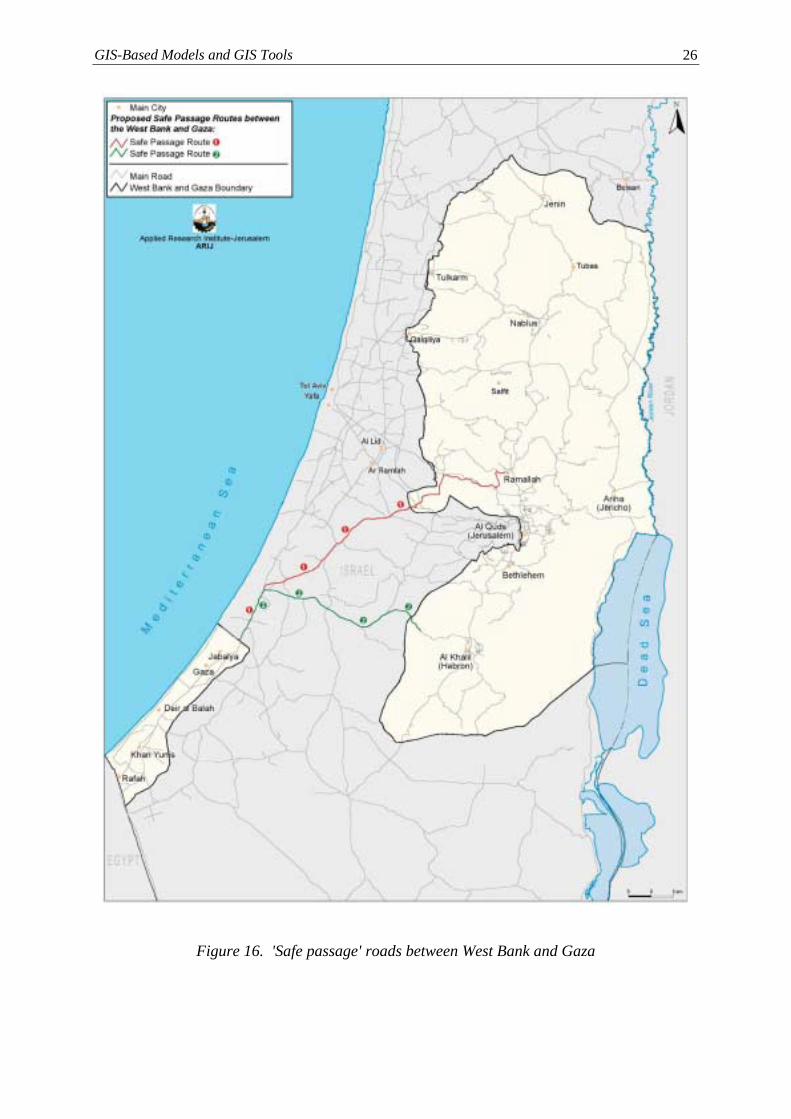
- One of the changes since the Oslo Accord has been the 'safe passage' corridors between theWest Bank and Gaza. The 'safe passage' roads were incorporated into the road network da-tabase by assigning a value of 1 to the links resembling 'safe passage' roads and a value of 0otherwise. Figure 16 shows the 'safe passage' roads.
GIS-Based Models and GIS Tools 23
Figure 13. The road network in 2000
GIS-Based Models and GIS Tools 24
Figure 14. Checkpoints
GIS-Based Models and GIS Tools 25
Figure 15. Roads prohibited to Palestinian vehicles
GIS-Based Models and GIS Tools 26
Figure 16. 'Safe passage' roads between West Bank and Gaza
GIS-Based Models and GIS Tools 27
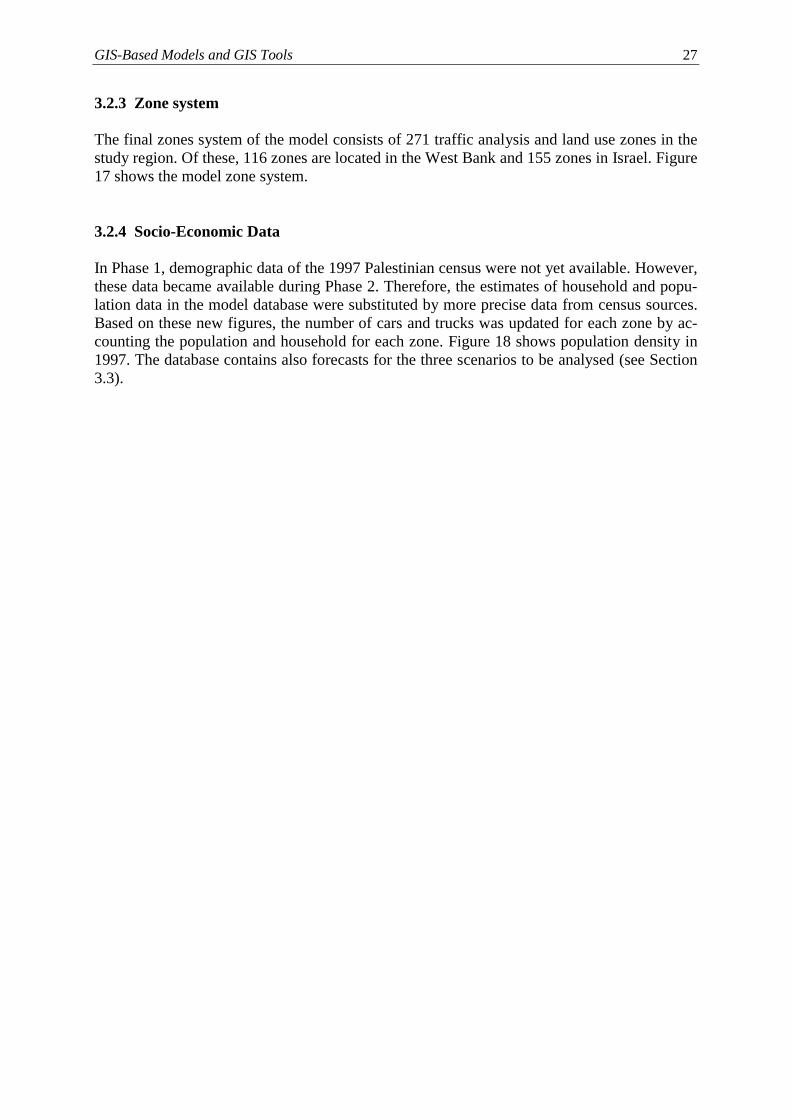
3.2.3 Zone system
The final zones system of the model consists of 271 traffic analysis and land use zones in thestudy region. Of these, 116 zones are located in the West Bank and 155 zones in Israel. Figure17 shows the model zone system.
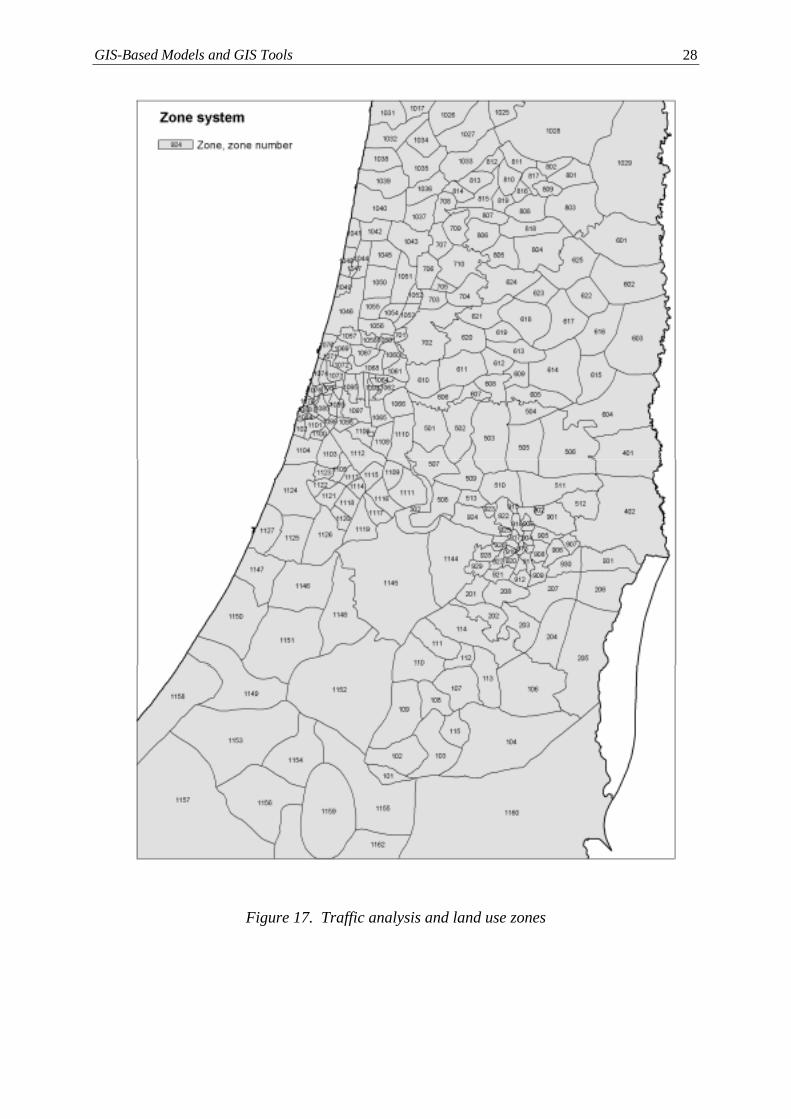
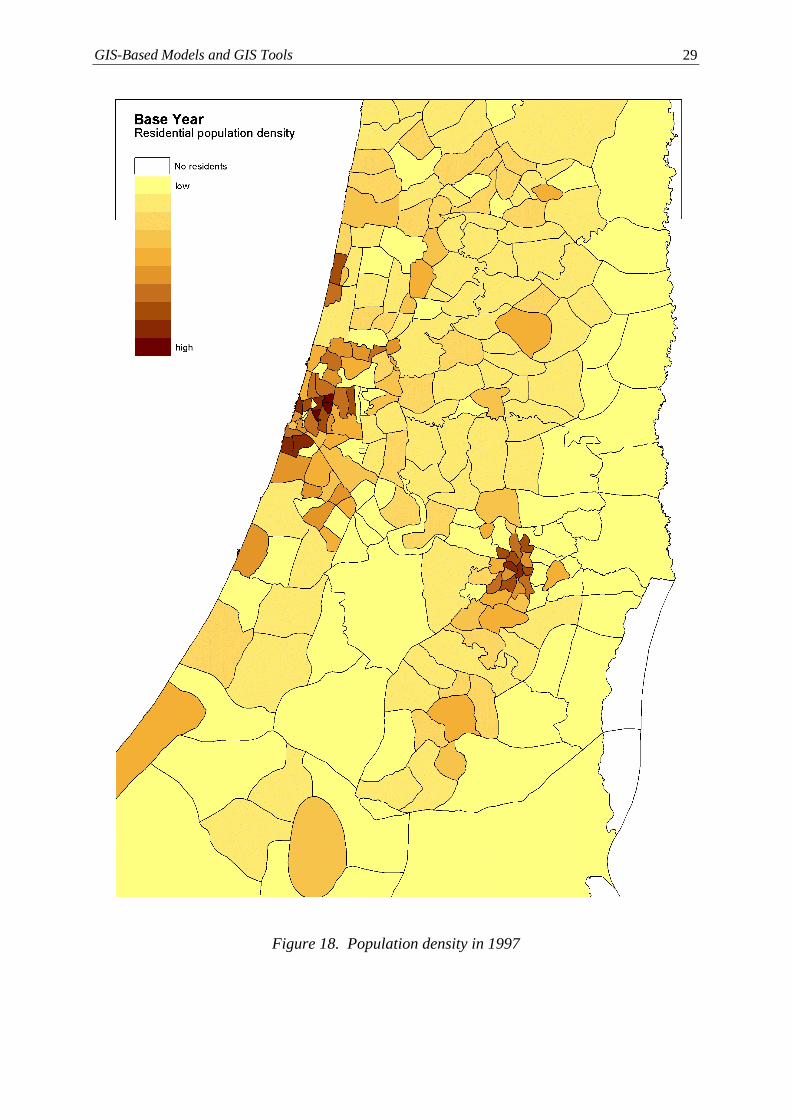
3.2.4 Socio-Economic Data
In Phase 1, demographic data of the 1997 Palestinian census were not yet available. However,these data became available during Phase 2. Therefore, the estimates of household and popu-lation data in the model database were substituted by more precise data from census sources.Based on these new figures, the number of cars and trucks was updated for each zone by ac-counting the population and household for each zone. Figure 18 shows population density in1997. The database contains also forecasts for the three scenarios to be analysed (see Section3.3).
GIS-Based Models and GIS Tools 28
Figure 17. Traffic analysis and land use zones
GIS-Based Models and GIS Tools 29
Figure 18. Population density in 1997

GIS-Based Models and GIS Tools 30
3.3 Policy Scenarios and Simulation Results
In this section the results of first pilot applications of the modelling system developed in theproject are presented. The presentation proceeds in four steps. After a brief presentation of thebackground of scenario building (Section 3.3.1), the three policy scenarios defined are pre-sented (Section 3.3.2). Section 3.3.3 explains how the policy scenarios were translated intomodel input data. Finally, the simulation results are presented in Section 3.3.4).
3.3.1 Background
Scenarios are "images of the future" which can be used to anticipate impacts of situations inthe future. Scenarios are sometimes mistaken to be forecasts of the future. They are not andshould not be used as such. Scenarios can only be used as forecasts if the probability of theirbecoming real is given. As a description of one of many possible future situations, a scenariois used to assess answer questions, such as "What will happen, given the background definedin the scenario?" The scenario planning approach does not produce a forecast but assumesone. Scenario building is instrumental in 'imagining' the future environment so that its impactscan be discussed.
The image of the future is an outcome of numerous factors which can be classified, amongothers by the degree to which professionals and decision makers in transport planning andpolicy have the ability to intervene or affect transport policy or other related policies. Clearly,the future of the peace process in Israel and Palestine does not belong to the policy fieldtransport planners can influence. However, policies regarding the level of public transportsupply fall within the jurisdiction of transport planners. This distinction is of relevance whenscenarios are used for policy analysis.
As will be shown below, the number of possible scenarios is a function of the number of di-mensions and the number of values assumed for each dimension. As the costs of performinganalyses is high, generating a large number of scenarios is prohibitive. For purely pragmaticreasons, no more than four or five scenarios, which represent a broad range of possible futuresshould be selected.
In the context of the trilateral project, the scenarios selected need to reflect the potential dy-namics of the region. Unlike in most countries in the European Union, which exhibit rela-tively stable trends in most relevant dimensions (e.g. demographic and economic develop-ment), the study area region can be characterised as experiencing quite dynamic changes inmany relevant dimensions.
The process of scenario building includes five steps. Defining scenarios is often an iterativeprocess, in which critical reviews of the assumptions are given, and the scenarios are modifieduntil the research team agrees on a set that will be used for further analysis:
(1) Identify the major components of relevant scenarios. These are the factors which definethe context that affects the transport-environment realm for the study area. The three ma-jor factors in the study area are suggested to be: the political context, population devel-opment and the economic context.
GIS-Based Models and GIS Tools 31
(2) Set quantitative or qualitative values (or ranges of values) to be assigned to each of themajor factors. These values reflect the researchers' views of what can happen, or whatmay be of interest to explore, even if it is an unrealistic case. The choice between qualita-tive and quantitative values depends on the nature of the factor. For example, peacefulrelations are a qualitative factor which may reasonably take two to four values: adversaryto warm peace at the extremes. Automobile ownership (a secondary factor) must be givena quantitative value.
(3) Identification of secondary factors, usually derived from the major components. To acertain extent, these can be seen as a consequence of the major components, but they mayalso be determined independently. For example, growth in the labour force (a secondaryfactor), is clearly a result of population growth (a major factor). However, a change in thelabour force may also result from social change, such as growing labour force participa-tion of women.
(4) Assignment of values to the secondary factors. Again, these values are either quantitativeof qualitative, depending on available information or desired level of detail.
(5) Selection of scenarios. A major consideration is the number of scenarios to be con-structed. As the number of factors increases, the combinatorial set of scenarios growsrapidly. Although some combinations are actually 'empty' cases, it is still possible todrown in a huge number of possible scenarios. It is the task of the researchers to select therelevant and interesting scenarios for further study.
Scenarios should be designed with a time horizon in mind (e.g. 2010 or 2020). This is neces-sary to reduce uncertainty, as all participants have a common time frame to evaluate targetvalues of current or forthcoming trends.
3.3.2 Policy Analysis
To understand the following section, it is useful to know that the definition of the scenarios tobe simulated was done jointly by the Palestinian and Israeli partners prior to the renewal ofhostile relationships in the area in September 2000.
Major Factors
It is clear that three major factors will determine the future situation of the study area:
- Peace. The political situation in the study area is the most important factor distinguishingbetween adversary, cold or warm relationships between Israelis and Palestinians.
- Population. Population development in the region is a most important factor, as it directlyaffects the quantity of activities (mainly employment and education) and travel, as well asthe demand for housing, which in turn generates changes in the distribution of travel andfreight movement. Population growth is a quantitative dimension which can be grouped forthe purpose of scenario building into a few categories (e.g. slow, fast, stagnant).
GIS-Based Models and GIS Tools 32
- Economy. The state of the economy in the Palestinian and Israeli areas. These can be as-signed as being in a 'growth' mode, a 'stagnant' state or a 'declining' state. Each of thesethree levels can be defined in terms of growth rates, based on available data. However, it isnot necessary to make such quantitative definitions. The economic situation is likely to af-fect both the ability to invest in infrastructure as well as the growth in the use of cars.
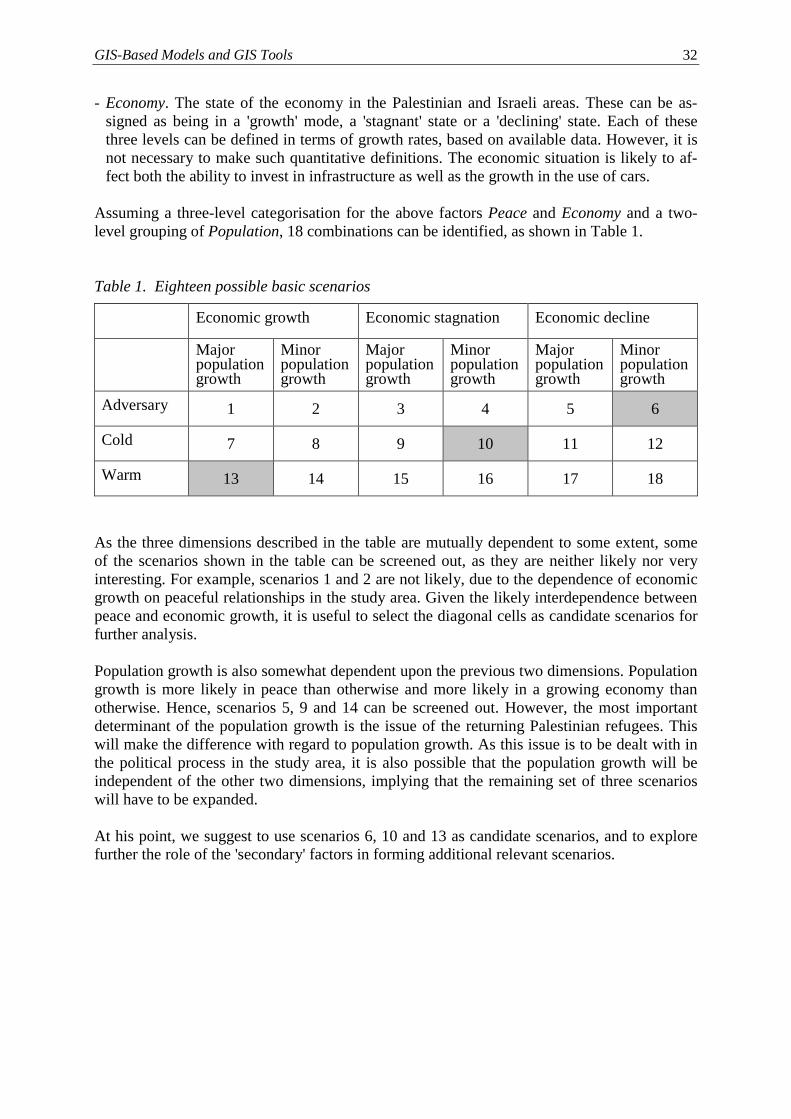
Assuming a three-level categorisation for the above factors Peace and Economy and a two-level grouping of Population, 18 combinations can be identified, as shown in Table 1.
Table 1. Eighteen possible basic scenarios
Economic growth Economic stagnation Economic decline
Majorpopulationgrowth
Minorpopulationgrowth
Majorpopulationgrowth
Minorpopulationgrowth
Majorpopulationgrowth
Minorpopulationgrowth
Adversary 1 2 3 4 5 6
Cold 7 8 9 10 11 12
Warm 13 14 15 16 17 18
As the three dimensions described in the table are mutually dependent to some extent, someof the scenarios shown in the table can be screened out, as they are neither likely nor veryinteresting. For example, scenarios 1 and 2 are not likely, due to the dependence of economicgrowth on peaceful relationships in the study area. Given the likely interdependence betweenpeace and economic growth, it is useful to select the diagonal cells as candidate scenarios forfurther analysis.
Population growth is also somewhat dependent upon the previous two dimensions. Populationgrowth is more likely in peace than otherwise and more likely in a growing economy thanotherwise. Hence, scenarios 5, 9 and 14 can be screened out. However, the most importantdeterminant of the population growth is the issue of the returning Palestinian refugees. Thiswill make the difference with regard to population growth. As this issue is to be dealt with inthe political process in the study area, it is also possible that the population growth will beindependent of the other two dimensions, implying that the remaining set of three scenarioswill have to be expanded.
At his point, we suggest to use scenarios 6, 10 and 13 as candidate scenarios, and to explorefurther the role of the 'secondary' factors in forming additional relevant scenarios.
GIS-Based Models and GIS Tools 33
Secondary Factors
The secondary factors focus on the determinants of the transport-environment context. Eachof the following factors is subject to some extent to policy decisions and they are interde-pendent. These include:
- Commuting patterns. The length of work trips depends on the relationship between the lo-cation of residence and employment opportunities. Whether or not long-distance (25+km)work trips will prevail, will probably be a result of the degree of integration of the twoeconomies, which in turn will depends on the outcome of the Peace Process (assuming thatby 2010 the relationship will have been finalised). The colder the peace, the shorter thecommute distances, as less Palestinians will work in Israel. The commute distance, as notedabove, depends on the location of employment and residences. It is reasonable to assumethat the spatial distribution of residences will remain as is, if population growth is low.However, if growth will include a significant number of returnees, residential patterns willchange. A likely pattern is of spreading of suburban development around the large cities inthe West Bank. It is also likely that more contacts with the Israeli economy will serve as amagnet to develop residences closer to the Israeli border. Hence, the length of work tripswill be related to both population growth and economic growth.
- Car ownership and public transport provision. Car ownership and public transport are likelyto demonstrate inverse relationships: the more cars are available, the less will be the use andsupply of public transportation. Growth in car ownership is likely to continue. The questionis at what pace? Economic growth will certainly encourage car ownership and vice versa.The authorities can introduce policies which will curb the growth of motorisation. However,this is unlikely as car ownership is a result of popular demand and hence curbing it is politi-cally wrong at times and places where satisfying growth indicators is important. The reli-ance on public transport services between towns and villages will depend on car ownershipand commuting patterns. Public transport service will probably not grow and the range ofpossible futures may distinguish between maintaining present levels or decline.
- Network attributes refer to the quantitative and qualitative characteristics of network den-sity, by type of road. The relevant parameters are capacity and level of service. Road capac-ity is determined primarily by the number of travel lanes in each direction, ranging from 0.5in rural areas to two or three lanes. The geometric design of these road types determines thedesign speed, and hence the capacity. However, some older roads have been improved overthe years, without a change in the basic geometry. A clear example is the Wadi-al-Nar roadwhich leads from Beit Sakhur - Beit Lehem to Ramallah, bypassing Jerusalem from the east.The physical design, including horizontal and vertical features provide a low level of servicewith regard to speed and safety. Generally, the Region’s road network does not experiencemuch congestion which can be attributed to an imbalance between demand and supply. Therelatively low income and auto ownership are underlying the low demand. Congestion of aunique form is that which is attributed to police and military road checkpoints, is discussedbelow.
- Accessibility refers to the possibility and ease of access to locations and facilities. Are allpeople free to choose any link on the network or are there separate networks for the Pales-tinians and the Israelis? The situation described refers to the period prior to the recent out-break of violence in September 2001. The issues at stake here are checkpoints, access to Je-rusalem, access to roads and bypass roads:
GIS-Based Models and GIS Tools 34
- Checkpoints. There are three types of checkpoints. Permanent checkpoints are set alongthe 'Green Line', the border which separates Israel from the West Bank. These are de-signed to prevent Palestinians who do not have a permit from entering Israel. The secondtype of checkpoints are located on the roads leading to the large Palestinian cities definedas "A" regions. These are under Palestinian security forces. The third type of checkpointsare the irregular checkpoints set periodically and temporarily to facilitate security checks.
- Access to Jerusalem. The most serious problem of free access to the road system is theclosure of Jerusalem. It requires those living in the southern and northern parts of the Re-gion to use the very long, old and poorly maintained Wadi-al-Nar road. This imposes se-vere costs on the Palestinians. Palestinians who live in East Jerusalem are not restrictedfrom using the routes which cross the city. The construction of a ring road around Jerusa-lem is now entering the implementation stage and construction in some sections havestarted. The eastern ring (20 km) will facilitate through traffic by both Palestinian and Is-raeli vehicles to bypass the city. The first phase of the project is now budgeted for $75mand scheduled to be completed in 2002. The complete ring road is to be completed by2010.
- Access to roads. For the purpose of understanding the accessibility issue it is useful toidentify the types of roads in the region. Most of the network is the old road system, par-tially built during the British Mandate and during the Jordanian period, until 1967. Sincethe Israeli occupation, road development included trunk roads, often with multiple goals.Some served for improving access at an inter-regional scale (e.g. Roads 5 and 90). Theseroads also improve access to the settlements of Israelis in the West Bank. Some of theseroads also play an important role in setting territorial facts. The Palestinian claim thatthese roads are designed to 'break' territorial continuity may be right.
- Bypass roads. A second type of road development in the region are the bypass roads. Themotivation for their construction was partially the problems of Israeli settlers’ risk inpassing through Palestinian towns and villages during the Intifada of 1987-1991. How-ever, the claim by Palestinians claim that the bypass roads are restricted and that they maynot use them, is inaccurate and not supported by traffic counts. Traffic counts on a numberof bypass roads have revealed (in 1998) that on some sections Palestinian traffic accountsfor 68% (Road 60, near Ofra), 55% (Road 60, Hebron bypass) or 49% (Road 5, east ofAriel). The Palestinian also adhere to the argument that bypass roads are built solely forIsraelis, and they seem to disregard the benefits of bypass roads. Bypass roads are built inmany countries as part of upgrading road systems. Such roads reduce through traffic, im-prove the environment and reduce safety hazards. This is done not only in the West Bank,but also in Israel and in many other countries.
A fully free-access network can only be expected under very warm peace. But even underwarm peace, the sides may agree to maintain the conventional procedures separating twoneighbouring states. Colder peace and adversary relations are more likely to lead to a con-tinuation of the present situations, with some modifications resulting from the agreements ofthe Peace Process.
GIS-Based Models and GIS Tools 35
3.3.3 Definition of Scenarios
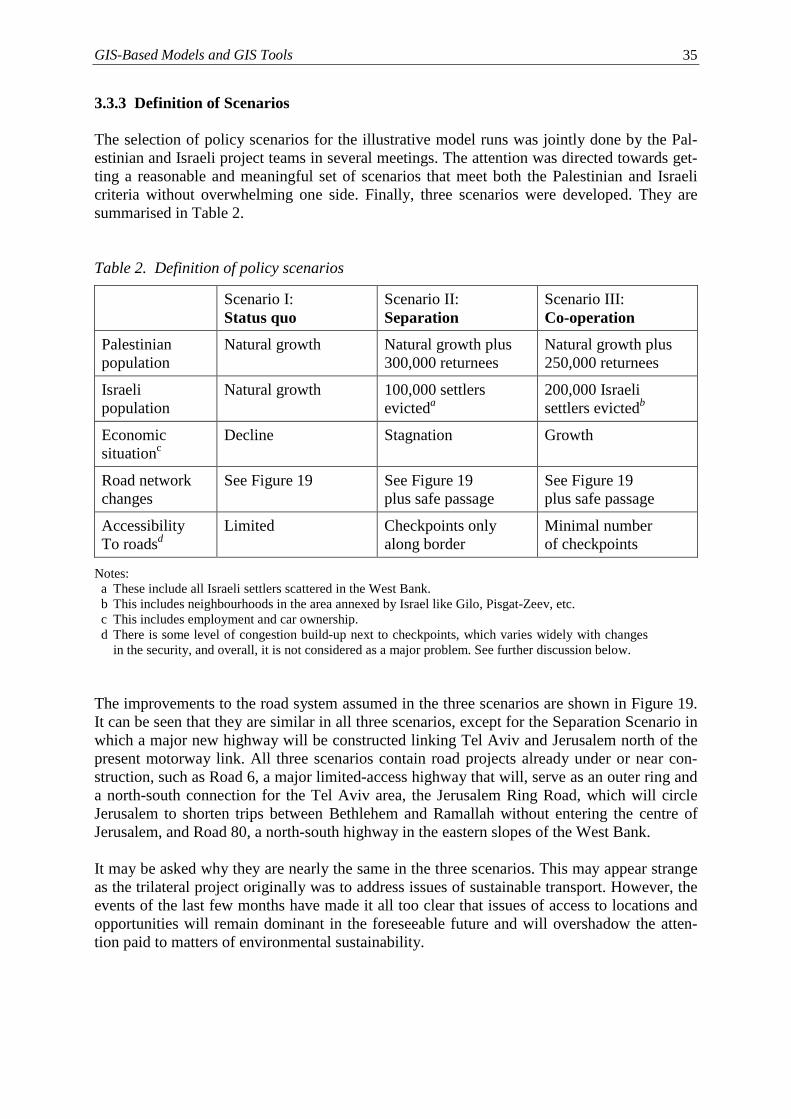
The selection of policy scenarios for the illustrative model runs was jointly done by the Pal-estinian and Israeli project teams in several meetings. The attention was directed towards get-ting a reasonable and meaningful set of scenarios that meet both the Palestinian and Israelicriteria without overwhelming one side. Finally, three scenarios were developed. They aresummarised in Table 2.
Table 2. Definition of policy scenarios
Scenario I:Status quo
Scenario II:Separation
Scenario III:Co-operation
Palestinianpopulation
Natural growth Natural growth plus300,000 returnees
Natural growth plus250,000 returnees
Israelipopulation
Natural growth 100,000 settlersevicteda
200,000 Israelisettlers evictedb
Economicsituationc
Decline Stagnation Growth
Road networkchanges
See Figure 19 See Figure 19plus safe passage
See Figure 19plus safe passage
AccessibilityTo roadsd
Limited Checkpoints onlyalong border
Minimal numberof checkpoints
Notes: a These include all Israeli settlers scattered in the West Bank. b This includes neighbourhoods in the area annexed by Israel like Gilo, Pisgat-Zeev, etc. c This includes employment and car ownership. d There is some level of congestion build-up next to checkpoints, which varies widely with changes
in the security, and overall, it is not considered as a major problem. See further discussion below.
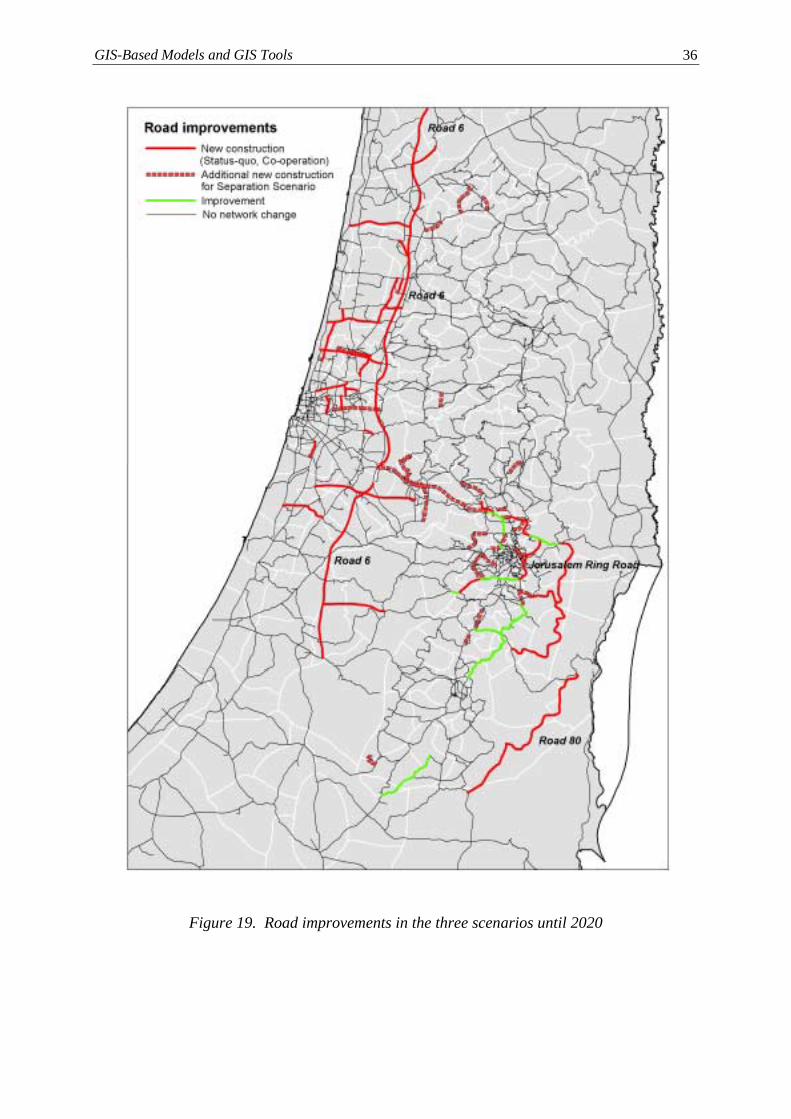
The improvements to the road system assumed in the three scenarios are shown in Figure 19.It can be seen that they are similar in all three scenarios, except for the Separation Scenario inwhich a major new highway will be constructed linking Tel Aviv and Jerusalem north of thepresent motorway link. All three scenarios contain road projects already under or near con-struction, such as Road 6, a major limited-access highway that will, serve as an outer ring anda north-south connection for the Tel Aviv area, the Jerusalem Ring Road, which will circleJerusalem to shorten trips between Bethlehem and Ramallah without entering the centre ofJerusalem, and Road 80, a north-south highway in the eastern slopes of the West Bank.
It may be asked why they are nearly the same in the three scenarios. This may appear strangeas the trilateral project originally was to address issues of sustainable transport. However, theevents of the last few months have made it all too clear that issues of access to locations andopportunities will remain dominant in the foreseeable future and will overshadow the atten-tion paid to matters of environmental sustainability.
GIS-Based Models and GIS Tools 36
Figure 19. Road improvements in the three scenarios until 2020
GIS-Based Models and GIS Tools 37
Scenario I is called the Status-quo Scenario. This scenario reflects the current status if it isprevail until the year 2020. This scenario is considered as the benchmark for the analysis.This scenario assumes a natural growth in the Palestinian and Israeli population of the studyarea. As in the present time, no major change in employment trends is taking place; thus thescenario assumes decline in the economy. Road network development is assumed to takeplace in this scenario as in the other two scenarios: Road 6, the Jerusalem ring road and Road80 are assumed to exist in 2020. Restrictions on roads to Palestinian vehicles will still exist,and there will be a large number of checkpoints resulting in a high level of delay on a numberof road links.
Scenario II is called the Separation Scenario. This scenario assumes cold relations in which arigid boundary between the Palestinian territories and Israel exists. The Palestinian populationis assumed to grow naturally. In addition, some 300,000 Palestinian returnees are assumed tobe distributed evenly across the Palestinian urban centres of the region. The scenario also as-sumes that 100,000 Israeli settlers are evicted from the West Bank. Since the region is as-sumed to have a high level of Palestinian population in the year 2020, the economic situationis assumed to go in the stagnation mode. Road network improvement in this scenario is thesame as in the Status-quo Scenario except that a second, more northern connection betweenTel Aviv and Jerusalem will be constructed and the safe passage corridors between The WestBank and Gaza (see Figure 16) will exist. Unlike the Status-quo Scenario, checkpoints withinthe West Bank no longer exist, however, the checkpoints along the border providing access toJerusalem and Israel have medium delays.
Scenario III is the Co-operation Scenario. This scenario assumes friendly relations betweenPalestinians and Israelis. The scenario expects 300,000 Palestinian returnees and evicts200,000 Israeli settlers from the West Bank. Unlike the Separation Scenario, the Co-operationScenario assumes economic growth resulting from the low restriction on accessibility as allcheckpoints and road restrictions are removed in this scenario. Employment levels and carownership are expected to increase. The same improvements in the road network are expectedto take place as in the Status-quo Scenario except that the safe passage corridors will exist.
It is important to note that the criteria embedded in the scenarios developed in this project donot resemble any political forthcoming opinion of the Palestinian National Authority, the Is-raeli government or the authors but are strictly developed for illustrative purposes in order toassess the impact of a certain policy or future image if it is to take place in the future.
GIS-Based Models and GIS Tools 38
3.3.4 Simulation Results
This section was originally intended to present results of the integrated model system. Itshould have presented the traffic and environmental effects of three scenarios and a compari-son and explanation of similarities and differences between them. It was planned to presentfor each scenario trip distributions for selected zones with network assignment, average triplengths, link volumes and NOx emissions, differentiated by Israeli and Palestinian population.The comparison would have focused on the differences between the scenarios in terms of ve-hicle km, vehicle hours, average trip length and link volumes and NOx emissions.
As explained elsewhere in this report, the political development of the last months in thestudy area made it impossible to extend the analysis beyond the three policy scenarios pre-sented in the previous section. Therefore it is not possible to present the full range of simula-tion results as indicated above, in particular the envisaged results with respect to environ-mental issues cannot be shown. The results that can be presented are transport flows, trafficloads and system performance, safety effects and potentials for public transport and paratran-sit. These simulation results are obtained for the base year and for the year 2020 for each ofthe three policy scenarios.
Transport flows and activity levels
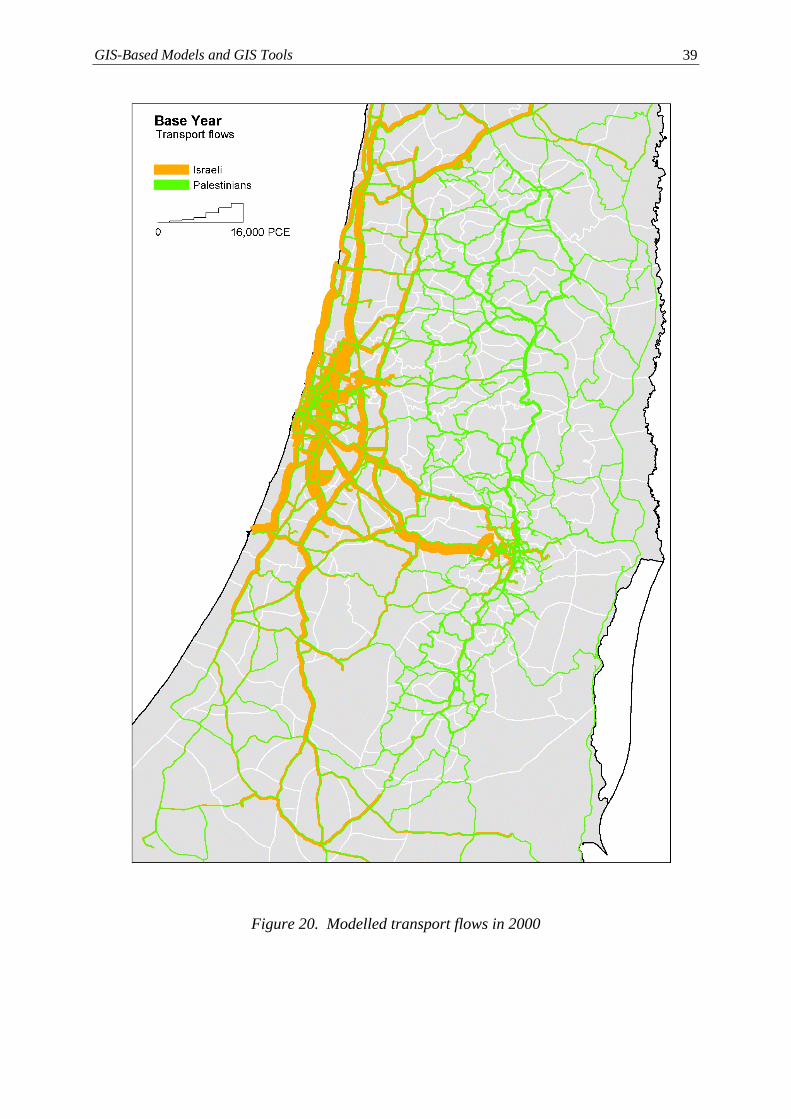
Total morning peak hour trips for the Israeli population accessing the road network as codedin the road network database total about 110,000 passenger-car equivalents (PCE) per hour.This number is to rise to over 213,000 PCE per hour in the forecast year 2020. This increaseis due to the assumed natural population growth of the Israeli population. These trip levels areequivalent to rates of 0.06 PCE per hour per household today, rising to 0.084 PCE per hourper household in the future, with the bulk of the increase due to the forecast increase in vehi-cle availability and use. Similarly, the Palestinian population travel patterns are forecast tointensify from rates of 0.02-0.03 today to 0.04-0.06 in the forecast year).
Figure 20 presents transport flows in terms of link volumes in PCE for the base year sepa-rately for the Israeli and Palestinian population. It is evident that the highest link volumes canbe observed in the Tel Aviv area and on the freeway linking Tel Aviv and Jerusalem. There isalso a considerable amount of Israeli travelling around Jerusalem. However, Israeli travel inthe West Bank is almost negligible, with the exception of the route Jerusalem-Hebron-Be’erSheva. This is also the most travelled route for Palestinians in the southern part of the WestBank. North of Jerusalem, that route continues linking Jerusalem with Ramallah and Nablus.As to be expected, link volumes in the West Bank are by far lower than those in Israel.
The overall model results indicate that the planned improvements to the road system in com-bination with growing population figures for both Israeli and Palestinians as reflected in themodel comprise an addition of 8-11 % to the lane-kilometres of the road network (from17,560 lane-km today to 19,000-19,500 lane-km depending on the scenario). The commensu-rate increase in vehicle-kilometres travelled (VKT) under the Co-operation Scenario is 43%(from 642,700 VKT today to 917,000 VKT in 2020). The other scenarios are expected to re-sult in smaller increases in total travel due to the relative spatial segregation of the populationgroups: The Status-quo Scenario for the year 2020 results in a total of 662,000 VKT (3% in-crease), and the Separation Scenario in a total of 706,000 VKT (10% increase).
GIS-Based Models and GIS Tools 39
Figure 20. Modelled transport flows in 2000
GIS-Based Models and GIS Tools 40
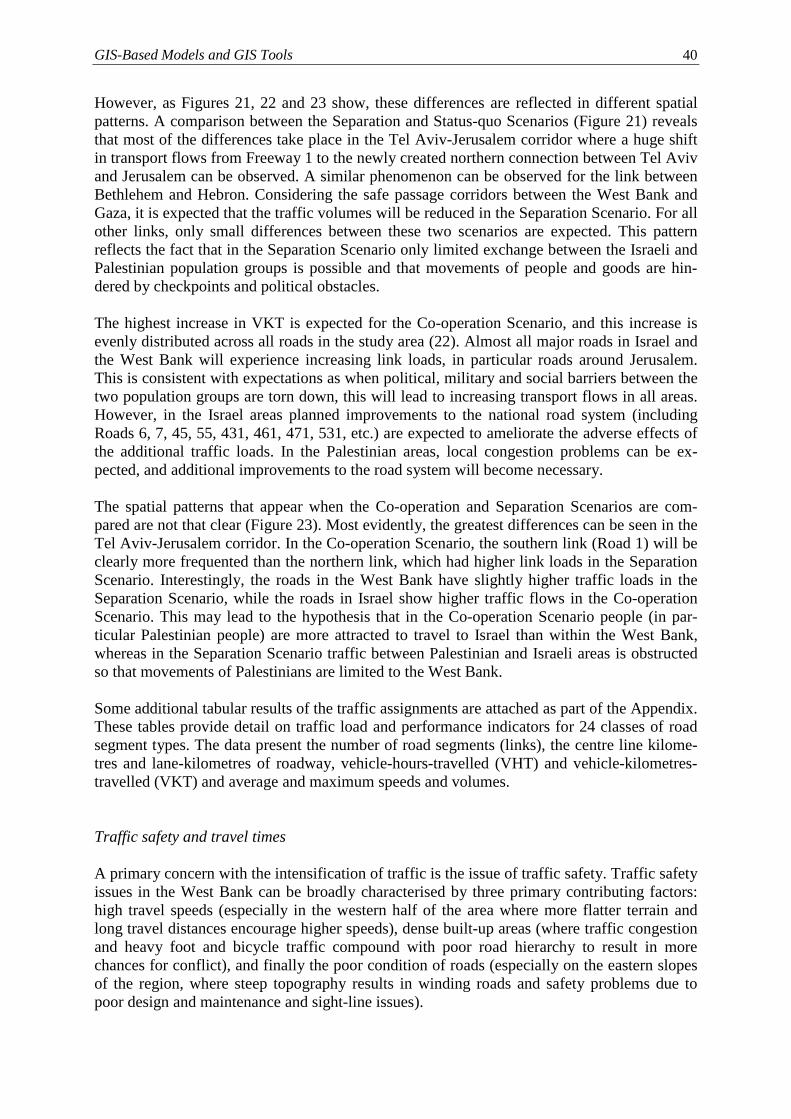
However, as Figures 21, 22 and 23 show, these differences are reflected in different spatialpatterns. A comparison between the Separation and Status-quo Scenarios (Figure 21) revealsthat most of the differences take place in the Tel Aviv-Jerusalem corridor where a huge shiftin transport flows from Freeway 1 to the newly created northern connection between Tel Avivand Jerusalem can be observed. A similar phenomenon can be observed for the link betweenBethlehem and Hebron. Considering the safe passage corridors between the West Bank andGaza, it is expected that the traffic volumes will be reduced in the Separation Scenario. For allother links, only small differences between these two scenarios are expected. This patternreflects the fact that in the Separation Scenario only limited exchange between the Israeli andPalestinian population groups is possible and that movements of people and goods are hin-dered by checkpoints and political obstacles.
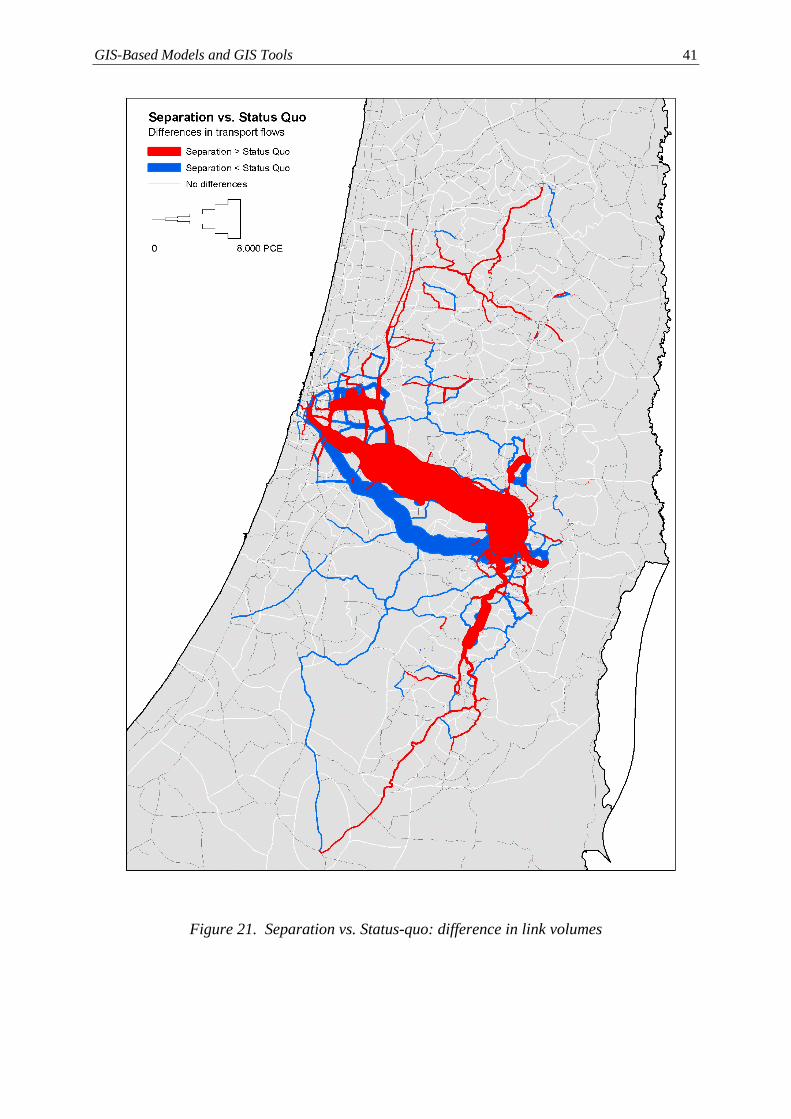
The highest increase in VKT is expected for the Co-operation Scenario, and this increase isevenly distributed across all roads in the study area (22). Almost all major roads in Israel andthe West Bank will experience increasing link loads, in particular roads around Jerusalem.This is consistent with expectations as when political, military and social barriers between thetwo population groups are torn down, this will lead to increasing transport flows in all areas.However, in the Israel areas planned improvements to the national road system (includingRoads 6, 7, 45, 55, 431, 461, 471, 531, etc.) are expected to ameliorate the adverse effects ofthe additional traffic loads. In the Palestinian areas, local congestion problems can be ex-pected, and additional improvements to the road system will become necessary.
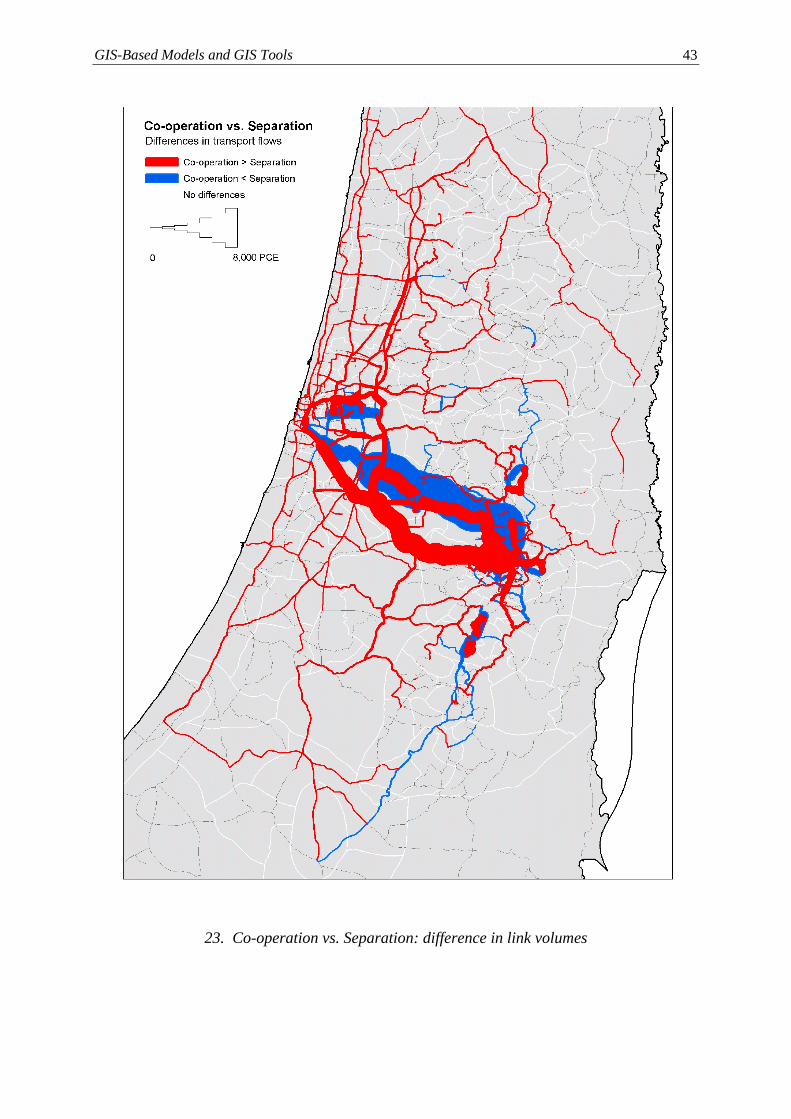
The spatial patterns that appear when the Co-operation and Separation Scenarios are com-pared are not that clear (Figure 23). Most evidently, the greatest differences can be seen in theTel Aviv-Jerusalem corridor. In the Co-operation Scenario, the southern link (Road 1) will beclearly more frequented than the northern link, which had higher link loads in the SeparationScenario. Interestingly, the roads in the West Bank have slightly higher traffic loads in theSeparation Scenario, while the roads in Israel show higher traffic flows in the Co-operationScenario. This may lead to the hypothesis that in the Co-operation Scenario people (in par-ticular Palestinian people) are more attracted to travel to Israel than within the West Bank,whereas in the Separation Scenario traffic between Palestinian and Israeli areas is obstructedso that movements of Palestinians are limited to the West Bank.
Some additional tabular results of the traffic assignments are attached as part of the Appendix.These tables provide detail on traffic load and performance indicators for 24 classes of roadsegment types. The data present the number of road segments (links), the centre line kilome-tres and lane-kilometres of roadway, vehicle-hours-travelled (VHT) and vehicle-kilometres-travelled (VKT) and average and maximum speeds and volumes.
Traffic safety and travel times
A primary concern with the intensification of traffic is the issue of traffic safety. Traffic safetyissues in the West Bank can be broadly characterised by three primary contributing factors:high travel speeds (especially in the western half of the area where more flatter terrain andlong travel distances encourage higher speeds), dense built-up areas (where traffic congestionand heavy foot and bicycle traffic compound with poor road hierarchy to result in morechances for conflict), and finally the poor condition of roads (especially on the eastern slopesof the region, where steep topography results in winding roads and safety problems due topoor design and maintenance and sight-line issues).
GIS-Based Models and GIS Tools 41
Figure 21. Separation vs. Status-quo: difference in link volumes
GIS-Based Models and GIS Tools 42
Figure 22. Co-operation vs. Status-quo: difference in link volumes
GIS-Based Models and GIS Tools 43
23. Co-operation vs. Separation: difference in link volumes
GIS-Based Models and GIS Tools 44
An example of such safety problems indicated by the model results is the Wadi-al-Nar routeconnecting Bethlehem and Ramallah. Today restrictions on the travel of Palestinian vehiclesthrough Jerusalem necessitates vehicles to take this more circuitous route on the easternslopes of the Judean Mountains through the steep gorge of Wadi-al-Nar. In scenarios wheretravel through Jerusalem is restricted, hourly traffic volumes on this route are forecast to in-crease from 400-600 PCE today to 1,200-1,600 in 2020. In scenarios where travel throughJerusalem is allowed as a route from Bethlehem to Ramallah, traffic volumes in Wadi-al-Narare expected to increase less precipitously to 800-1,200, mostly serving local access to grow-ing neighbourhoods of East Jerusalem. The easternpart of the Jerusalem ring road is expectedto provide additional needed capacity for this travel corridor.
Besides safety concerns, also travel times between Bethlehem and Ramallah are of interest forPalestinian people. In scenarios where they are allowed to travel through Jerusalem, the traveltime between Bethlehem and Ramallah is expected to be half or even less of that travel timeusing the Wadi-al-Nar route, even though there will be congestion or waiting times at trafficlights in Jerusalem itself. However, this expected reduction in travel time between Bethlehemand Ramallah will also have considerable impacts on social contacts of Palestinians and onPalestinian economy.
Potential for public transport and paratransit
For the purpose of this study, data was collected regarding some 591 existing fixed-routepublic transport lines operating in the West Bank. The vehicle age for the buses and mini-buses employed for this service is evenly spread over the years from the mid-1970s to themid-1990s, and the vehicles are often seen out of service on the road shoulder due to their ageand need for maintenance. Over the last several years, the West Bank has seen a dramaticgrowth in taxi-van and related paratransit services. It is expected that as dispersed develop-ment patterns continue on the West Bank, trip-making will continue to shift from a "many-to-few" pattern to a "many-to-many" pattern. Paratransit systems which can respond to this dis-persed demand will be successful; lines to and between urban centres best suited to fixed-route buses should be protected from unnecessary competition, to preserve dependable andequitable access to transport services.
Environmental impacts
In addition to issues of system performance, equity and safety mentioned above, sustainabledevelopment requires an environmentally sound approach to balancing land use and trans-portation system investments. An environmental analysis of the alternative scenarios shouldinclude an assessment of the scenarios across a number of disciplines, including potential ef-fects on natural resources (land, air, water, visual assets, sensitive habitats) as well as builtand cultural resources (sensitive land uses or archaeological sites). In addition, an environ-mental analysis would take into account the potential effects of the environment on the trans-portation system, including geologic hazards, etc. Further work on this issue at a more de-tailed scale of analysis would allow for a more localised assessment of dispersion of air pol-lutants and exposure patterns to unhealthful air pollutant concentrations. In addition, such ananalysis would allow for comparing the potentially differential effects (exposure) of the area'spopulations to air pollution.
GIS-Based Models and GIS Tools 45
On an overall level, the travel summary indicates that, while the Separation Scenario is ex-pected to require the most substantial addition of roads and related transportation infrastruc-ture, the Co-operation Scenario is forecast to result in the highest levels of traffic (in terms ofnumber of trips, VKT and VHT). This in turn is expected to contribute to higher levels of airpollutant emissions. A worsening of emissions would erase the progress being made throughcleaner cars entering the vehicle fleet. Under the Status-quo Scenario, increase traffic levelswould be balanced by the improvements in the vehicle fleet, and emissions would stay aboutlevel with today's totals. Under the Separation Scenario, emissions would be expected tomake a moderate 5-10% increase. Under the Co-operation Scenario, an increase of 10% ormore would be expected.
However, as the differences in link volumes presented in Figures 21, 22 and 23 suggest, thespatial distribution of these increasing traffic emissions is expected to differ across the sce-narios. For the Separation Scenario, it is expected that the corridor between Tel Aviv and Je-rusalem will be affected above-average with additional emission compared to the base yearand the Status-quo Scenario. Conversely, the Co-operation Scenario is expected to lead toadditional emissions almost evenly distributed across the study area following the evenlypatterns of increases in link traffic loads.
GIS-Based Models and GIS Tools 46
4 Conclusions and Future Work
This report concludes a project which was started in a era of optimism and great expectationsabout the prospects of peaceful co-operation between Israeli and Palestinian researchers andplanners towards sustainable development.
And indeed, Phase 1 and the first part of Phase 2 of the project showed that such co-operationis possible. The significant achievements in establishing the integrated database in Phase 1from both Israeli and Palestinian sources would not have been possible without great effortsof the Israeli and Palestinian partners to collaborate in a spirit of openness and co-operation.In particular the meetings in which the Israeli and Palestinian partners worked together on thedefinition of meaningful policy scenarios that were acceptable to both sides demonstrated thepotential and power of co-operation on practical matters of mutual interest.
However, during the last months of the project it has become clear that progress towardspeace will be much more long-term. The slowing down of the Peace Process during the year2000 has had its effects on the important concluding phase of the project. Although signifi-cant progress in achieving the technical tasks of the project has been made, not all of its initialobjectives could be accomplished. The individual components of the envisaged GIS-basedmethodology for sustainable transport planning in the West Bank have all been developed andtested and at least partly applied together in a pilot application. However, because of the po-litical circumstances it has not been possible to establish the integrated methodology in apractical application framework beyond the duration of the project.
At a more detailed level, the project was successful in establishing a methodological frame-work for a linkage between a GIS and a transport model and environmental impact models. Inparticular the two-way macro-language interface between ArcInfo and EMME/2 represents amajor advance over previous isolated applications of GIS and models in transport planning.Also the network extension tool developed is potentially a significant step beyond conven-tional ways of designing transport network extensions. The environmental impact submodelsexisting at Hebrew University and at IRPUD represent the state of the art in a rapidly devel-oping field of research. However, the integrated framework consisting of ArcInfo, EMME/2,the ArcInfo-EMME/2 interface, the network extension tool and the environmental impactsubmodels has nowhere been implemented in its entirety. ArcInfo was implemented in Beth-lehem, Dortmund and Bonn, EMME/2 in Jerusalem and Dortmund, the Arcinfo-EMME/2interface only in Dortmund, the network extension tool only in Bonn and the environmentalimpact submodels only in Jerusalem and Dortmund. So the intended integration worked onlyin the virtual and non-permanent space of the project.
Another notable achievement of the project has been the establishment of the integrated data-base for GIS-based transport planning in the West Bank. The compilation and homogenisa-tion of high-resolution digital terrain data from different sources, the joint efforts of all projectpartner to establish a consistent and detailed road network database, the agreement reached ona system of zone boundaries compatible with the political perceptions of both the Israeli andthe Palestinians partners, and the close co-operation of the Israeli and Palestinian partners toassemble a consistent set of population, employment and car ownership data from Israeli andPalestinian sources not only represent a demonstration of the feasibility and benefit of co-operation but have also laid indispensable foundations for future joint transport planning inthe West Bank.
GIS-Based Models and GIS Tools 47
The pilot applications of the methodology presented in this report demonstrate that the com-ponents of the methodology function together and produce meaningful results. The results ofthe simulations of three policy scenarios confirm that the hypothesis that peaceful co-existence would give rise to a more spatially distributed and hence more equitable and moresustainable pattern of movements. However, due to the restricted communication between theIsraeli and Palestinian partners in the final phase of the project, the selection of policy sce-narios more limited than initially intended. Original plans to examine also more fundamentalpolicy options, both in terms of political and socio-economic scenarios and in terms of trans-port infrastructure alternatives could not be implemented. Nevertheless, it must be counted asa significant success that the Israeli and Palestinian partners were able to reach consensusabout a common set of policy scenarios, something hardly imaginable in the frosty politicalclimate of today.
What remains unachieved by the project will have to be left for future work. From the per-spective of the project team, the following tasks should be addressed:
- First priority on a future research agenda would have the completion of the integration ofthe modelling framework as it is illustrated in Figure 2 of this report at one site.
- This would include the full integration of the network extension tool into the software sys-tem and the linkage between the GIS and the transport model with the already existing envi-ronmental submodels.
- The extension of the network database to include all bus lines and the existing shared-taxiparatransit system would allow to investigate environment-friendly transport policy options.
- The set of policy scenarios examined should be greatly extended to include different combi-nations of transport policy packages and political and socio-economic scenarios.
It is hoped that the project partners will have an opportunity to resume their productive co-operation in the not too far future.
GIS-Based Models and GIS Tools 48
5 Appendix
Appendix 1: Co-operation Partners
Lutz Plümer, Professor Dr. (Project Coordinator)Institut für Kartographie und Geoinformation (IKG)Universität BonnMeckenheimer Allee 172D-53115 Bonn, GermanyPhone: +49 228 73 17 50Fax: +49 228 73 17 53E-mail: [email protected]://www.ikg.uni-bonn.de/
Michael Wegener, Professor Dr.-Ing.Institut für Raumplanung (IRPUD)Universität DortmundD-44221 Dortmund, GermanyPhone: +49 231 755 2401/2291Fax: +49 231 755 4788E-mail: [email protected]://irpud.raumplanung.uni-dortmund.de/irpud
Ilan Salomon, Professor Dr.Department of Geography (DG)Hebrew University of JerusalemMount ScopusJerusalem 91905, IsraelPhone: +972 2 5883 345Fax: +972 2 820 549E-mail: [email protected]://atar.mscc.huji.ac.il/~eppp/index1.htm
Jad Isaac, Professor Dr.Applied Research Institute Jerusalem (ARIJ)Caritas StreetP.O. Box 860Bethlehem, PalestinePhone: +972 2 741889Fax: +972 2 277 6966E-mail: [email protected]://www.arij.org/
GIS-Based Models and GIS Tools 49
Appendix 2: Staff
Bonn (IKG)Research Associate:Mar 1999 – Feb 2000: Dipl. Inform. Ingo Petzold
Student Research Assistant:Jan 2000 – Mar 2000: Ariane MiddelJan 2000 – Mar 2000: Udo QuadtJan 2000 – Mar 2000: Jörg Steinrücken
Contributors:Dr. Gerhard GrögerDr.-Ing. Jochen Schiewe
Dortmund (IRPUD)Research Associate:Mar 1999 – Feb 2000: Dipl.-Ing. Franz Fürst
Student Research Assistant:Feb 1999 – Jan 2000: Alessandro Morosin
Contributors:Dipl.-Ing. Meinhard LemkeDipl.-Ing. Carsten SchürmannDipl.-Ing. Klaus Spiekermann
Jerusalem (DG)Research Associate:Mar 1999 – Feb 2000: Jay Kaplan-Wildman, Ph.D. student
Contributors:Galit Cohen, Ph.D. student, The Free University of AmsterdamGil Tal, MA Student, The Hebrew University of Jerusalem.
Bethlehem (ARIJ)Research Associate:Mar 1999 – Feb 2000: Hanna MaohMar 1999 – Feb 2000: Isam IshaqMar 1999 – Feb 2000: Violet Qumsieh
Student Research Assistant:Mar 1999 – Feb 2000: Sophia Sa'adMar 1999 – Feb 2000: Majed Abu Kobea'Mar 1999 – Feb 2000: Khaldoun Rishmawi
GIS-Based Models and GIS Tools 50
Appendix 3: Theses and Publications
Bonn (IKG)Schiewe, J., Isaac, J. (1999): Improving the Reliability of DEMs from Automatic Matching:Experience form a case study. Proceedings of the 2nd International Symposium on Opera-tionalization of Remote Sensing, 16-20 August 1999, ITC, Enschede, The Netherlands.
Dortmund (IRPUD)Odeh, I. (1999): Urban and Traffic Design Concept Bethlehem 2000. Diploma Thesis. Dort-mund: Institut für Raumplanung, Universität Dortmund.
Fürst, F., Isaac. J., Ishaq, I., Kaplan, J., Maoh, H., Petzold, I., Plümer, L., Salomon, I., Schür-mann, C., Spiekermann, K., Wegener, M. (2001): Sustainable Transport Planning for Israeland Palestine. Paper to be presented at the World Conference on Transport Research(WCTR), July 2001, Seoul, Korea (Abstract accepted).
Bethlehem (ARIJ)Maoh, H., Isaac, J. (1999) The status of transportation in the West Bank. World TransportPolicy and Practice 5, 4, 18-29.
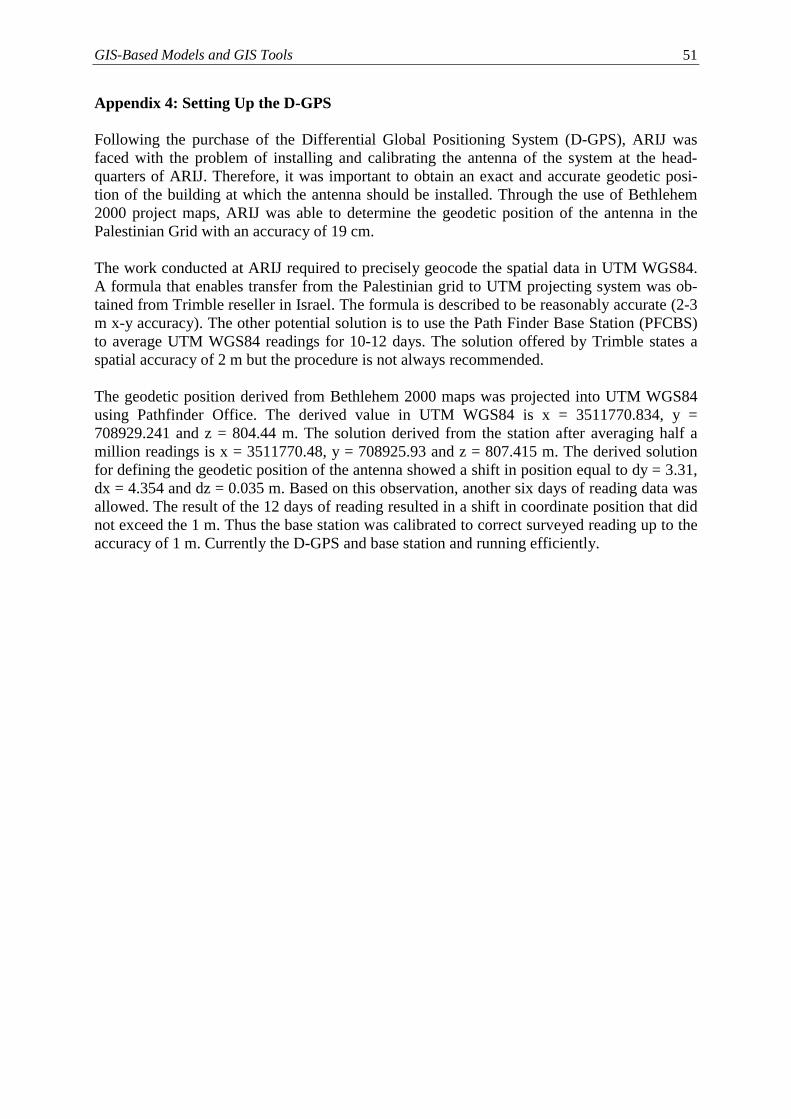
GIS-Based Models and GIS Tools 51
Appendix 4: Setting Up the D-GPS
Following the purchase of the Differential Global Positioning System (D-GPS), ARIJ wasfaced with the problem of installing and calibrating the antenna of the system at the head-quarters of ARIJ. Therefore, it was important to obtain an exact and accurate geodetic posi-tion of the building at which the antenna should be installed. Through the use of Bethlehem2000 project maps, ARIJ was able to determine the geodetic position of the antenna in thePalestinian Grid with an accuracy of 19 cm.
The work conducted at ARIJ required to precisely geocode the spatial data in UTM WGS84.A formula that enables transfer from the Palestinian grid to UTM projecting system was ob-tained from Trimble reseller in Israel. The formula is described to be reasonably accurate (2-3m x-y accuracy). The other potential solution is to use the Path Finder Base Station (PFCBS)to average UTM WGS84 readings for 10-12 days. The solution offered by Trimble states aspatial accuracy of 2 m but the procedure is not always recommended.
The geodetic position derived from Bethlehem 2000 maps was projected into UTM WGS84using Pathfinder Office. The derived value in UTM WGS84 is x = 3511770.834, y =708929.241 and z = 804.44 m. The solution derived from the station after averaging half amillion readings is x = 3511770.48, y = 708925.93 and z = 807.415 m. The derived solutionfor defining the geodetic position of the antenna showed a shift in position equal to dy = 3.31,dx = 4.354 and dz = 0.035 m. Based on this observation, another six days of reading data wasallowed. The result of the 12 days of reading resulted in a shift in coordinate position that didnot exceed the 1 m. Thus the base station was calibrated to correct surveyed reading up to theaccuracy of 1 m. Currently the D-GPS and base station and running efficiently.
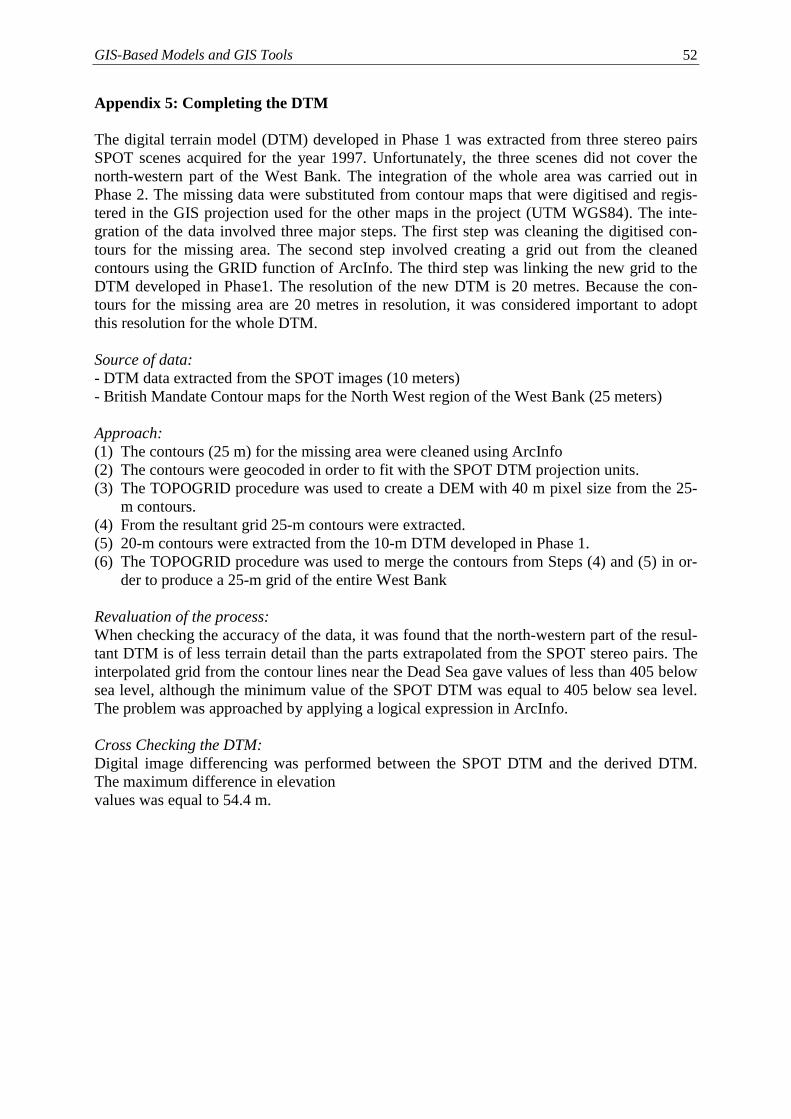
GIS-Based Models and GIS Tools 52
Appendix 5: Completing the DTM
The digital terrain model (DTM) developed in Phase 1 was extracted from three stereo pairsSPOT scenes acquired for the year 1997. Unfortunately, the three scenes did not cover thenorth-western part of the West Bank. The integration of the whole area was carried out inPhase 2. The missing data were substituted from contour maps that were digitised and regis-tered in the GIS projection used for the other maps in the project (UTM WGS84). The inte-gration of the data involved three major steps. The first step was cleaning the digitised con-tours for the missing area. The second step involved creating a grid out from the cleanedcontours using the GRID function of ArcInfo. The third step was linking the new grid to theDTM developed in Phase1. The resolution of the new DTM is 20 metres. Because the con-tours for the missing area are 20 metres in resolution, it was considered important to adoptthis resolution for the whole DTM.
Source of data:- DTM data extracted from the SPOT images (10 meters)- British Mandate Contour maps for the North West region of the West Bank (25 meters)
Approach:(1) The contours (25 m) for the missing area were cleaned using ArcInfo(2) The contours were geocoded in order to fit with the SPOT DTM projection units.(3) The TOPOGRID procedure was used to create a DEM with 40 m pixel size from the 25-
m contours.(4) From the resultant grid 25-m contours were extracted.(5) 20-m contours were extracted from the 10-m DTM developed in Phase 1.(6) The TOPOGRID procedure was used to merge the contours from Steps (4) and (5) in or-
der to produce a 25-m grid of the entire West Bank
Revaluation of the process:When checking the accuracy of the data, it was found that the north-western part of the resul-tant DTM is of less terrain detail than the parts extrapolated from the SPOT stereo pairs. Theinterpolated grid from the contour lines near the Dead Sea gave values of less than 405 belowsea level, although the minimum value of the SPOT DTM was equal to 405 below sea level.The problem was approached by applying a logical expression in ArcInfo.
Cross Checking the DTM:Digital image differencing was performed between the SPOT DTM and the derived DTM.The maximum difference in elevationvalues was equal to 54.4 m.
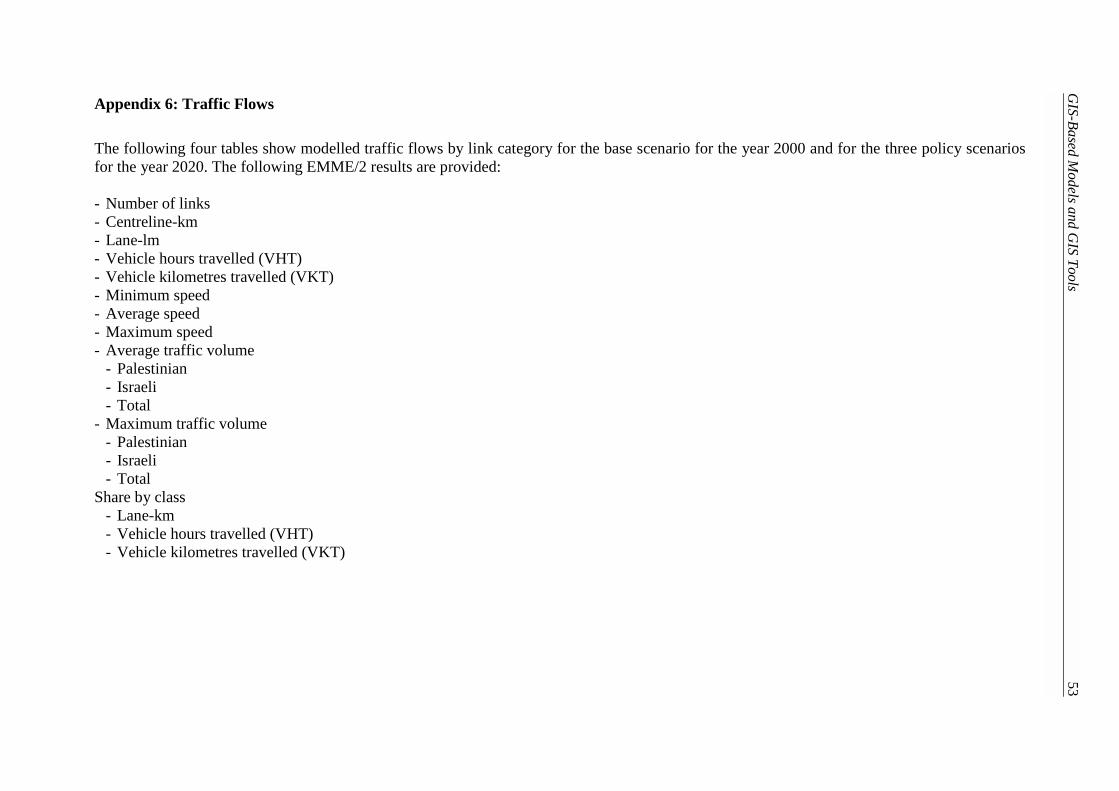
GIS-Based M
odels and GIS Tools
53
Appendix 6: Traffic Flows
The following four tables show modelled traffic flows by link category for the base scenario for the year 2000 and for the three policy scenariosfor the year 2020. The following EMME/2 results are provided:
- Number of links- Centreline-km- Lane-lm- Vehicle hours travelled (VHT)- Vehicle kilometres travelled (VKT)- Minimum speed- Average speed- Maximum speed- Average traffic volume
- Palestinian- Israeli- Total
- Maximum traffic volume- Palestinian- Israeli- Total
Share by class- Lane-km- Vehicle hours travelled (VHT)- Vehicle kilometres travelled (VKT)
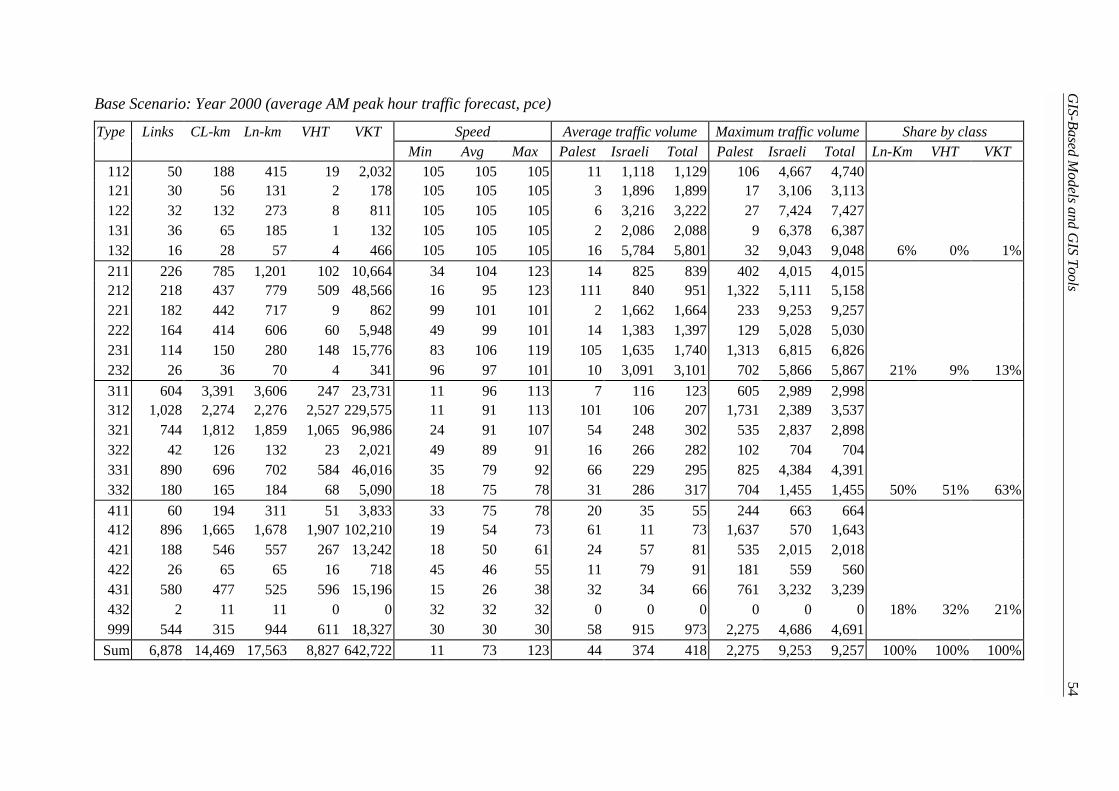
GIS-Based M
odels and GIS Tools
54
Base Scenario: Year 2000 (average AM peak hour traffic forecast, pce)
Type Links CL-km Ln-km VHT VKT Speed Average traffic volume Maximum traffic volume Share by classMin Avg Max Palest Israeli Total Palest Israeli Total Ln-Km VHT VKT
112 50 188 415 19 2,032 105 105 105 11 1,118 1,129 106 4,667 4,740121 30 56 131 2 178 105 105 105 3 1,896 1,899 17 3,106 3,113122 32 132 273 8 811 105 105 105 6 3,216 3,222 27 7,424 7,427131 36 65 185 1 132 105 105 105 2 2,086 2,088 9 6,378 6,387132 16 28 57 4 466 105 105 105 16 5,784 5,801 32 9,043 9,048 6% 0% 1%211 226 785 1,201 102 10,664 34 104 123 14 825 839 402 4,015 4,015212 218 437 779 509 48,566 16 95 123 111 840 951 1,322 5,111 5,158221 182 442 717 9 862 99 101 101 2 1,662 1,664 233 9,253 9,257222 164 414 606 60 5,948 49 99 101 14 1,383 1,397 129 5,028 5,030231 114 150 280 148 15,776 83 106 119 105 1,635 1,740 1,313 6,815 6,826232 26 36 70 4 341 96 97 101 10 3,091 3,101 702 5,866 5,867 21% 9% 13%311 604 3,391 3,606 247 23,731 11 96 113 7 116 123 605 2,989 2,998312 1,028 2,274 2,276 2,527 229,575 11 91 113 101 106 207 1,731 2,389 3,537321 744 1,812 1,859 1,065 96,986 24 91 107 54 248 302 535 2,837 2,898322 42 126 132 23 2,021 49 89 91 16 266 282 102 704 704331 890 696 702 584 46,016 35 79 92 66 229 295 825 4,384 4,391332 180 165 184 68 5,090 18 75 78 31 286 317 704 1,455 1,455 50% 51% 63%411 60 194 311 51 3,833 33 75 78 20 35 55 244 663 664412 896 1,665 1,678 1,907 102,210 19 54 73 61 11 73 1,637 570 1,643421 188 546 557 267 13,242 18 50 61 24 57 81 535 2,015 2,018422 26 65 65 16 718 45 46 55 11 79 91 181 559 560431 580 477 525 596 15,196 15 26 38 32 34 66 761 3,232 3,239432 2 11 11 0 0 32 32 32 0 0 0 0 0 0 18% 32% 21%999 544 315 944 611 18,327 30 30 30 58 915 973 2,275 4,686 4,691
Sum 6,878 14,469 17,563 8,827 642,722 11 73 123 44 374 418 2,275 9,253 9,257 100% 100% 100%
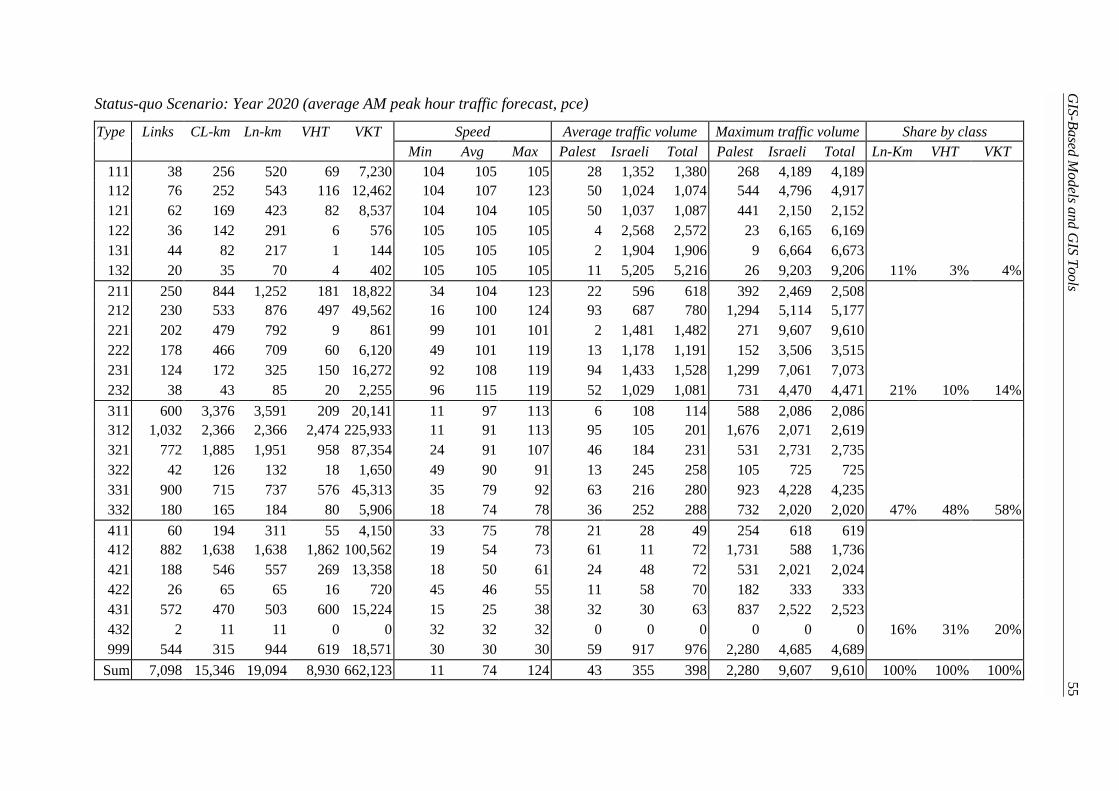
GIS-Based M
odels and GIS Tools
55
Status-quo Scenario: Year 2020 (average AM peak hour traffic forecast, pce)
Type Links CL-km Ln-km VHT VKT Speed Average traffic volume Maximum traffic volume Share by classMin Avg Max Palest Israeli Total Palest Israeli Total Ln-Km VHT VKT
111 38 256 520 69 7,230 104 105 105 28 1,352 1,380 268 4,189 4,189112 76 252 543 116 12,462 104 107 123 50 1,024 1,074 544 4,796 4,917121 62 169 423 82 8,537 104 104 105 50 1,037 1,087 441 2,150 2,152122 36 142 291 6 576 105 105 105 4 2,568 2,572 23 6,165 6,169131 44 82 217 1 144 105 105 105 2 1,904 1,906 9 6,664 6,673132 20 35 70 4 402 105 105 105 11 5,205 5,216 26 9,203 9,206 11% 3% 4%211 250 844 1,252 181 18,822 34 104 123 22 596 618 392 2,469 2,508212 230 533 876 497 49,562 16 100 124 93 687 780 1,294 5,114 5,177221 202 479 792 9 861 99 101 101 2 1,481 1,482 271 9,607 9,610222 178 466 709 60 6,120 49 101 119 13 1,178 1,191 152 3,506 3,515231 124 172 325 150 16,272 92 108 119 94 1,433 1,528 1,299 7,061 7,073232 38 43 85 20 2,255 96 115 119 52 1,029 1,081 731 4,470 4,471 21% 10% 14%311 600 3,376 3,591 209 20,141 11 97 113 6 108 114 588 2,086 2,086312 1,032 2,366 2,366 2,474 225,933 11 91 113 95 105 201 1,676 2,071 2,619321 772 1,885 1,951 958 87,354 24 91 107 46 184 231 531 2,731 2,735322 42 126 132 18 1,650 49 90 91 13 245 258 105 725 725331 900 715 737 576 45,313 35 79 92 63 216 280 923 4,228 4,235332 180 165 184 80 5,906 18 74 78 36 252 288 732 2,020 2,020 47% 48% 58%411 60 194 311 55 4,150 33 75 78 21 28 49 254 618 619412 882 1,638 1,638 1,862 100,562 19 54 73 61 11 72 1,731 588 1,736421 188 546 557 269 13,358 18 50 61 24 48 72 531 2,021 2,024422 26 65 65 16 720 45 46 55 11 58 70 182 333 333431 572 470 503 600 15,224 15 25 38 32 30 63 837 2,522 2,523432 2 11 11 0 0 32 32 32 0 0 0 0 0 0 16% 31% 20%999 544 315 944 619 18,571 30 30 30 59 917 976 2,280 4,685 4,689
Sum 7,098 15,346 19,094 8,930 662,123 11 74 124 43 355 398 2,280 9,607 9,610 100% 100% 100%
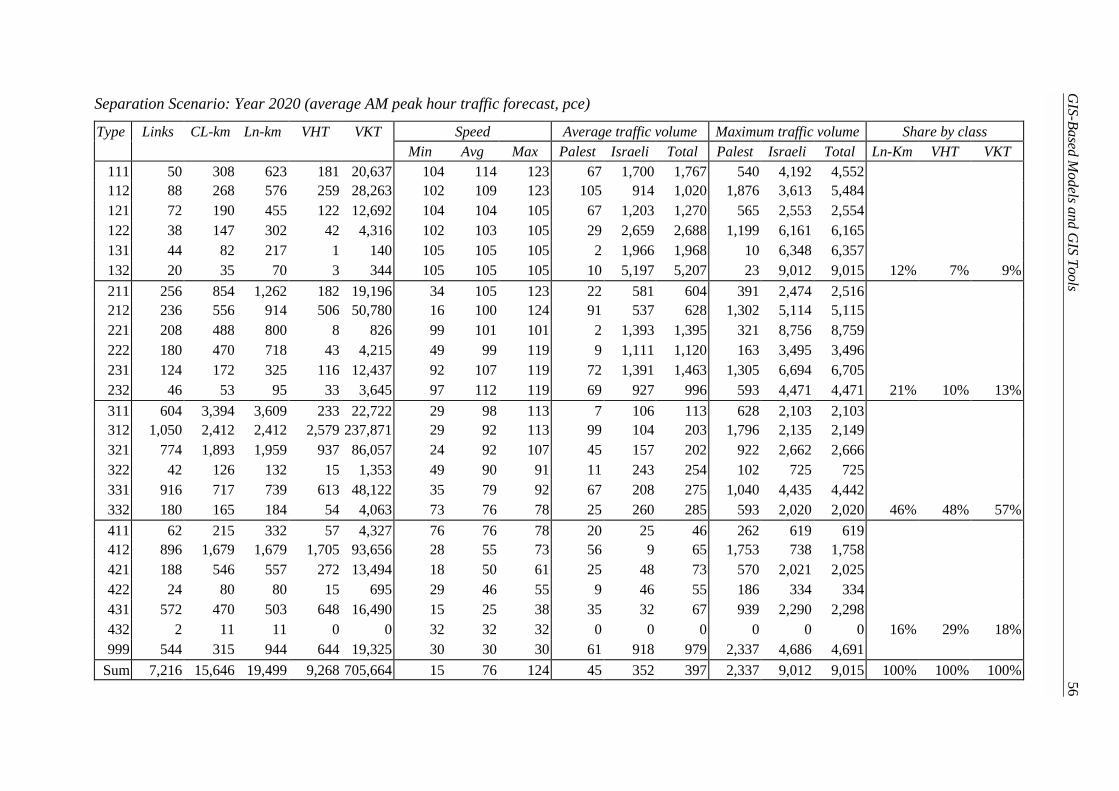
GIS-Based M
odels and GIS Tools
56
Separation Scenario: Year 2020 (average AM peak hour traffic forecast, pce)
Type Links CL-km Ln-km VHT VKT Speed Average traffic volume Maximum traffic volume Share by classMin Avg Max Palest Israeli Total Palest Israeli Total Ln-Km VHT VKT
111 50 308 623 181 20,637 104 114 123 67 1,700 1,767 540 4,192 4,552112 88 268 576 259 28,263 102 109 123 105 914 1,020 1,876 3,613 5,484121 72 190 455 122 12,692 104 104 105 67 1,203 1,270 565 2,553 2,554122 38 147 302 42 4,316 102 103 105 29 2,659 2,688 1,199 6,161 6,165131 44 82 217 1 140 105 105 105 2 1,966 1,968 10 6,348 6,357132 20 35 70 3 344 105 105 105 10 5,197 5,207 23 9,012 9,015 12% 7% 9%211 256 854 1,262 182 19,196 34 105 123 22 581 604 391 2,474 2,516212 236 556 914 506 50,780 16 100 124 91 537 628 1,302 5,114 5,115221 208 488 800 8 826 99 101 101 2 1,393 1,395 321 8,756 8,759222 180 470 718 43 4,215 49 99 119 9 1,111 1,120 163 3,495 3,496231 124 172 325 116 12,437 92 107 119 72 1,391 1,463 1,305 6,694 6,705232 46 53 95 33 3,645 97 112 119 69 927 996 593 4,471 4,471 21% 10% 13%311 604 3,394 3,609 233 22,722 29 98 113 7 106 113 628 2,103 2,103312 1,050 2,412 2,412 2,579 237,871 29 92 113 99 104 203 1,796 2,135 2,149321 774 1,893 1,959 937 86,057 24 92 107 45 157 202 922 2,662 2,666322 42 126 132 15 1,353 49 90 91 11 243 254 102 725 725331 916 717 739 613 48,122 35 79 92 67 208 275 1,040 4,435 4,442332 180 165 184 54 4,063 73 76 78 25 260 285 593 2,020 2,020 46% 48% 57%411 62 215 332 57 4,327 76 76 78 20 25 46 262 619 619412 896 1,679 1,679 1,705 93,656 28 55 73 56 9 65 1,753 738 1,758421 188 546 557 272 13,494 18 50 61 25 48 73 570 2,021 2,025422 24 80 80 15 695 29 46 55 9 46 55 186 334 334431 572 470 503 648 16,490 15 25 38 35 32 67 939 2,290 2,298432 2 11 11 0 0 32 32 32 0 0 0 0 0 0 16% 29% 18%999 544 315 944 644 19,325 30 30 30 61 918 979 2,337 4,686 4,691
Sum 7,216 15,646 19,499 9,268 705,664 15 76 124 45 352 397 2,337 9,012 9,015 100% 100% 100%
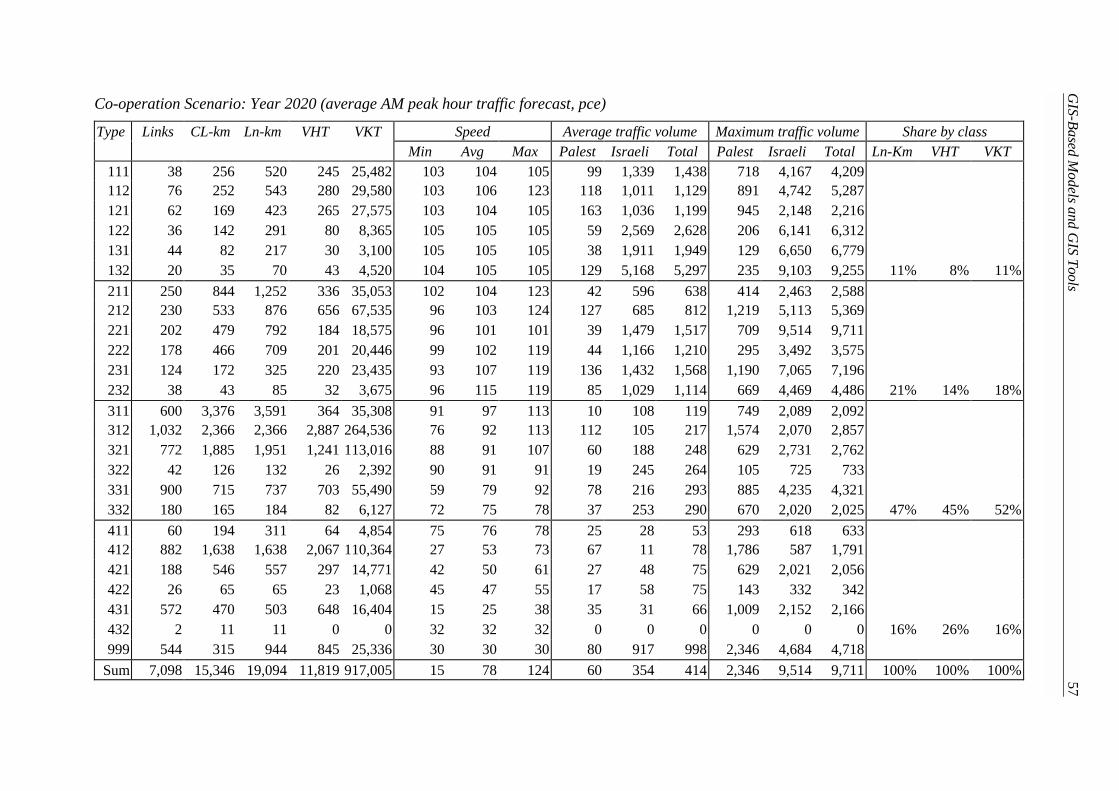
GIS-Based M
odels and GIS Tools
57
Co-operation Scenario: Year 2020 (average AM peak hour traffic forecast, pce)
Type Links CL-km Ln-km VHT VKT Speed Average traffic volume Maximum traffic volume Share by classMin Avg Max Palest Israeli Total Palest Israeli Total Ln-Km VHT VKT
111 38 256 520 245 25,482 103 104 105 99 1,339 1,438 718 4,167 4,209112 76 252 543 280 29,580 103 106 123 118 1,011 1,129 891 4,742 5,287121 62 169 423 265 27,575 103 104 105 163 1,036 1,199 945 2,148 2,216122 36 142 291 80 8,365 105 105 105 59 2,569 2,628 206 6,141 6,312131 44 82 217 30 3,100 105 105 105 38 1,911 1,949 129 6,650 6,779132 20 35 70 43 4,520 104 105 105 129 5,168 5,297 235 9,103 9,255 11% 8% 11%211 250 844 1,252 336 35,053 102 104 123 42 596 638 414 2,463 2,588212 230 533 876 656 67,535 96 103 124 127 685 812 1,219 5,113 5,369221 202 479 792 184 18,575 96 101 101 39 1,479 1,517 709 9,514 9,711222 178 466 709 201 20,446 99 102 119 44 1,166 1,210 295 3,492 3,575231 124 172 325 220 23,435 93 107 119 136 1,432 1,568 1,190 7,065 7,196232 38 43 85 32 3,675 96 115 119 85 1,029 1,114 669 4,469 4,486 21% 14% 18%311 600 3,376 3,591 364 35,308 91 97 113 10 108 119 749 2,089 2,092312 1,032 2,366 2,366 2,887 264,536 76 92 113 112 105 217 1,574 2,070 2,857321 772 1,885 1,951 1,241 113,016 88 91 107 60 188 248 629 2,731 2,762322 42 126 132 26 2,392 90 91 91 19 245 264 105 725 733331 900 715 737 703 55,490 59 79 92 78 216 293 885 4,235 4,321332 180 165 184 82 6,127 72 75 78 37 253 290 670 2,020 2,025 47% 45% 52%411 60 194 311 64 4,854 75 76 78 25 28 53 293 618 633412 882 1,638 1,638 2,067 110,364 27 53 73 67 11 78 1,786 587 1,791421 188 546 557 297 14,771 42 50 61 27 48 75 629 2,021 2,056422 26 65 65 23 1,068 45 47 55 17 58 75 143 332 342431 572 470 503 648 16,404 15 25 38 35 31 66 1,009 2,152 2,166432 2 11 11 0 0 32 32 32 0 0 0 0 0 0 16% 26% 16%999 544 315 944 845 25,336 30 30 30 80 917 998 2,346 4,684 4,718
Sum 7,098 15,346 19,094 11,819 917,005 15 78 124 60 354 414 2,346 9,514 9,711 100% 100% 100%