Embed Size (px)
Citation preview

172 M.F. Ahmed, R.M. Faisal
Key words: AHP, SAW, GWQ, Al-Shekhan area, GIS based model
Introduction
Groundwater Quality (GWQ) deter-mination of human consumption is nec-essary for a healthy living (Ishaku, 2011). There is a shortage of papers published in regard of GWQ at Nineveh governo-rate, Iraq, nevertheless a rapid review of research concerning similar cases study-ing GWQ in other areas.
Al-Hayali (2010) studied GWQ of 16 wells distributed in Mosul city, Iraq during 2008 along four months. The re-sults show that GWQ of the wells were unsuitable for drinking purposes but it was suitable only for plants resistant to saline water.
Mukheef, Al-Kubaisi and Rasool (2019) assessed the GWQ in Baghdad Province for irrigation purposes by using WQI. The results show that there is an
increase of Cl, K, and Ca ions in water samples, and that GWQ is very poor in the middle part of the studied area while it is moderate in the western part for the irrigation purpose.
Gorgij, Kisi, Moghaddam and Taghipour (2017) assessed GWQ of 21 samples at Azarshahr Plain, Iran for drinking purposes by using the entropy technique which extracts the weights needed in determining the Water Qual-ity Index (WQI). The results show that the GW samples are classifi ed as good to poor, and bicarbonate ion is the most effective parameter.
Rao, Venkatesch and Ahmed (2018) studied GWQ of 30 wells in Guntur District Andhra Pradesh-India. Inverse Distance Weighted IDA technique was used to determine the spatial distribu-tion of the GW parameters. The results show that most of GWQ which is located in the western parts of the district is not suitable for drinking purposes, while the
Scientifi c Review – Engineering and Environmental Sciences (2020), 29 (2), 172–183Sci. Rev. Eng. Env. Sci. (2020), 29 (2)Przegląd Naukowy – Inżynieria i Kształtowanie Środowiska (2020), 29 (2), 172–183Prz. Nauk. Inż. Kszt. Środ. (2020), 29 (2)http://iks.pn.sggw.plDOI 10.22630/PNIKS.2020.29.2.15
Mohammed Fakhraldeen AHMED, Raid Mahmood FAISALMosul University, Collage of Environmental Sciences and Technology
GIS based modeling of GWQ assessment at Al-Shekhan area using AHP and SAW techniques

GIS based modeling of GWQ assessment at Al-Shekhan area using AHP... 173
eastern part of the district had the most suitability zones for different purposes.
Al-Ozeer and Ahmed (2019) as-sessed 18 shallow wells for different purposes at east side of Mosul city using SAW technique. The research included an application of Groundwater Modeling System (GMS 10.1) to create the studied area sub-layers as three dimension map. The results show that GWQ is suitable for livestock purposes.
Ochungo, Ouma, Obiero and Odero (2019) studied samples of 39 wells to assess their suitability for drinking pur-pose in Langata, Kenya. The research concluded that there is no indication of surface water percolation due to low concentrations of SO4 and Cl ions.
Minh et al. (2019) developed WQI by founding the weight of parameters depends on fuzzy-AHP techniques of shallow wells during 10 years in Giang Province, Vietnam. The research con-cluded that GWQ in areas located in the Northeast of Giang had very bad qual-ity because of both human activities and natural reasons.
Ibe, Aigbedion, Marcellinus, Okoli and Sola (2019) studied the physical and chemical properties of GW samples from 45 wells for drinking purposes at Ado-Ekiti State, Nigeria, using WQI and Arc GIS. The results show that 34 wells were suitable, while the rest were unsuitable. The research ranked WQ in the studied area as best in the north-west, fair in south east, and very poor in the south.
This study aims to assess GWQ of Al--Shekhan area by the help of AHP, SAW techniques and Arc GIS version 10.5 to build a model which serves this aim, and can be a raw model to be applied to as-
sess GWQ in any other area after insert-ing the values of their parameters.
Material and techniques
The studied area
Al-Shekhan area is located in the north eastern of Mosul city, Iraq between 36°44′57″ to 36°29′6″ N latitudes and between 43°12′28″ to 43°31′10″ E lon-gitude with 30 wells to be examined, as in Figure 1.
Data analysis
Eleven parameters are experimentally analyzed based on APHA, AWWA, WEF (2005) measurements and compared with international standards (WHO, 2003; EPA, 2004), as in Table 1. Data of param-eters is tabulated in Table 2.
The used techniques
Analytical Hierarchical ProcessAHP technique was fi rstly developed
by (Saaty, 1980, 2008). This technique can be used in different applications (Faisal & Ahmed, 2018). This tech-nique uses pair wise comparison to de-rive the relative weights of parameters. Three steps are used in this technique; the extracted parameters are organized and given certain importance degree in the fi rst step. Then, a matrix of the se-lected relative weights is adopted in the second step. At last, the consistency ratio (CR) is applied to check the importance degree. If CR ≤ 0.1, there is no need for reweighting. The scale of relative importance for pair wise comparison is arranged as a scale from 1 to 9, where 1 represents equal importance while 9 represents extreme importance.

174 M.F. Ahmed, R.M. Faisal
FIGURE 1. Location of the studied area
TABLE 1. Parameters international standards
Drinking parameters
Drinking standards
(EPA, 2004)
Irrigation parameters
Irrigation standards
(EPA, 2004)
Livestockparameters
Livestock standards
(WHO, 2003)Ca2+ 75 mg·l–1 Na+ 200 mg·l–1 TDS 10 000 mg·l–1
Mg2+ 100 mg·l–1 HCO3– 350 mg·l–1 EC 12 500 mg·l–1
Na+ 200 mg·l–1 SAR 15 meq·l–1 pH 6.5–8.5HCO3
– 400 mg·l–1 Cl– 250 mg·l–1 NO3– 440 mg·l–1
SO42– 250 mg·l–1 B 0.7 mg·l–1 SO4
2– 250 mg·l–1
Cl– 250 mg·l–1 TDS 1 750 mg·l–1 × ×NO3
– 10 mg·l–1 pH 6.5–8.5 mg·l–1 × ×TDS 500 mg·l–1 EC 2 700 μhos·cm–1 × ×pH 6.5–8.5 × × × ×EC 2 000 μhos·cm–1 × × × ×

GIS based modeling of GWQ assessment at Al-Shekhan area using AHP... 175
TABLE 2. Studied wells parameter’s data
WellDepth Ca Mg Cl Na SAR SO4 HCO3 NO3 TDS EC pH
m mg·l–1 meq·l–1 mg·l–1 μhos·cm–1 -1 100 18.0 4.0 37.0 20.0 1.11 10.0 50 0.3 226 550 8.62 203 135.0 73.0 280.0 175.0 3.02 160.0 370 2.4 1 890 3 270 8.03 144 28.0 8.0 60.0 30.0 1.29 23.0 70 0.3 276 475 8.64 200 24.0 28.2 17.0 94.0 3.1 285.0 147 176.0 494 761 8.95 120 19.2 25.3 15.0 13.0 0.46 225.0 288 152.0 228 305 8.86 183 30.9 3.9 19.9 200.0 9.05 76.9 319 6.6 450 603 7.27 156 48.0 23.0 5.0 22.0 0.64 28.0 280 2.0 260 425 8.18 185 24.0 42.9 31.0 92.0 2.59 97.5 241 1.2 356 571 8.29 200 19.3 38.0 17.0 66.0 2.00 76.0 292 1.9 592 703 7.510 156 27.3 32.2 5.0 7.8 0.24 21.8 226 3.1 355 468 7.011 156 32.1 24.3 18.9 52.0 1.68 35.4 273 2.7 455 577 7.812 168 90.0 52.6 40.0 26.0 0.53 44.2 478 3.14 769 863 7.113 160 46.5 12.6 2.0 14.0 0.46 6.0 219 3.89 334 353 6.914 150 62.6 4.87 3.0 15.0 0.48 10.3 224 2.75 326 335 7.115 150 27.3 34.1 3.0 21.0 0.63 11.7 258 2.19 368 393 7.216 150 57.8 21.4 3.0 6.0 0.17 21.2 258 1.50 387 446 8.117 180 59.4 61.4 20.0 17.0 0.32 157.0 253 1.10 610 945 7.318 149 321.0 117.0 26.0 17.0 0.20 954.0 219 0.36 1 663 1 890 7.619 152 35.3 41.4 12.0 11.0 0.29 55.7 248 1.59 405 527 7.820 123 32.0 28.0 18.0 34.0 5.01 40.0 170 50.0 335 608 8.121 49 40.0 28.0 11.0 56.0 7.62 48.0 246 10.0 285 480 7.122 134 44.0 33.0 15.0 48.0 0.00 43.0 322 0.0 376 620 8.123 47 19.0 11.0 66.0 100.0 20.20 24.0 290 0.0 334 650 8.024 75 47.0 38.0 20.0 46.0 5.66 91.0 251 2.0 424 677 8.225 61 52.0 23.0 9.0 21.0 2.63 34.0 254 2.0 272 377 7.826 104 28.0 29.0 4.0 2.0 0.30 19.0 159 18.0 199 294 8.327 55 48.0 29.0 15.0 58.0 7.33 99.0 230 8.0 392 597 8.028 104 132.0 76.0 19.0 35.0 2.68 238.0 299 34.0 769 1 450 6.829 73 24.0 34.0 23.0 18.0 2.81 10.0 250 0.0 221 430 7.630 76 44.0 34.0 14.0 28.0 3.58 38.0 311 19.0 331 490 7.7

176 M.F. Ahmed, R.M. Faisal
Tripych worksheetTripych is an Excel add-in tool that
is part of the Statistical Design Institute (StatDesign, 2018) which is used to pri-oritize items by performing AHP matrix of the parameters. The yielded results are tabulated in Tables 3, 4, and 5.
Simple Additive Weighting techniqueSimple Additive Weighting tech-
nique is used fi rstly by McDuffi e and Haney in 1973 to summarize the huge data into one index. In this simple tech-nique, relative weights which are ex-tracted from AHP are multiplied by qual-ity rating scale to calculate the sub-index for each parameter. The following equa-tion illustrates the calculation of quality rating (Qr) which is computed by divid-ing the concentration of each parameter (Ci) to its standard value (S), as follows: Qr = Ci / S. Summation of the sun-indi-ces gives the fi nal index. This fi nal index classifi es water quality into fi ve catego-ries: 0–25 excellent, 26–50 good, 51–75 poor, 76–100 very poor, and unsuitable if the index is more than 100. The indices’ results of the three purposes are tabulat-ed in Table 6.
Geographic Information SystemARC GIS 10.5 is used to create all
the suitability maps for each purpose, then building a model through apply-ing multiple tools and fi nally extracting the fi nal map (Esri, 2016). Maps of each purpose were created by ArcGIS, as in Figures 2, 3 and 4.
TAB
LE 3
. Trip
ych
drin
king
wat
er re
sults
, CR
= 0
.047
9
TDS
ECSO
4N
O3
Ca
Mg
Na
HC
O3
Cl
pHR
ow to
tal
Rel
ativ
e im
porta
nce
Scal
ed
impo
rtanc
e1
TDS
12
33
45
54
55
37.0
021
.11%
5.00
2EC
1/2
12
23
44
34
427
.50
15.6
9%3.
873
SO4
1/3
1/2
12
34
43
56
28.8
316
.45%
4.03
4N
O3
1/3
1/2
1/2
12
34
35
625
.33
14.4
5%3.
615
Ca
1/4
1/3
1/3
1/2
12
22
34
15.4
28.
80%
2.43
6M
g1/
51/
41/
41/
31/
21
20.
53
412
.03
6.87
%2.
027
Na
1/5
1/4
1/4
1/4
1/2
1/2
10.
52
38.
454.
82%
1.60
8H
CO
31/
41/
31/
31/
31/
22
21
23
11.7
56.
70%
1.99
9C
l1/
51/
41/
51/
51/
31/
31/
21/
21
25.
523.
15%
1.25
10pH
1/5
1/4
1/6
1/6
1/4
1/4
1/3
1/3
1/2
13.
451.
97%
1.00
GIS based modeling of GWQ assessment at Al-Shekhan area using AHP... 177
The results
Figure 2 illustrates the suitability of drinking water purpose where the high-er class ranges between 19.27 and 25, which is located in the north western part of the studied area, and lower class is 87.5–100, which is located in the north eastern part of the studied area. Figure 3shows the suitability of irrigation pur-pose where the higher class ranges be-tween 16 and 20, which is located in the north western part of the studied area and lower class is 40–45, which is located in the south eastern part of the studied area. Figure 4 illustrates the suitability of livestock purpose where the higher class ranges between 9.2 and 15 including the whole studied area except the eastern part which is considered as the lower class with 25–30. All relative weights and indices extracted from AHP and SAW respectively, in addition to Figures 2, 3, and 4 are utilized to build a model.
Model building
A model is built using ArcGIS and its primary tools as “Add fi eld”, “Calcu-lated fi eld”, and “Kernel”; while the sec-ondary tools are: “Reclassify”, “Raster to vector”, “Clip”, “Union overlay”, and “Select by attribute”, as in Figure 5. This model utilizes the importance scale of parameters, the relative weights indices, and area suitability maps to create the fi -nal map which represents an overall ref-erence combining the suitability of water for the three purposes.
Final map
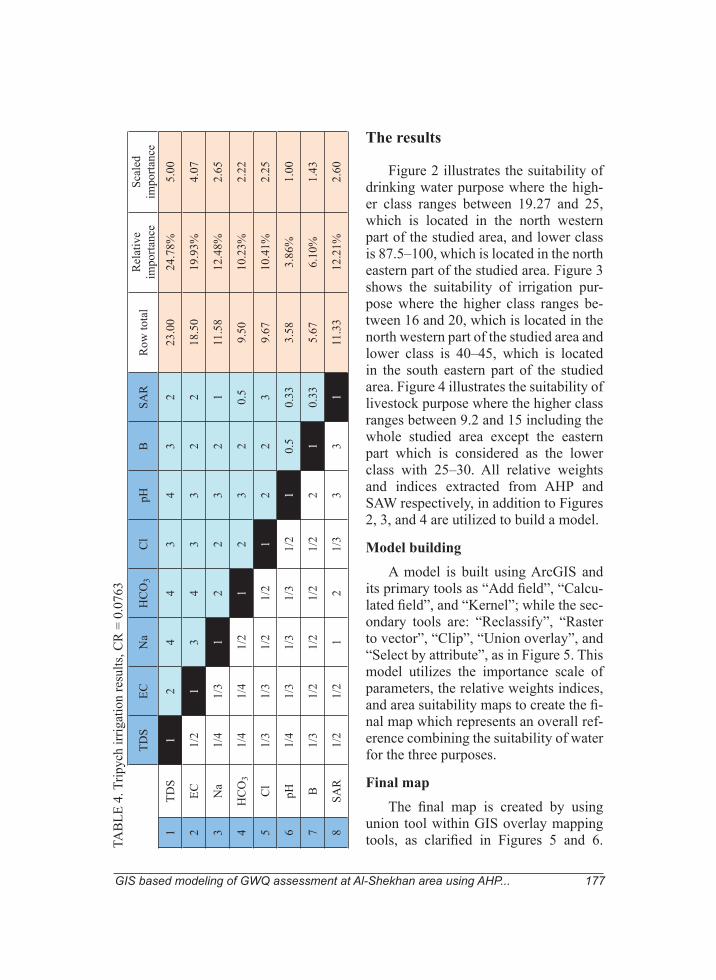
The fi nal map is created by using union tool within GIS overlay mapping tools, as clarifi ed in Figures 5 and 6. TA
BLE
4. T
ripyc
h irr
igat
ion
resu
lts, C
R =
0.0
763
TDS
ECN
aH
CO
3C
lpH
BSA
RR
ow to
tal
Rel
ativ
e im
porta
nce
Scal
ed
impo
rtanc
e
1TD
S1
24
43
43
223
.00
24.7
8%5.
00
2EC
1/2
13
43
32
218
.50
19.9
3%4.
07
3N
a1/
41/
31
22
32
111
.58
12.4
8%2.
65
4H
CO
31/
41/
41/
21
23
20.
59.
5010
.23%
2.22
5C
l1/
31/
31/
21/
21
22
39.
6710
.41%
2.25
6pH
1/4
1/3
1/3
1/3
1/2
10.
50.
333.
583.
86%
1.00
7B
1/3
1/2
1/2
1/2
1/2
21
0.33
5.67
6.10
%1.
43
8SA
R1/
21/
21
21/
33
31
11.3
312
.21%
2.60

178 M.F. Ahmed, R.M. Faisal
TABLE 5. Tripych livestock results, CR = 0.0204
TDS EC pH NO3 SO4Row total
Relative importance
Scaled importance
1 TDS 1 2 4 3 3 13.00 37.96% 5.002 EC 1/2 1 3 2 2 8.50 24.82% 3.273 PH 1/4 1/3 1 0.5 0.5 2.58 7.54% 1.004 NO3 1/3 1/2 2 1 0.5 4.33 12.65% 1.675 SO4 1/3 1/2 2 2 1 5.83 17.03% 2.25
TABLE 6. GWQIs of each purpose
Well DrinkingIndex DGWQ Irrigation
Index IGWQ Livestock Index LGWQ
1 19.2 excellent 18 excellent 10.7 excellent2 137.3 unsuitable 92.7 very poor 25 excellent3 22.7 excellent 21.7 excellent 11 excellent4 50 good 32 good 22.2 excellent5 36 good 21.2 excellent 18.5 excellent6 39.6 good 45.3 good 11.6 excellent7 26.5 good 23.5 excellent 10.5 excellent8 36.2 good 30.7 good 12.4 excellent9 45.1 good 32.3 good 12.5 excellent10 28 good 19.8 excellent 9.7 excellent11 36.3 good 29 good 11.4 excellent12 59.1 poor 38 good 12.6 excellent13 26.6 good 19.8 excellent 9.2 excellent14 26.5 good 18.9 excellent 9.2 excellent15 29.1 good 22.4 excellent 9.6 excellent16 31.2 good 21.1 excellent 10.9 excellent17 50.6 good 29 good 14.2 excellent18 150 unsuitable 51.5 poor 33.6 good19 34 good 24.3 excellent 11.4 excellent20 32.6 good 25 good 12.7 excellent21 34.6 good 28.7 good 10.2 excellent22 34.6 good 27.8 good 11.5 excellent23 31.3 good 34.5 good 11 excellent24 38.8 good 30.6 good 12.8 excellent25 26.5 good 20.7 excellent 10.2 excellent26 23.4 excellent 16 excellent 10.5 excellent

GIS based modeling of GWQ assessment at Al-Shekhan area using AHP... 179
FIGURE 2. Drinking water suitability classes
TABLE 6 cont.
Well DrinkingIndex DGWQ Irrigation
Index IGWQ Livestock Index LGWQ
27 38.3 good 26.4 good 12.6 excellent28 80.4 very poor 38.8 good 17.6 excellent29 22.5 excellent 22 excellent 9.5 excellent30 36.6 good 27.4 good 11.1 excellent
FIGURE 3. Irrigation water suitability classes

180 M.F. Ahmed, R.M. Faisal
This map shows that the fi rst part 4.6% of the study area which is located in the western part is excellent for the three purposes. The central large part which represents 70% of the study area is good for the three purposes. The eastern part of the studied area occupies the last class which represents 25.4% of the study area
which is only suitable for irrigation and livestock purposes.
The discussion
To the best of the knowledge of the authors of this study, there is no previous work that build a model based on both
FIGURE 4. Livestock suitability classes
FIGURE 6. The fi nal map

GIS based modeling of GWQ assessment at Al-Shekhan area using AHP... 181
FIG
UR
E 5.
The
mod
el b
uild
ing

182 M.F. Ahmed, R.M. Faisal
ArcGIS and AHP to assess groundwater quality. Therefore, the concluded model can be conducted to create a detailed map of classes of water suitability after applying the relevant parameters.
Conclusions
The use of AHP and SAW are useful to determine the relative weights and in-dices of the parameters. ArcGIS utilizes the combination of the relative weights and indices in addition to water suitabil-ity maps to create a model. The model identifi es water quality in the study area and is considered as a database for future agricultural and developmental projects. The fi nal map illustrates that GWQ can be classifi ed according to its indices, where all wells are suitable for multi-purposes except wells (18, 24, and 28), as in Figure 1, which are appropriate for irrigation and livestock only.
Acknowledgements
The authors are very grateful to the College of Environmental Sciences and Technology of the University of Mosul for their provided facilities, which helped to improve the quality of this work.
References
Al-Hayali, A.K. (2010). Studying groundwater quality in Mosul City and its suburb and its suitability for drinking and irrigation. Jour-nal of Education and Science, 23(3), 48-67.
Al-Ozeer, A.Z. & Ahmed, M.F. (2019). Ground-water assessment at east side of Mosul City during 2014–2017. Scientifi c Review – Engi-neering and Environmental Sciences, 28(1), 35-48. DOI 10.22630/PNIKS.2019.28.1.4
American Public Health Association [APHA], American Water Works Association [AWWA], Water Environment Federation [WEF] (2005). Standard methods for the examination of water and wastewaters. Washington, DC: APHA.
Environmental Protection Agency [EPA] (2004). Guidelines for water reuse. Washington, DC: Environmental Protection Agency and U.S. Agency for International Development.
Esri (2016). Arc GIS 10.5.0.6491. Retrieved from: www.esri.com
Faisal, R.M. & Ahmed, M.F. (2018). GIS and AHP based modeling for landfi ll site selec-tion (case study: west side of Mosul city). Scientifi c Review – Engineering and Envi-ronmental Sciences, 27(4), 425-437.
Gorgij, A.D., Kisi, O., Moghaddam, A.A., Taghipour, A. (2017). Groundwater quality ranking for drinking purposes, using the en-tropy technique and the spatial autocorrelation index. Environmental Earth Science, 76(7), 269. DOI 10.1007/s12665-017-6589-6
Ibe, P.I., Aigbedion, I.P., Marcellinus, M., Okoli, F.U. & Sola, A.B. (2019). Assessment of water quality index for groundwater in Ado Ekiti, Nigeria. Journal of World News of Natural Sciences (WNOFNS), 22, 93-101.
Ishaku, J.M. (2011). Assessment of groundwater quality index for Jimeta-yola area, north east-ern Nigeria. Journal of Geology and Mining Research, 3(4), 219-231.
McDuffi e, B. & Haney, J.T. (1973). A proposed river pollution index. Spring 1973 Meeting of the American Chemical Society, Division of Water, Air and Waste Chemistry.
Minh, H.V., Avtar, R., Kumar, P., Tran, D.Q., Ty, T.V., Behera, H.C. & Kurasaki, M. (2019). Groundwater quality assessment using fuzzy--AHP in An Giang Province of Vietnam. Journal of Geosciences, 9(8), 330. DOI 10.3390/ geosciences 9080330
Mukheef, R.A., Al-Kubaisi, A.A. & Rasool, M.H. (2019). Evaluating the groundwater suitability for a number of wells in Baghdad province for irrigation. International Journal of Civil Engineering and Technology, 10(1), 1186-1204.
Ochungo, E.A., Ouma, G.O., Obiero, J.P.O. & Odero, N.A. (2019). Water Quality Index for assessment of potability of groundwater re-

GIS based modeling of GWQ assessment at Al-Shekhan area using AHP... 183
source in Langata Sub County, Nairobi-Ken-ya. American Journal of Water Resources, 7(2), 62-75.
Rao, K.T.V.S., Venkatesh, D.V. & Ahmed, S.F. (2018). Assessment and comparison of ground water quality in Guntur District, And-hra Pradesh by using ARC GIS. International Journal of Innovative Science and Research Technology, 3(4), 201-213.
Saaty, T.L. (1980). The analytic hierarchy pro-cess. New York: McGraw-Hill.
Saaty, T.L. (2008). Decision making with the ana-lytic hierarchy process. International Journal of Sciences, 1(1), 83-98.
StatDesign (2018). SDI tools 4.11.1. Retrieved from: https//stat-design.com
World Health Organization [WHO]. (2003). Guideline for drinking-water quality. Ge-neva: WHO.
Summary
GIS based modeling of GWQ assess-ment at Al-Shekhan area using AHP and SAW techniques. There is a continuous need to assess Groundwater Quality (GWQ) for human benefi cial uses especially in areas suffering a shortage of nearby surface water. This study aims to assess GWQ of 56 wells located at Al-Shekhan area for drinking, ir-rigation, and livestock purposes. Analytical
Hierarchical Process (AHP) technique is used to extract weights of parameters that are needed in the calculation of Simple Ad-ditive Weighting (SAW) technique. Maps are created using Geographical Information Systems (GIS), and these maps shows the classes of suitable areas for each purpose depending upon the calculated indices which are extracted from SAW technique. The re-sults show that the fi nal map classifi es the suitable parts according to the drinking, ir-rigation and livestock purposes, and it shows that the north eastern part of the studied area is suitable for irrigation and livestock only. A model of GIS and AHP is built to assess the suitability of GWQ in Al-Shekhan area, and can be a raw model to be applied to as-sess GWQ in any other area after inserting the values of their parameters.
Authors’ address:Mohammed Fakhraldeen Ahmed (https://orcid.org/0000-0003-0414-0409)Raid Mahmood Faisal al-MoulaMosul UniversityCollage of Environmental Sciences and TechnologyDepartment of Environmental Technology42001, Mosul, Iraqe-mail: [email protected]