Embed Size (px)
Citation preview
This article was downloaded by: [University of Chicago]On: 03 June 2012, At: 16:28Publisher: Taylor & FrancisInforma Ltd Registered in England and Wales Registered Number: 1072954 Registeredoffice: Mortimer House, 37-41 Mortimer Street, London W1T 3JH, UK
International Journal of GeographicalInformation SciencePublication details, including instructions for authors andsubscription information:http://www.tandfonline.com/loi/tgis20
GIS-based method of delimitating tradearea for retail chainsCan Cui a , Jiechen Wang a , Yingxia Pu a , Jinsong Ma a & GangChen aa Department of Geographic Information Science, NanjingUniversity, Nanjing, PR China
Available online: 20 Mar 2012
To cite this article: Can Cui, Jiechen Wang, Yingxia Pu, Jinsong Ma & Gang Chen (2012): GIS-based method of delimitating trade area for retail chains, International Journal of GeographicalInformation Science, DOI:10.1080/13658816.2012.661058
To link to this article: http://dx.doi.org/10.1080/13658816.2012.661058
PLEASE SCROLL DOWN FOR ARTICLE
Full terms and conditions of use: http://www.tandfonline.com/page/terms-and-conditions
This article may be used for research, teaching, and private study purposes. Anysubstantial or systematic reproduction, redistribution, reselling, loan, sub-licensing,systematic supply, or distribution in any form to anyone is expressly forbidden.
The publisher does not give any warranty express or implied or make any representationthat the contents will be complete or accurate or up to date. The accuracy of anyinstructions, formulae, and drug doses should be independently verified with primarysources. The publisher shall not be liable for any loss, actions, claims, proceedings,demand, or costs or damages whatsoever or howsoever caused arising directly orindirectly in connection with or arising out of the use of this material.
International Journal of Geographical Information ScienceiFirst, 2012, 1–17
GIS-based method of delimitating trade area for retail chains
Can Cui† , Jiechen Wang*, Yingxia Pu, Jinsong Ma and Gang Chen
Department of Geographic Information Science, Nanjing University, Nanjing, PR China
(Received 25 May 2011; final version received 22 January 2012)
Delimitating trade area with accuracy is a major concern for retail and service com-panies who want to adapt their marketing strategy to be competitive in today’s highlycompetitive chain industry. A collection of methods have been proposed to delimitatingtrade area, but either some are too simple or the necessary data are not available. In thisarticle, a geographic information system-based method for precisely delimitating tradearea is proposed. It is based on the fact that the social and economic activities areactualized along the street networks. The trade area can be delineated in terms of timedistance with high precision taking the practical traffic situations into account. In addi-tion, centered on this method of delimitating trade area, a wide array of functions canbe extended to support both operational day-to-day and long-term strategic decisionmaking for retailers.
Keywords: time distance; trade area; chain business; GIS
1. Introduction
The activities involved in business, such as evaluation of investment environment, marketanalysis, and economic flow simulation, rely heavily on the integrated analysis of spatialand attributes data. Effective exploration and using the spatial related data can not onlyoptimize resource allocation and reduce business operating costs but also serve for reg-ulating and monitoring business activities (Sarkar 2007). Geographic information system(GIS), which comprises a set of tools that capture, store, analyze, manage, and presentspatial data, can be widely applied in the economic and business field. Owing to its power-ful capabilities of integrated analysis on spatial data together with attribute data, GIS canaddress the complex issues of regional business by providing support for spatial decisionmaking, spatial planning, regional marketing, and other services. GIS has already beenapplied in many aspects of business in developed countries, including insurance, retail,telecommunication, real estate, transportation, and tourism.
Within the wide range of business, we focus on the chain business, which is closelyrelated to GIS because of their special operation patterns, spatial distribution and net-works, and information sharing (Wisner et al. 2009). Chain stores are retail outlets thatshare a brand and central management and usually have standardized business methodsand practices (Bozarth and Handfielf 2006). These characteristics also apply to chain
*Corresponding author. Email: [email protected]†Present address for Can Cui is Urban and Regional Research Centre Utrecht, Faculty ofGeosciences, Utrecht University, Utrecht, The Netherlands
ISSN 1365-8816 print/ISSN 1362-3087 online© 2012 Taylor & Francishttp://dx.doi.org/10.1080/13658816.2012.661058http://www.tandfonline.com
Dow
nloa
ded
by [
Uni
vers
ity o
f C
hica
go]
at 1
6:28
03
June
201
2
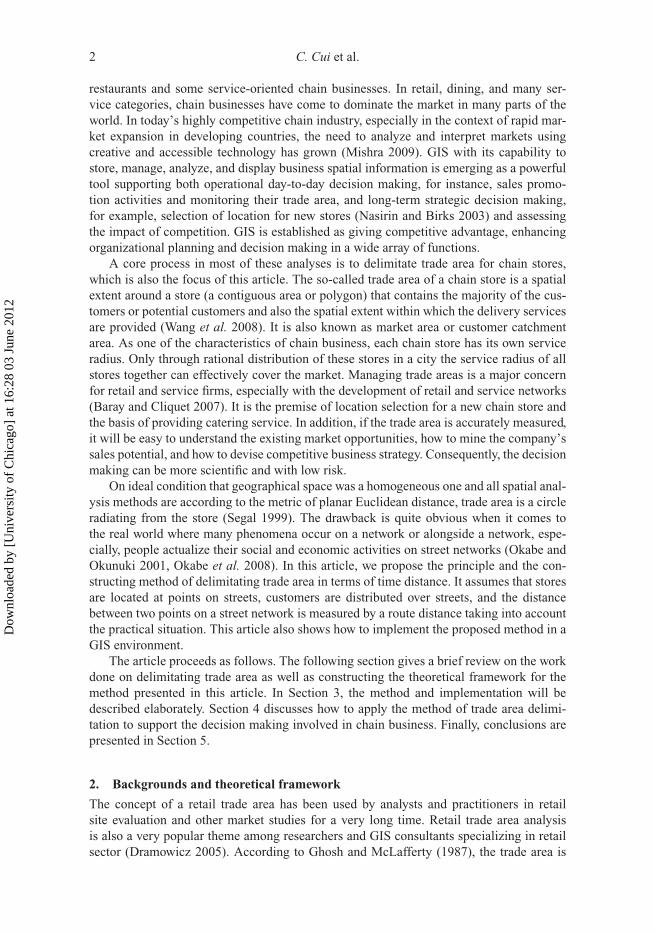
2 C. Cui et al.
restaurants and some service-oriented chain businesses. In retail, dining, and many ser-vice categories, chain businesses have come to dominate the market in many parts of theworld. In today’s highly competitive chain industry, especially in the context of rapid mar-ket expansion in developing countries, the need to analyze and interpret markets usingcreative and accessible technology has grown (Mishra 2009). GIS with its capability tostore, manage, analyze, and display business spatial information is emerging as a powerfultool supporting both operational day-to-day decision making, for instance, sales promo-tion activities and monitoring their trade area, and long-term strategic decision making,for example, selection of location for new stores (Nasirin and Birks 2003) and assessingthe impact of competition. GIS is established as giving competitive advantage, enhancingorganizational planning and decision making in a wide array of functions.
A core process in most of these analyses is to delimitate trade area for chain stores,which is also the focus of this article. The so-called trade area of a chain store is a spatialextent around a store (a contiguous area or polygon) that contains the majority of the cus-tomers or potential customers and also the spatial extent within which the delivery servicesare provided (Wang et al. 2008). It is also known as market area or customer catchmentarea. As one of the characteristics of chain business, each chain store has its own serviceradius. Only through rational distribution of these stores in a city the service radius of allstores together can effectively cover the market. Managing trade areas is a major concernfor retail and service firms, especially with the development of retail and service networks(Baray and Cliquet 2007). It is the premise of location selection for a new chain store andthe basis of providing catering service. In addition, if the trade area is accurately measured,it will be easy to understand the existing market opportunities, how to mine the company’ssales potential, and how to devise competitive business strategy. Consequently, the decisionmaking can be more scientific and with low risk.
On ideal condition that geographical space was a homogeneous one and all spatial anal-ysis methods are according to the metric of planar Euclidean distance, trade area is a circleradiating from the store (Segal 1999). The drawback is quite obvious when it comes tothe real world where many phenomena occur on a network or alongside a network, espe-cially, people actualize their social and economic activities on street networks (Okabe andOkunuki 2001, Okabe et al. 2008). In this article, we propose the principle and the con-structing method of delimitating trade area in terms of time distance. It assumes that storesare located at points on streets, customers are distributed over streets, and the distancebetween two points on a street network is measured by a route distance taking into accountthe practical situation. This article also shows how to implement the proposed method in aGIS environment.
The article proceeds as follows. The following section gives a brief review on the workdone on delimitating trade area as well as constructing the theoretical framework for themethod presented in this article. In Section 3, the method and implementation will bedescribed elaborately. Section 4 discusses how to apply the method of trade area delimi-tation to support the decision making involved in chain business. Finally, conclusions arepresented in Section 5.
2. Backgrounds and theoretical framework
The concept of a retail trade area has been used by analysts and practitioners in retailsite evaluation and other market studies for a very long time. Retail trade area analysisis also a very popular theme among researchers and GIS consultants specializing in retailsector (Dramowicz 2005). According to Ghosh and McLafferty (1987), the trade area is
Dow
nloa
ded
by [
Uni
vers
ity o
f C
hica
go]
at 1
6:28
03
June
201
2
International Journal of Geographical Information Science 3
‘the geographic area from which the store draws most of its customers and within marketpenetration is highest.’
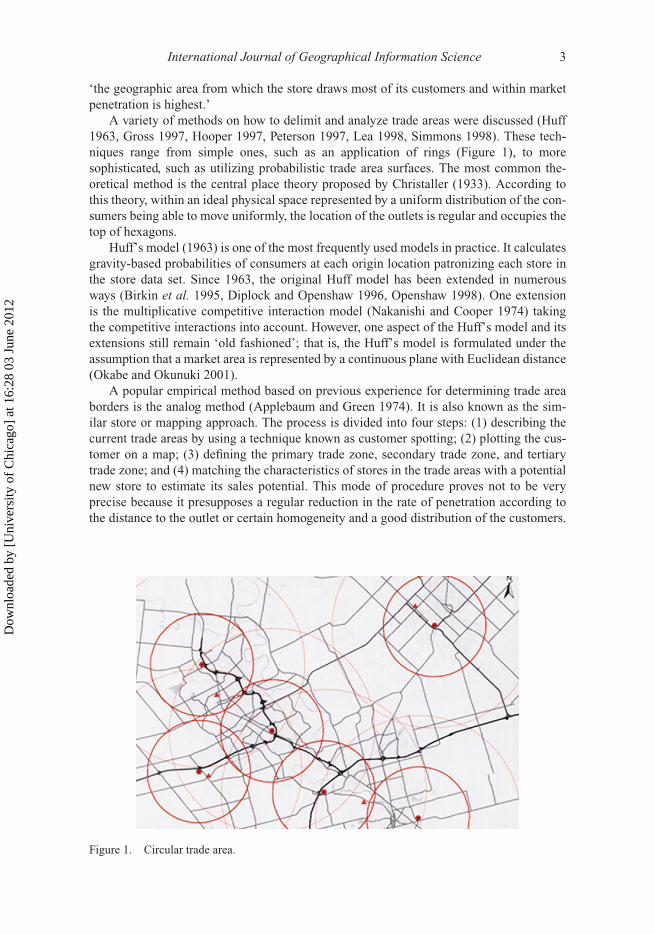
A variety of methods on how to delimit and analyze trade areas were discussed (Huff1963, Gross 1997, Hooper 1997, Peterson 1997, Lea 1998, Simmons 1998). These tech-niques range from simple ones, such as an application of rings (Figure 1), to moresophisticated, such as utilizing probabilistic trade area surfaces. The most common the-oretical method is the central place theory proposed by Christaller (1933). According tothis theory, within an ideal physical space represented by a uniform distribution of the con-sumers being able to move uniformly, the location of the outlets is regular and occupies thetop of hexagons.
Huff’s model (1963) is one of the most frequently used models in practice. It calculatesgravity-based probabilities of consumers at each origin location patronizing each store inthe store data set. Since 1963, the original Huff model has been extended in numerousways (Birkin et al. 1995, Diplock and Openshaw 1996, Openshaw 1998). One extensionis the multiplicative competitive interaction model (Nakanishi and Cooper 1974) takingthe competitive interactions into account. However, one aspect of the Huff’s model and itsextensions still remain ‘old fashioned’; that is, the Huff’s model is formulated under theassumption that a market area is represented by a continuous plane with Euclidean distance(Okabe and Okunuki 2001).
A popular empirical method based on previous experience for determining trade areaborders is the analog method (Applebaum and Green 1974). It is also known as the sim-ilar store or mapping approach. The process is divided into four steps: (1) describing thecurrent trade areas by using a technique known as customer spotting; (2) plotting the cus-tomer on a map; (3) defining the primary trade zone, secondary trade zone, and tertiarytrade zone; and (4) matching the characteristics of stores in the trade areas with a potentialnew store to estimate its sales potential. This mode of procedure proves not to be veryprecise because it presupposes a regular reduction in the rate of penetration according tothe distance to the outlet or certain homogeneity and a good distribution of the customers.
Figure 1. Circular trade area.
Dow
nloa
ded
by [
Uni
vers
ity o
f C
hica
go]
at 1
6:28
03
June
201
2
4 C. Cui et al.
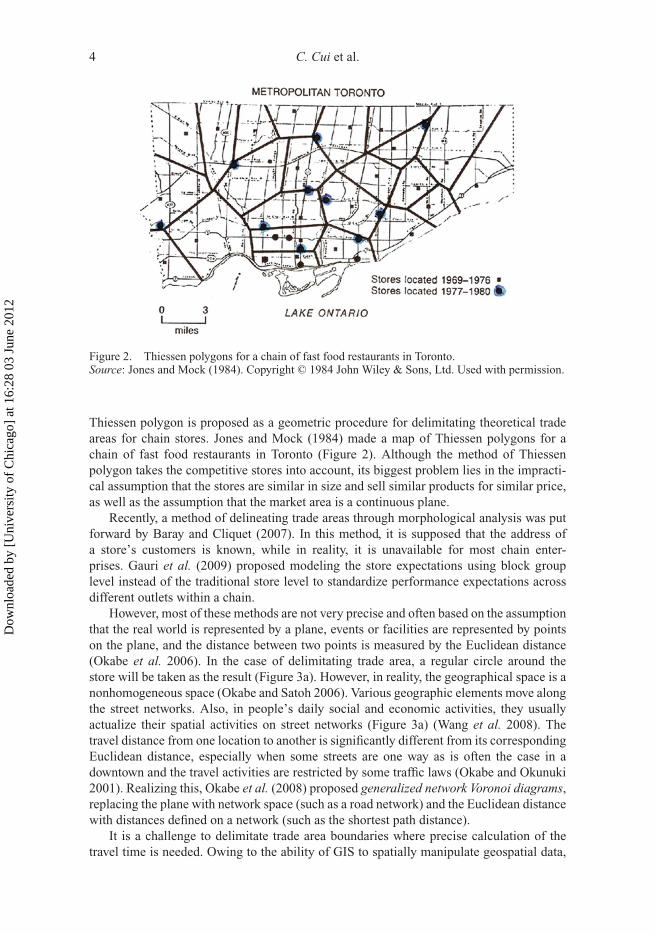
Figure 2. Thiessen polygons for a chain of fast food restaurants in Toronto.Source: Jones and Mock (1984). Copyright © 1984 John Wiley & Sons, Ltd. Used with permission.
Thiessen polygon is proposed as a geometric procedure for delimitating theoretical tradeareas for chain stores. Jones and Mock (1984) made a map of Thiessen polygons for achain of fast food restaurants in Toronto (Figure 2). Although the method of Thiessenpolygon takes the competitive stores into account, its biggest problem lies in the impracti-cal assumption that the stores are similar in size and sell similar products for similar price,as well as the assumption that the market area is a continuous plane.
Recently, a method of delineating trade areas through morphological analysis was putforward by Baray and Cliquet (2007). In this method, it is supposed that the address ofa store’s customers is known, while in reality, it is unavailable for most chain enter-prises. Gauri et al. (2009) proposed modeling the store expectations using block grouplevel instead of the traditional store level to standardize performance expectations acrossdifferent outlets within a chain.
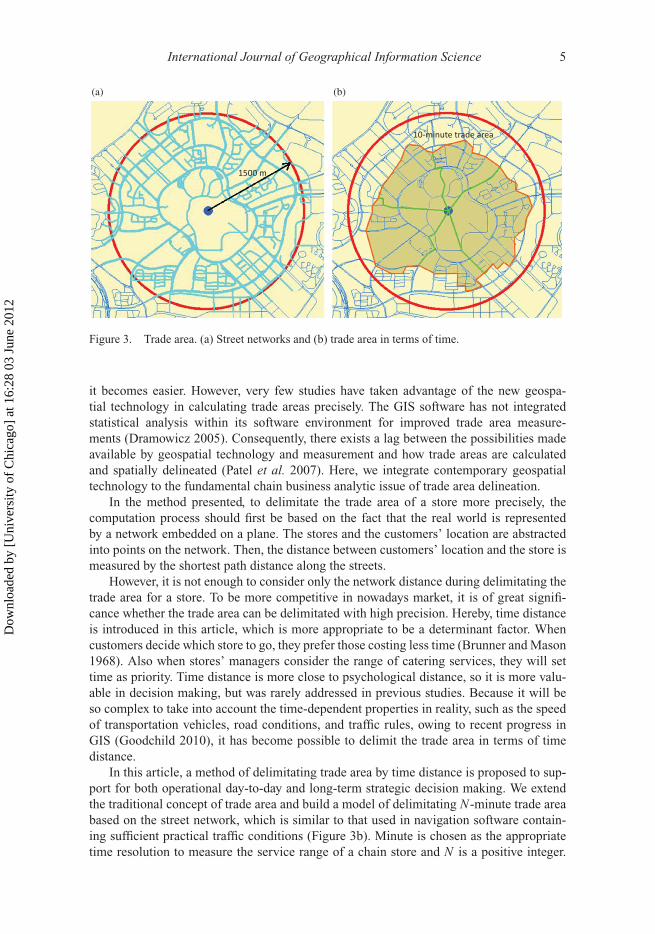
However, most of these methods are not very precise and often based on the assumptionthat the real world is represented by a plane, events or facilities are represented by pointson the plane, and the distance between two points is measured by the Euclidean distance(Okabe et al. 2006). In the case of delimitating trade area, a regular circle around thestore will be taken as the result (Figure 3a). However, in reality, the geographical space is anonhomogeneous space (Okabe and Satoh 2006). Various geographic elements move alongthe street networks. Also, in people’s daily social and economic activities, they usuallyactualize their spatial activities on street networks (Figure 3a) (Wang et al. 2008). Thetravel distance from one location to another is significantly different from its correspondingEuclidean distance, especially when some streets are one way as is often the case in adowntown and the travel activities are restricted by some traffic laws (Okabe and Okunuki2001). Realizing this, Okabe et al. (2008) proposed generalized network Voronoi diagrams,replacing the plane with network space (such as a road network) and the Euclidean distancewith distances defined on a network (such as the shortest path distance).
It is a challenge to delimitate trade area boundaries where precise calculation of thetravel time is needed. Owing to the ability of GIS to spatially manipulate geospatial data,
Dow
nloa
ded
by [
Uni
vers
ity o
f C
hica
go]
at 1
6:28
03
June
201
2
International Journal of Geographical Information Science 5
1500 m
10-minute trade area
(a) (b)
Figure 3. Trade area. (a) Street networks and (b) trade area in terms of time.
it becomes easier. However, very few studies have taken advantage of the new geospa-tial technology in calculating trade areas precisely. The GIS software has not integratedstatistical analysis within its software environment for improved trade area measure-ments (Dramowicz 2005). Consequently, there exists a lag between the possibilities madeavailable by geospatial technology and measurement and how trade areas are calculatedand spatially delineated (Patel et al. 2007). Here, we integrate contemporary geospatialtechnology to the fundamental chain business analytic issue of trade area delineation.
In the method presented, to delimitate the trade area of a store more precisely, thecomputation process should first be based on the fact that the real world is representedby a network embedded on a plane. The stores and the customers’ location are abstractedinto points on the network. Then, the distance between customers’ location and the store ismeasured by the shortest path distance along the streets.
However, it is not enough to consider only the network distance during delimitating thetrade area for a store. To be more competitive in nowadays market, it is of great signifi-cance whether the trade area can be delimitated with high precision. Hereby, time distanceis introduced in this article, which is more appropriate to be a determinant factor. Whencustomers decide which store to go, they prefer those costing less time (Brunner and Mason1968). Also when stores’ managers consider the range of catering services, they will settime as priority. Time distance is more close to psychological distance, so it is more valu-able in decision making, but was rarely addressed in previous studies. Because it will beso complex to take into account the time-dependent properties in reality, such as the speedof transportation vehicles, road conditions, and traffic rules, owing to recent progress inGIS (Goodchild 2010), it has become possible to delimit the trade area in terms of timedistance.
In this article, a method of delimitating trade area by time distance is proposed to sup-port for both operational day-to-day and long-term strategic decision making. We extendthe traditional concept of trade area and build a model of delimitating N-minute trade areabased on the street network, which is similar to that used in navigation software contain-ing sufficient practical traffic conditions (Figure 3b). Minute is chosen as the appropriatetime resolution to measure the service range of a chain store and N is a positive integer.
Dow
nloa
ded
by [
Uni
vers
ity o
f C
hica
go]
at 1
6:28
03
June
201
2
6 C. Cui et al.
For example, 15-minute trade area is a region that encompasses all accessible streets andcustomers’ location within 15 minutes travel time.
In order to achieve this challenging goal, first, a conceptual model needs to be built toabstract the involved objects in the real world, including stores, customers’ location, thestreet network, and other geographical objects, which may have an effect on travel time.Then, in order to precisely measure travel time, the transportation mode, traffic light, roadgrade, traffic rule, and other influencing factors need to be interpreted to be understand-able by computers. In different countries, where the traffic rules are different, the criteriaof accessibility and time counting need to be designed accordingly. Based on the presetcriterion for computing time, N-minute trade area can be generated for chain stores.
3. The conceptual model
The geographic elements involved in delimitating N-minute trade areas include street net-work, a chain store, around which the trade area will be generated, and customers’ location.The abstractions of these three elements are elaborated in the subsections below. In spatialdatabase, those geographic elements are layered representation in shapefile format whichis GIS oriented and compatible with almost all GIS software.
3.1. Street network modeling
Spatial networks that show time dependence serve as the underlying networks for mostlocation-based services. Traditionally, graphs have been extensively used to model spatialnetworks, for instance, the street networks; weights assigned to nodes and edges are usedto encode additional information. In a real-world scenario, it is not uncommon for thesenetwork parameters to be time dependent. Formulation of computationally efficient andcorrect algorithms for the shortest path computation that takes into account the dynamicnature of the networks is important. Models of these networks need to capture the possiblechanges in topology and values of network parameters with time and provide the basisfor the formulation of computationally efficient and correct algorithms for the frequentcomputations like shortest paths (George and Shekhar 2006). In this section, we discussthe basics of the model used to represent spatial networks. The method of delimitatingtrade area presented in this article is formulated based on this model.
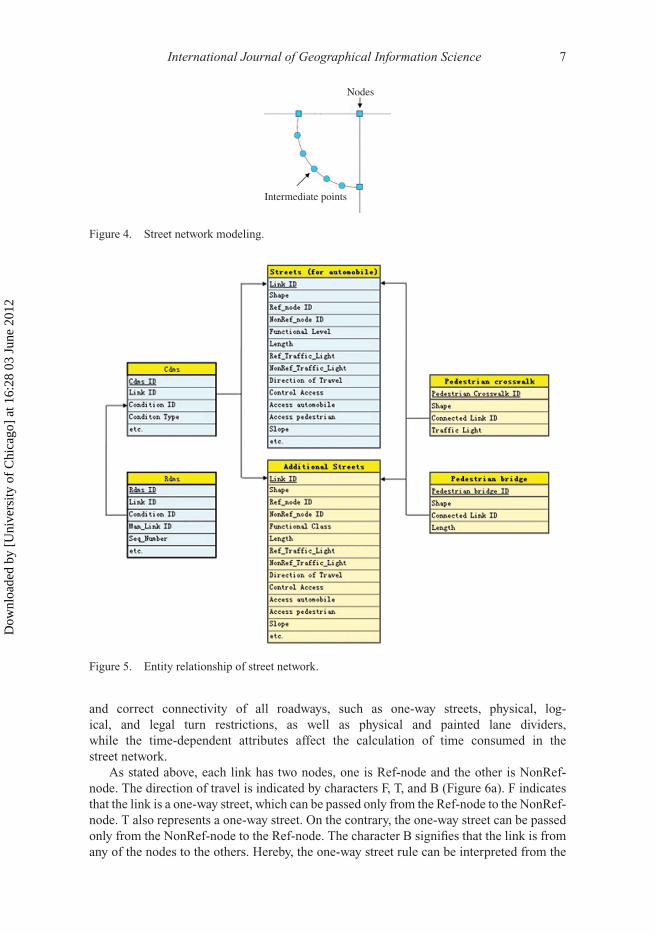
The street network is modeled into a graph G = (N , L) consisting of a finite set ofnodes N and links between the nodes in N . A link has and only has two nodes, whichare, respectively, identified as Ref-node and NonRef-node according to their relative posi-tions (coordinates in the planar coordinate system), so that the graph is directed. A set ofintermediate points among a link present its practical shape (Figure 4).
In order to make the model of street network more extensible and compatible, the modelof the widely used navigation electronic map is referred. However, because the initiativeof the navigation electronic map is to serve automobile users, information on additionalstreets and associated information for nonmotor vehicles, pedestrians, and other kindsof transportation are needed (Figure 5, orange tables represent the information of addi-tional streets and associated information for pedestrian and other kinds of transportation).Moreover, aimed at delimitating N-minute trade area, specified attributes of street networkare collected and attached.
Associated attributes of street network are classified into two categories: acces-sible attributes and time-dependent attributes. Accessible attributes include complete
Dow
nloa
ded
by [
Uni
vers
ity o
f C
hica
go]
at 1
6:28
03
June
201
2
International Journal of Geographical Information Science 7
Nodes
Intermediate points
Figure 4. Street network modeling.
Figure 5. Entity relationship of street network.
and correct connectivity of all roadways, such as one-way streets, physical, log-ical, and legal turn restrictions, as well as physical and painted lane dividers,while the time-dependent attributes affect the calculation of time consumed in thestreet network.
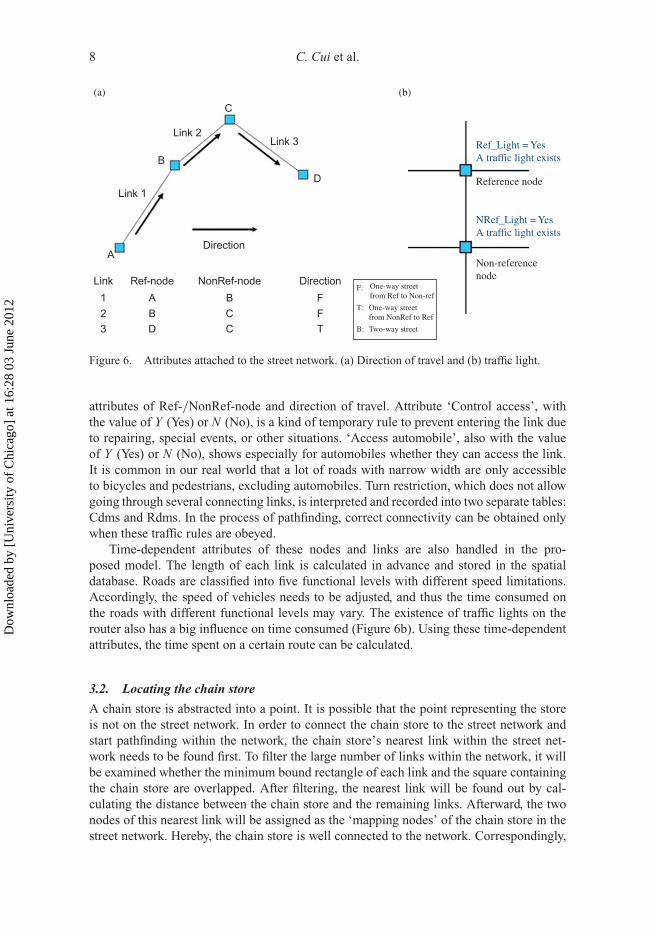
As stated above, each link has two nodes, one is Ref-node and the other is NonRef-node. The direction of travel is indicated by characters F, T, and B (Figure 6a). F indicatesthat the link is a one-way street, which can be passed only from the Ref-node to the NonRef-node. T also represents a one-way street. On the contrary, the one-way street can be passedonly from the NonRef-node to the Ref-node. The character B signifies that the link is fromany of the nodes to the others. Hereby, the one-way street rule can be interpreted from the
Dow
nloa
ded
by [
Uni
vers
ity o
f C
hica
go]
at 1
6:28
03
June
201
2
8 C. Cui et al.
C
D
B
A
Link 3Link 2
Link 1
Direction
Link Ref-node NonRef-node Direction
1 A B F
FT
2 B CCD3
One-way streetfrom Ref to Non-ref
F:
One-way streetfrom NonRef to Ref
T:
Two-way streetB:
Ref_Light = YesA traffic light exists
NRef_Light = YesA traffic light exists
Reference node
Non-referencenode
(a) (b)
Figure 6. Attributes attached to the street network. (a) Direction of travel and (b) traffic light.
attributes of Ref-/NonRef-node and direction of travel. Attribute ‘Control access’, withthe value of Y (Yes) or N (No), is a kind of temporary rule to prevent entering the link dueto repairing, special events, or other situations. ‘Access automobile’, also with the valueof Y (Yes) or N (No), shows especially for automobiles whether they can access the link.It is common in our real world that a lot of roads with narrow width are only accessibleto bicycles and pedestrians, excluding automobiles. Turn restriction, which does not allowgoing through several connecting links, is interpreted and recorded into two separate tables:Cdms and Rdms. In the process of pathfinding, correct connectivity can be obtained onlywhen these traffic rules are obeyed.
Time-dependent attributes of these nodes and links are also handled in the pro-posed model. The length of each link is calculated in advance and stored in the spatialdatabase. Roads are classified into five functional levels with different speed limitations.Accordingly, the speed of vehicles needs to be adjusted, and thus the time consumed onthe roads with different functional levels may vary. The existence of traffic lights on therouter also has a big influence on time consumed (Figure 6b). Using these time-dependentattributes, the time spent on a certain route can be calculated.
3.2. Locating the chain store
A chain store is abstracted into a point. It is possible that the point representing the storeis not on the street network. In order to connect the chain store to the street network andstart pathfinding within the network, the chain store’s nearest link within the street net-work needs to be found first. To filter the large number of links within the network, it willbe examined whether the minimum bound rectangle of each link and the square containingthe chain store are overlapped. After filtering, the nearest link will be found out by cal-culating the distance between the chain store and the remaining links. Afterward, the twonodes of this nearest link will be assigned as the ‘mapping nodes’ of the chain store in thestreet network. Hereby, the chain store is well connected to the network. Correspondingly,
Dow
nloa
ded
by [
Uni
vers
ity o
f C
hica
go]
at 1
6:28
03
June
201
2
International Journal of Geographical Information Science 9
the search will start from the ‘mapping nodes.’ The distances from the chain store to the‘mapping nodes’ will be calculated and recorded as the distance of chain store connect-ing to network. Other information of the chain store, such as name, company, and time ofestablishment, will also be recorded as the attributes of the point.
3.3. Interpreting customers’ location
In the context of delimitating trade area, it is reasonable to interpret customers’ locationas the geographic position of their residence. The neighborhood level is adopted as thespatial analysis unit. The geometries and attributes of these neighborhoods are collectedand organized in the customer’s database serving for following analysis and thus support-ing decision making. In Chinese cities, neighborhood is an enclosed residence area withseveral gates. The street network usually does not cross the neighborhood. The residentsaccess the street network through the neighborhood gates.
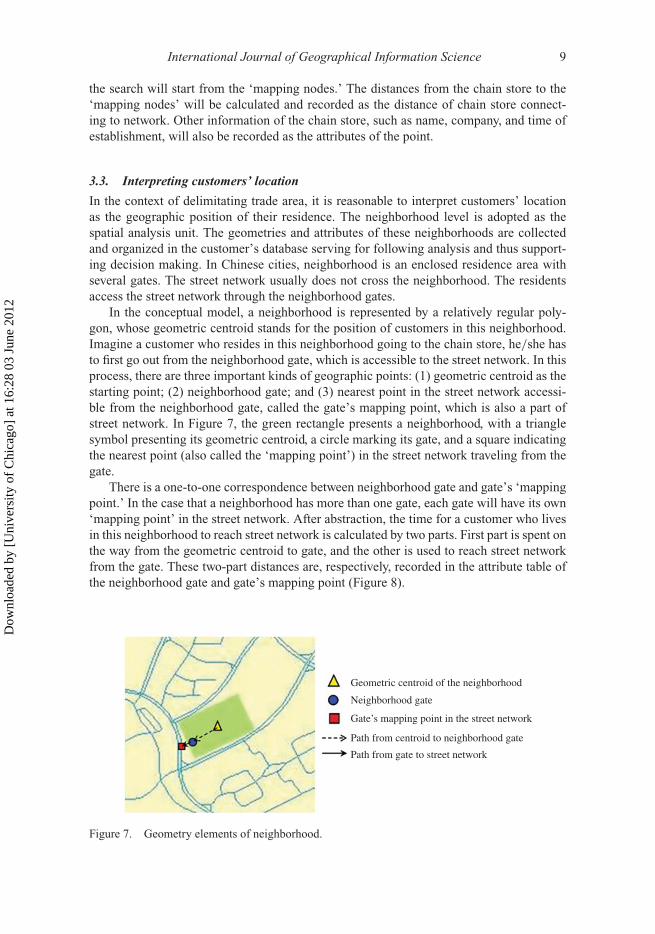
In the conceptual model, a neighborhood is represented by a relatively regular poly-gon, whose geometric centroid stands for the position of customers in this neighborhood.Imagine a customer who resides in this neighborhood going to the chain store, he/she hasto first go out from the neighborhood gate, which is accessible to the street network. In thisprocess, there are three important kinds of geographic points: (1) geometric centroid as thestarting point; (2) neighborhood gate; and (3) nearest point in the street network accessi-ble from the neighborhood gate, called the gate’s mapping point, which is also a part ofstreet network. In Figure 7, the green rectangle presents a neighborhood, with a trianglesymbol presenting its geometric centroid, a circle marking its gate, and a square indicatingthe nearest point (also called the ‘mapping point’) in the street network traveling from thegate.
There is a one-to-one correspondence between neighborhood gate and gate’s ‘mappingpoint.’ In the case that a neighborhood has more than one gate, each gate will have its own‘mapping point’ in the street network. After abstraction, the time for a customer who livesin this neighborhood to reach street network is calculated by two parts. First part is spent onthe way from the geometric centroid to gate, and the other is used to reach street networkfrom the gate. These two-part distances are, respectively, recorded in the attribute table ofthe neighborhood gate and gate’s mapping point (Figure 8).
Geometric centroid of the neighborhood
Neighborhood gate
Gate’s mapping point in the street network
Path from centroid to neighborhood gate
Path from gate to street network
Figure 7. Geometry elements of neighborhood.
Dow
nloa
ded
by [
Uni
vers
ity o
f C
hica
go]
at 1
6:28
03
June
201
2

10 C. Cui et al.
Gate’s mapping pointMapping point ID Neighborhood ID
Neighborhood gate ID
Shape (polygon)
Link IDDistance to neighborhood gate
Relationshio table
Neighborhood ID
Neighborhood gate ID
Geometric centroid ID
Mapping point ID
Neighborhood
Shape (polygon)
Neighborhood name
Attributes...
Geometric centroid
Geometric centroid ID
Shape (point)
Shape (point)
Neighborhood gate
Distance to centroid
Figure 8. Entity relationship of the points associated with neighborhood.
A set of attribute data are assigned to each neighborhood providing valuableinformation for decision making. Basic attributes include the name of this neighborhoodand the number of household and residents. Besides, business data and socioeconomicattributes of the residents can be collected according to the type of the chain store. In fact,many large-scale chain enterprises possess databases containing this kind of information.Taking fast food chain store as an example, business data, such as the percentage of reg-ular customers in the neighborhood and average expense of their regular customers, canbe obtained through investigation to evaluate the profits from this neighborhood. In addi-tion, the potential customers can be explored by promoting, based on the analysis of theirsocioeconomic status, such as their monthly income, expense on food every month, andfamily composition. The geometries and attributes of the neighborhoods are organized andstored in the database (Figure 8).
4. Implementation within GIS
Based on the method of delimitating N-minute trade area, a trade area assessment sys-tem for food chain enterprise has been developed, consisting of three layers: backgroundservice layer, intercommunicating layer, and interface layer. The background service layeris developed with Microsoft Visual C++ 6.0 to implement the key algorithms for calcu-lating the trade area. According to the Transmission Control Protocol / Internet Protocol(TCP/IP), intercommunicating layer actualizes the transmission of the parameters betweenbackground and interface layers. The interface layer is secondarily developed using theArcGIS Engine develop kit to realize the basic functions of GIS, such as zooming in andout, and geographical querying. The Flex and Java are adopted to perform the transmissionof parameters and the calculated results from the background service layer to the interfacelayer.
The background service layer acts as a server. After starting, the street network andother basic data layers are loaded into the memory. This is followed by the topology build-ing, during which the interrelation between these data is established. The key algorithmsare network analysis and spatial operation. Applications for supporting operational day-to-day as well as long-term decision making are developed, including N-minute trade area
Dow
nloa
ded
by [
Uni
vers
ity o
f C
hica
go]
at 1
6:28
03
June
201
2
International Journal of Geographical Information Science 11
Supporting decision making for chain store
Topology building TopologyTopology Node Link Attributes
Spatial operation (overlap)Key algorithmKey algorithm Network analysis
ApplicationsApplications N-minute trade area Turnover analysisBoundary adjustment Pathfinding
Basic layerBasic layer Chain storeStreet network Neighborhood ……
Figure 9. Structure of the trade area assessment system.
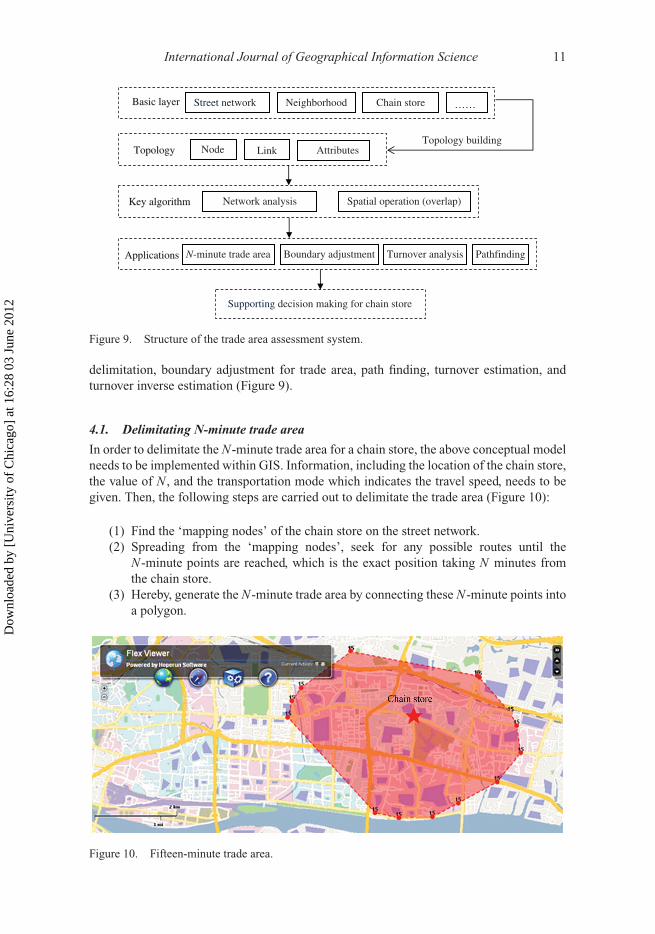
delimitation, boundary adjustment for trade area, path finding, turnover estimation, andturnover inverse estimation (Figure 9).
4.1. Delimitating N-minute trade area
In order to delimitate the N-minute trade area for a chain store, the above conceptual modelneeds to be implemented within GIS. Information, including the location of the chain store,the value of N , and the transportation mode which indicates the travel speed, needs to begiven. Then, the following steps are carried out to delimitate the trade area (Figure 10):
(1) Find the ‘mapping nodes’ of the chain store on the street network.(2) Spreading from the ‘mapping nodes’, seek for any possible routes until the
N-minute points are reached, which is the exact position taking N minutes fromthe chain store.
(3) Hereby, generate the N-minute trade area by connecting these N-minute points intoa polygon.
Figure 10. Fifteen-minute trade area.
Dow
nloa
ded
by [
Uni
vers
ity o
f C
hica
go]
at 1
6:28
03
June
201
2
12 C. Cui et al.
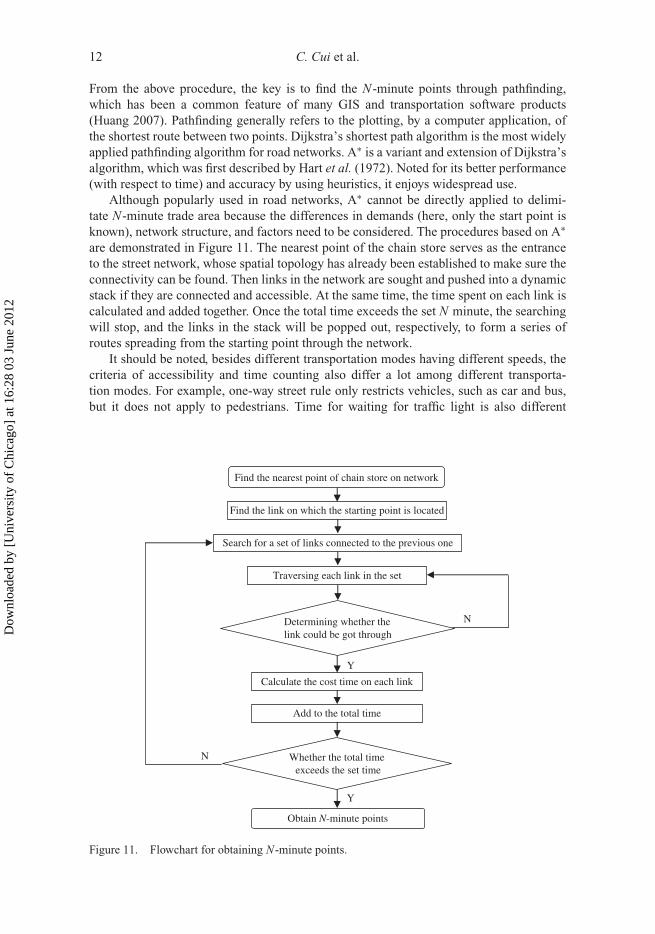
From the above procedure, the key is to find the N-minute points through pathfinding,which has been a common feature of many GIS and transportation software products(Huang 2007). Pathfinding generally refers to the plotting, by a computer application, ofthe shortest route between two points. Dijkstra’s shortest path algorithm is the most widelyapplied pathfinding algorithm for road networks. A∗ is a variant and extension of Dijkstra’salgorithm, which was first described by Hart et al. (1972). Noted for its better performance(with respect to time) and accuracy by using heuristics, it enjoys widespread use.
Although popularly used in road networks, A∗ cannot be directly applied to delimi-tate N-minute trade area because the differences in demands (here, only the start point isknown), network structure, and factors need to be considered. The procedures based on A∗are demonstrated in Figure 11. The nearest point of the chain store serves as the entranceto the street network, whose spatial topology has already been established to make sure theconnectivity can be found. Then links in the network are sought and pushed into a dynamicstack if they are connected and accessible. At the same time, the time spent on each link iscalculated and added together. Once the total time exceeds the set N minute, the searchingwill stop, and the links in the stack will be popped out, respectively, to form a series ofroutes spreading from the starting point through the network.
It should be noted, besides different transportation modes having different speeds, thecriteria of accessibility and time counting also differ a lot among different transporta-tion modes. For example, one-way street rule only restricts vehicles, such as car and bus,but it does not apply to pedestrians. Time for waiting for traffic light is also different
Y
N
N
Traversing each link in the set
Find the link on which the starting point is located
Search for a set of links connected to the previous one
Find the nearest point of chain store on network
Determining whether thelink could be got through
Calculate the cost time on each link
Add to the total time
Whether the total time exceeds the set time
Y
Obtain N-minute points
Figure 11. Flowchart for obtaining N-minute points.
Dow
nloa
ded
by [
Uni
vers
ity o
f C
hica
go]
at 1
6:28
03
June
201
2
International Journal of Geographical Information Science 13
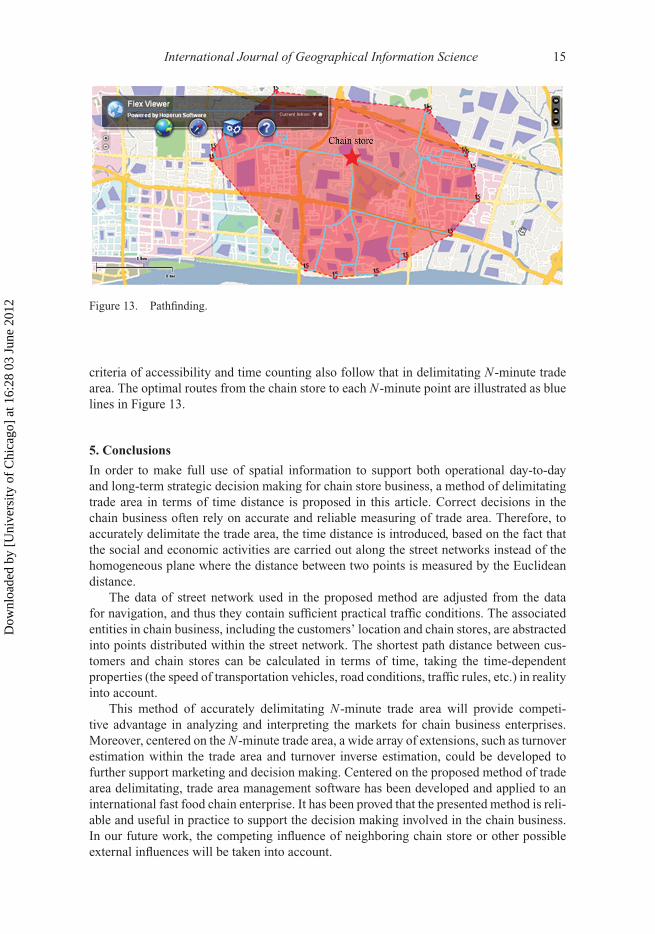
Table 1. Attributes to determine the accessibility and time consumed.
Attribute category Attributes Automobile Electrical motorcar Pedestrian
Accessibility Ref-/NonRef-node √ √Direction of travel √ √Control access √ √ √Access automobile √Access pedestrian √Turn restriction √ √LengthTraffic light √ √ √
Time dependent Functional level √ √Slope √ √Pedestriancrosswalk
√ √
Pedestrian bridge √
between vehicles and pedestrians. Consequently, trade areas will be different for differ-ent transportation modes. In this article, three kinds of common transportation modes areconsidered: automobile, electrical motorcar, and pedestrians.
Based on the available attributes, the criteria of accessibility and time counting aredevised for each transportation mode, respectively (Table 1). The tick symbol means thisattribute needs to be taken into account.
Table 1 is just an example to show how to transform the attributes of nodes andlinks into the criteria of accessibility and time counting. Certainly, the criteria are dis-tinctive in different contexts, where different traffic rules are implemented. Adjustmentscan be made according to the context, as well as the availability of attributes of thestreet network. In addition, the transportation mode can be extended to other kindsif necessary.
4.2. Extended applications
Based on delimitating N-minute trade area, a wide array of functions is proposed to sup-port marketing decisions for retailers: (1) boundary adjustment for trade area, (2) turnoverestimation and turnover inverse estimation, and (3) path finding.
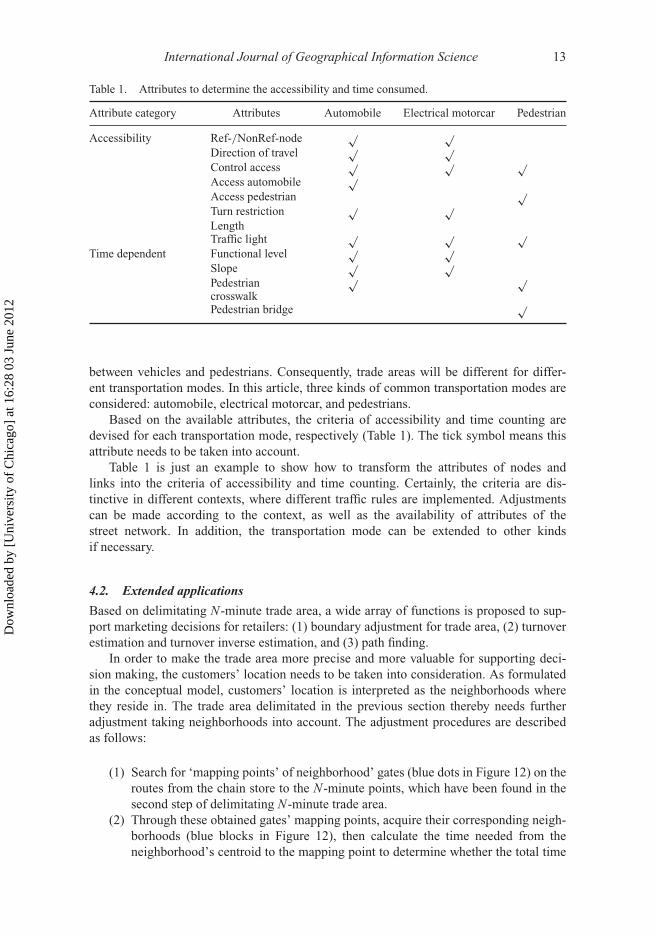
In order to make the trade area more precise and more valuable for supporting deci-sion making, the customers’ location needs to be taken into consideration. As formulatedin the conceptual model, customers’ location is interpreted as the neighborhoods wherethey reside in. The trade area delimitated in the previous section thereby needs furtheradjustment taking neighborhoods into account. The adjustment procedures are describedas follows:
(1) Search for ‘mapping points’ of neighborhood’ gates (blue dots in Figure 12) on theroutes from the chain store to the N-minute points, which have been found in thesecond step of delimitating N-minute trade area.
(2) Through these obtained gates’ mapping points, acquire their corresponding neigh-borhoods (blue blocks in Figure 12), then calculate the time needed from theneighborhood’s centroid to the mapping point to determine whether the total time
Dow
nloa
ded
by [
Uni
vers
ity o
f C
hica
go]
at 1
6:28
03
June
201
2
14 C. Cui et al.
Figure 12. Boundary adjustment for the trade area in terms of neighborhood.
cost from the chain store to the centroid of the neighborhood is indeed withinN minutes.
(3) Outline the boundaries of the neighborhoods that fit the above requirements toform a polygon (with blue dashed boundary in Figure 12). It is the adjusted resultof N-minute trade area in terms of neighborhoods.
The trade area of a chain store indicates the spatial range where most of its customers comefrom. Combining the spatial range with business statistical data, the present state of busi-ness can be assessed, among which, calculating the turnover is a representative example.The chain enterprises, especially the large ones, usually collect the basic business data,such as the average transaction value (ATV, per customer transaction). In our application,the food chain enterprise that employs this trade area assessment system has a businessdatabase, in which the ATV and capture rate (CR, the percentage of prospective customers)are stored. The number of residents (NR) within the N-minute trade area can be known viathe attributes of neighborhoods, which are stored in the neighborhoods’ spatial database.All this information will be used to calculate the turnover:
Turnover = ATV × CR × NR
Inversely, if the turnover is given, the corresponding N-minute trade area could be obtained.First, the NR needs to be calculated using the above equation. Then, based on empiricalvalues stored in business database, a start value of N will be tested, and then N will beadjusted continuously with 10 seconds each time until NR within this N-minute trade areareaches the desired number:
NR = Turnover
(ATV × CR)
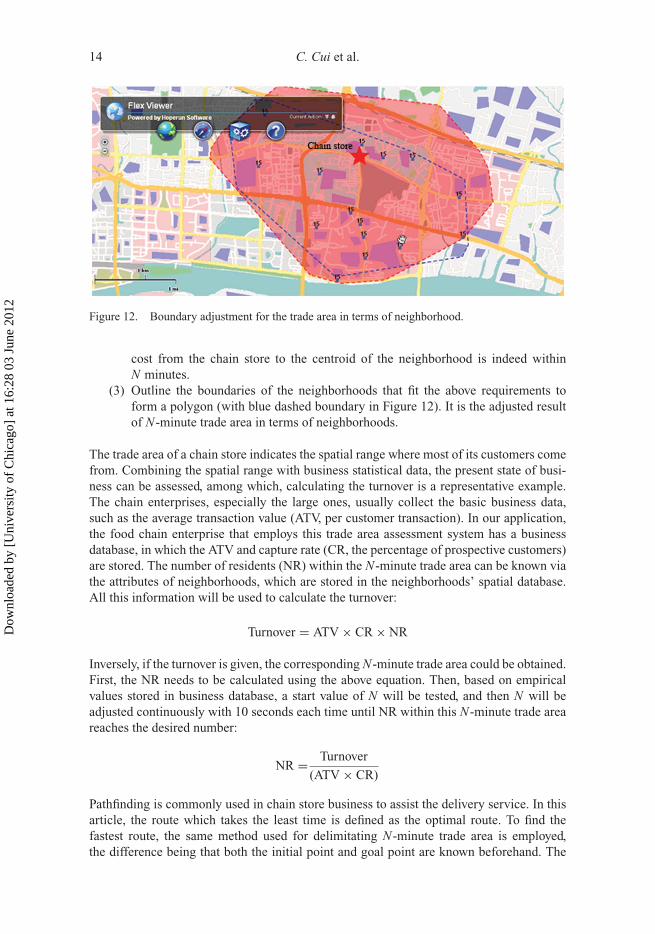
Pathfinding is commonly used in chain store business to assist the delivery service. In thisarticle, the route which takes the least time is defined as the optimal route. To find thefastest route, the same method used for delimitating N-minute trade area is employed,the difference being that both the initial point and goal point are known beforehand. The
Dow
nloa
ded
by [
Uni
vers
ity o
f C
hica
go]
at 1
6:28
03
June
201
2
International Journal of Geographical Information Science 15
Figure 13. Pathfinding.
criteria of accessibility and time counting also follow that in delimitating N-minute tradearea. The optimal routes from the chain store to each N-minute point are illustrated as bluelines in Figure 13.
5. Conclusions
In order to make full use of spatial information to support both operational day-to-dayand long-term strategic decision making for chain store business, a method of delimitatingtrade area in terms of time distance is proposed in this article. Correct decisions in thechain business often rely on accurate and reliable measuring of trade area. Therefore, toaccurately delimitate the trade area, the time distance is introduced, based on the fact thatthe social and economic activities are carried out along the street networks instead of thehomogeneous plane where the distance between two points is measured by the Euclideandistance.
The data of street network used in the proposed method are adjusted from the datafor navigation, and thus they contain sufficient practical traffic conditions. The associatedentities in chain business, including the customers’ location and chain stores, are abstractedinto points distributed within the street network. The shortest path distance between cus-tomers and chain stores can be calculated in terms of time, taking the time-dependentproperties (the speed of transportation vehicles, road conditions, traffic rules, etc.) in realityinto account.
This method of accurately delimitating N-minute trade area will provide competi-tive advantage in analyzing and interpreting the markets for chain business enterprises.Moreover, centered on the N-minute trade area, a wide array of extensions, such as turnoverestimation within the trade area and turnover inverse estimation, could be developed tofurther support marketing and decision making. Centered on the proposed method of tradearea delimitating, trade area management software has been developed and applied to aninternational fast food chain enterprise. It has been proved that the presented method is reli-able and useful in practice to support the decision making involved in the chain business.In our future work, the competing influence of neighboring chain store or other possibleexternal influences will be taken into account.
Dow
nloa
ded
by [
Uni
vers
ity o
f C
hica
go]
at 1
6:28
03
June
201
2
16 C. Cui et al.
AcknowledgmentsThis work is supported by the project Priority Academic Program Development of Jiangsu and theproject supported by the National Science and Technology Ministry (no. 2012BAH28B02).
ReferencesApplebaum, W. and Green, H.L., 1974. Determining store trade areas. In: R. Ferber, ed. Handbook
of marketing research. New York: McGraw-Hill, 4313–4323.Baray, J. and Cliquet, G., 2007. Delineating store trade areas through morphological analysis.
European Journal of Operational Research, 182, 886–898.Birkin, M., et al., 1995. Intelligent GIS. Harlow: Longman.Bozarth, C. and Handfielf, R., 2006. Introduction to operations and supply chain management. Upper
Saddle River, NJ: Prentice Hall.Brunner, J.A. and Mason, J.L., 1968. The influence of driving time upon shopping center preference.
Journal of Marketing, 32 (2), 57–61.Christaller, W., 1933. Die Zentral Orte in Süd Deutschland, Iena, translated in English under the title
(1966): Central places in southern Germany. Englewood Cliffs, NJ: Prentice Hall.Diplock, G. and Openshaw, S., 1996. Using simple genetic algorithms to calibrate spatial interaction
models. Geographical Analysis, 28, 262–279.Dramowicz, E., 2005. Retail trade area analysis using the Huff model. Directions Magazine, 2 July.Gauri, D.K., Pauler, J.G., and Trivedi, M., 2009. Benchmarking performance in retail chains: an
integrated approach. Marketing Science, 28 (3), 502–515.George, B. and Shekhar, S., 2006. Time-aggregated graphs for modeling spatio-temporal networks-
an extended abstract. Proceedings of workshops at international conference on conceptualmodeling, November, Tucson, USA.
Ghosh, A. and McLafferty, S.L., 1987. Location strategies for retail and service firms. Reading, MA:Lexington Books.
Goodchild, M.F., 2010. Twenty years of progress: GIS Science in 2010. Journal of SpatialInformation Science, 1, 3–20.
Gross, B., 1997. Dynamic trade areas. Business Geographics, September, 30–33.Hart, P.E., Nilsson, N.J., and Raphael, B., 1972. Correction to ‘a formal basis for the heuristic
determination of minimum cost paths’. SIGART Newsletter, 37, 28–29.Hooper, H., 1997. Who’s really shopping my store? Business Geographics, September, 34–36.Huang, R.H., 2007. A schedule-based pathfinding algorithm for transit networks using pattern first
search. Geoinformatica, 11 (2), 269–285.Huff, D.L., 1963. A probabilistic analysis of shopping center trade areas. Land Economics, 39, 81–90.Jones, K.G. and Mock, D.R., 1984. Evaluating retail trading performances. In: R.L. Davies and D.S.
Rogers, eds. Store location and store assessment research. New York: John Wiley, 333–360.Lea, A.C., 1998. An arsenal of trade areas. Business Geographics, August, 34–35.Mishra, S., 2009. GIS in Indian retail industry-a strategic tool. International Journal of Marketing
Studies, 1, 50–57.Nakanishi, M. and Cooper, L.G., 1974. Parameter estimation for a multiplicative competitive
interaction model-least squares approach. Journal of Marketing Research, 11, 303–311.Nasirin, S. and Birks, D.F., 2003. DSS implementation in the UK retail organisations: a GIS
perspective. Information and Management, 40 (4), 325–336.Okabe, A. and Okunuki, K., 2001. A computational method for estimating the demand of retail stores
on a street network and its implementation in GIS. Transactions in GIS, 5 (3), 209–220.Okabe, A., Okunuki, K., and Shiode, S., 2006. SANET: a toolbox for spatial analysis on a network.
Geographical Analysis, 38, 57–66.Okabe, A. and Satoh, T., 2006. Uniform network transformation for points pattern analysis on a
non-uniform network. Journal of Geographical System, 8, 25–37.Okabe, A., et al., 2008. Generalized network Voronoi diagrams: concepts, computational methods,
and applications. International Journal of Geographical Information Science, 22 (9), 965–994.Openshaw, S., 1998. Neural network, genetic, and fuzzy logic models of spatial interaction.
Environment and Planning A, 30, 1857–1872.Patel, A., Fik, T.J., and Thrall, G.I., 2007. Trade area definition and calculation. National meetings of
the American Real Estate Society, San Francisco, CA, April 2007.
Dow
nloa
ded
by [
Uni
vers
ity o
f C
hica
go]
at 1
6:28
03
June
201
2
International Journal of Geographical Information Science 17
Peterson, K., 1997. A trade area primer. Business Geographics, September, 18–21.Sarkar, A., 2007. GIS applications in logistics: a literature review. Towards U.S. SBA Grant No.
SBAHQ-06-1–0046, May 2007, http://business.redlands.edu/grant/Logistics.pdf.Segal, D.B., 1999. Retail trade area analysis: concepts and new approaches. Journal of Database
Marketing, 6 (3), 267–277.Simmons, W., 1998. Defining trade areas. Business Geographics, September, 28–30.Wang, X.S., Yu, R.L., and Jiang, Y.H., 2008. Delimitating the store market field based on the metric
of the city-block distance. Geographical Research, 27 (1), 85–92 (in Chinese).Wisner, J.D., Tan, K., and Leong, G.K., 2009. Principles of supply chain management. 2nd ed.
Mason, OH: Thomson South-Western.
Dow
nloa
ded
by [
Uni
vers
ity o
f C
hica
go]
at 1
6:28
03
June
201
2