Embed Size (px)
Citation preview

INTERNATIONAL JOURNAL OF GEOMATICS AND GEOSCIENCES
Volume 3, No 1, 2012
© Copyright by the authors - Licensee IPA- Under Creative Commons license 3.0
Research article ISSN 0976 – 4380
Submitted on May 2012 published on July 2012 167
GIS based lineament Delineation using geophysical resistivity data, Karur
district, Tamil Nadu, India Muralitharan. J, Palanivel. K
1- Research Scholar, Centre for Remote Sensing, Bharathidasan University, Tiruchirappalli
2- Assistant Professor, Centre for Remote Sensing, Bharathidasan University, Tiruchirappalli
ABSTRACT
The paper shows that geophysical resistivity values Digital Elevation Model (DEM) for
different depths, can indicate the location of depth persistence lineaments. The depth
persistence lineaments allow large scale migration of groundwater and can be used as sites
for the artificial recharging of aquifers. It is concluded that the lineament maps prepared from
geophysical resistivity values can give a better picture of the depth persistence.
Keywords: Lineament, Geophysical resistivity, DEM, GIS.
1. Introduction
Geophysical resistivity is one of the most effective methods for investigating the presence of
groundwater and for artificial recharge (Ramanujachary and Balakrishna 1985; Raju et al.
1996; Anbazhagan and Ramasamy, 1997; Singhal et al. 1998; Osella et al. 1999). In
crystalline terrain, even within small areas the nature and extent of weathering may vary
considerably, depending mostly on the presence of fractures at depth and the morphological
features at the surface. Hence, with groundwater studies, identification and analysis of depth
persistence lineaments are crucial in hard rock terrain. Geophysical resistivity values are used
to detect depth persistence lineaments (Verma et al. 1980; Aswathanarayan and Srinivas
1991; Raviprakash and Krishna Rao 1991; Suresh et al. 1992; Anbazhagan 1993;
Muralidharan, 1996; Kunze 1998).
1.1 Location of the study area
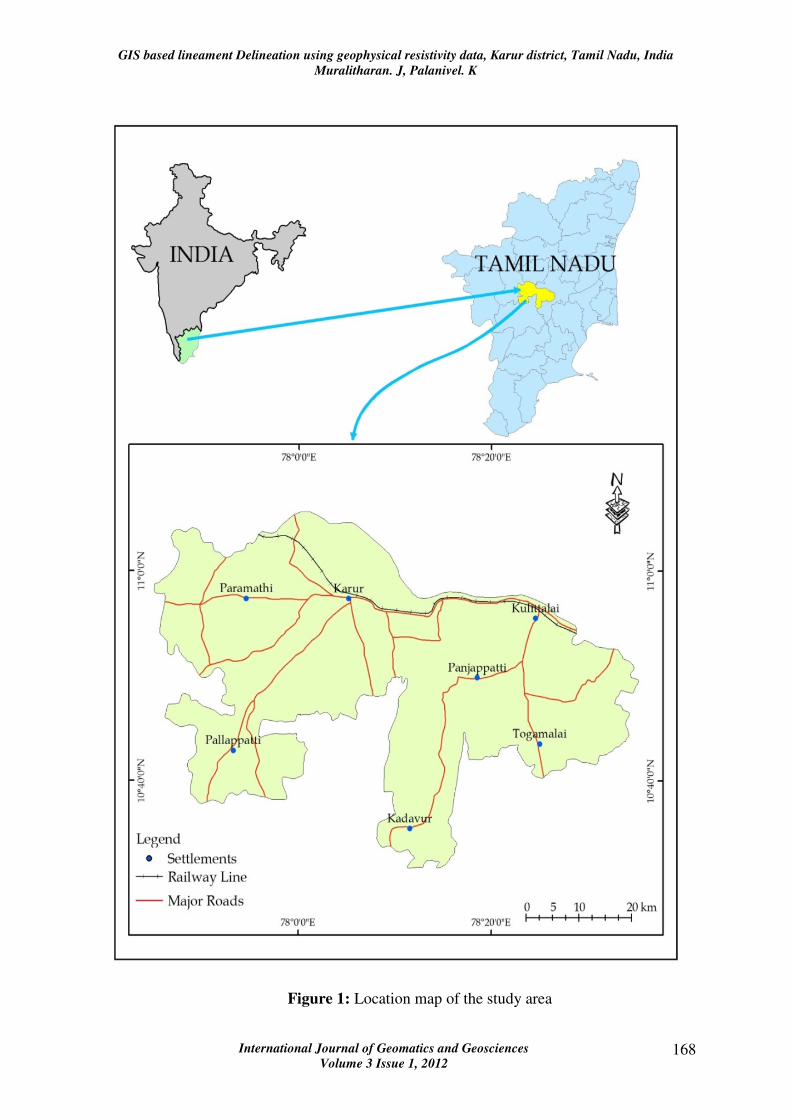
The study area, Karur district, is located in the Central part of Tamil Nadu state, India (Figure
1.1). The study area is bounded in the North and by Namakkal district, in the West by
Coimbatore district, in the South by Dindugal district and in the East by Trichy district. The
study area is located in between North latitudes 10.52 in decimal degree and 11.09 in decimal
degree and East longitudes 77.74 in decimal degree and 78.58 in decimal degree.
2. Methods and materials
2.1 Geophysical resistivity survey
Geophysical resistivity surveys were conducted in over 42 locations (Figure 2) up to a depth
of 100 m using Schlumberger configuration array and the apparent resistivity values (in ohm
meters) were measured for 25, 50, 75 and 100 m depths (Table 2).
GIS based lineament Delineation using geophysical resistivity data, Karur district, Tamil Nadu, India
Muralitharan. J, Palanivel. K
International Journal of Geomatics and Geosciences
Volume 3 Issue 1, 2012 168
Figure 1: Location map of the study area

GIS based lineament Delineation using geophysical resistivity data, Karur district, Tamil Nadu, India
Muralitharan. J, Palanivel. K
International Journal of Geomatics and Geosciences
Volume 3 Issue 1, 2012 169
Figure 2: Geophysical resistivity survey locations
2.2 Resistivity lineaments – 25 Meters
Such geographical locations of the resistivity probe points (X, Y) and the resistivity values at
25 m (Z1), 50 m (Z2), 75 m (Z3) and 100 m (Z4) were entered into Surfer software and Iso
Resistivity contours were drawn for 25 m depth first . These contours were imported to
ArcGIS software and by using the spatial analyst model DEM was generated for such Iso
resistivity values (Figure 3).
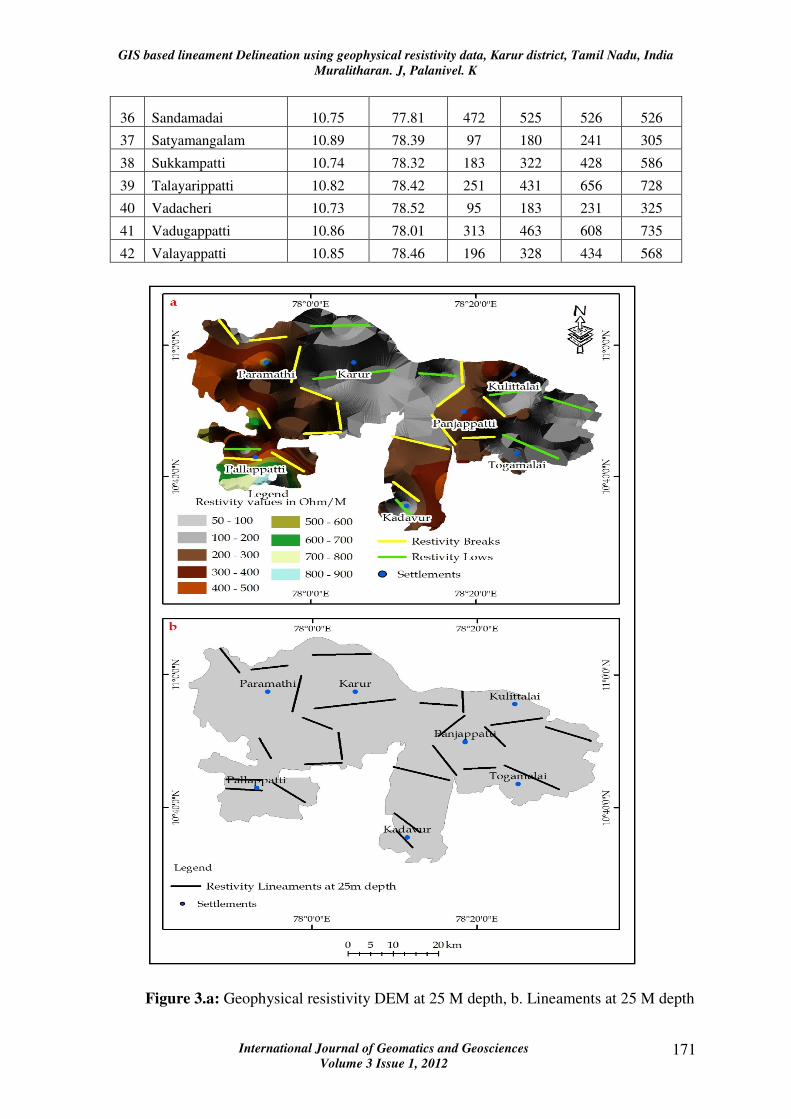
Such digital elevation models of resistivity data of 25 m depth obviously showed the
1. Resistivity maximas as peaks
2. Long and linear resistivity highs as ridges
3. Resistivity minimas as valleys and
4. Long and Linear resistivity minimas as rectilinear valleys

GIS based lineament Delineation using geophysical resistivity data, Karur district, Tamil Nadu, India
Muralitharan. J, Palanivel. K
International Journal of Geomatics and Geosciences
Volume 3 Issue 1, 2012 170
Table 1: Geophysical resistivity survey results
Apparent Resistivity Value
(Ohm.m) Sl.
No Village
Latitude
in decimal
degree
Longitude
in
decimal
degree
25m 50m 75m 100m
1 Alamarathupatti 10.67 77.92 966 1159 1250 980
2 Archampatti 10.77 78..52 180 231 291 496
3 Ariyur 10.80 77.93 201 276 418 510
4 Arumalkaranpudur 11.03 78.05 274 527 712 809
5 Attippalaiyam 11.01 77.86 184 277 393 468
6 Chinnadharapuram 10.84 77.85 448 652 757 854
7 Inungur 10.85 78.48 58 76 77 76
8 Irumbuduppatti 10.85 78.38 100 222 319 396
9 Jellippatti 10.81 78.10 182 282 406 521
10 Kadavur 10.59 78.19 143 242 315 518
11 Kalugur Udaiyappatti 10.76 78.39 124 185 274 366
12 Karudaiyampalayam 10.96 77.95 272 454 606 622
13 Karunallivalasu 10.91 77.81 510 681 784 829
14 Kollampatti 10.72 77.99 243 385 491 457
15 Kovakulam 10.92 78.27 78 140 205 258
16 Kullampatti 10.81 78.33 453 584 511 721
17 Mailaippatti 10.69 78.19 311 502 688 879
18 Malapatti 10.73 77.86 105 184 209 388
19 Mamarattuppatti 10.75 78.25 160 247 420 444
20 Manalmedu 10.89 78.02 109 201 304 387
21 Melveliyur 10.74 78.45 124 247 391 535
22 Mudalaippatti 10.63 787.31 678 681 704 780
23 Nadoor 10.71 77.99 238 598 878 1112
24 Nagampalli 10.83 77.93 295 422 487 510
25 Pallamarudapatti 10.93 77.98 153 292 435 551
26 Panjappatti 10.82 78.30 302 705 971 1271
27 Paramathi 10.95 77.91 590 628 728 834
28 Periyamanjuvali 10.66 77.95 615 785 887 1012
29 Pidaripatti 10.70 78.44 109 151 285 254
30 Puduppatti 10.92 78.37 410 719 805 900
31 Pugalur 11.04 77.98 195 296 348 350
32 Puttur 10.76 78.49 166 308 466 605
33 Rajapuram 10.79 77.89 737 873 906 909
34 Salaippatti 10.88 78.21 184 320 480 586
35 Sallippatti 10.90 77.88 231 361 448 529
GIS based lineament Delineation using geophysical resistivity data, Karur district, Tamil Nadu, India
Muralitharan. J, Palanivel. K
International Journal of Geomatics and Geosciences
Volume 3 Issue 1, 2012 171
36 Sandamadai 10.75 77.81 472 525 526 526
37 Satyamangalam 10.89 78.39 97 180 241 305
38 Sukkampatti 10.74 78.32 183 322 428 586
39 Talayarippatti 10.82 78.42 251 431 656 728
40 Vadacheri 10.73 78.52 95 183 231 325
41 Vadugappatti 10.86 78.01 313 463 608 735
42 Valayappatti 10.85 78.46 196 328 434 568
Figure 3.a: Geophysical resistivity DEM at 25 M depth, b. Lineaments at 25 M depth
GIS based lineament Delineation using geophysical resistivity data, Karur district, Tamil Nadu, India
Muralitharan. J, Palanivel. K
International Journal of Geomatics and Geosciences
Volume 3 Issue 1, 2012 172
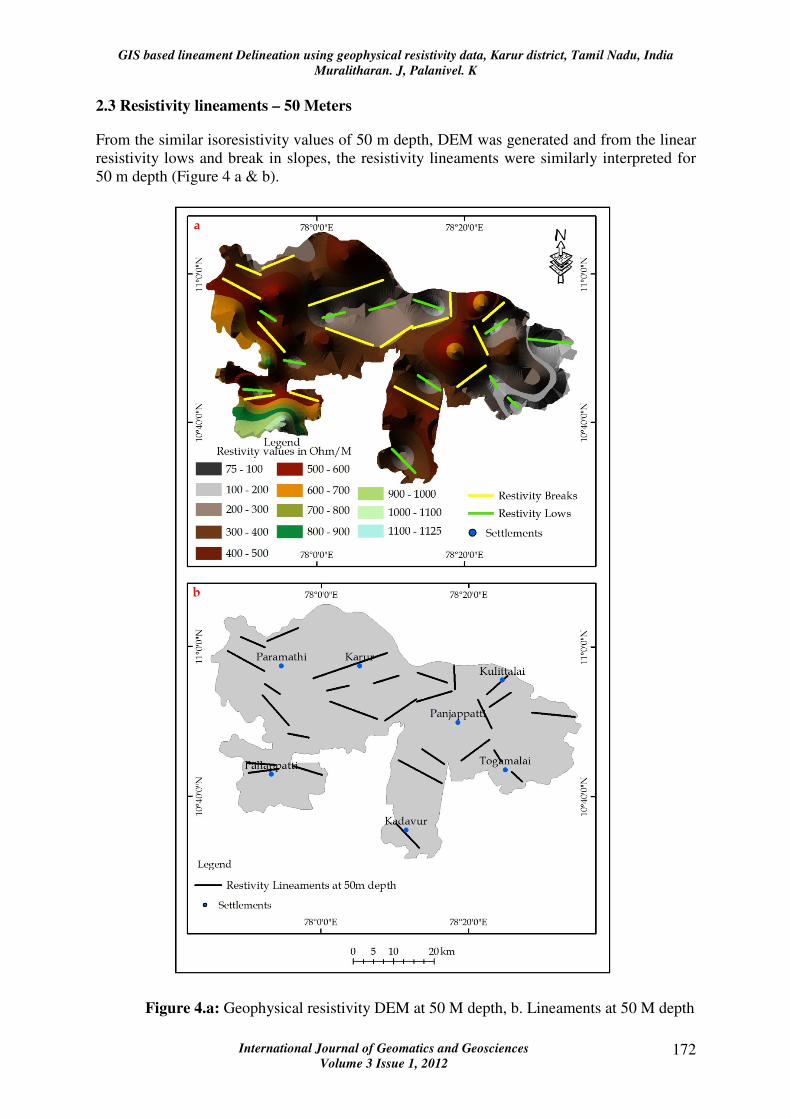
2.3 Resistivity lineaments – 50 Meters
From the similar isoresistivity values of 50 m depth, DEM was generated and from the linear
resistivity lows and break in slopes, the resistivity lineaments were similarly interpreted for
50 m depth (Figure 4 a & b).
Figure 4.a: Geophysical resistivity DEM at 50 M depth, b. Lineaments at 50 M depth

GIS based lineament Delineation using geophysical resistivity data, Karur district, Tamil Nadu, India
Muralitharan. J, Palanivel. K
International Journal of Geomatics and Geosciences
Volume 3 Issue 1, 2012 173
2.4 Resistivity lineaments – 75 Meters
The isoresistivity contours were similarly drawn for 75 m depth and from the corresponding
resistivity DEM generated so for 75m depth (Figure 5a), the lineaments were derived from
such resistivity lows and breaks (Figure 5b).
Figure 5.a: Geophysical resistivity DEM at725 M depth, b. Lineaments at 75 M
depth
GIS based lineament Delineation using geophysical resistivity data, Karur district, Tamil Nadu, India
Muralitharan. J, Palanivel. K
International Journal of Geomatics and Geosciences
Volume 3 Issue 1, 2012 174
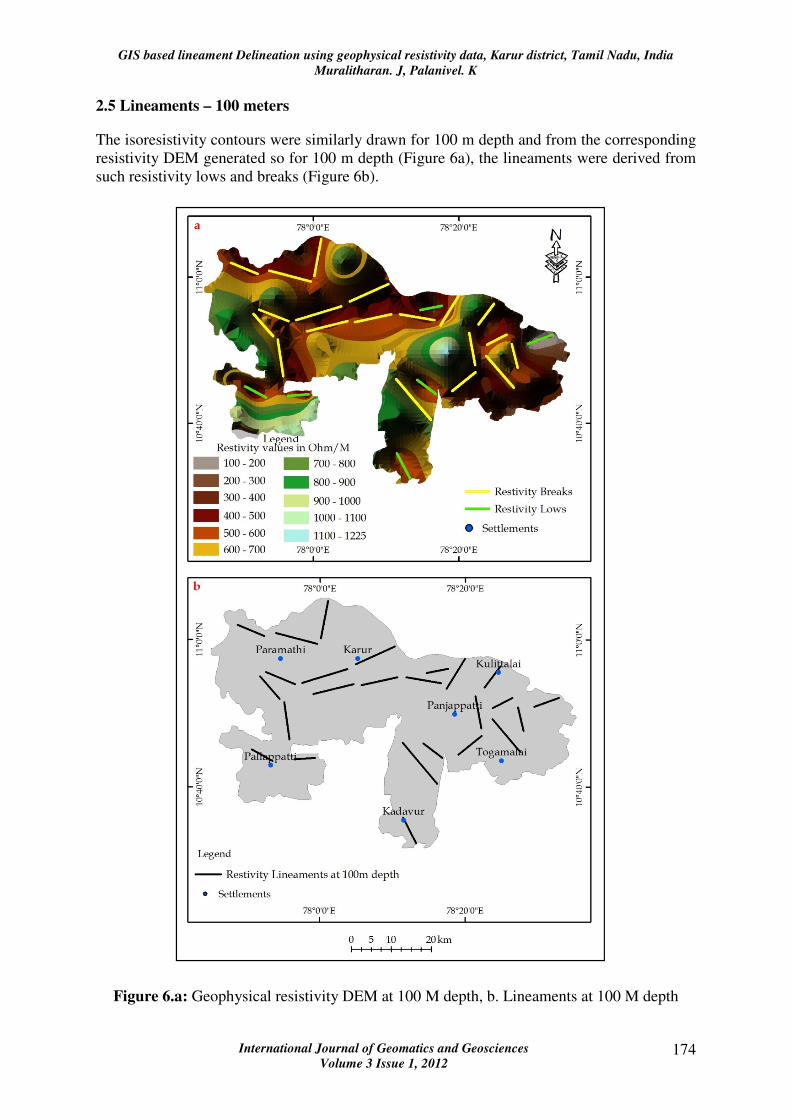
2.5 Lineaments – 100 meters
The isoresistivity contours were similarly drawn for 100 m depth and from the corresponding
resistivity DEM generated so for 100 m depth (Figure 6a), the lineaments were derived from
such resistivity lows and breaks (Figure 6b).
Figure 6.a: Geophysical resistivity DEM at 100 M depth, b. Lineaments at 100 M depth
GIS based lineament Delineation using geophysical resistivity data, Karur district, Tamil Nadu, India
Muralitharan. J, Palanivel. K
International Journal of Geomatics and Geosciences
Volume 3 Issue 1, 2012 175
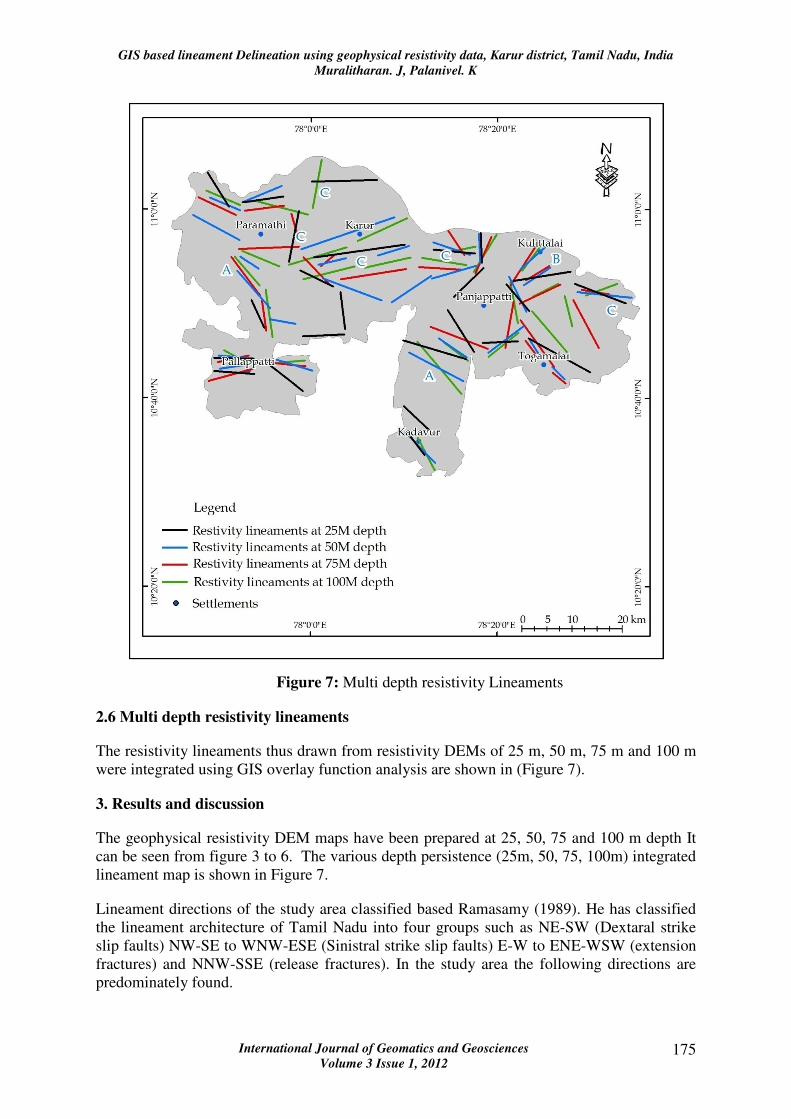
Figure 7: Multi depth resistivity Lineaments
2.6 Multi depth resistivity lineaments
The resistivity lineaments thus drawn from resistivity DEMs of 25 m, 50 m, 75 m and 100 m
were integrated using GIS overlay function analysis are shown in (Figure 7).
3. Results and discussion
The geophysical resistivity DEM maps have been prepared at 25, 50, 75 and 100 m depth It
can be seen from figure 3 to 6. The various depth persistence (25m, 50, 75, 100m) integrated
lineament map is shown in Figure 7.
Lineament directions of the study area classified based Ramasamy (1989). He has classified
the lineament architecture of Tamil Nadu into four groups such as NE-SW (Dextaral strike
slip faults) NW-SE to WNW-ESE (Sinistral strike slip faults) E-W to ENE-WSW (extension
fractures) and NNW-SSE (release fractures). In the study area the following directions are
predominately found.
GIS based lineament Delineation using geophysical resistivity data, Karur district, Tamil Nadu, India
Muralitharan. J, Palanivel. K
International Journal of Geomatics and Geosciences
Volume 3 Issue 1, 2012 176
1. NNW-SSE direction Figure (7 A).
2. NE–SW direction Figure (7 B).
3. N-S and E-W lineaments (7 C).
4. Conclusion
Geophysical resistivity DEM for different depths prepared can indicate the location of depth
persistence lineaments at different depths. Such areas can be classified as high groundwater
potential zones and are also suitable sites for artificial aquifer recharging as they allow large-
scale migration of groundwater. Geophysical resistivity data is demonstrated as one of the
most easier and produces more accurate, results by the present study.
5. References
1. Anbazhagan S., (1993), Fracture pattern study for groundwater exploration in part
of Dharmapuri district. Bhu-Jal News, Tamilnadu, pp 8–12.
2. Anbazhagan S, Ramasamy SM., (1997), Geophysical resistivity survey and
potential site selection for artificial recharge in central Tamil Nadu. India.
3. Aswathanarayana LG and Srinivas G., (1991), Resistivity survey of Ghataprabha
river basin in parts of Karnataka and Maharashtra, South India. In: Proceedings of
the first international seminar and exhibition on exploration geophysics in nineteen
nineties. Association of exploration geophysicists, Hyderabad, 1, pp 262– 269.
4. Kunze AWG., (1998), Implications of electrical resistivity data regarding
groundwater lenses on San Salvador island. Bahamas Environ Enginner Geosci, 4,
pp 55–76.
5. Marinis PG, Koukis GC Tsiambaos GC, Stournaras GC., (eds) Engineering
geology and the environment. Brookfield, 2, pp 1169–1173.
6. Muralidharan D (1996), A semi-quantitative approach to detect aquifers in hard
rocks from apparent resistivity data. J Geol Soc India, 47, pp 237–242.
7. Osella A, Favetto A, Martinelli, P, Cernadas D., (1999), Electrical imaging of an
alluvial aquifer at Antinaco-Los Colorados tectonic valley in the Sierras
Pampeanas. Argentina Appl Geophys, 4, pp 359–368.
8. Raju NJ, Reddy TVK, Nayudu PT., (1996), Electrical resistivity surveys for
groundwater in the upper Gunjanaeru catchment. Cuddapah district Andhra
Pradesh 47, pp 705–716.
9. Ramanujachary KR, Balakrishna S., (1985), Resistivity investigations in different
geological terrains. Groundwater News, pp 1–14.
10. Ramasamy, S.M., (1989), Morphotectonic evolution of east and west coasts of
Indian peninsula. Geological Survey of India, Special Publication, 24, pp 333-339.
GIS based lineament Delineation using geophysical resistivity data, Karur district, Tamil Nadu, India
Muralitharan. J, Palanivel. K
International Journal of Geomatics and Geosciences
Volume 3 Issue 1, 2012 177
11. Ravi Prakash S, Krishna Rao G., (1991), Geo-electrical resistivity studies of
Paravada area, Visakhapatnam District, Andhra Pradesh, Hydrology J IAH, XIV,
pp 1–15.
12. Singhal DC, Sri Niwas, Shakeel M, Adam EM., (1998), Estimation of hydraulic
characteristics of alluvial aquifers from electrical resistivity data. J Geol Soc India
51, pp 461–470
13. Suresh TS, Naganna C, Srinivas G., (1992), Exploration for groundwater in
Hemavathy river basin, Karnataka: Using resistivity techniques. J Indian Acad
Geosci, 35, pp 25–30.
14. Verma RK, Rao MK, Rao CV., (1980), Resistivity investigations for groundwater
in metamorphic areas near Dhanbad, India, Ground water, 18, pp 46– 55.