Embed Size (px)
Citation preview
GIS-Based Evaluation
of Waterfowl and Wading Bird Habitats
in Maine
by
Heather L. Rustigian Department of Wildlife Ecology and
Maine Cooperative Fish and Wildlife Research Unit University of Maine, Orono
and
William B. Krohn
USGS Biological Resources Division
Maine Cooperative Fish and Wildlife Research Unit University of Maine, Orono
Final Contract Report to the Maine Department of Inland Fisheries and Wildlife
Augusta, Maine
June 2002

Table of Contents Abstract ............................................................................................................................... 2 Introduction......................................................................................................................... 3 Purposes and Objectives ..................................................................................................... 4 Methods............................................................................................................................... 5 Manual System............................................................................................................... 5 Automated System......................................................................................................... 6 Species Richness and WWH Ratings .......................................................................... 15 Results and Discussion ..................................................................................................... 21 Automated Evaluation ................................................................................................. 21 Species Richness and WWH Ratings .......................................................................... 23 Automated Delineation and Regional Variation.......................................................... 27 Summary and Conclusions ............................................................................................... 31 Acknowledgments............................................................................................................. 37 Literature Cited ................................................................................................................. 39 Appendices........................................................................................................................ 41 Appendix A. Commands used to delineate waterfowl and wading bird habitats ........ 41 Appendix B. Overview of automated WWH evaluation procedure ............................ 42 Appendix C. Commands used to evaluate WWHs with ARC/INFO GIS................... 43 Appendix D. Program used to automate WWH evaluation process............................ 53 Appendix E. Program used to prepare indeterminate indeterminate WWHs for interspersion analysis. ............................................................................. 57 Appendix F. Program used summarize interspersion analysis results......................... 58 Appendix G. List of species used in comparison of WWH ratings with ME-GAP species occurrence predictions................................................................ 59
1
Abstract: The Maine Department of Inland Fisheries and Wildlife (MDIFW) has the authority under the state’s Natural Resources Protection Act to identify and conserve high and moderate value waterfowl and wading birds habitats (WWH). While MDIFW has developed a manual system for identifying high and moderate value non-tidal wetlands for waterfowl and wading bird habitat, it is so labor and time intensive that approximately 10% of the state’s WWHs have been evaluated. Our objectives are to: (1) automate the existing non-tidal WWH delineation process and evaluation system, (2) compare results for individual WWHs in Kennebec County to determine if the automated system is operating similarly to the manual system, (3)apply the automated system to all mapped wetlands in Maine , and (4) determine if the ratings related to and the predicted presence of wetland birds and other vertebrate groups and the observed presence of wading birds. Boundaries and partially completed manual ratings for 3,448 WWHs in organized towns in Maine provided by MDIFW and digital National Wetlands Inventory (NWI) maps for Maine were used in a Geographical Information System (GIS) to automate the WWH delineation and evaluation process. A series of programs in ARC Macro Language for ARC/INFO GIS were written to analyze WWH wetland composition from the NWI map to evaluate the following 5 WWH criteria: dominant wetland type, habitat size, diversity of wetland types, wetland type interspersion, and percent open water. Over 68% of WWHs rated moderate or high by MDIFW’s manual system were also rated moderate or high by the automated system. The automated system delineated over 18,000 WWHs across Maine, 44 % of which were rated high or moderate, and this percentage varied little regionally. Predicted occurrences of vertebrate species regularly breeding in Maine, obtained from the Maine Gap Analysis Project, were used to determine if WWH ratings related to the predicted presence of wetland vertebrates. Species were placed into three groupings differing in level of wetland habitat specialization: wading birds and waterfowl, wetland-associated non-fish vertebrate species (divided into wetland-associated amphibians and reptiles, mammals, and birds), and wetland-using non-fish vertebrate species. Non-parametric methods (Kruskall-Wallis analysis of variance and Spearman correlation) were used to test for a linear relationship between WWH category (i.e. high, moderate, and low) and number of predicted species occurrences. High and moderate wetlands had significantly higher predicted use across all vertebrate classes than those rated low. In addition, high rated WWHs had a significantly higher number of observed wading bird species present than WWHs rated moderate or low. Due to the reliance of the automated system on NWI maps, which are based on interpretation of aerial photographs taken mostly in the mid-1980s, and the dynamic nature of Maine’s inland wetlands, especially hydrological modifications by beaver (Castor canadensis), we recommend field checking any wetlands rated low or of concern to local biologists.
2
Introduction
Wetlands are increasingly a focus of research, regulation, management, and
restoration due to their high productivity, biological diversity and water quality
enhancement functions, and the high rate at which they have been modified and
developed. In the conterminous United States (U.S.A.) less than half the estimated
wetland acreage at the time of European settlement still remains. Wetlands were lost at a
rate of 23,700 ha (58,500 acres) annually between 1986 and 1997, with 98% of those
losses to freshwater wetlands (Dahl 2000). This is an 80% reduction in the average
annual rate of wetland loss compared to the period between 1975 to 1986, attributed to
increases in various wetland protection measures (Dahl 2000).
Due to climate and glacial history, water and wetlands make up an unusually high
percentage (15%) of land cover in Maine (Krohn et al. 1998). While wooded swamps
predominate Maine wetlands, a wide variety of other inland wetland types commonly
occur in the state, including fresh emergent marshes, wet meadows and peatlands, the
diversity of which is unsurpassed in the United States (Krohn et al. 1998, Davis and
Anderson 2001). While rates of wetland loss in Maine have remained below national
averages, percent wetland land cover in the state is thought to have decreased from an
estimated 30% in the 1780’s to the present 15% (Dahl 1990, Krohn et al. 1998).
Currently, two thirds of the U.S.A. lack comprehensive state wetland regulatory
programs. Maine is one of the minority of states with wetland laws, including the state
mandatory Shoreland Zoning Ordinance (1974) and Natural Resources Protection Act
(NRPA), passed in 1988 (Venno 1991). NRPA regulates the human alteration of
significant wildlife habitat, defined as: “…habitat for endangered and threatened species,
3

critical spawning and nursery areas for Atlantic sea run salmon, seabird nesting islands,
shorebird nesting feeding and staging areas, high and moderate value waterfowl and
wading bird nesting and feeding areas, high and moderate value deer wintering areas and
travel corridors, and significant vernal pools” (Venno 1991). Under NRPA, the Maine
Department of Inland Fisheries and Wildlife (MDIFW) has the authority to identify and
map significant wildlife habitat, including high and moderate value waterfowl and
wading bird habitats (Venno 1991).
MDIFW has developed delineation procedures and an evaluation system for the
identification and assessment of non-tidal waterfowl and wading bird habitats (WWHs).
Since 1993, WWH identification and evaluation have been only partially completed due
to the time consuming process of manually deriving the necessary information from
aerial photographs, and Maine Wetlands Inventory (MWI) and National Wetlands
Inventory (NWI) paper maps. However, newly available statewide digital NWI data
allow for the process to be automated using a geographic information system (GIS),
potentially increasing efficiency, cost effectiveness, and objective application of the
criteria.
Purposes and Objectives
The purpose of this study is to develop an automated, spatially explicit system
that identifies high and moderate value waterfowl and wading bird habitats similarly to
the manual system developed by MDIFW. This GIS-based system is needed to delineate
and evaluate individual wetland complexes across the state. Specific objectives are as
follows:
4

(1)
(2)
(3)
(4)
Automate the existing non-tidal WWH delineation process and evaluation
system to identify moderate and high value waterfowl and wading bird
habitats in Maine.
Compare the results for individual WWHs in Kennebec County to determine
if the automated system is delineating and evaluating wetland complexes
similarly to the manual system.
Assuming the automated system performs similarly to the manual one, then
apply the automated system to wetlands across Maine.
Assess the value of WWH rating system for wading birds, waterfowl, and
other species by comparing WWH ratings (i.e. low, moderate, and high) to the
numbers of regularly breeding vertebrates predicted to use these wetland
complexes and numbers of wading birds observed using these wetland
complexes during surveys.
Methods
Manual System
To protect habitats for waterfowl and wading birds, MDIFW must identify high and
moderate value WWHs. MDIFW created a set of delineation guidelines and developed a
system to rate wading bird and waterfowl habitat value based on wetland characteristics
(Figure 1). Delineation guidelines call for combining all adjacent wetlands, with the
exception of peripherally located wooded swamps and areas of deep open fresh water of
over 100 acres, which are generally not lumped into wetland complexes. However,
wetland complexes smaller than 10 acres adjacent to areas of deep open fresh water
5
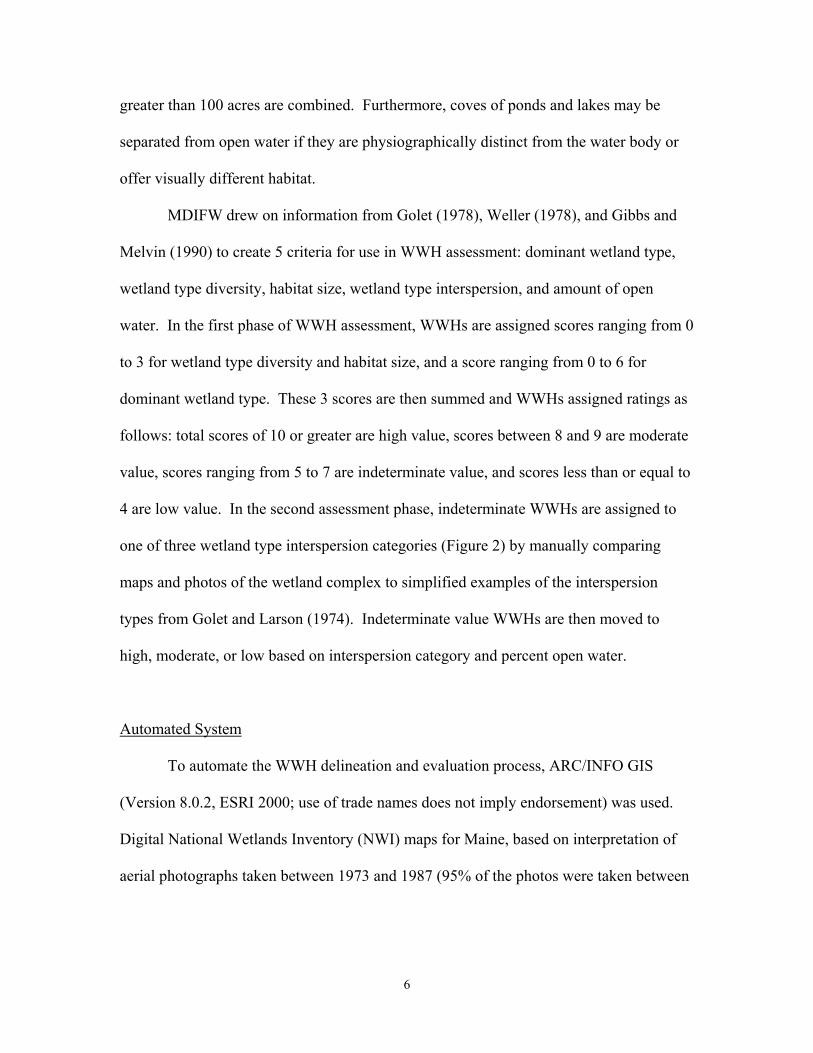
greater than 100 acres are combined. Furthermore, coves of ponds and lakes may be
separated from open water if they are physiographically distinct from the water body or
offer visually different habitat.
MDIFW drew on information from Golet (1978), Weller (1978), and Gibbs and
Melvin (1990) to create 5 criteria for use in WWH assessment: dominant wetland type,
wetland type diversity, habitat size, wetland type interspersion, and amount of open
water. In the first phase of WWH assessment, WWHs are assigned scores ranging from 0
to 3 for wetland type diversity and habitat size, and a score ranging from 0 to 6 for
dominant wetland type. These 3 scores are then summed and WWHs assigned ratings as
follows: total scores of 10 or greater are high value, scores between 8 and 9 are moderate
value, scores ranging from 5 to 7 are indeterminate value, and scores less than or equal to
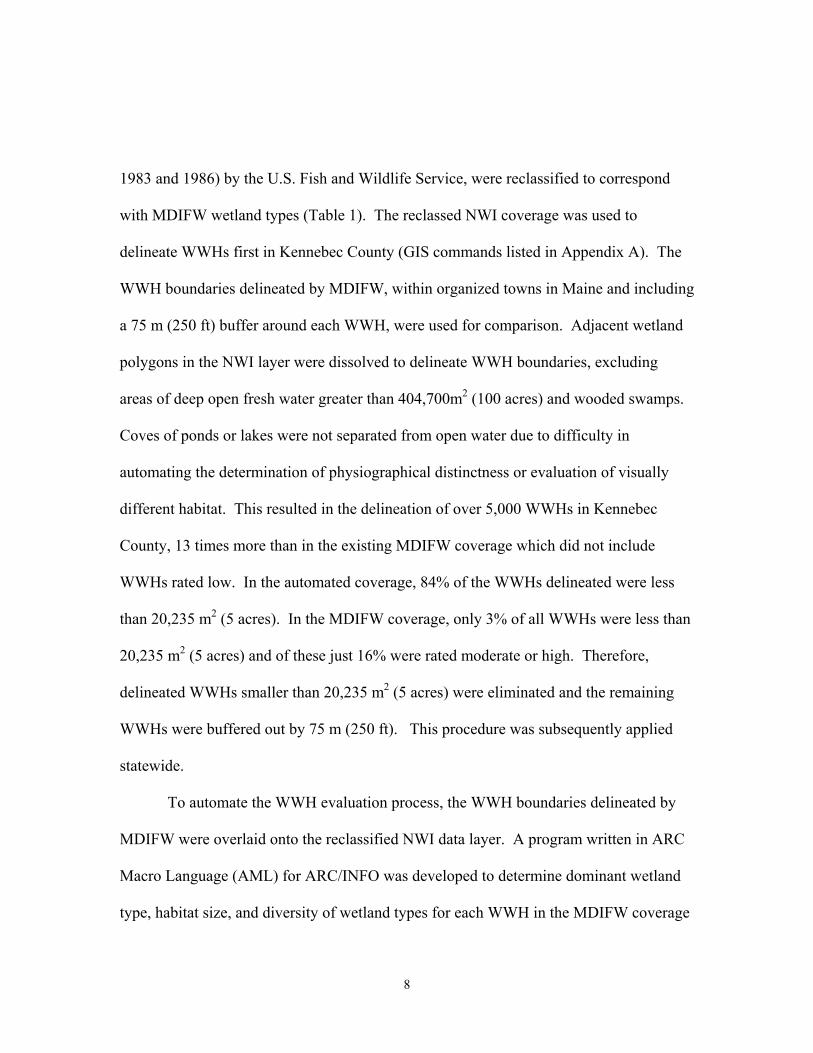
4 are low value. In the second assessment phase, indeterminate WWHs are assigned to
one of three wetland type interspersion categories (Figure 2) by manually comparing
maps and photos of the wetland complex to simplified examples of the interspersion
types from Golet and Larson (1974). Indeterminate value WWHs are then moved to
high, moderate, or low based on interspersion category and percent open water.
Automated System
To automate the WWH delineation and evaluation process, ARC/INFO GIS
(Version 8.0.2, ESRI 2000; use of trade names does not imply endorsement) was used.
Digital National Wetlands Inventory (NWI) maps for Maine, based on interpretation of
aerial photographs taken between 1973 and 1987 (95% of the photos were taken between
6

+
Hab
itat S
ize
(m2 )
S
core
<
40,4
70
1
4
0,47
0 - 4
04,7
00
2
> 40
4,70
0
3
Wet
land
Div
ersi
ty (#
Typ
es)
Sco
re
0 –
1
0
2
1
3
2
> 3
3
Dom
inan
t Wet
land
Typ
e
Sco
re
Inla
nd S
hallo
w F
resh
Mar
sh
6 In
land
Dee
p Fr
esh
Mar
sh
6 Sh
allo
w O
pen
Fres
h W
ater
4
Bog
2 In
land
Fre
sh M
eado
w
2
Shru
b Sw
amp
2 W
oode
d Sw
amp
0 In
land
Dee
p O
pen
Fres
h W
ater
0
Upl
and
0
Tota
l Sco
re
WW
H C
ateg
ory
10 –
12
H
igh
8 –
9
Mod
erat
e 5
– 7
In
dete
rmin
ate
0 –
4
Low
Inte
rspe
rsio
n
Perc
ent O
pen
Wat
er
Cat
egor
y 0
< 35
35 –
65
>
65
1
Low
Lo
w
M
oder
ate
Low
2
Lo
w
Mod
erat
e M
oder
ate
Mod
erat
e 3
Lo
w
Mod
erat
e H
igh
M
oder
ate
Inde
term
inat
e W
WH
s onl
y
+
7
Figu
re 1
. Eva
luat
ion
syst
em u
sed
by th
e M
aine
Dep
artm
ent o
f Inl
and
Fish
erie
s and
Wild
life
to id
entif
y hi
gh a
nd m
oder
ate
valu
e in
land
w
ater
fow
l and
wad
ing
bird
hab
itats
.
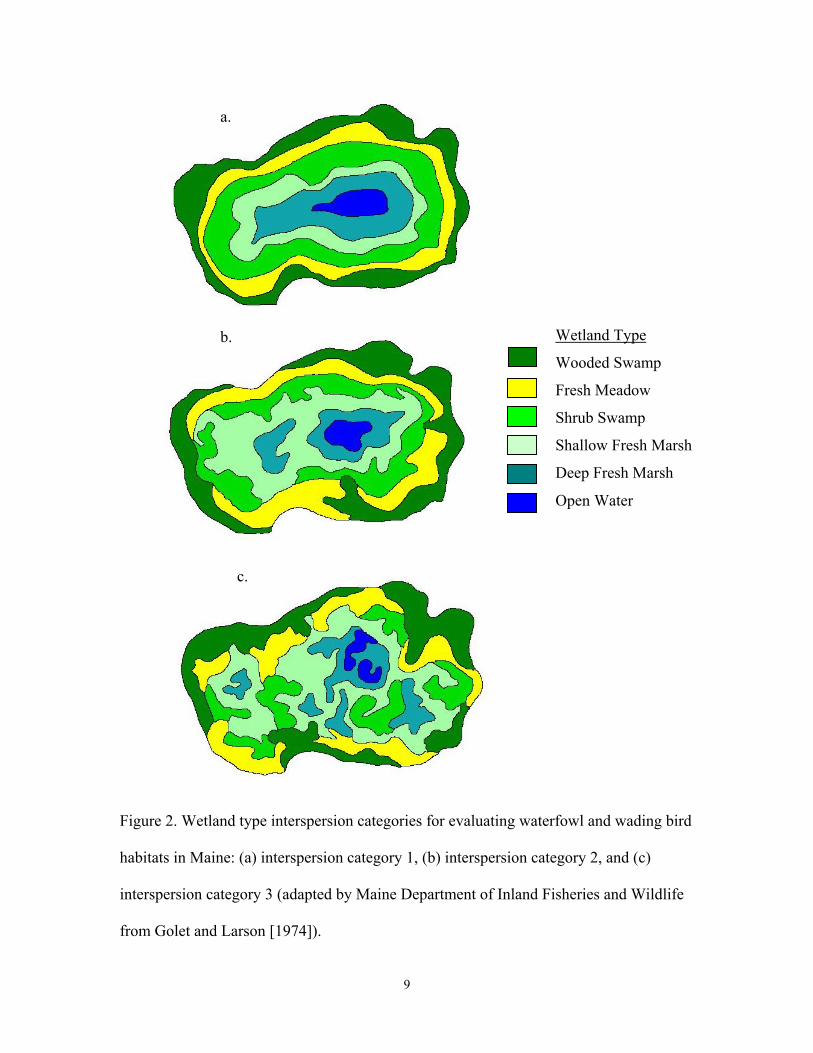
1983 and 1986) by the U.S. Fish and Wildlife Service, were reclassified to correspond
with MDIFW wetland types (Table 1). The reclassed NWI coverage was used to
delineate WWHs first in Kennebec County (GIS commands listed in Appendix A). The
WWH boundaries delineated by MDIFW, within organized towns in Maine and including
a 75 m (250 ft) buffer around each WWH, were used for comparison. Adjacent wetland
polygons in the NWI layer were dissolved to delineate WWH boundaries, excluding
areas of deep open fresh water greater than 404,700m2 (100 acres) and wooded swamps.
Coves of ponds or lakes were not separated from open water due to difficulty in
automating the determination of physiographical distinctness or evaluation of visually
different habitat. This resulted in the delineation of over 5,000 WWHs in Kennebec
County, 13 times more than in the existing MDIFW coverage which did not include
WWHs rated low. In the automated coverage, 84% of the WWHs delineated were less
than 20,235 m2 (5 acres). In the MDIFW coverage, only 3% of all WWHs were less than
20,235 m2 (5 acres) and of these just 16% were rated moderate or high. Therefore,
delineated WWHs smaller than 20,235 m2 (5 acres) were eliminated and the remaining
WWHs were buffered out by 75 m (250 ft). This procedure was subsequently applied
statewide.
To automate the WWH evaluation process, the WWH boundaries delineated by
MDIFW were overlaid onto the reclassified NWI data layer. A program written in ARC
Macro Language (AML) for ARC/INFO was developed to determine dominant wetland
type, habitat size, and diversity of wetland types for each WWH in the MDIFW coverage
8
a.
Wetland Type
Wooded Swamp
Fresh Meadow
Shrub Swamp
Shallow Fresh Marsh
Deep Fresh Marsh
Open Water
b.
c.
Figure 2. Wetland type interspersion categories for evaluating waterfowl and wading bird
habitats in Maine: (a) interspersion category 1, (b) interspersion category 2, and (c)
interspersion category 3 (adapted by Maine Department of Inland Fisheries and Wildlife
from Golet and Larson [1974]).
9
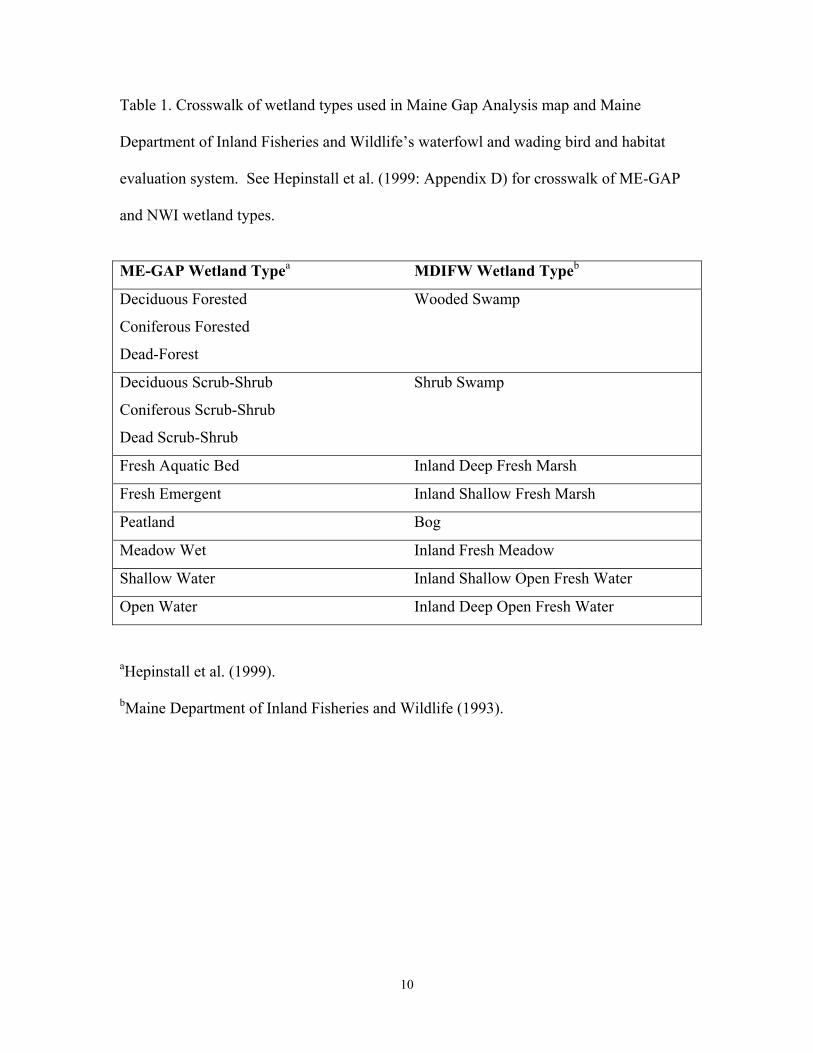
Table 1. Crosswalk of wetland types used in Maine Gap Analysis map and Maine
Department of Inland Fisheries and Wildlife’s waterfowl and wading bird and habitat
evaluation system. See Hepinstall et al. (1999: Appendix D) for crosswalk of ME-GAP
and NWI wetland types.
ME-GAP Wetland Typea MDIFW Wetland Typeb
Deciduous Forested
Coniferous Forested
Dead-Forest
Wooded Swamp
Deciduous Scrub-Shrub
Coniferous Scrub-Shrub
Dead Scrub-Shrub
Shrub Swamp
Fresh Aquatic Bed Inland Deep Fresh Marsh
Fresh Emergent Inland Shallow Fresh Marsh
Peatland Bog
Meadow Wet Inland Fresh Meadow
Shallow Water Inland Shallow Open Fresh Water
Open Water Inland Deep Open Fresh Water
aHepinstall et al. (1999).
bMaine Department of Inland Fisheries and Wildlife (1993).
10

by evaluating WWH wetland composition from the NWI map (Appendices B, C, and D).
Habitat size was evaluated as the total wetland area, omitting any upland areas that were
within the WWH boundary due to the buffer. An area score of 1 was assigned to WWHs
with areas less than 40,470 m2 (10 acres), 2 for WWH area between 40,470 m2 (10 acres)
and 404,700 m2 (100 acres), and 3 for WWH area greater than 404,700 m2 (100 acres).
Following the manual WWH rating procedures of MDIFW, the diversity of wetland types
was evaluated as the number of wetland types comprising at least 8,094 m2 (2 acres) or
10% of total WWH area. Diversity scores were assigned as follows: 0 for 0-1 type, 1 for
2 types, 2 for 3 types, and 3 for greater than 3 types. Dominant wetland type was
evaluated as the wetland type comprising the greatest area within a given WWH and was
given twice as much weight as the diversity and size criteria. Dominant wetland types of
inland shallow fresh marsh and inland deep fresh marsh were assigned a dominant type
score of 6, shallow open water a 4, bog, inland fresh meadow, and shrub swamp a 2, and
0 for inland deep open fresh water, wooded swamp, and upland. Scores for each of these
three criteria were summed and ratings assigned as follows: scores of 10 to 12 were high,
8 to 9 were moderate, and 0 to 4 low. WWHs with scores between 5 and 7 were rated
indeterminate and further evaluated.
Indeterminate WWHs were assessed for wetland type interspersion and percent
open water. In order to automate this process, a method of quantifying wetland type
interspersion was needed. We conducted a preliminary analysis of indeterminate WWHs
in York County, using FRAGSTATS*Arc (Version 302, Pacific Meridian Resource
2001), a spatial pattern analysis program for quantifying landscape structure.
11

FRAGSTATS was run on each indeterminate WWH individually, with any upland
included in the boundaries of a WWH assigned a weight of 0 and all wetland-wetland
boundaries were assigned weights of 1 for the computation of weighted metrics, such as
total edge weighted. Various landscape structure metrics and combinations of metrics
were compared with results of a manual classification of the WWHs into the
interspersion categories. The following combination performed best at separating out the
3 categories: Interspersion and Juxtaposition Index * Total Edge Weighted
(IJI*TE_WGT, Figure 3). York County indeterminate WWHs were divided into the 3
interspersion categories using the natural breaks (Jenk’s Optimization) classification
method on IJI*TE_WGT, resulting in an 87% agreement with the manual classification.
This method was subsequently used for the entire WWH layer (see Appendices E and F
for programs). Indeterminate WWHs were then reassigned ratings of high, moderate, or
low based on their wetland type interspersion category and percent open water (Figure 1).
Manual and automated WWH categories were compared to determine overall operational
agreement rates (both automated and manual ratings of high or moderate) for the
MDIFW WWH layer. However, nearly half of the WWHs in the MDIFW coverage were
incompletely rated by MDIFW as indeterminate and could not be used for comparison.
Operational agreement rates ranged from 56.6% to 69.5% (Table 2). MDIFW records for
WWHs in Kennebec County assigned a manual rating of high or moderate and an
automated rating of low (n = 24) were examined to determine possible sources of
disagreement between the two processes. The majority of the discrepancies were due to
conflicting dominant wetland types. This could be due to the sole reliance of the
automated system on NWI maps as input, while the manual process had additional and
12
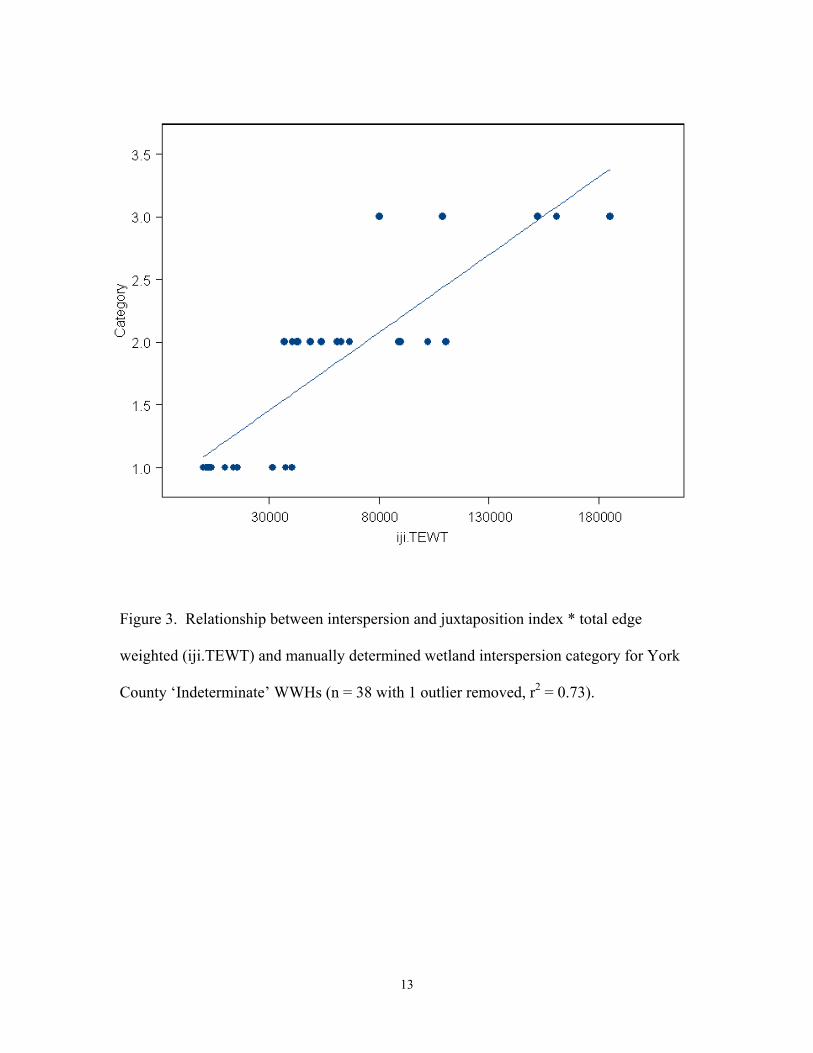
Figure 3. Relationship between interspersion and juxtaposition index * total edge
weighted (iji.TEWT) and manually determined wetland interspersion category for York
County ‘Indeterminate’ WWHs (n = 38 with 1 outlier removed, r2 = 0.73).
13

Table 2. Comparison of manual and automated WWH ratings. Operational agreement
refers to the percentage of WWHs rated as high or moderate by Maine Department of
Inland Fisheries and Wildlife (MDIFW) and as high or moderate by the automated
system.
MDIFW Rating
Na Automated Rating
Auto-mated N
Operational Agreement
Auto-mated Nb
Operational Agreementb
High 392 High Moderate Low
88 174 130
66.8 88 211 93
76.3
Moderate 1485 High Moderate Low
161 635 689
53.6 161 827 497
66.5
Indeterminate 1571 High Moderate Low
225 536 810
NAc 225 770 576
NA
aNumber of WWHs
bIncorporates 2nd dominant wetland type.
cNot applicable. No operational agreement was determined for indeterminate WWHs due
to the transitory nature of the rating. In the automated system, all indeterminate WWHs
were re-evaluated as high, moderate, or low. This process was not completed under
MDIFW’s manual system.
14
often more recent sources of information, such as aerial photos, field checks, and the
personal knowledge of regional biologists. Discrepancies in dominant type also may be
attributed to beaver (Castor canadensis) modification of the landscape, thus altering
wetland regimes and shifting dominant wetland type since NWI maps were developed in
the 1980s. Therefore, all WWHs assigned a rating of low were re-evaluated for second
dominant wetland type (Figure 4). Low WWHs with a second dominant type of shallow
fresh marsh, deep fresh marsh, or shallow open fresh water comprising greater than or
equal to 20% of total WWH area were moved to moderate. This increased operational
agreement rates by 6.8 to 9.9% (Table 2). This automated evaluation process was
subsequently applied statewide on the automated delineated coverage. Regional variation
in WWH density was examined by comparing MDIFW and automated delineated WWHs
by MDIFW administrative region (Figure 5) and biophyisical region (Krohn et al. 1999;
Hepinstall et al. 1999, Figure 6).
Species Richness and WWH Ratings
WWH ratings in the MDIFW coverage were compared with predicted occurrences of
non-fish vertebrates regularly breeding in Maine from the Maine Gap analysis (ME-GAP,
Boone and Krohn 1998a and 1998b) to determine if the WWH evaluation system
discerns wetlands which provide habitat for high numbers wetland-associated vertebrate
species. Automated WWH ratings were used for comparisons because the manual ratings
were incomplete and a reasonable agreement rate was found between the automated and
manual ratings. Species predictions for ME-GAP were modeled at a resolution of 90 m
and overall accuracy rates, at the resolution of state/federal wildlife areas, ranged from
15

H
abita
t Siz
e (m
2 )
Sco
re
< 40
,470
1
40,
470
- 404
,700
2
>
404,
700
3
W
etla
nd D
iver
sity
(# T
ypes
) S
core
0
– 1
0
2
1 3
2 >
3
3
Dom
inan
t Wet
land
Typ
e
Sco
re
Inla
nd S
hallo
w F
resh
Mar
sh
6 In
land
Dee
p Fr
esh
Mar
sh
6 Sh
allo
w O
pen
Fres
h W
ater
4
Bog
2 In
land
Fre
sh M
eado
w
2
Shru
b Sw
amp
2 W
oode
d Sw
amp
0 In
land
Dee
p O
pen
Fres
h W
ater
0
Upl
and
0
Tota
l Sco
re
WW
H C
ateg
ory
10 –
12
H
igh
8 –
9
Mod
erat
e 5
– 7
In
dete
rmin
ate
0 –
4
Low
Inte
rspe
rsio
n
Perc
ent O
pen
Wat
er
Cat
egor
y 0
< 35
35 –
65
>
65
1
Low
Lo
w
M
oder
ate
Low
2
Lo
w
Mod
erat
e M
oder
ate
Mod
erat
e 3
Lo
w
Mod
erat
e H
igh
M
oder
ate
Inde
term
inat
e W
WH
s onl
y
Low
WW
Hs o
nly
2nd D
omin
ant T
ype
WW
H C
ateg
ory
Inla
nd S
hallo
w F
resh
Mar
sh
M
oder
ate
Inla
nd D
eep
Fres
h M
arsh
Mod
erat
e In
land
Sha
llow
Ope
n Fr
esh
Wat
er
M
oder
ate
Bog
Lo
w
Inla
nd F
resh
Mea
dow
Lo
w
Shru
b Sw
amp
Lo
w
+ +
Figu
re 4
. Aut
omat
ed v
ersi
on o
f the
eva
luat
ion
syst
em u
sed
by
the
Mai
ne D
epar
tmen
t of I
nlan
d Fi
sher
ies a
nd W
ildlif
e to
Woode
d Sw
amp
Lo
w
Inla
nd D
eep
Ope
n Fr
esh
Wat
er
Lo
w
Upl
and
Low
iden
tify
high
and
mod
erat
e va
lue
inla
nd w
ater
fow
l and
wad
ing
bird
habi
tats
.
16

Figure 5. Administrative regions used by the Maine Department of Inland Fisheries and Wildlife.
17
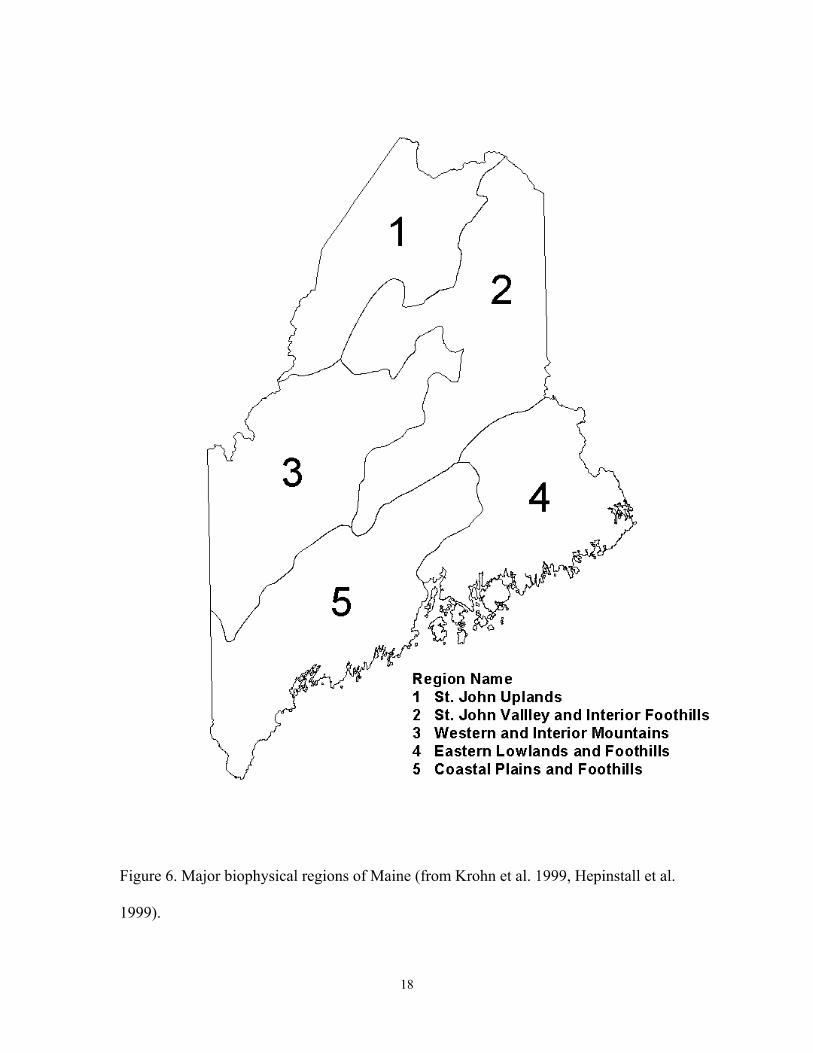
Figure 6. Major biophysical regions of Maine (from Krohn et al. 1999, Hepinstall et al.
1999).
18
74% for birds to 100% for amphibians (Table 3).
Three species groupings differing in level of wetland habitat specialization were
used in the comparisons to ascertain if the applicability of the WWH evaluation system
extends beyond wading bird and waterfowl habitat for which it was intended, also
incorporating important habitat of other wetland taxa. Habitat descriptions in Boone and
Krohn (1998a and 1998b) were used to assign species to the different groups (Appendix
G). Wetland-using non-fish vertebrates, the most inclusive group, with 183 species, and
incorporated all species whose general habitat descriptions included non-tidal wetlands,
but species were not necessarily limited to these habitats. The 73 species in the wetland-
associated non-fish vertebrate group incorporated species whose specific habitat
descriptions were limited to wetlands. This group was divided into wetland-associated
amphibians and reptiles, with 23 species, wetland associated mammals, with 12 species,
and wetland-associated birds, with 38 species. The last group, wading birds and
waterfowl, incorporated the 25 species defined by NRPA and included in ME-GAP.
The ratio of the number of species predicted by ME-GAP to occur to the number
of species that could possibly occur, given range and habitat considerations, was
determined for each WWH in the MDIFW coverage. Due to the high degree skewness in
the data, a rank transformation was applied and non-parametric tests were used for
analyses. Kruskal-Wallis analysis of variance was used to test for differences in rank
sum for the 3 categories (high, moderate, and low). A non-parametric test for differences
in mean rank was used for individual comparisons (Zar 1999). Spearman correlation was
used to test for a linear relationship between WWH category and mean rank.
19

Table 3. Reliability of species occurrence predictions from the Maine Gap analysis (ME-
GAP, from Krohn et al. 1998). Tests made by comparing species predicted to be
present/absent in ME-GAP data to occurrences from long-term field data at 5 test sites.
Taxonomic Omission Errora Commission Errorb Overall Accuracy Class % (Median) % (Median) % Amphibians 0.0 0.0 100 Reptiles 10.0 5.0 85.7 Birds 5.4 18.9 74.0 Mammals 0.7 34.2 79.6 Total 0.0 17.9 aSpecies present on test sites but missed by ME-GAP.
bSpecies absent on test sites but predicted by ME-GAP to occur there (some of this error
could be due to incomplete field surveys; Boone and Krohn 1999).
20
WWH ratings were also compared to MDIFW inland marsh bird survey data from 1998
to 2000 (Tom Hodgman, MDIFW, personal communication). Seven wading bird species
considered under NRPA (great blue heron, Ardea herodias; green heron, Butorides
striatus; least bittern, Ixobrychus exilis; American bittern, Botaurus lentiginosus; Virginia
rail, Rallus limicola; sora, Porzana carolina; and the common moorhen Gallinula
chloropus) were targeted in the surveys. Sedge meadows, deep marshes, and adjacent
open water areas in over 100 wetland complexes in regions 4 and 5 were surveyed
(Figure 6). Survey site boundaries corresponded with 54 WWHs in the statewide
delineated coverage, 7 of which are rated low, 36 moderate, and 11 high (Figure 7).
T-tests were used to test for differences in mean species richness for the 3 ratings (high,
moderate, and low).
Results and Discussion
Automated Evaluation
The MDIFW GIS layer was completed for organized Maine towns only and
consisted of 3,448 WWHs, nearly half of which were rated by MDIFW as indeterminate
(Table 2). Of the 1,571 WWHs rated by MDIFW as indeterminate, the automated
evaluation process rated 14.3% of these as high, 49.0% as moderate, and 36.7% as low.
The automated evaluation process resulted in 13.8% of all state delineated WWHs rated
high, over half (52.4%) rated moderate, and 33.8% rated low. The automated evaluation
process yielded an overall operational agreement of 68.6% (number of WWHs with both
automated and MDIFW ratings of moderate and high). The automated WWH evaluation
process was found to be comparable to the manual process, but limited by available data.
21
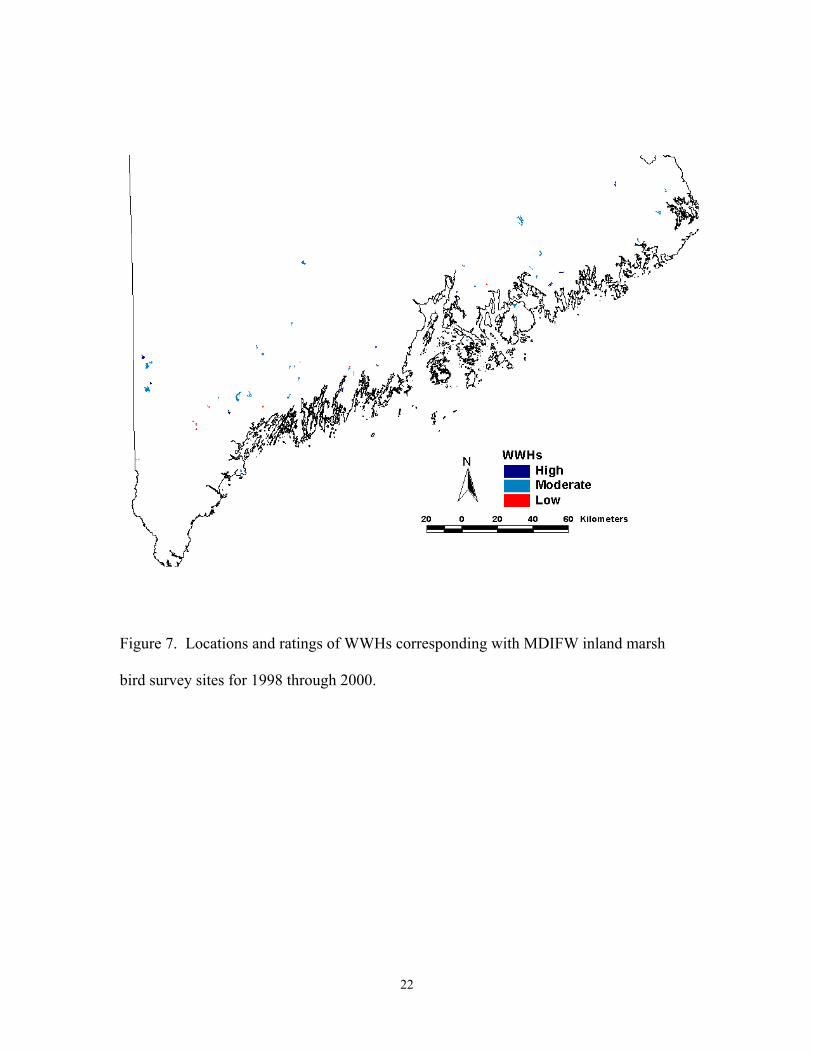
Figure 7. Locations and ratings of WWHs corresponding with MDIFW inland marsh
bird survey sites for 1998 through 2000.
22

It is recommended that MDIFW field check any WWHs deemed of questionable rating
by local biologists (e.g., affected by beaver activity).
Species Richness and WWH Ratings
Results of the Kruskal-Wallis tests provided convincing evidence that rank sum ratio of
predicted to possibly occurring species differed by rating (high, moderate, and low) for
all vertebrate groupings: wading birds and waterfowl; wetland-associated amphibians and
reptiles; wetland-associated mammals; wetland-associated birds; all wetland-associated
non-fish vertebrates; and all wetland-using non-fish vertebrates (p = 0, Table 4). Mean
ranks for low WWHs were significantly different from mean ranks of those rated as
moderate and high for all vertebrate groupings (p < 0.001, Table 5). Differences in mean
ranks of high and moderate WWHs were found for wading birds and waterfowl, wetland-
associated birds, all wetland-associated non-fish vertebrates, and all wetland-using non-
fish vertebrates (p < 0.05, Table 5), but not for wetland-associated amphibians and
reptiles or wetland-associated mammals (p > 0.5, Table 5). Spearman rank correlation
tests showed weak (0.13 < r < 0.32) but statistically significant (p < 0.001) linear
relationships between ranked ratio of predicted to possibly occurring species and rating
for all groupings (Table 6).
The WWH evaluation system distinguishes wetlands predicted by ME-GAP to
have high wading bird and waterfowl diversity. Furthermore, our results suggest that
protection of high and moderate value WWHs in Maine may function as an “umbrella,”
conferring habitat protection for other wetland-associated non-fish vertebrate species as
well. However, while the relationship between WWH category and ME-GAP predictions
23
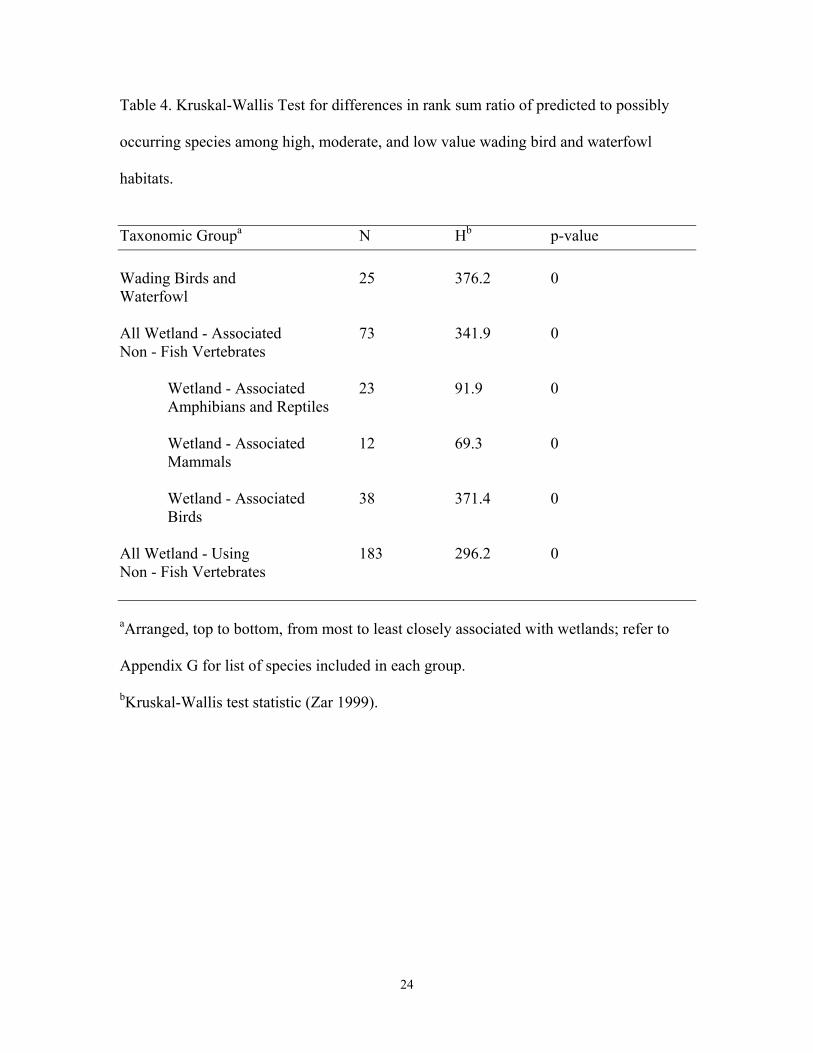
Table 4. Kruskal-Wallis Test for differences in rank sum ratio of predicted to possibly
occurring species among high, moderate, and low value wading bird and waterfowl
habitats.
Taxonomic Groupa N Hb p-value
Wading Birds and 25 376.2 0 Waterfowl All Wetland - Associated 73 341.9 0 Non - Fish Vertebrates
Wetland - Associated 23 91.9 0 Amphibians and Reptiles
Wetland - Associated 12 69.3 0 Mammals
Wetland - Associated 38 371.4 0 Birds
All Wetland - Using 183 296.2 0 Non - Fish Vertebrates aArranged, top to bottom, from most to least closely associated with wetlands; refer to
Appendix G for list of species included in each group.
bKruskal-Wallis test statistic (Zar 1999).
24

Tabl
e 5.
Mul
tiple
com
paris
ons b
etw
een
high
, mod
erat
e, a
nd lo
w v
alue
wad
ing
bird
and
wat
erfo
wl h
abita
ts o
f mea
n ra
nk ra
tio o
f
pred
icte
d to
pos
sibl
y oc
curr
ing
spec
ies.
Hig
h vs
. Low
Mod
erat
e vs
. Low
Hig
h vs
. Mod
erat
e
Ta
xono
mic
Gro
upa
Qb
p
Q
p
Q
p
Wad
ing
Bird
s and
Wat
erfo
wl
15.2
0.00
1
16.8
0.00
1
3.6
0.
001
All
Wet
land
- A
ssoc
iate
d
13.9
0.00
1
16.5
0.00
1
2.5
<
0.05
N
on -
Fish
Ver
tebr
ates
W
etla
nd -
Ass
ocia
ted
6.
4
0.00
1
9.0
0.
001
0.
1
> 0.
5 A
mph
ibia
ns a
nd R
eptil
es
W
etla
nd -
Ass
ocia
ted
5.
4
0.00
1
7.9
0.
001
-0
.1
>
0.5
Mam
mal
s
Wet
land
- A
ssoc
iate
d
15.1
0.00
1
16.7
0.00
1
3.6
0.
001
Bird
s A
ll W
etla
nd -
Usi
ng
14.6
0.00
1
13.8
0.00
1
5.1
0.
001
Non
- Fi
sh V
erte
brat
es
a Arr
ange
d, to
p to
bot
tom
, fro
m m
ost t
o le
ast c
lose
ly a
ssoc
iate
d w
ith w
etla
nds;
refe
r to
App
endi
x G
for l
ist o
f spe
cies
incl
uded
in e
ach
grou
p.
b Non
-par
amet
ric m
ultip
le c
ompa
rison
test
stat
istic
(Zar
199
9).
25
Table 6. Spearman rank correlation coefficients, t-statistics, and associated p-values,
testing for linear relationship between ranked ratio of predicted to possibly occurring
species and WWH rating.
Taxonomic Groupa r t p-value
Wading Birds and 0.32 20.2 < 0.001 Waterfowl All Wetland - Associated 0.31 18.8 < 0.001 Non - Fish Vertebrates
Wetland - Associated 0.15 9.1 < 0.001 Amphibians and Reptiles
Wetland - Associated 0.13 7.8 < 0.001 Mammals
Wetland - Associated 0.32 20.0 < 0.001 Birds
All Wetland - Using 0.29 18.0 < 0.001 Non - Fish Vertebrates aArranged, top to bottom, from most to least closely associated with wetlands; refer to
Appendix G for list of species included in each group.
26
is statistically significant, it explains only a small proportion of the variation in species
richness. For instance, of the 1,408 WWHs predicted by ME-GAP to have 100% species
occurrence, 22% were rated low. Of the 68 WWHs predicted to have less than 20%
species occurrence, 9% were rated high and 28% moderate. Possible explanations for the
weakness of the relationship between WWH rating and rank proportion of the number of
species possible predicted to occur include differences in the scales of ME-GAP and
WWH project or unstudied factors influencing the number of vertebrate species using
wetlands. Further studies are necessary to validate the premise that efforts to protect
wading bird and waterfowl habitat will adequately confer protection to other species of
concern (e.g., see Gibbs 2000).
The WWH evaluation system was found to distinguish wetlands observed to have
high wading bird diversity (Figure 8). High rated WWHs were found to have a
significantly higher number of wading bird species present than WWHs rated moderate
or low (p < 0.02, Table 7). American bittern, great blue heron, green heron, sora, and
Virginia rail were the most common species observed across all three ratings (Table 8).
Automated Delineation and Regional Variation
The automated WWH delineation process resulted in the identification of 18,085
WWHs statewide, of these 55.5% were rated low, 37.5% moderate, and 7% high.
MDIFW and automated delineated WWHs were compared in Kennebec County and
found to be similar: MDIFW rated 66 WWHs high and 184 moderate, while the
automated system rated 68 WWHs high and 223 moderate.
27

0
0.5
1
1.5
2
2.5
3
3.5
4
4.5
Low M
WW
Mea
n #
Spec
ies
N = 7
Figure 8. Mean number of wading bird species (
rating.
28
N = 36
oderate
H Rating
+ 1 SE) observed per wetl
N = 11
High
and by WWH
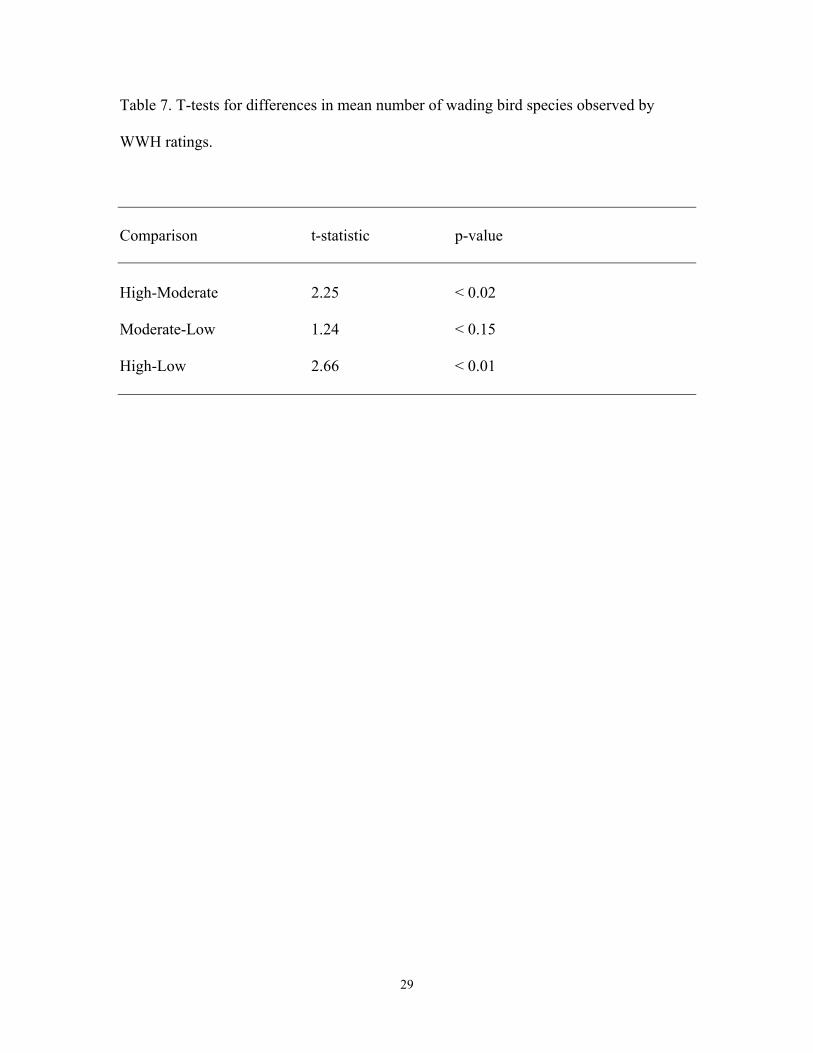
Table 7. T-tests for differences in mean number of wading bird species observed by
WWH ratings.
Comparison t-statistic p-value High-Moderate 2.25 < 0.02 Moderate-Low 1.24 < 0.15 High-Low 2.66 < 0.01
29

Tabl
e 8.
Spe
cies
of w
adin
g bi
rds o
bser
ved
usin
g w
etla
nd b
y W
WH
ratin
gs (d
ata
from
Hod
gman
et a
l. 20
01).
Spec
ies
W
WH
Rat
ing
AM
BI1
CO
MO
2 G
BH
E3 G
RH
E4 LE
BI5
SOR
A6
VIR
A7
Hig
h
0.82
0
0.73
0.45
0.09
0.73
0.73
M
oder
ate
0.56
0.03
0.50
0.25
0.06
0.42
0.64
Lo
w
0.
43
0
0.
29
0.
14
0
0.
29
0.
43
1 Am
eric
an B
itter
n 2 C
omm
on M
oorh
en
3 Gre
at B
lue
Her
on
4 Gre
en H
eron
5 Le
ast B
itter
n 6 So
ra
7 Virg
inia
Rai
l
30

Variation in WWH numbers, ratings, and density was examined by comparing
MDIFW and automated delineated and evaluated WWHs by MDIFW administrative
regions, though only Region B appears to have been completely delineated by MDIFW
(Table 9). The automated system delineated from 2 (Regions A and C) to 13 (Region E)
times more high and moderate WWHs than MDIFW, even after accounting for
MDIFW’s indeterminate WWHs, except in Region B where the difference dropped from
5 times to 0.8 times after the inclusion of indeterminate WWHs. The density of high and
moderate rated WWHs varied little by MDIFW administrative region. High and
moderate rated WWHs were most dense in Regions B and C (0.12/km2) and least dense
in Region G (0.07/ km2). Regional variation in WWH density was examined by
comparing WWHs delineated and evaluated by the automated system by biophyisical
region (Figure 9). The proportion of WWHs by rating (high, moderate, and low) varied
little by region, with highs making up 5 to 9%, moderates 35 to 40%, and lows 52 to 57%
of all WWHs (Table 10). The density of high and moderate rated WWHs varied little by
biophysical region (Table 11). High and moderate rated WWHs were most dense in the
eastern lowlands and foothills and coastal plains and foothills (0.11/km2) and least dense
in the St. John Uplands (0.07/km2). The total area of high and moderate rated WWHs per
biophysical region area also varied little, ranging from 0.04 to 0.08.
Summary and Conclusions
Under NRPA, MDIFW is authorized to identify and map high and moderate
value wading bird and waterfowl habitat. While MDIFW has developed delineation
procedures and an evaluation system for the identification and assessment of non-tidal
31

Tabl
e 9.
Num
bers
of W
WH
s del
inea
ted
and
rate
d by
MD
IFW
and
aut
omat
ed sy
stem
by
MD
IFW
adm
inis
trativ
e re
gion
(see
Fig
ure
4
for l
ocat
ions
of r
egio
ns).
N
umbe
r of W
WH
s M
DIF
W
Are
a
H
igh
M
oder
ate
Inde
term
inat
e
Low
R
egio
n (k
m2 )
Aut
o M
DIF
W
A
uto
MD
IFW
MD
IFW
Aut
o A
8,47
9
13
1 41
66
1 32
5
32
1,
225
B
10
,294
270
110
987
139
1,27
7
1,
463
C
10
,379
228
102
1,04
5 36
3
16
1,
414
D
11,2
54
12
9 34
72
1 25
3
38
1,
060
E
11
,921
168
11
1,08
6 63
19
1,
432
F
13,3
63
24
0 56
1,
310
249
162
1,74
9
G
18,4
76
11
7 41
1,
107
110
44
1,82
6
32

Figure 9. Locations of waterfowl and wading bird habitats delineated and evaluated by
automated assessment system.
33
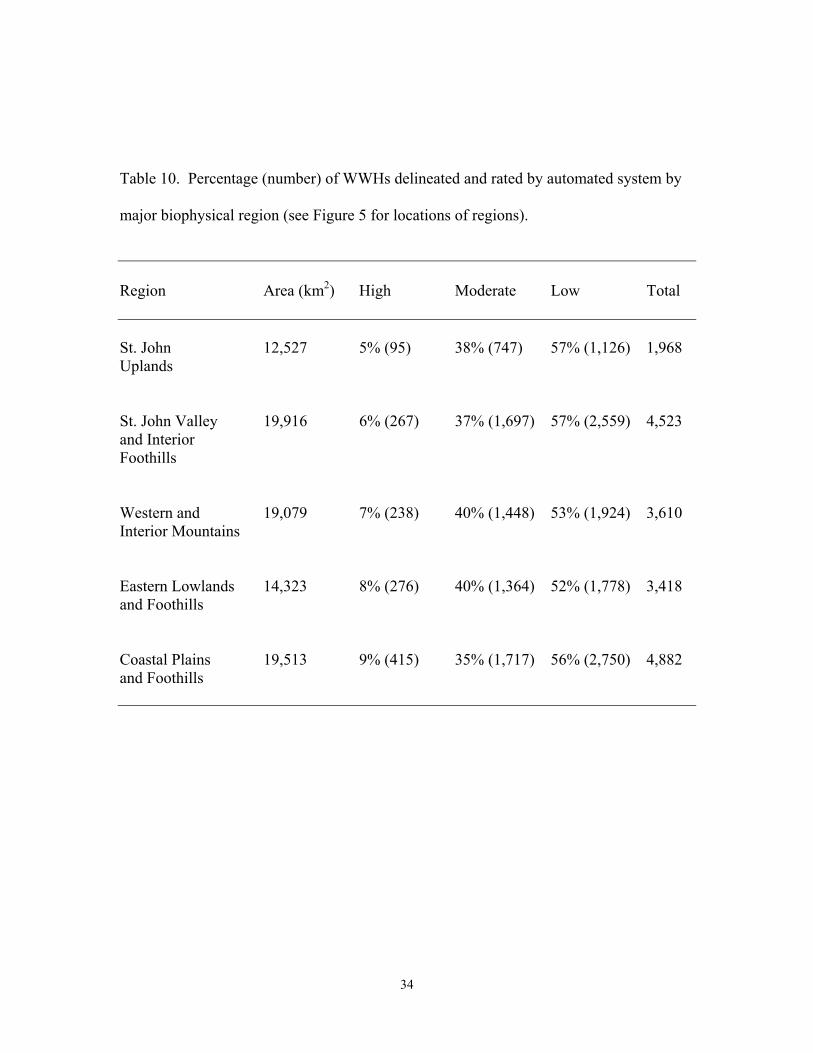
Table 10. Percentage (number) of WWHs delineated and rated by automated system by
major biophysical region (see Figure 5 for locations of regions).
Region Area (km2) High Moderate Low Total St. John 12,527 5% (95) 38% (747) 57% (1,126) 1,968 Uplands St. John Valley 19,916 6% (267) 37% (1,697) 57% (2,559) 4,523 and Interior Foothills Western and 19,079 7% (238) 40% (1,448) 53% (1,924) 3,610 Interior Mountains Eastern Lowlands 14,323 8% (276) 40% (1,364) 52% (1,778) 3,418 and Foothills Coastal Plains 19,513 9% (415) 35% (1,717) 56% (2,750) 4,882 and Foothills
34

Table 11. Density and area of high and moderate WWHs delineated and rated by
automated system by major biophysical region (see Figure 5 for map of regions).
Region Density Area Covered WWH Area / (#/km2) by WWH (km2) Regional Area St. John 0.07 451.7 0.04 Uplands St. John Valley 0.10 1,303.1 0.06 and Interior Foothills Western and 0.09 722.9 0.04 Interior Mountains Eastern Lowlands 0.11 1,205.5 0.08 and Foothills Coastal Plains 0.11 1,240.1 0.06 and Foothills
35

waterfowl and wading bird habitats (WWHs), WWH identification and evaluation had
been only partially completed. The purpose of this project was to automate the WWH
identification and evaluation process to obtain results similar to the manual system.
Furthermore, we wanted to compare WWH ratings with species occurrences to determine
if the WWH evaluation system discerns wetlands predicted to have high numbers of
wetland-associated non-fish vertebrate species and wetlands observed to have high
numbers of wading bird species.
The automated evaluation process yielded an overall operational agreement of
68.6% (number of WWHs with both automated and MDIFW ratings of moderate and
high) and was found to be comparable to the manual process, but limited by available
data. It is recommended that MDIFW field check any WWHs with an automated rating
of low.
The automated WWH evaluation system was found to distinguish wetlands
predicted by ME-GAP to have high wading bird and waterfowl diversity and other
wetland-associated non-fish vertebrate species diversity as more species were predicted
to use high and moderate WWHs than low rated WWHs. While the relationship between
WWH category and ME-GAP species predictions was statistically significant, it
explained only a small portion of variation in species richness. Therefore, further studies
are necessary to validate the premise that efforts to protect wading bird and waterfowl
habitat will adequately confer protection to other species of concern. The WWH
evaluation system was also found to distinguish wetlands observed to have high wading
bird diversity as high rated WWHs were found to have a significantly higher number of
36

wading bird species present than WWHs rated moderate or low, increasing confidence
that the automated ratings are performing as intended.
The automated WWH delineation process resulted in the identification of over
18,000 WWHs statewide, of which over 44% were rated high or moderate. The
automated WWH delineation and evaluation system applied the WWH assessment
criteria uniformly, objectively, efficiently, and comprehensively. Therefore, the process
is easy to explain and justify to the public. However, the results of the automated
delineation and evaluation process are only as good as NWI data used as the system input
and MDIFW will be required to maintain both the automated and manual system until
field biologists have reviewed the results.
Acknowledgments
This paper is a contribution of the Maine Cooperative Fish and Wildlife Research
Unit (cooperators are the U.S. Geological Survey’s Biological Resources Division, Maine
Department of Inland Fisheries and Wildlife, University of Maine, and the Wildlife
Management Institute). We thank the Maine Department of Inland Fisheries and
Wildlife, Maine Environmental Protection Agency, Maine State Planning Office, Maine
Environmental Trust Fund, and the Maine Outdoor Heritage Fund for financial support.
We are grateful to the Maine Department of Inland Fisheries and Wildlife regional
biologists who conducted the manual wading bird and waterfowl habitat evaluations, and
to T. Hodgman for providing the wading bird survey data. Special thanks to M. Stadler,
G. Dumont, G. Matula, and R. Dressler for their many helpful comments, assistance, and
support throughout this project.
37

Literature Cited
Boone, R.B. and W.B. Krohn 1999. Modeling the occurrence of bird species: are the errors predictable? Ecological Applications 9(3):835-848.
38
Boone, R.B. and W.B. Krohn 1998a. Maine Gap Analysis Vertebrate Data – Part I:
distribution, habitat relations, and status of amphibians, reptiles and mammals in Maine. Final report to USGS Biological Resources Division, Gap Analysis Program, Moscow, ID.
Boone, R.B. and W.B. Krohn 1998b. Maine Gap Analysis Vertebrate Data – Part II: distribution, habitat relations, and status of breeding birds in Maine. Final report to USGS Biological Resources Division, Gap Analysis Program, Moscow, ID.
Dahl, T.E. 2000. Status and trends of wetlands in the conterminous United States 1986 to
1997. U.S. Department of the Interior, Fish and Wildlife Service, Washington, D.C.
Davis, R.B. and D.S. Anderson. 2001. Classification and distribution of freshwater
peatlands in Maine. Northeastern Naturalist 8:1-50. Gibbs, J. P. 2000. Wetland loss and biodiversity conservation. Conservation Biology
14(1):314-317. Gibbs, J.P. and S.M. Melvin. 1990. An assessment of wading birds and other wetlands
avifauna and their habitats in Maine. Final report, Maine Endangered and Nongame Wildlife Grant Program, Maine Department of Inland Fisheries and Wildlife, Augusta, Maine.
Golet, F.C. 1978. Rating the wildlife value of northeastern freshwater wetlands. Pages
63-73 in P.E. Greeson, J.R. Clark, and J.E. Clark, (eds.) Wetland functions and values: the state of our understanding. American Water Resources Association, Minneapolis, MN.
Golet, F.C. and J.S. Larson. 1974. Classification of freshwater wetlands in the glaciated
northeast. Resource publication 116. U.S. Department of Interior, Washington, D.C.
Hepinstall, J.A., S.A. Sader, W.B. Krohn, R.B. Boone, and R.I. Bartlett. 1999.
Development and testing of a vegetation and land cover map of Maine. Technical Bulletin 173. Maine Agricultural and Forest Experiment Station, University of Maine, Orono, ME.
Krohn, W.B., R.B. Boone, and S.L. Painton. 1999. Quantitative delineation and
characterization of hierarchical biophysical regions of Maine. Northeastern Naturalist 6:125-150.
Krohn, W.B., R.B. Boone, S.A. Sader, J.A. Hepinstall, S.M. Schaefer, and S.L.
Painton. 1998. The Maine Gap Analysis Project. Final report to USGS Biological
39
Resources Division, Gap Analysis Program, Moscow, ID. Maine Department of Inland Fisheries and Wildlife. 1993. Waterfowl and wading bird
habitat – general. (Unpublished). Maine Department of Inland Fisheries and Wildlife, Bangor, ME.
Venno, S.A. 1991. Integrating wildlife habitat into local planning: a handbook for Maine
communities. Miscellaneous Publication 712. Maine Agricultural Experiment Station, University of Maine, Orono, ME.
Weller, M.W. 1978. Management of freshwater marshes for wildlife. Pages 267-284 in
R.E. Good, D.F. Whigham, and R.L. Simpson (eds.) Freshwater wetlands: ecological processes and management potential. Academic Press, New York.
Zar, J.H. 1999. Biostatistical analysis, 4th edition. Prentice Hall, Upper Saddle River, NJ.
40

Appendix A. ARC/INFO commands used to delineate wading bird and waterfowl
habitats by removing open water bodies > 100 acres, wooded swamps, and uplands;
lumping remaining adjacent wetlands; adding 250 ft buffer; and removing polygons
smaller than 5 acres.
TABLES ADDITEM NWI.PAT WTLD 1 1 C SEL NWI.PAT RSEL TYPE CN ‘NONE’ MOVE ‘N’ TO WTLD NSEL RESEL TYPE CN ‘WOODED SWAMP’ MOVE ‘N’ TO WTLD RESELECT TYPE CN ‘INLAND DEEP OPEN FRESH WATER’ RESEL AREA > 404700 MOVE ‘N’ TO WTLD SEL NWI.PAT RESEL WTLD CN ‘N’ NSEL MOVE ‘Y’ TO WTLD DISSOLVE NWI NWIDIS WTLD POLY Q BUFFER NWIDIS NWIDISB # # 75 RESELECT NWIDISB NWIDELIN POLY RESELECT WTLD CN ‘Y’ ~ N Y RESELECT AREA > 20,235 ~ N N
41
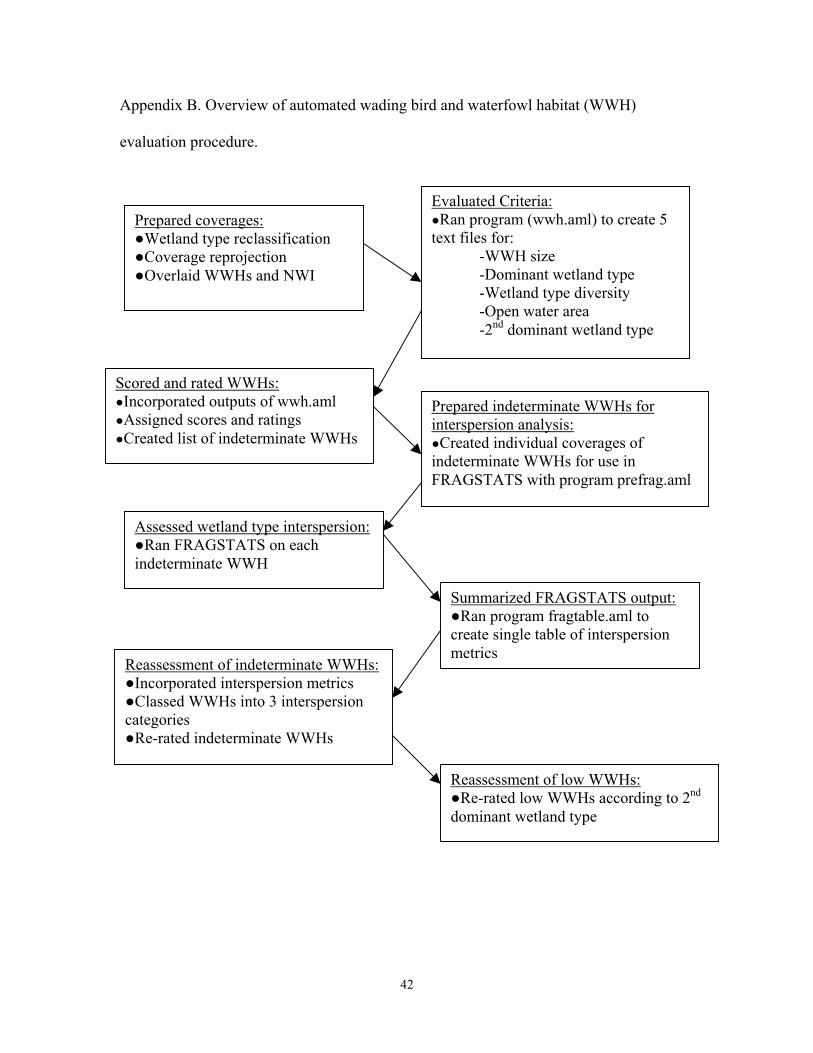
Appendix B. Overview of automated wading bird and waterfowl habitat (WWH)
evaluation procedure.
Prepared coverages: ●Wetland type reclassification ●Coverage reprojection ●Overlaid WWHs and NWI
Scored and rated WWHs: ●Incorporated outputs of wwh.aml ●Assigned scores and ratings ●Created list of indeterminate WWHs
Prepared indeterminate WWHs for interspersion analysis: ●Created individual coverages of indeterminate WWHs for use in FRAGSTATS with program prefrag.aml
Assessed wetland type interspersion:●Ran FRAGSTATS on each indeterminate WWH
Summarized FRAGSTATS output: ●Ran program fragtable.aml to create single table of interspersion metrics
Evaluated Criteria: ●Ran program (wwh.aml) to create 5 text files for:
-WWH size -Dominant wetland type -Wetland type diversity -Open water area -2nd dominant wetland type
Reassessment of indeterminate WWHs:●Incorporated interspersion metrics ●Classed WWHs into 3 interspersion categories ●Re-rated indeterminate WWHs
Reassessment of low WWHs: ●Re-rated low WWHs according to 2nd dominant wetland type
42

Appendix C. Commands used to evaluate WWHs with ARC/INFO GIS. /*Reclassed ME-NWI with GAP codes to MDIFW wetland types /* Reprojected ME-NWI coverage to same datum as WWH2000 /*Dissolved ME-NWI coverage on wetland types /*Intersected ME-NWI coverage with WWH polygons TABLES ADDITEM ME-NWI.PAT TYPE 35 35 C SEL ME-NWI.PAT RESEL GAP_INT = 14 ASEL GAP_INT = 15 ASEL GAP_INT = 16 MOVE ‘WOODED SWAMP’ TO TYPE SEL ME-NWI.PAT RESEL GAP_INT = 17 ASEL GAP_INT = 18 ASEL GAP_INT = 19 MOVE ‘SHRUB SWAMP’ TO TYPE SEL ME-NWI.PAT RESEL GAP_INT = 20 MOVE ‘INLAND DEEP FRESH MARSH’ TO TYPE SEL ME-NWI.PAT RESEL GAP_INT = 21 MOVE ‘INLAND SHALLOW FRESH MARSH’ TO TYPE SEL ME-NWI.PAT RESEL GAP_INT = 22 MOVE ‘BOG’ TO TYPE SEL ME-NWI.PAT RESEL GAP_INT = 23 MOVE ‘INLAND FRESH MEADOW’ TO TYPE SEL ME-NWI.PAT RESEL GAP_INT = 30 MOVE ‘INLAND SHALLOW OPEN FRESH WATER’ TO TYPE SEL ME-NWI.PAT RESEL GAP_INT = 31 MOVE ‘INLAND DEEP OPEN FRESH WATER’ TO TYPE SEL ME-NWI.PAT RESEL TYPE CN ‘WOODED SWAMP’ ASEL TYPE CN ‘SHRUB SWAMP’ ASEL TYPE CN ‘INLAND DEEP FRESH MARSH’ ASEL TYPE CN ‘INLAND SHALLOW FRESH MARSH’ ASEL TYPE CN ‘BOG’ ASEL TYPE CN ‘INLAND FRESH MEADOW’ ASEL TYPE CN ‘INLAND SHALLOW OPEN FRESH WATER’ ASEL TYPE CN ‘INLAND DEEP OPEN FRESH WATER’ NSEL
43

MOVE ‘NONE’ TO TYPE Q PROJECT COVER ME-NWI ME-NWI83 OUTPUT PROJECTION UTM ZONE 19 UNITS METERS SPHEROID GRS1980 DATUM NAD83 PARAMETERS END BUILD ME-NWI83 POLY TOLERANCE ME-NWI83 FUZZY 0.01 TOLERANCE WWH2000 FUZZY 0.01 DISSOLVE ME-NWI83 NWIRECLS TYPE POLY TOLERANCE NWIRECLS FUZZY 0.01 IDENTITY WWH2000 NWIRECLS WWHTYPE POLY /*Created WWH identifier.list: TABLES SEL WWH2000.PAT RESEL IDENTIFIER = 999 ASEL IDENTIFIER = 0 NSEL UNLOAD IDENTIFIER.LIST IDENTIFIER Q /*Opened Identifier.list in editing program and make sure just one record for each /*identifier. /*Ran wwh.aml to evaluate WWH wetland type diversity, dominant type, size, 2nd /*dominant type, and open /*water individually for each WWH (eliminates upland areas). /*When completed, created info table from /*aml output, and joined to WWH2000.pat: &RUN WWH.AML /*For wwh.aml, see Appendix C. TABLES DEFINE DIVINFO TYPE# 2 2 I IDENTIFIER 6 6
44

I ~ SEL DIVINFO ADD FROM DIV-TABLE ADD 0 999 0 0 ~ Q JOINITEM WWH2000.PAT DIVINFO WWH2000.PAT IDENTIFIER TABLES ADDITEM WWH2000.PAT DIV_SCORE 1 1 I SEL WWH2000.PAT RESEL TYPE# LE 1 CALCULATE DIV_SCORE = 0 NSEL RESEL TYPE# = 2 CALCULATE DIV_SCORE = 1 NSEL RESEL TYPE# = 3 CALCULATE DIV_SCORE = 2 NSEL RESEL TYPE# > 3 CALCULATE DIV_SCORE = 3 DEFINE DOMINFO IDENTIFIER 6 6 I DOM_TYPE 35 35 C SUM-AREA 8 18 F 6 ~ SEL DOMINFO ADD FROM DOM-TABLE ADD
45

0 NONE 0 999 NONE 0 ~ Q JOINITEM WWH2000.PAT DOMINFO WWH2000.PAT IDENTIFIER TABLES ADDITEM WWH2000.PAT DOM_SCORE 1 1 I SEL WWH2000.PAT RESEL DOM_TYPE CN ‘INLAND SHALLOW FRESH MARSH’ ASEL DOM_TYPE CN ‘INLAND DEEP FRESH MARSH’ CALCULATE DOM_SCORE = 6 NSEL RESEL DOM_TYPE CN ‘INLAND SHALLOW OPEN FRESH WATER’ CALCULATE DOM_SCORE = 4 NSEL RESEL DOM_TYPE CN ‘BOG’ ASEL DOM_TYPE CN ‘INLAND FRESH MEADOW’ ASEL DOM_TYPE CN ‘SHRUB SWAMP’ CALCULATE DOM_SCORE = 2 NSEL RESEL DOM_TYPE CN ‘WOODED SWAMP’ ASEL DOM_TYPE CN ‘INLAND DEEP OPEN FRESH WATER’ ASEL DOM_TYPE CN ‘NONE’ CALCULATE DOM_SCORE = 0 DEFINE AREAINFO IDENTIFIER 6 6 I WWH_AREA 8 18 F 5 ~ ADD FROM AREA-TABLE ADD 0 0 999 0
46
~ Q JOINITEM WWH2000.PAT AREAINFO WWH2000.PAT IDENTIFIER TABLES ADDITEM WWH2000.PAT AREA_SCORE 1 1 I SEL WWH2000.PAT RESEL WWH_AREA > 404700 CALCULATE AREA_SCORE = 3 NSEL RESEL WWH_AREA > 40469 RESEL WWH_AREA < 404701 CALCULATE AREA_SCORE = 2 NSEL RESEL WWH_AREA < 40470 CALCULATE AREA_SCORE = 1 /* Assigned ratings. Added diversity, dominance, and area score to determine rating: ADDITEM WWH2000.PAT DDA_SCORE 2 2 I SEL WWH2000.PAT CALCULATE DDA_SCORE = DOM_SCORE + DIV_SCORE + AREA_SCORE ADDITEM WWH2000.PAT HRATING 16 16 C SEL WWH2000.PAT RESEL DDA_SCORE > 9 MOVE ‘HIGH’ TO HRATING NSEL RESEL DDA_SCORE > 7 MOVE ‘MODERATE’ TO HRATING NSEL RESEL DDA_SCORE > 4 RESEL DDA_SCORE < 8 MOVE ‘INDETERMINATE’ TO HRATING NSEL RESEL DDA_SCORE < 5 MOVE ‘LOW’ TO HRATING /* % Open Water Analysis DEFINE OPWAT-INFO IDENTIFIER 6 6 I OPENWATER-AREA 8 18 F 5
47

~ SEL OPWAT-INFO ADD FROM OPENWATER-TABLE SEL OPWAT-INFO SORT IDENTIFIER Q JOINITEM WWH2000.PAT OPWAT-INFO WWH2000.PAT IDENTIFIER TABLES ADDITEM WWH2000.PAT PEROPWAT 8 8 F 4 SEL WWH2000.PAT CALCULATE PEROPWAT = OPENWATER-AREA / WWH_AREA ADDITEM WWH2000.PAT HRATING2 16 16 C SEL WWH2000.PAT RESEL HRATING CN ‘INDETERMINATE’ NSEL MOVE HRATING TO HRATING2 SEL WWH2000D.PAT RESEL HRATING CN ‘INDETERMINATE’ RESEL PEROPWAT = 0 MOVE ‘LOW’ TO HRATING2 /*Pulled out WWHs with Indeterminate rankings and >0% open water for interspersion /*analysis /*Created text file listing Indeterminate WWH2000-ids with >0% openwater: SEL WWH2000.PAT RESEL HRATING CN ‘INDETERMINATE’ RESEL PEROPWAT > 0 UNLOAD INDETERMINATE.LIST IDENTIFIER DELIMITED /*Created individual coverages of each Indeterminate WWH for analysis in /*FRAGSTATS: &RUN PREFRAG.AML /* Prefrag.aml provided in Appendix D. /*When completed, ran FRAGSTATS on all coverages: &run /usr/people/heather/fragstats/pro/code/fs_batch run_job wwh_* TYPE METERS 'r' # # # # # CLASS LANDSCAPE N Y /*Combined all output tables into one: DIR *LAND /*Highlighted, copied, and saved with text editor as table.list. /*Removed quotes from identifiers in fragresults Q &RUN FRAGTABLE.AML /* Fragtable.aml provided in Appendix E.
48

TABLES SEL WWH2000.PAT RESEL HRATING2 CN ‘INDETERMINATE’ NSEL UNLOAD FRAGTABLE IDENTIFIER DELIMITED DEFINE FRAGTABLE2 IDENTIFIER 6 6 I ~ SEL FRAGTABLE2 ADD FROM FRAGTABLE ADDITEM FRAGTABLE2 IJI 8 8 N 2 ADDITEM FRAGTABLE2 TE_WGT 16 16 N 3 SEL FRAGTABLE2 UNLOAD FRAGRESULTS DELIMITED DEFINE FRAGRESULTS2 IDENTIFIER 6 6 I IJI 8 8 N 2 TE_WGT 16 16 N 3 ~ SEL FRAGRESULTS2 ADD FROM FRAGRESULTS Q JOINITEM WWH2000.PAT FRAGRESULTS2 WWH2000.PAT IDENTIFIER /* Reassigned ratings to Indeterminate WWHs: ADDITEM WWH2000.PAT IJI*TE_WGT 16 16 N5 SEL WWH2000.PAT CALCULATE IJI*TE_WGT = IJI * TE_WGT /*Removed outliers (n = 15, IJI*TE_WGT > 1000000) and used ArcView to classify data /*with Jenk’s optimization method (natural breaks):
49

/*Category 1: 0-88859 (N = 637) /*Category 2: 88860-358553 (N = 496) /*Category 3: 358554 –1000000 (N = 87) TABLES ADDITEM WWH2000.PAT INT_CAT 1 1 I SEL WWH2000.PAT RESEL HRATING2 CN ‘INDETERMINATE’ RESEL IJI*TE_WGT < 88000 CALCULATE INT_CAT = 1 SEL WWH2000.PAT RESEL HRATING2 CN ‘INDETERMINATE’ RESEL IJI*TE_WGT < 350000 RESEL IJI*TE_WGT > 88000 CALCULATE INT_CAT = 2 SEL WWH2000.PAT RESEL HRATING2 CN ‘INDETERMINATE’ RESEL IJI*TE_WGT > 350000 CALCULATE INT_CAT = 3 ADDITEM WWH2000.PAT HRATING3 16 16 C SEL WWH2000.PAT RESEL HRATING2 CN ‘INDETERMINATE’ NSEL MOVE HRATING2 TO HRATING3 SEL WWH2000.PAT RESEL HRATING2 CN ‘INDETERMINATE’ RESEL INT_CAT = 1 RESEL PEROPWAT < 0.35 MOVE ‘LOW’ TO HRATING3 SEL WWH2000.PAT RESEL HRATING2 CN ‘INDETERMINATE’ RESEL INT_CAT = 1 RESEL PEROPWAT GE 0.35 RESEL PEROPWAT LE 0.65 MOVE ‘MODERATE’ TO HRATING3 SEL WWH2000.PAT RESEL HRATING2 CN ‘INDETERMINATE’ RESEL INT_CAT = 1 RESEL PEROPWAT > 0.65 MOVE ‘LOW’ TO HRATING3 SEL WWH2000.PAT RESEL HRATING2 CN ‘INDETERMINATE’ RESEL INT_CAT = 2 MOVE ‘MODERATE’ TO HRATING3 SEL WWH2000.PAT RESEL HRATING2 CN ‘INDETERMINATE’
50

RESEL INT_CAT = 3 RESEL PEROPWAT < 0.35 MOVE ‘MODERATE’ TO HRATING3 SEL WWH2000.PAT RESEL HRATING2 CN ‘INDETERMINATE’ RESEL INT_CAT = 3 RESEL PEROPWAT GE 0.35 RESEL PEROPWAT LE 0.65 MOVE ‘HIGH’ TO HRATING3 SEL WWH2000.PAT RESEL HRATING2 CN ‘INDETERMINATE’ RESEL INT_CAT = 3 RESEL PEROPWAT > 0.65 MOVE ‘MODERATE’ TO HRATING3 /* Incorporated 2nd dominant type: DEFINE DOMINFO2 IDENTIFIER 6 6 I DOMTYPE2 36 36 C DOMTYPE2AREA 16 16 N 6 SEL DOMINFO2 ADD FROM DOM2-TABLE SEL DOMINFO2 ADD 999 NONE 0 0 NONE 0 Q JOINITEM WWH2000.PAT DOMINFO2 WWH2000.PAT IDENTIFIER TABLES ADDITEM WWH2000.PAT DOMTYPE2PER SEL WWH2000.PAT CALCULATE DOMTYPE2PER = DOMTYPE2AREA / WWH_AREA
51

ADDITEM WWH2000.PAT HRATING4 16 16 C SEL WWH2000.PAT RESEL DOMTYPE2 CN ‘INLAND DEEP FRESH MARSH’ ASEL DOMTYPE2 CN ‘INLAND SHALLOW FRESH MARSH’ ASEL DOMTYPE2 CN ‘INLAND SHALLOW OPEN FRESH WATER’ RESEL DOMTYPE2PER GE 0.2 RESEL HRATING3 CN ‘LOW’ MOVE ‘MODERATE’ TO HRATING4
52

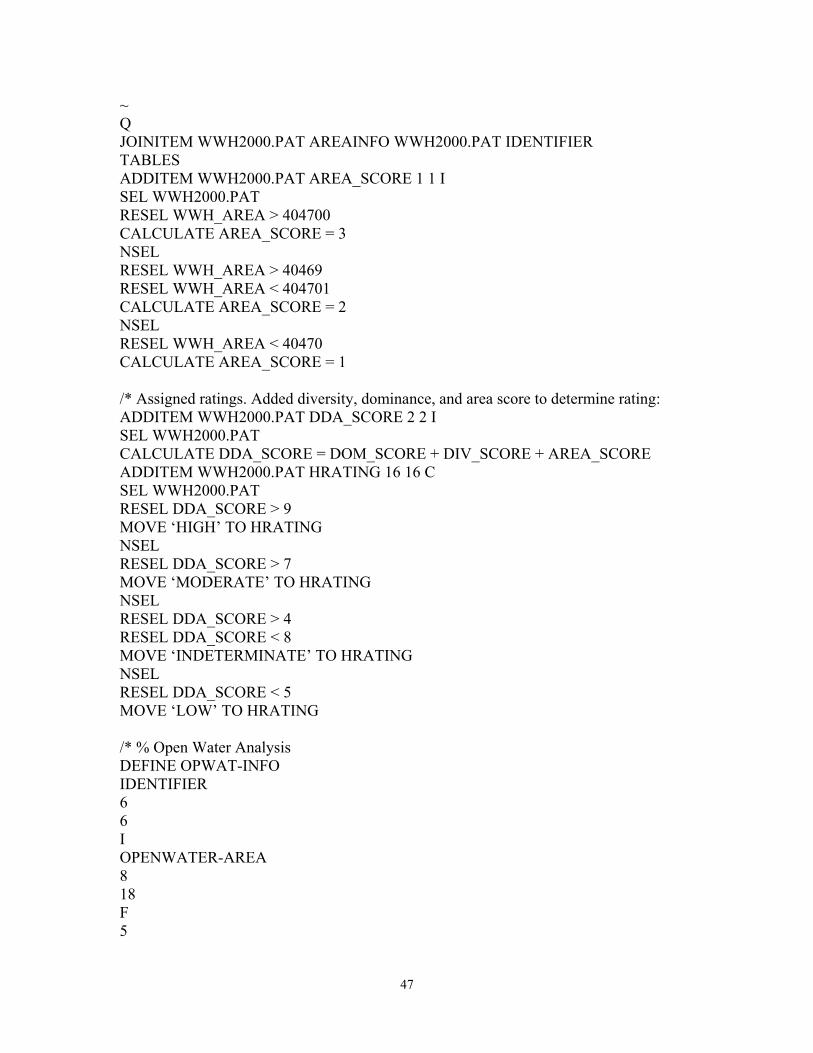
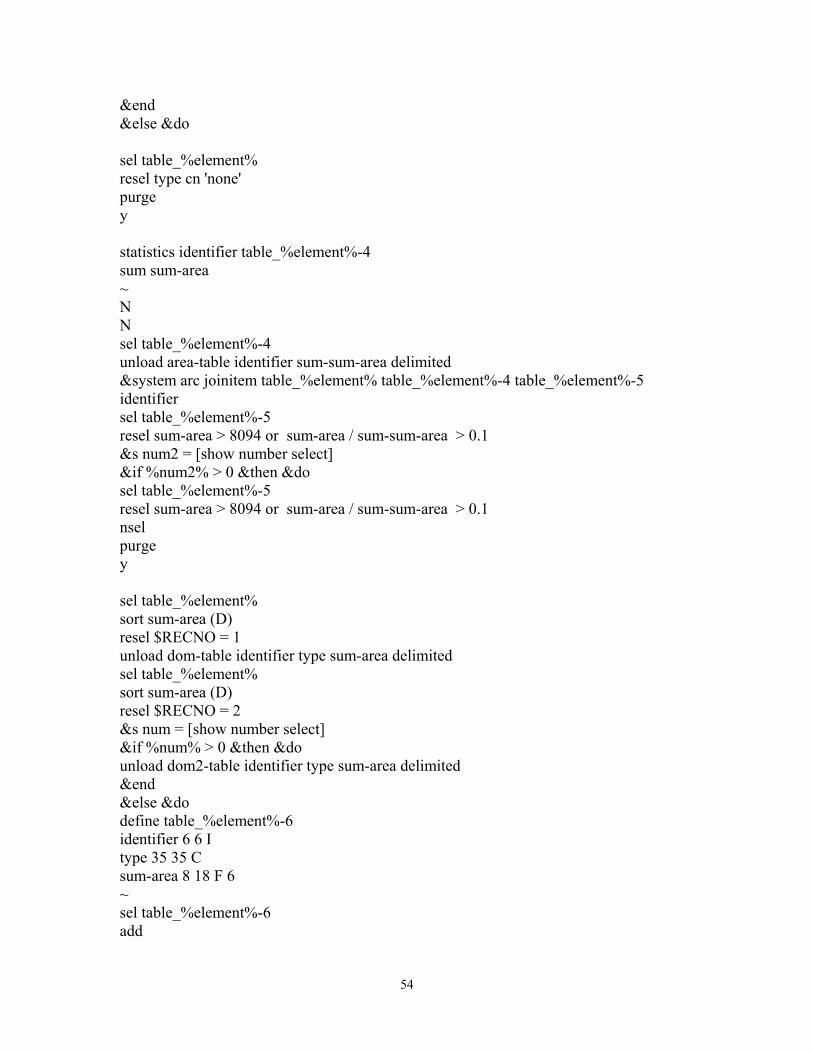
Appendix D. Program used to automate WWH evaluation process. The program, called
WWH.aml, is written in ARC Macro Language (AML) and evaluates dominant wetland
type, habitat size, wetland type diversity, percent open water, and second dominant
wetland type for each WWH listed in the text file identifier.list. The item ‘sum-
frequency’ refers to wetland type diversity. The program creates 5 text files: div-table,
dom-table, area-table, dom2-table, and openwater-table.
&echo &on &sv listfile = identifier.list &sv fileunit = [open %listfile% openstat -read] Tables &do &until %readstat% = 102 &sv element = [read %fileunit% readstat] &if %readstat% eq 0 &then &do &end sel wwhtype.pat resel identifier = %element% statistics type table_%element% sum area ~ N N additem table_%element% identifier 6 6 I sel table_%element% calculate identifier = %element% resel type cn 'none' nsel &s num = [show number select] &if %num% = 0 &then &do additem table_%element% sum-frequency 8 18 F 6 calculate sum-frequency = 0 calculate sum-area = 0 sel table_%element% resel $RECNO = 1 unload area-table identifier sum-area delimited unload div-table sum-frequency identifier delimited unload dom-table identifier type sum-area delimited unload dom2-table identifier type sum-area delimited unload openwater-table identifier sum-area delimited
53
&end &else &do sel table_%element% resel type cn 'none' purge y statistics identifier table_%element%-4 sum sum-area ~ N N sel table_%element%-4 unload area-table identifier sum-sum-area delimited &system arc joinitem table_%element% table_%element%-4 table_%element%-5 identifier sel table_%element%-5 resel sum-area > 8094 or sum-area / sum-sum-area > 0.1 &s num2 = [show number select] &if %num2% > 0 &then &do sel table_%element%-5 resel sum-area > 8094 or sum-area / sum-sum-area > 0.1 nsel purge y sel table_%element% sort sum-area (D) resel $RECNO = 1 unload dom-table identifier type sum-area delimited sel table_%element% sort sum-area (D) resel $RECNO = 2 &s num = [show number select] &if %num% > 0 &then &do unload dom2-table identifier type sum-area delimited &end &else &do define table_%element%-6 identifier 6 6 I type 35 35 C sum-area 8 18 F 6 ~ sel table_%element%-6 add
54
%element% none 0 ~ sel table_%element%-6 unload dom2-table identifier type sum-area delimited &end sel table_%element% resel type cn 'inland deep fresh marsh' asel type cn 'inland shallow open fresh water' asel type cn 'inland deep open fresh water' &s num = [show number select] &if %num% = 0 &then &do additem table_%element% openwater-area 8 18 f 5 sel table_%element% add no-open 0 0 %element% 0 ~ sel table_%element% resel type cn 'no-open' unload openwater-table identifier openwater-area delimited &end &else &do statistics identifier opwat-table_%element% sum sum-area ~ N N sel opwat-table_%element% unload openwater-table identifier sum-sum-area delimited &end sel table_%element%-5 statistics type table_%element%-2 min frequency ~ N N sel table_%element%-2 statistics frequency table_%element%-3
55

sum frequency ~ N N additem table_%element%-3 identifier 6 6 I dropitem table_%element%-3 frequency sel table_%element%-3 calculate identifier = %element% unload div-table sum-frequency identifier delimited kill table_%element%* noprompt kill opwat-table_%element%* noprompt &end &end &end &return
56
Appendix E. Program used to prepare indeterminate indeterminate WWHs for
interspersion analysis. The program, written in ARC Macro Language (AML), and
called Prefrag.aml, creates individual coverages of ‘indeterminate’ WWHs for use in
FRAGSTATS interspersion analysis and requires a list of identifiers associated with the
indeterminate WWHs (identifier.list).
&echo &on &sv listfile = indeterminate.list &sv fileunit = [open %listfile% openstat -read] &do &until %readstat% = 102 &sv element = [read %fileunit% readstat] &if %readstat% eq 0 &then &do &end reselect wwhtype wwh_%element% poly resel identifier = %element% ~ n n &end &return
57
Appendix F. Program used to summarize interspersion analysis results. The program,
written in ARC Macro Language (AML), and called Fragtable.aml, creates a single table
of wetland interspersion metrics from individual tables created for each ‘indeterminate’
WWH by FRAGSTATS. Requires list of output tables from FRAGSTATS analysis
(table.list).
&echo &on &sv listfile = table.list &sv fileunit = [open %listfile% openstat -read] tables &do &until %readstat% = 102 &sv element = [read %fileunit% readstat] &if %readstat% eq 0 &then &do &end sel %element% unload fragresults LID IJI TE_WGT delimited &end &return
58
Appendix G. List of species used in comparison of wading bird and waterfowl habitat
ratings with Maine Gap Analysis Program species occurrence predictions. Footnotes
refer to species groupings used in the comparisons.
Birds Common loon (Gavia immer)c
Pied-billed grebe (Podilymbus podiceps)b,c
American bittern (Botaurus lentiginosus)a,b,c Least bittern (Ixobrychus exilis)a,b,c Great blue heron (Ardea herodias)a,b,c Snowy egret (Egretta thula)a,b,c Little blue heron (Egretta caerulea)a,b,c Cattle egret (Bubulcus ibis)a,b,c Green heron (Butorides virescens)c Black-crowned night-heron (Nycticorax nycticorax)a,b,c Glossy ibis (Plegadis falcinellus)a,b,c Canada goose (Branta canadensis)a,b,c Wood duck (Aix sponsa)a,b,c Green-winged teal (Anas crecca)a,b,c Mallard (Anas platyrhynchos)a,b,c American black duck (Anas rubripes)a,b,c Blue-winged teal (Anas discors)a,b,c American wigeon (Anas americana)a,b,c Ring-necked duck (Aythya collaris)a,b,c Common goldeneye (Bucephala clangula)a,b,c Hooded merganser (Lophodytes cucullatus)a,b,c Common merganser (Mergus merganser)a,b,c Red-breasted merganser (Mergus serrator)a,b,c Turkey vulture (Cathrates aura)c Osprey (Pandion haliaetus)b,c Bald eagle (Haliaeetus leucocephalus)c Northern harrier (Circus cyaneus)b,c Sharp-shinned hawk (Accipiter striatus)c Cooper’s hawk (Accipiter cooperii)c Red-shouldered hawk (Buteo lineatus)c Red-tailed hawk (Buteo jamaicensis)c Golden eagle (Aquila chrysaetos)c American kestrel (Falco sparverius)c Merlin (Falco columbarius)c Peregrine falcon (Falco peregrinus)c Spruce grouse (Falcipennis canadensis)c Ruffed grouse (Bonasa umbellus)c Wild turkey (Meleagris gallopavo)c Virginia rail (Rallus limicola)a,b.c
59

Sora (Porzana carolina)a,b,c Yellow rail (Coturnicops noveboracensis)a,b,c Common moorhen (Gallinula chloropus)a,b,c American coot (Fulica americana)a,b,c Killdeer (Charadrius vociferus)c Spotted sandpiper (Actitis macularia)c Upland sandpiper (Bartramia longicauda)c Common snipe (Gallinago gallinago)b,c American woodcock (Scolopax minor)c Herring gull (Larus argentatus)c Great black-backed gull (Larus marinus)c Common tern (Sterna hirundo)c Black tern (Chilidonias niger)b,c Mourning dove (Zenaida macroura)c Black-billed cuckoo (Coccyzus erythropthalmus)c Yellow-billed cuckoo (Coccyzus americanus)c Great horned owl (Bubo virginianus)c Barred owl (Strix varia)c Long-eared owl (Asio otus)c Short-eared owl (Asio flammeus)c Northern saw-whet owl (Aegolius acadicus)c Common nighthawk (Chordeiles minor)c Whip-poor-will (Caprimulgus vociferus)c Chimney swift (Chaetura pelagica)c Ruby-throated hummingbird (Archilochus colubris)c Belted kingfisher (Ceryle alcyon)c Yellow-bellied sapsucker (Sphyrapicus varius)c Downy woodpecker (Picoides pubescens)c Hairy woodpecker (Picoides villosus)c Three-toed woodpecker (Picoides tridactylus)c Black-backed woodpecker (Picoides arcticus)c Northern flicker (Colaptes auratus)c Pileated woodpecker (Dryocopus pileatus)c Olive-sided flycatcher (Contopus cooperi)c Eastern wood-pewee (Contopus virens)c Yellow-bellied flycatcher (Empidonax flaviventris)b,c Alder flycatcher (Empidonax alnorum)b,c Willow flycatcher (Empidonax traillii)c Least flycatcher (Empidonax minimus)c Eastern phoebe (Sayornis phoebe)c Great crested flycatcher (Myiarchus crinitus)c Eastern kingbird (Tyrannus tyrannus)c Purple martin (Progne subis)c Tree swallow (Tachycineta bicolor)c Northern rough-winged swallow (Stelgidopteryx serripennis)c Bank swallow (Riparia riparia)c
60

Cliff swallow (Petrochelidon pyrrhonota)c Barn swallow (Hirundo rustica)c Gray jay (Perisoreus canadensis)c Blue jay (Cyanocitta cristata)c American crow (Corvus brachyrhynchos)c Common raven (Corvus corax)c Black-capped chickadee (Parus atricapillus)c Boreal chickadee (Parus hudsonicus)c Tufted titmouse (Parus bicolor)c Red-breasted nuthatch (Sitta candensis)c White-breasted nuthatch (Sitta carolinensis) c Brown creeper (Certhia americana) c House wren (Troglodytes aedon) c Winter wren (Troglodytes troglodytes) c Marsh wren (Cistothorus palustris)b,c Sedge wren (Cistothorus platensis) c Carolina wren (Thryothorus ludovicianus) c Golden-crowned kinglet (Regulus satrapa) c Ruby-crowned kinglet (Regulus calendula) c Blue-gray gnatcatcher (Polioptila caerulea) c Eastern bluebird (Sialia sialis) c Veery (Catharus fuscescens) c Swainson’s thrush (Catharus ustulatus) c Hermit thrush (Catharus guttatus) c Wood thrush (Hylocichla mustelina) c American robin (Turdus migratorius) c Gray catbird (Dumetella carolinensis) c Northern mockingbird (Mimus polyglottus) c Brown thrasher (Toxostoma rufum) c Cedar waxwing (Bombycilla cedrorum) c Blue-headed vireo (Vireo solitarius) c Yellow-throated vireo (Vireo flavifrons) c Warbling vireo (Vireo gilvus) c Philadelphia vireo (Vireo philadelphicus) c Red-eyed vireo (Vireo olivaceus) c Blue-winged warbler (Vermivora pinus) c Tennessee warbler (Vermivora peregrina) c Nashville warbler (Vermivora ruficapilla) c Northern parula (Parula americana) c Yellow warbler (Dendroica petechia) c Chestnut-sided warbler (Dendroica pensylvanica) c Magnolia warbler (Dendroica magnolia) c Cape May warbler (Dendroica tigrina) c Black-throated blue warbler (Dendroica caerulescens) c Yellow-rumped warbler (Dendroica coronata) c Black-throated green warbler (Dendroica virens) c
61

Blackburnian warbler (Dendroica fusca) c Pine warbler (Dendroica pinus) c Prairie warbler (Dendroica discolor) c Palm warbler (Dendroica palmarum)b,c Bay-breasted warbler (Dendroica castanea) c Blackpoll warbler (Dendroica striata) c Black-and-white warbler (Mniotilta varia) c American redstart (Setophaga ruticilla) c Ovenbird (Seiurus aurocapillus) c Northern waterthrush (Seiurus noveboracensis)b,c Louisiana waterthrush (Seiurus motacilla) c Mourning warbler (Oporornis philadelphia) c Common yellowthroat (Geothlypis trichas) c Wilson’s warbler (Wilsonia pusilla) c Canada warbler (Wilsonia canadensis) c Scarlet tanager (Piranga olivacea) c Northern cardinal (Cardinalis cardinalis) c Rose-breasted grosbeak (Pheucticus ludovicianus) c Indigo bunting (Passerina cyanea) c Chipping sparrow (Spizella passerina) c Vesper sparrow (Pooecetes gramineus) c Savannah sparrow (Passerculus sandwichensis) c Saltmarsh sharp-tailed sparrow (Ammodramys caudacutus) c Nelson’s sharp-tailed sparrow (Ammodramus nelsoni) c Fox sparrow (Passerella iliaca) c Song sparrow (Melospiza melodia) c Lincoln’s sparrow (Melospiza lincolnii) c Swamp sparrow (Melospiza georgiana)b,c White-throated sparrow (Zonotrichia albicollis) c Dark-eyed junco (Junco hyemalis) c Bobolink (Dolichonyx oryzivorus) c Red-winged blackbird (Agelaius phoeniceus)b,c Eastern meadowlark (Sturnella magna) c Rusty blackbird (Euphagus carolinus)b,c Common grackle (Quiscalus quiscala) c Brown-headed cowbird (Molothrus ater) c Baltimore oriole (Icterus galbula) c Pine grosbeak (Pinicola enucleator) c Purple finch (Carpodacus purpureus) c Red crossbill (Loxia curvirostra) c White-winged crossbill (Loxia leucoptera) c Pine siskin (Carduelis pinus) c American goldfinch (Carduelis tristis) c Evening grosbeak (Coccothraustes vespertinus) c
62

Amphibians and Reptiles Blue spotted salamander (Ambystoma laterale)b,c Spotted salamander (Ambystoma maculatum)b,c Eastern newt (Notophthalmus viridescens)b,c Northern dusky salamander (Desmognathus fuscus) c Northern two-lined salamander (Eurycea bislineata) c Spring salamander (Gyrinophilus porphyriticus)b,c Four-toed salamander (Hemidactylium scutatum)b,c American toad (Bufo americanus)b,c Gray treefrog (Hyla versicolor)b,c Spring peeper (Pseudacris crucifer)b,c Bullfrog (Rana catesbeiana)b,c Green frog (Rana clamitans)b,c Pickerel frog (Rana palustris)b,c Northern leopard frog (Rana pipiens)b,c Mink frog (Rana septentrionalis)b,c Wood frog (Rana sylvatica)b,c Common snapping turtle (Chelydra serpentina)b,c Common musk turtle (Sternotherus odoratus)b,c Painted turtle (Chrysemys picta)b,c Spotted turtle (Clemmys guttata)b,c Wood turtle (Clemmys insculpta)b,c Blanding’s turtle (Emydoidea blandingii)b,c Eastern box turtle (Terrapene carolina)b,c Racer (Coluber constrictor) c Milk snake (Lampropeltis triangulum) c Northern water snake (Nerodia sipedon)b,c Smooth green snake (Liochlorophis vernalis) c Brown snake (Storeria dekayi) c Redbelly snake (Storeria occipitomaculata) c Eastern ribbon snake (Thamnophis sauritus)b,c Common garter snake (Thamnophis sirtalis) c Mammals Virginia opossum (Didelphis virginiana) c Masked shrew (Sorex cinereus) c Water shrew (Sorex palustris)b,c Smoky shrew (Sorex fumeus) c Long-tailed shrew (Sorex dispar) c Pygmy shrew (Sorex hoyi)b,c Northern short-tailed shrew (Blarina brevicauda) c Star-nosed mole (Condylura cristata)b,c Little brown myotis (Myotis lucifugus) c Northern myotis (Myotis septentrionalis) c Eastern small-footed myotis (Myotis leibii) c Silver-haired bat (Lasionycteris noctivagans)b,c
63
Eastern pipistrelle (Pipistrellus subflavus)b,c Big brown bat (Eptesicus fuscus) c Eastern red bat (Lasiurus borealis)c Hoary bat (Lasiurus cinereus) c New England cottontail (Sylvilagus transitionalis) c Snowshoe hare (Lepus americanus) c Eastern gray squirrel (Sciurus carolinensis) c Red squirrel (Tamiasciurus hudsonicus) c Southern flying squirrel (Glaucomys volans) c Northern flying squirrel (Glaucomys sabrinus) c American beaver (Castor candensis)b,c Deer mouse (Peromyscus maniculatus) c White-footed mouse (Peromyscus leucopus) c Southern red-backed vole (Clethrionomys gapperi) c Meadow vole (Microtus pennsylvanicus) c Rock vole (Microtus chrotorrhinus) c Woodland vole (Microtus pinetorum) c Muskrat (Ondatra zibethicus) b,c Southern bog lemming (Synaptomys cooperi) b,c Northern bog lemming (Synaptomys borealis) b,c Meadow jumping mouse (Zapus hudsonius) c Woodland jumping mouse (Napaeozapus insignis) c Common porcupine (Erethizon dorsatum) c Coyote (Canis latrans) c Red fox (Vulpes vulpes) c Common gray fox (Urocyon cinereoargenteus) c Black bear (Ursus americanus) c Common raccoon (Procyon lotor) b,c American marten (Martes americana) c Fisher (Martes pennanti) c Ermine (Mustela erminea) c Long-tailed weasel (Mustela frenata) c Mink (Mustela vison) b,c Striped skunk (Mephitis mephitis) c Northern river otter (Lutra canadensis)b,c Lynx (Lynx canadensis) c Bobcat (Lynx rufus) c White-tailed deer (Odocoileus virginianus) c Moose (Alces alces) b,c
aSpecies included in wading birds and waterfowl analysis. bSpecies included in wetland-associated non-fish vertebrates analysis. cSpecies included in wetland-using non-fish vertebrates analysis.
64

65