Embed Size (px)
Citation preview

Burnet
Williamson
TravisBlanco
Hays
Caldwell
Bastrop
Texas
Analysis Trilogy
Temporal indicators Spatial indicators Human indicators
Potential for IgnitionPotential for
Combustibility/Propagation Potential Rami�cation
1. Current & Historical Climate Data
2. Current & Historical Fire Occurrences Data
3. Current & Historical Emergency Calls Data
Precipitation/drought eventsLightning strikesWind speed & direction
1. Exhisting Fuel & Topographic Data
Fuel typesSlope, Elevations, Aspect
2. Fire Suppression Capability
Initial dispatch locationsSpatial morphology
Emergency response timeFire containmentDry hydrants
Population centersUrban interfaceCritical infrastructureEvacuation potential
1. Exhisting Data on Structure/Infrastructure
380 Total Points: 38% 420 Total Points: 42% 200 Total Points: 20%
These are identi�ed in collaboration with local community and AFD
24 au Spring 2011 esri.com
Tools for wildfire prediction and mitigationBy Ahmed Abukhater, Esri Global Industry Manager for Community Development
Wildfires are one of the most notoriously de-structive and devastating natural hazards in the United States. Planners and policy makers need tools that enable them to assign land uses and identify community assets to avoid wildfire hazards in the communities most suscepti-ble to natural and man-made disasters. GIS can provide these effective planning tools and insights to prepare for natural and man-made disasters and mitigate their impact. Both policy makers and the community at large can plan for pre- and postdisaster re-sponse and mitigation efforts. Numerous wildfire methodologies pri-marily focus on predicting where fire is most likely to occur based on historic data and spatial characteristics of the environment. What’s missing is knowledge of the impact of wildfire on vulnerable populations and criti-cal infrastructure. To that end, predicting fire hazards by modeling areas that are most vulnerable to fire and measuring the impact on the community’s assets and human and physical resources is both important and warranted to mitigate wildfire hazards and associated costs and fatalities.
Improving emergency response in areas most susceptible to frequent fires—based on data interpolation and prior delineation of these areas—can help save lives and pre-cious resources. Given the importance of forest-urban interface fire prediction and mitigation, this article describes how to conduct a community risk assessment from a planning point of view and proposes a GIS-based multiple-criteria evaluation (MCE) framework for analyzing, predicting, and ul-timately mitigating the impact of wildfires.
Assessing Wildfire ImpactThis article references a study for develop-ing a systematic methodology for assess-ment of wildfire impact on a community’s critical assets, including human capital and
infrastructure assets. In particular, this study conducted spatial modeling and rep-resentation of wildfire hazard analysis and spatiotemporal interpolation of communi-ties at risk; developed a standardized plan-ning support system (PSS) for methodology of GIS-based regional molding of Wildfire Susceptibility Index (WFSI) for planning and policy making; identified areas at risk and vulnerable communities; and provided better assessment tools and capabilities for future land-use planning and policy making. The study area was Travis County, Texas. With nearly a million residents, the county encompasses the cities of Austin, Jonestown, and Round Rock. It includes major popula-tion, business, and educational hubs such as the University of Texas at Austin.
GIS-Based Community Risk Assessment
The study area was Travis County, Texas.
The analysis trilogy: factors used for the analysis

Features
Wild�re Susceptibility Index (WFSI)
Fire Propensity Index
Fire Behavior/Spatial Diffusion Index
Sensitive Areas Contingency Valuation Index
Risk Analysis Hazard Analysis Potential Rami�cation
Fire Ignition Risk
Lightning strikeshistorical occurrences
(long/lat)
Lightning density
Fire historicaloccurrences
(long/lat)Fire density/probability
TransportationInitiated �re risk
Major roadsdensity
Ignition riskpropensity
Transportation network
Weight criteriaand overlay
Collaboration/input from AFD
Community Risk Analysis
Spatio-temporalinterpolation of
Communities at Risk(3D Modeling + Time)
Weighing criteriaand overlay
Collaboration/input from AFD
1. Fire Combustibilityand Propagation
Meteorological andHydrogeomorphological
Index (MHI)
Wind speed& direction
Canopycover
Precipitation
Crown �repotential
Vegetativecoverage
Vegetation /surface fuels
Forestdensity
Elevation/Ridge line
Stops
Aspect
2. Fire SuppressionCapability
Initial dispatchlocations density
Initial dispatchlocations
Major roadnetwork
DEM Terrainanalysis
Rivers andstreams
Major roadsand highways
Major roadnetwork
Water bodies(water withdrawal)
Emergency response time
Fire containment
Dry hydrants
1. Human Capital
Population density
Census data
Propensity of human casualty
2. Critical Infrastructure
Structural damage andpower outage probability
Emergency callshistorical occurrences
(long/lat)
Current land use
Wildland UrbanInterface (WUI)
Zones
Proximity to urbaninterface
Density
Parks
Historicallandmarks
Urbanizedareas
Facilities
Schools
Hospitals
Proximity
3. Evacuation Potential
Density
Proximity
Bridges
Road access
Ignition RiskPropensity
Prox
imity
Structural damage density
25esri.com Spring 2011 au
Geospatial Methods and AnalysesThis analysis is composed of three key indi-cators: temporal, spatial, and human. These represent the potential for ignition, fire com-bustibility, and propagation (or how fast the fire spreads) and possible ramifications for the community. The analysis captures not only the risk and probability of wildfires but also the magnitude of impact on the community. The potential for ignition is measured by the temporal indicators including current and historical climate data about precipita-tion, drought events, lightning strikes, wind speed and direction, current and historical fire occurrence data, and current and his-torical emergency calls data. The potential for fire combustibility and propagation is measured by a set of spatial indicators including existing fuel and topo-graphic data (such as fuel types, slope, eleva-tion, and aspect) and fire suppression capa-bility (such as initial dispatch locations and spatial morphology data about emergency response time, fire containment, and dry hydrants). The potential ramifications for the com-munity are measured by existing data on population centers, urban interface, critical infrastructure, and evacuation potential. A community survey was conducted, and several meetings with the local community were held to collaboratively determine the importance of each of these indicators in the analysis. The relative importance for these factors was represented by the weights as-signed to them. This analysis trilogy translates into a
A conceptual model for the Wildfire Susceptibility Index (WFSI) methodology

RiskStatement
ContributingFactors
DerivativeData
TriggerEvent
ValuationMethodology
ResponseStrategy
Firenadopotential
Elevation
Slope
Aspect (wind direction)
Fuel
DEM
DEM
DEM
Vegetativecoverage
Firepropagation
Fireirruption
Firepropagation
Fireirruption
Very low (1): 93-170mLow (2): 170-230mModerate (3): 230-290mHigh (4): 290-350mVery high (5): 350-483m
Very low (1): 0-5%Low (2): 5-15%Moderate (3): 15-30%High (4): 30-45%Very high (5): 45-133%
Very low (1): N, �atLow (2): NE, NWModerate (3): E, WHigh (4): SE, SWVery high (5): S
- Very low- Fire containment: creating natural and arti�cial �re breaks (such as rivers and highways)- Dumping water from the sky
Very low (1):FBPS 97, 98, 99Low (2): FBPS 96 Moderate (3): FBPS 10, 11, 12 High (4): FBPS 6, 7, 8, and 9 Very high (5): FBPS 1, 2, 3, 4, 5
Improving structural �re safety:- Using �re resistant materials- Exits clearly marked- Entrances ate not blocked by any �ammable materials- Access for a large �re truck- Reducing vegetation encroachment around buildings
Very low (1): < 5 minLow (2): 5-8 minModerate (3): 8-10 minHigh (4): 10-15 minVery high (5): > 15 min
Early warning system:- Local of�cials issue burn bans- Issuance of red �ag warnings- Reverse 911 calls for residents (alerting to evacuate)
Fireirruption
Road accessand initialdispatchlocations
Response timeFire spread& damage
Examples of contributing factors
GIS layers used for the analysis
26 au Spring 2011 esri.com
conceptual diagram that includes risk analy- sis, hazard analysis, and potential ramifica-tions to create a fire propensity index, fire behavior/spatial diffusion index, and sensi-tive areas contingency valuation index. Each of these three pillars is inclusive of several factors and layers. Wildfire can cause a blazing inferno with a potential of speed ranging from 30 to 40 miles per hour, which causes the fire to spread rapidly, creating “firenado” potential. Weather conditions, surface fuel, and topography, among other factors, can contribute to this situation. For Travis County, Texas, weather condi-tions were characterized as a severe drought pattern. The area has experienced drought for the past 10 years. The area has low pre-cipitation and currently receives only 50 to 60 percent of its normal precipitation. With regard to surface fuel, Travis County has high forest density and canopy cover with crown fire potential. West Austin is densely covered with trees and brush, highly flammable because of the severe drought conditions. West Austin also has steeply sloping hills and canyons, and high wind speed and elevation are also factors. Other fac-tors to consider include high fire ignition risk related to transportation and historic wildfire occurrences and the area’s high population density. The area’s poor egress
Features
27esri.com Spring 2011 au
is related to the transportation network and urban morphology. The area also has low fire suppression capacity owing to the locations and levels of coverage provided by nearby fire departments. Each factor was represented by a separate layer that was created, extracted, or derived from other data sources or a combination of sources. The table on page 26 shows a few examples of these contributing factors asso-ciated with a risk statement, derivative data, contributing factors, trigger event, valuation methodology (how these factors are catego-rized in the analysis), and response strategy.
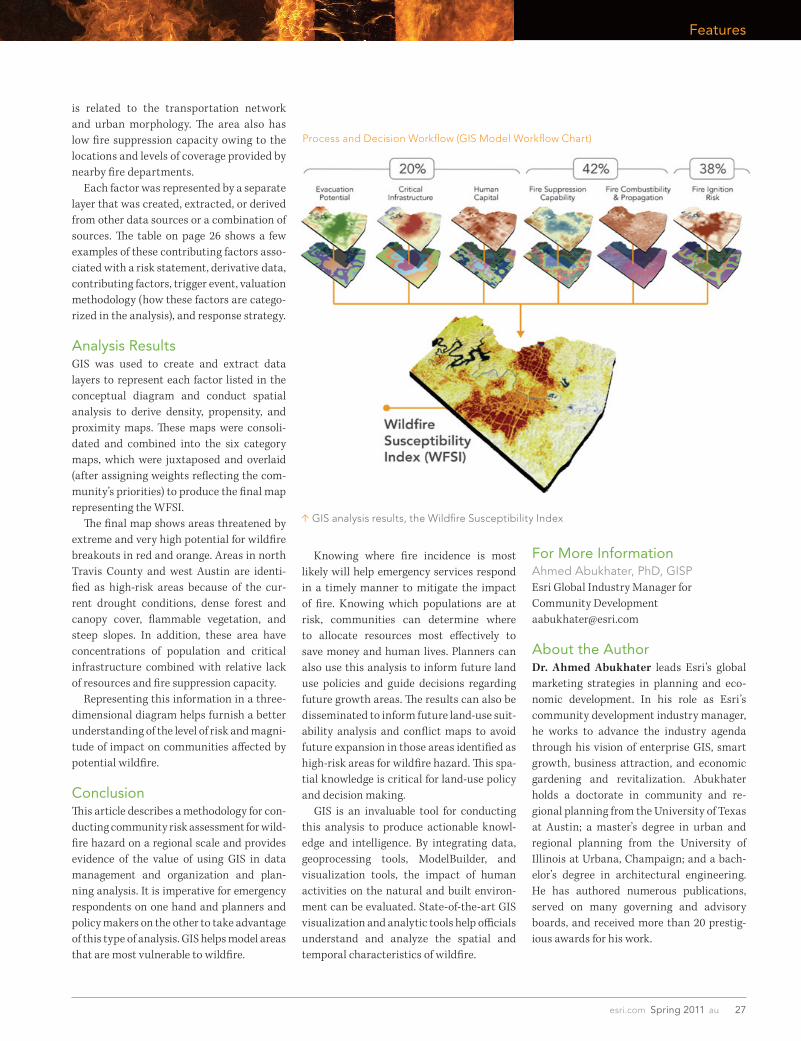
Analysis Results GIS was used to create and extract data layers to represent each factor listed in the conceptual diagram and conduct spatial analysis to derive density, propensity, and proximity maps. These maps were consoli-dated and combined into the six category maps, which were juxtaposed and overlaid (after assigning weights reflecting the com-munity’s priorities) to produce the final map representing the WFSI. The final map shows areas threatened by extreme and very high potential for wildfire breakouts in red and orange. Areas in north Travis County and west Austin are identi-fied as high-risk areas because of the cur-rent drought conditions, dense forest and canopy cover, flammable vegetation, and steep slopes. In addition, these area have concentrations of population and critical infrastructure combined with relative lack of resources and fire suppression capacity. Representing this information in a three-dimensional diagram helps furnish a better understanding of the level of risk and magni-tude of impact on communities affected by potential wildfire.
ConclusionThis article describes a methodology for con-ducting community risk assessment for wild-fire hazard on a regional scale and provides evidence of the value of using GIS in data management and organization and plan-ning analysis. It is imperative for emergency respondents on one hand and planners and policy makers on the other to take advantage of this type of analysis. GIS helps model areas that are most vulnerable to wildfire.
GIS analysis results, the Wildfire Susceptibility Index
Knowing where fire incidence is most likely will help emergency services respond in a timely manner to mitigate the impact of fire. Knowing which populations are at risk, communities can determine where to allocate resources most effectively to save money and human lives. Planners can also use this analysis to inform future land use policies and guide decisions regarding future growth areas. The results can also be disseminated to inform future land-use suit-ability analysis and conflict maps to avoid future expansion in those areas identified as high-risk areas for wildfire hazard. This spa-tial knowledge is critical for land-use policy and decision making. GIS is an invaluable tool for conducting this analysis to produce actionable knowl-edge and intelligence. By integrating data, geoprocessing tools, ModelBuilder, and visualization tools, the impact of human activities on the natural and built environ-ment can be evaluated. State-of-the-art GIS visualization and analytic tools help officials understand and analyze the spatial and temporal characteristics of wildfire.
For More InformationAhmed Abukhater, PhD, GISPEsri Global Industry Manager for Community [email protected]
About the AuthorDr. Ahmed Abukhater leads Esri’s global marketing strategies in planning and eco-nomic development. In his role as Esri’s community development industry manager, he works to advance the industry agenda through his vision of enterprise GIS, smart growth, business attraction, and economic gardening and revitalization. Abukhater holds a doctorate in community and re-gional planning from the University of Texas at Austin; a master’s degree in urban and regional planning from the University of Illinois at Urbana, Champaign; and a bach-elor’s degree in architectural engineering. He has authored numerous publications, served on many governing and advisory boards, and received more than 20 prestig-ious awards for his work.
Process and Decision Workflow (GIS Model Workflow Chart)