Embed Size (px)
Citation preview

Journal of Information Engineering and Applications www.iiste.org
ISSN 2224-5782 (print) ISSN 2225-0506 (online)
Vol.5, No.2, 2015
24
GIS and RS Integrated Framework for Supporting Planners and
Decision Makers
Mai Mostafa.Mohamed Hassan
College of computer science
Arab Academy for Science, Technology and Maritime Transport (AASTMT), Egypt
E-mail: [email protected]
Eman ElAmir,PhD
Esri Northeast Africa,Technical Consultant, EsriNea,Egypt
E-mail: [email protected]
Saleh Mesbah Elkaffas,PhD
College of Computing & IT,
Arab Academy for Science, Technology and Maritime Transport (AASTMT), Alexandria, Egypt
E-mail: [email protected]
Abstract
The power of integrations planning supports decision makers to take the right decision in the right time. In order
to have good plan, we should gather different kind of information with different perspectives and sources. The
integration between all kinds of information supports decision makers to set the right plans and logic strategies in
order to achieve their expected goals.Decision makers may suffer from information leakage, un-integrated
information from different sources; information which does not represent the current status of reality and ability
to represent information geographically. Decision makers should use modern technologies and tools in order to
overcome the obstacles which they may face.Remote sensing and Geographic information system can provide
realistic source of data and logic solutions which can support the decision makers to take the right decision in the
right time. Decision makers should use remote sensing technology in order to set their future planning and select
their right strategies because remote sensing is the science to obtain the date remotely either phenomena like
temperature, humidity or even satellite images which provides a realistic representation for the land which may
enable the decision maker to track changes which may happened on specific feature or even extract a specific
feature and get the different statistics or measurements which definitely important to set the right plans
Geographic information system support decision makers by realistic solutions and excellent geographic data
representation and even the ability to join and migrate different sources of data to be liked geographically with
the related features.
Keywords: Planning, Decision Making, Remote Sensing, Geographical Information System
1. INTRODUCTION Planning power in various fields, leads to the right decision at the right time. Planning according to the
information has been collected from different places gives us the vision and wide-ranging. The integration
between all Knowledge like planning, decision making, Geographical information systems (GIS) and Remote
sensing (RS). Lead us to have the right decision on time. A lot of problems that face the decision maker while he
takes his decision, if it’s the ideal decision, can I change it, is it the right time. These entire questions lead the
decision maker to be accurate in his decisions and lead to choose the right time. At this point I think when we
integrate the GIS and RS to make a plan in helping the Decision Maker in one framework it will be affected. As
a case study when we choose a place and have data base we can plan in future what we want in different major
like the population and urban and agricultural land. The population will be refers to CAPMAS to make the
statutes of the population. The agriculture land and the changes that happen on it will help the Ministry of
Agriculture. If all the data is available and real information, it will offer a lot of needs to farmers like what is the
exactly land for the cultivation of certain agriculture.
The modern technology of remote sensing which includes both aerial as well as satellite based
systems, it or this allow us to collect lots of physical data rather easily, with speed , on repetitive basis, and
together with the GIS that helps us to analyze the data spatially, offering possibilities of generating various
options (modeling), thereby optimizing the whole planning process. These information systems also offer
interpretation of physical (spatial) data with other socio-economic data, and thereby providing an important
linkage in the total planning process and making it more effective and meaningful. Recent technological
advances made in domain of spatial technology cause considerable impact in planning activities. This domain of
planning a prime importance for a country like Egypt with varied geographic patterns, cultural activities, etc. The
purpose of using GIS is that, maps provide an added dimension to data analysis which brings us one step closer

Journal of Information Engineering and Applications www.iiste.org
ISSN 2224-5782 (print) ISSN 2225-0506 (online)
Vol.5, No.2, 2015
25
to visualizing the complex patterns and relationships that characterize real-world planning, Decision making and
policy problems. Visualization of spatial patterns also supports change analysis, which is important in
monitoring of social indicators. This in turns should result an improving need assessment.
Urbanization is inevitable, when pressure on land is high; agriculture become low and population
increase are excessive, as the case in most of the developing countries of the world. Urbanization has become not
only of the principal manifestation but also an engine of change. At or in the 21th century, it has become the
center of urban transition for human society. In a way, the urbanization is desirable for human development.
However, uncontrolled urbanization has been responsible for many of the problems, our cities experiences today,
resulting in substandard living environment, acute problems of drinking water, noise and air pollution, disposal
of waste, traffic congestion etc. To improve these environmental degradations in and around the cities, the
technological development in relevant fields have to solved these problems caused by rapid urbanization, only
then the fruits of development will reach most of the deprived ones.
2. PROBLEM DEFINITION GIS tends to produce and accumulate a lot of data over time, providing an opportunity to “make sense” of this
data and get more high level information, conclusions, and trends. Remote sensing has been used in spatial
database for this purpose also. New methodologies are needed in order to mine more interesting and specific
information from the data, new frameworks are developed to harmonize more effectively all the steps of the
planning process, new solutions will have to manage the complex and heterogeneous source of information that
is today available for the analysts [5]. Geospatial data combines capabilities in data acquisition (RS), data
integration, and subject matter expertise to identify important sources of information and integrate geospatial and
tabular data accurately and in a way that is easily retrievable.
This research argues that integration of GIS and RS as better method to achieve efficient data changes
and intelligent analysis to aid the decision making process and planning. There are a lot of sporadic information
to the Decision Maker and planner. The Available information is not linked to the element of place. There is
Lack Integration between systems and each other. There is no correlation between different authorities.
The question that research attempts to address is: are GIS and RS enhancements filling the gap
between spatial data analysis and decision making and planning?
Taking into considerations literature and technical publications on geospatial information, remote
sensing, technology, standards and interoperability, urban planning, decision making and GIS, this research will
explore and integrate the GIS and RS to support Decision making and planning. The research will use
specifications endorsed by the visualization, evaluation and discovery of geospatial data. Use change detection
technique for display geographic data such as, urban encroachment, rivers and roads. Issues of decision making
and planning will be discussed in details.
3. PROPOSED MODEL
An analysis will be performed to assess the impact of GIS and RS on Decision making and planning as a
discipline, and on the changing requirements created by the GIS approach to geospatial intelligent analysis. We
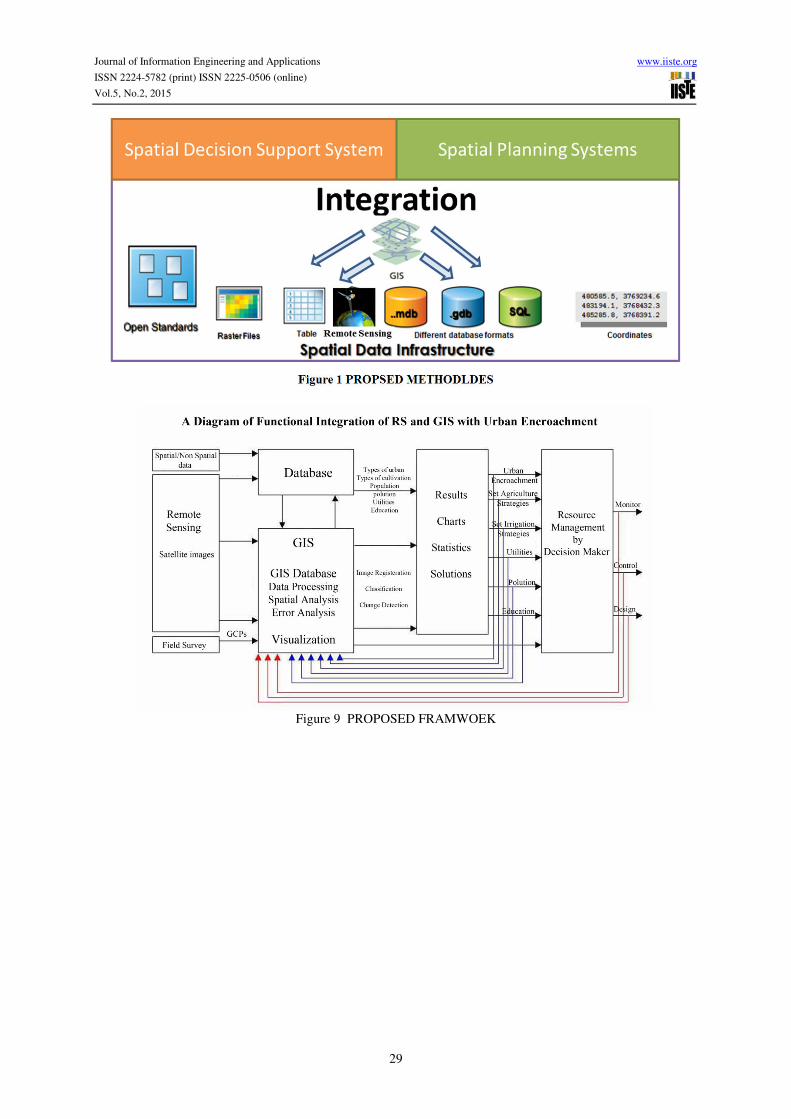
present the proposed research methodology in the below Figure 1 where spatial data Infrastructure and data
interoperability will be the base of our work , we will be able to exchange data through our developed GIS and
make intelligent analysis using Remote sensing rule and change detection techniques and perform regression
analysis on results.
4. FRAMEWORK
The proposed framework is monitoring the integration between GIS and RS to support decision making and
planning in Figure 2. In this research objectives are to integrate between different systems to support Decision
Maker, and to develop a framework to support decision maker and planner using Geographical information
System and Remote Sensing, along with addressing the following issues:
-Inability to get data from these sources.
-Poor planning objectives are difficult to overcome.
-Reframing planning objectives late in a study results in lost time and higher costs.
-The importance of planning objectives is not fully appreciated.
-Planners do not embrace innovative approaches to meet planning objectives.
-Decision maker need more detailed data for operation, tactical and strategic decisions to analyses, modeling and
forecasting.
-To extract the hidden information and gain the knowledge from different sources of data at two cases:
- Ability to get the data from these sources.
- Collect these data it in data base and extract the hidden knowledge from those different sources, and
distribute the feedback analysis for the interested users to aid decision making and planning.

Journal of Information Engineering and Applications www.iiste.org
ISSN 2224-5782 (print) ISSN 2225-0506 (online)
Vol.5, No.2, 2015
26
Make the analysis at each side containing the data, and gain the knowledge from each side without having the
data, and then collect all these knowledge gained from different sources to gain the accumulated knowledge that
would be helpful for decision making and planning.
5. CASE STUDY:ANLYSES URBAN ENCROCHMENT AND SUPORT DECISION MAKING FOR
PLANNING
The urban encroachment is a global problem affecting all nations of the world. Why? It needs all decision
making types Strategic, Tactical, Operational; It Needs continuous planning, It Needs Information System and It
Needs Location.
5.1 CASE STUDY AREA
The area of interest at Damanhur city located in the north-west of the Nile Delta belongs to the administrative
province of Beheira governorate as shown in Figure 3.This area is selected because it's well-known that
agricultural land there is exposed to pressure and erosion caused by urban encroachment. The process of urban
expansion will impact directly the agricultural productivity of the productive agricultural lands.
5.2 DATA AND TECHNIQUES
Data Available:
The remote sensing data available for Damanhour city are satellite images of QuickBird (2008) and Worldview2
(2010, 2012, and 2014). The specifications of these images are show in table 1.
Satellite Image Processing:
Geo-correction on the satellite image the accurate registration of the high resolution multi-temporal satellite data
is essential for change detection technique shown in Figure 4.
Image classification Land use/land cover classes are typically mapped from digital remotely sensed data through
the process of a supervised digital image classification [30; 31]. The supervised classification is applied using
ENVI 4.7 software for the classification process. To ensure the accuracy of the land use classes, ancillary data
and the result of visual interpretation are integrated with the classification result using GIS. At least 100 training
sites are chosen to represent land use classes, such as agricultural land, urban, water and other lands. Thematic
land use/ land cover images for the years 2008, 2010, 2012 and 2014 are produced for the study area through
supervised classification. To detect the changes before and after the revolution and it impacted on urbanization.
Change Detection Technique In the study area, the field observation and measurements have supported the classification that showed the
changes in land use between the four years. The post-classification change detection method is one of the most
common, accurate and quantitative techniques [6]. In this study, post-classification technique is applied. This
comparison technique is proved to be the most effective technique, because data from two years are separately
classified, thereby minimizing the problem of normalizing for atmospheric and sensor differences between
different years. Urban land use class is extracted from the classified images, and then cross-tabulation analysis is
carried out to study the spatial distribution and areas of land use changes in 2008, 2010, 2012 and 2014. ArcGIS
10.1 software is used to estimate the difference of urban land area between study area years and to highlight
areas added to urban landscape from agricultural land and from the adjacent other lands separately.
5.3 DISCUSSION OF RESULTS The result of the change detection is analyzed using Arc Map, ArcGIS 10.1. Statistical means show that there are
both positive and negative changes as shown in Figure 5. The percentage changes between the four years are
shown in Figure 6.this statistical support decision making and planning.
As an example of supporting decision making and planning:
Urban encroachment affects strategic crops 60% of agricultural area is cultivated by strategic crop, due to urban
encroachment this percentage is decrease, so we have to maintain or even increase the agricultural area which is
cultivated by strategic crop.
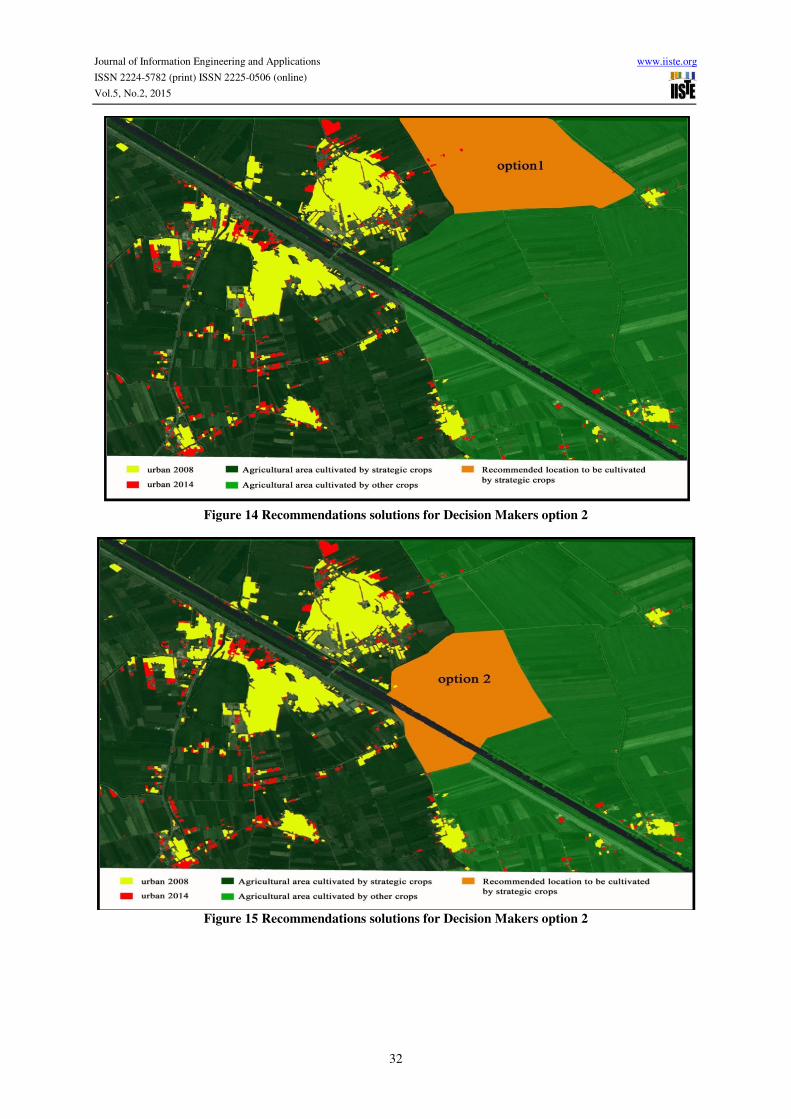
OPTION 1: Recommendations solutions for Decision Makers Figure 7
- The area can be a good extension for the strategic crop cultivated area mainly from east direction.
- The area is semi far from urban condensation mainly from west direction
- The Area is far from the main Road which may effects on the transportation cost
OPTION 2: Recommendations solutions for Decision Makers Figure 8
- The area seems is not a good extension for the strategic crop cultivated area, it lays in the expected urban
encroachment extension.
- The area is so near to urban condensation mainly from west direction
- The Area is near to main Road which is a good advantage for this location

Journal of Information Engineering and Applications www.iiste.org
ISSN 2224-5782 (print) ISSN 2225-0506 (online)
Vol.5, No.2, 2015
27
OPTION 3: Recommendations solutions for Decision Makers Figure 9
- The area seems is not a good extension for the strategic crop cultivated area; it has surrounding area which can
be added in future.
- The area is so far from urban condensation mainly from west direction
- The Area is near to main Road which is a good advantage for this location
Decision maker track all options that he have depending on GIS and RS results to plan what is the area that will
be more accurate. The integration between GIS,RS framework led decision maker to select option 3 which is the
most economic and applicable planning solution
References
Lawrence, S. et al. (2001). Persistence of Web References in Scientific Research. Computer. 34, 26-31.
doi:10.1109/2.901164, http://dx.doi.org/10.1109/2.901164
Smith, Joe, (1999), One of Volvo's core values. [Online] Available:
http://www.volvo.com/environment/index.htm (July 7, 1999)
Strunk, W., Jr., & White, E. B. (1979). The elements of style. (3rd ed.). New York: Macmillan, (Chapter 4).
Van der Geer, J., Hanraads, J. A. J., & Lupton R. A. (2000). The art of writing a scientific article. Journal of
Scientific Communications, 163, 51-59
[1] Esri, “‘GIS for Economic Development Table of Contents,’” ArcNews magazine, vol. 125, GIS for
Economic Development, p. 37, 2010.
C. Franklin, “Introduction to Geographic Information Systems: Linking Maps to Databases”,” Database, pp. 13–
21, 1992.
Goodchild, “GIS and sices,” Int .J. Remote Sens, no. 4, 2005.
A. A. E. ElAmir, O. Hegazy, M. NourEldien, “‘Integrating Web Services with Geospatial Data Mining Disaster
Management for Road Accidents,’” GeoInformatica- An Int. Journal, vol. 2, no. 1, pp. 1–11, 2012.
M. Nagai, “Interoperability Arrangements for Geospa4al Data,” in Data Integratation and Analysis, GEOSS.
2011.
Q. Weng, “Remote sensing of impervious surfaces in the urban areas: Requirements, methods, and trends,”
Remote Sens. Environ., vol. 117, pp. 34–49, 2012.
R. Chi, M., Feng, “Classification of hyperspectral remote-sensing data with primal SVM for small-sized training
dataset problem.,” 2008.
G. Mountrakis, J. Im, and C. Ogole, “Support vector machines in remote sensing: A review,” ISPRS J.
Photogramm. Remote Sens., vol. 66, no. 3, pp. 247–259, 2011.
M. Mathers, C.D., Stevens, G., Mascarenhas, “Global Health Risks: Mortality and Burden of Disease
Attributable to Selected Major Risks,” 2009.
M. Brauer, M., Amann, M., Burnett, R.T., Cohen, A., Dentener, F., Ezzati, V. Henderson, S.B., Krzyzanowski,
M., Martin, R.V., Van Dingenen, R., and G. D. Donkelaar, A., Thurston, “Exposure assessment for estimation of
the global burden of disease attributable to outdoor air pollution.,” Environ. Sci. Technol., vol. 46, no. 12, p.
652e660, 2012.
C. van Donkellar, A., Martin, R.V., Brauer, M., Kahn, R., Levy, R., Verduzco and P. J. Villeneuve, “Global
estimates of ambient fine particulate matter concentrations from satellite-based aerosol optical depth:
development and application.,” Environ. Health Perspect., vol. 118, no. 6, p. 847e855., 2010.
A. Burrows, J.P., Weber, M., Buchwitz, M., Rozanov, V., Ladstätter-Weißenmayer and M. Richter, A., DeBeek,
R., Hoogen, R., Bramstedt, K., Eichmann, K., Eisinger, “The Global Ozone Monitoring Experiment (GOME):
mission concept and first scientific results.,” J. Atmos. Sci., vol. 56, no. 2, p. 151e175, 1999.
R. V. Martin, “Satellite remote sensing of surface air quality,” Atmos. Environ., vol. 42, no. 34, p. 7823e7843,
2008.
M. J. Bechle, D. B. Millet, and J. D. Marshall, “Remote sensing of exposure to NO2: Satellite versus ground-
based measurement in a large urban area,” Atmos. Environ., vol. 69, no. 2, pp. 345–353, 2013.
S. Baltsavias, E.P.,&Mason, “Automatic extraction of man-made objects from aerial and space images,” Int.
Work., p. 87e96, 1997.
S. Baud, I., Kuffer, M., Pfeffer, K., Sliuzas, R., & Karuppannan, “Understanding heterogeneity in metropolitan
India: the added value of remote sensing data for analyzing sub-standard residential areas.,” Int. J. Appl. Earth
Obs. Geoinf., vol. 12, no. 5, p. 359e374, 2010.
O. Kit, M. Lüdeke, and D. Reckien, “Texture-based identification of urban slums in Hyderabad, India using
remote sensing data,” Appl. Geogr., vol. 32, pp. 660–667, 2012.
L. Wang, C. Li, Q. Ying, X. Cheng, X. Wang, X. Li, L. Hu, L. Liang, L. Yu, H. Huang, and P. Gong, “China’s
urban expansion from 1990 to 2010 determined with satellite remote sensing,” Chinese Sci. Bull., vol. 57, no.
22, pp. 2802–2812, 2012.
A. P. Srivastava, A., Nagpal, B.N., Joshi, P.L., Paliwal, J.C., Dash, “Identification of malaria hot spots for

Journal of Information Engineering and Applications www.iiste.org
ISSN 2224-5782 (print) ISSN 2225-0506 (online)
Vol.5, No.2, 2015
28
focused intervention in tribal stat of India: a GIS based approach.,” Int. J. Heal., vol. 8, p. 30, 2009.
a. a. Hanafi-Bojd, H. Vatandoost, M. a. Oshaghi, Z. Charrahy, a. a. Haghdoost, G. Zamani, F. Abedi, M. M.
Sedaghat, M. Soltani, M. Shahi, and a. Raeisi, “Spatial analysis and mapping of malaria risk in an endemic area,
south of Iran: A GIS based decision making for planning of control,” Acta Trop., vol. 122, no. 1, pp. 132–137,
2012.
T. Fung and W. Siu, “Environmental quality and its changes, an analysis using NDVI,” Int. J. Remote Sens., vol.
21, pp. 1011–1024, 2000.
T. F. and W. Siu, “‘A study of green space and its changes in Hong Kong using NDVI,’” Geogr. Environ.
Model., vol. 5, pp. 111–122, 2001.
G. Li and Q.Weng, “‘Measuring the quality of life in city of Indianapolis by integration of remote sensing and
census data,’” Int. J. Remote Sens., vol. 28, pp. 249–267, 2007.
G. Li and Q.Weng, Integration of remote sensing and census data for assessing urban quality of life: Model
development and validation,”. 2007, pp. 311–336.
C. P. Lo and B. J. Faber, “‘Integration of Landsat Thematic Mapper and census data for quality of life
assessment,’” Remote Sens. Environ., vol. 62, pp. 143–157, 1997.
J. E. Nichol and M. S. Wong, “‘Assessment of urban environmental quality in a subtropical city using
multispectral satellite images,’” Environ. Plan. B Plan. Des., vol. 33, pp. 39–58, 2006.
J. E. Nichol and M. S. Wong, “Assessing urban environmental quality with multiple parameters,.” 2007, pp.
311–336.
C. Weber and J. Hirsch, “‘Some urban measurements from SPOT data: Urban life quality indices,’” Int. J.
Remote Sens., vol. 13, pp. 3251–3261, 1992.
B. Liang and Q. Weng, “Assessing urban environmental quality change of indianapolis, united states, by the
remote sensing and GIS integration,” IEEE J. Sel. Top. Appl. Earth Obs. Remote Sens., vol. 4, no. 1, pp. 43–55,
2011.
E. P. Gadal S, Fournier S and Dynamic, “3D Dynamic Representation for Urban Sprawl Modelling: Example of
India’s Delhi-Mumbai Corridor, S.A.P.I.E.N.S,” Online: http://sapiens.revues.org/index932. html., 2009. .
H. J. . Remote, Using Remote Sensing and GIS integration to identify Spatial Characteristics of Sprawl at the
Building-unit level, in Mesev V (Ed.). 2007.
[37] K. M. Jat, P. K. Garg, and D. Khare, “Monitoring and modelling of urban sprawl using remote sensing
and GIS techniques,” Int. J. Appl. Earth Obs. Geoinf., vol. 10, no. 1, pp. 26–43, 2008.
Center For International Forestry Research, “Guidelines for applying multicriteria analysis to the assessment of
criteria and indicators.,” Cent. Int. For. Res. Jakarta, p. 85, 1997.
A. Giap, D.H., Yi, Y., Yakupitiyage, “GIS for land evaluation for shrimp farming in Haiphong of Vietnam.,”
Ocean Coast. Manag., vol. 48, no. 1, pp. 51–63, 2005.
S. R. A. Kosaki, T., Wasano, K., Juo, “Multivariate statistical analysis of yielddetermining factors.,” Soil Sci.
Plant Nutr., vol. 35, no. 4, pp. 597–607, 2012.
T. Tuan, A. Verdoodt, V. Y. Tran, and N. Delbecque, “Agriculture , Ecosystems and Environment Design of a
GIS and multi-criteria based land evaluation procedure for sustainable land-use planning at the regional level,”
"Agriculture, Ecosyst. Environ., vol. 200, pp. 1–11, 2015.
Journal of Information Engineering and Applications www.iiste.org
ISSN 2224-5782 (print) ISSN 2225-0506 (online)
Vol.5, No.2, 2015
29
Figure 9 PROPOSED FRAMWOEK

Journal of Information Engineering and Applications www.iiste.org
ISSN 2224-5782 (print) ISSN 2225-0506 (online)
Vol.5, No.2, 2015
30
Figure 10 A map of Damanhur city- Beheira governorate Delta Egypt
Figure 11 Methods of Change Detection Techniques

Journal of Information Engineering and Applications www.iiste.org
ISSN 2224-5782 (print) ISSN 2225-0506 (online)
Vol.5, No.2, 2015
31
Figure 12 change detection between four years
Figure 13 Areas% of land use classes (2008-2014)
Journal of Information Engineering and Applications www.iiste.org
ISSN 2224-5782 (print) ISSN 2225-0506 (online)
Vol.5, No.2, 2015
32
Figure 14 Recommendations solutions for Decision Makers option 2
Figure 15 Recommendations solutions for Decision Makers option 2

Journal of Information Engineering and Applications www.iiste.org
ISSN 2224-5782 (print) ISSN 2225-0506 (online)
Vol.5, No.2, 2015
33
Figure 16 Recommendations solutions for Decision Makers option 2
Table 2 Specifications of QuickBird & WorldView2 images
Satellites Data Specifications
Collection
Systems
QuickBird WorldView-2
Spatial
Resolution
Pan 61 cm
MS
2.44 m (at 450km)
Pan 46 cm
MS
1.84 m (6 ft 0 in)
Swath Width 16.5 km 16.4 km
Average Revisit 2.4 days 1.1 days
Spectral Bands Pan + 4 MS Pan + 8 MS