Embed Size (px)
Citation preview

GIMS HELP GUIDE
CHECK FLOODPLAIN STATUS AND 500-YEAR ELEVATION USING A STREET ADDRESS OR HCAD TAX ID
1. Go to the GIMS website http://www.gims.houstontx.gov/portalWS/MainPortal.aspx?rld=428 2. Note: This link only works with Internet Explorer
3. Click on the Binoculars in the Public Works GIS menu bar to search for a street address location.
4. Enter the street address and zip code in the “Locate by” pop-up box and click the “Go” button. If you do not know the street address, you may search for one by selecting “HCAD TAX ID”, enter the 13-digit number and click the “Go” button. This action will zoom directly to the property and highlight it on your screen.
5. The “Address Candidates” box will appear in the lower right corner of your screen. If there are multiple lines with a similar address, choose the street address, state and zip code which pinpoints the exact location of the property and structure. Make sure the red push-pin is in the correct location by checking the nearest intersection.
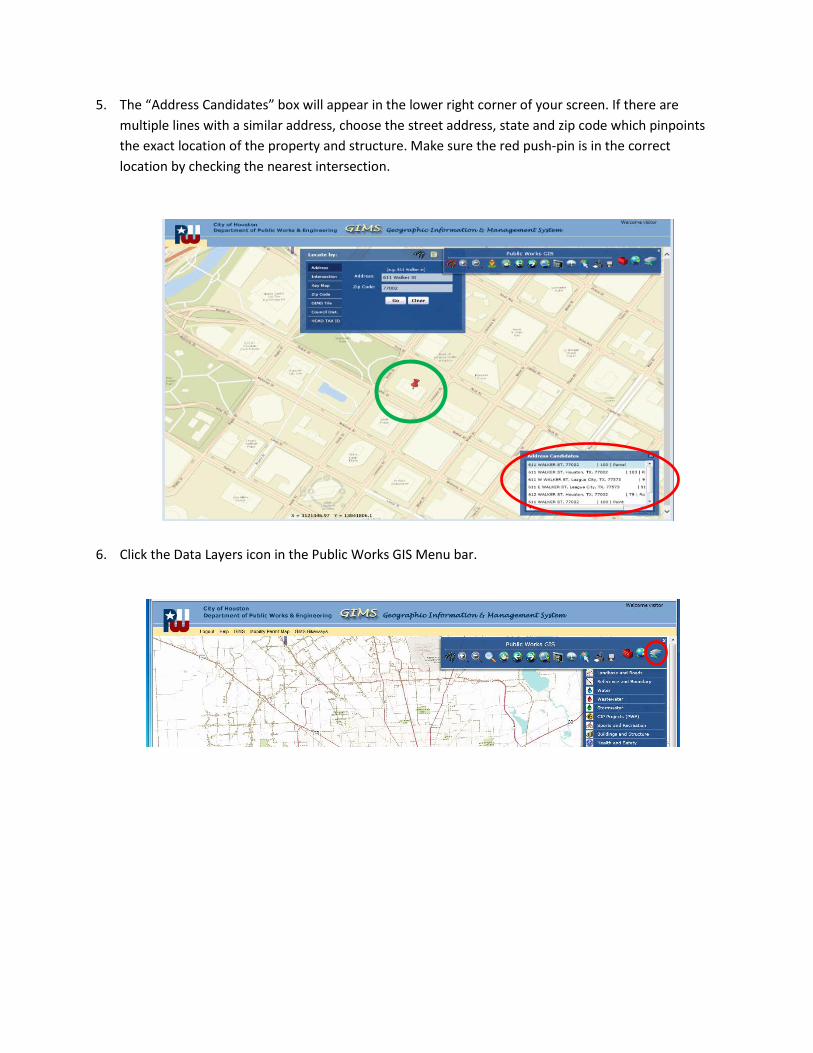
6. Click the Data Layers icon in the Public Works GIS Menu bar.

7. From the Data Layers dropdown menu on the right, click “Floodplain Data”. A “Floodplain Data” pop-up box will appear on the left side of your screen. Under the “Effective FIRM”, select the “Flood Zone”, “500 WSEL” (Water Surface Elevation) & “500 Delta” check-boxes. If you see no screen changes in the area of your address location, the address is likely NOT in the Floodplain. However, you should perform an additional step to check and confirm, as described and illustrated in Step #8. Please note: If the red push-pin disappears from your screen when you click on “Data Layers” icon (as below), simply click the “Go” button on the “Locate by” pop-up box and the red push-pin should reappear.
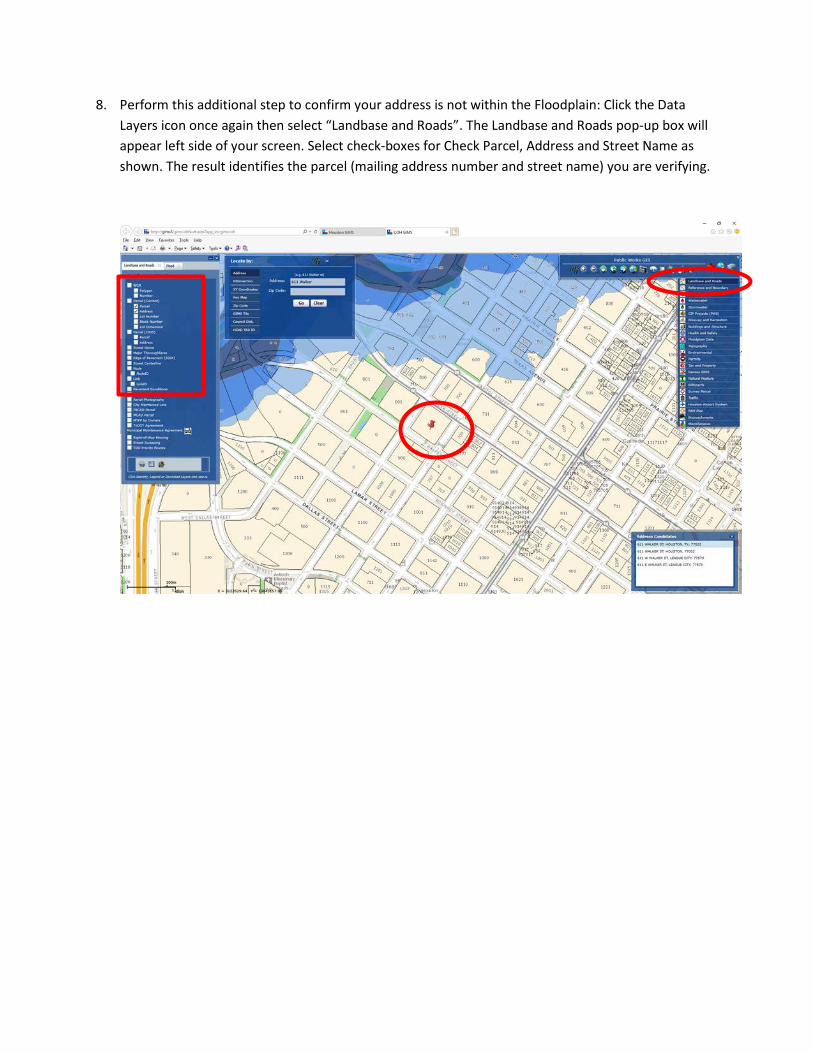
8. Perform this additional step to confirm your address is not within the Floodplain: Click the Data Layers icon once again then select “Landbase and Roads”. The Landbase and Roads pop-up box will appear left side of your screen. Select check-boxes for Check Parcel, Address and Street Name as shown. The result identifies the parcel (mailing address number and street name) you are verifying.
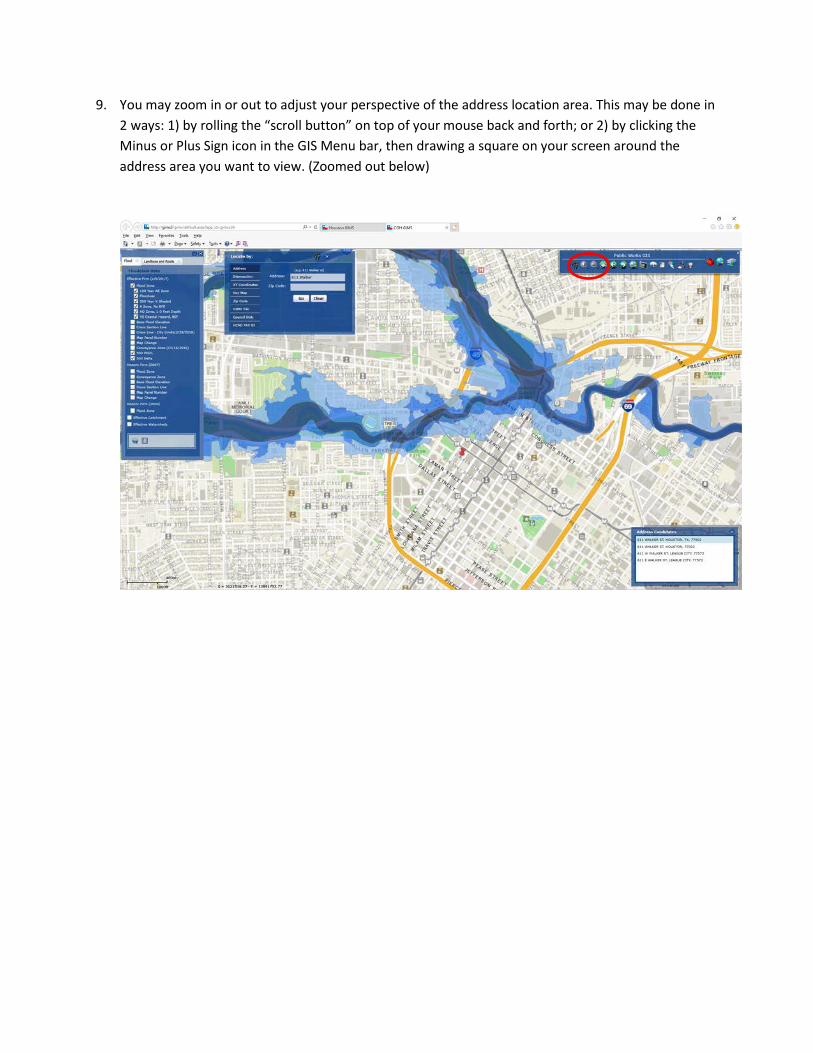
9. You may zoom in or out to adjust your perspective of the address location area. This may be done in 2 ways: 1) by rolling the “scroll button” on top of your mouse back and forth; or 2) by clicking the Minus or Plus Sign icon in the GIS Menu bar, then drawing a square on your screen around the address area you want to view. (Zoomed out below)
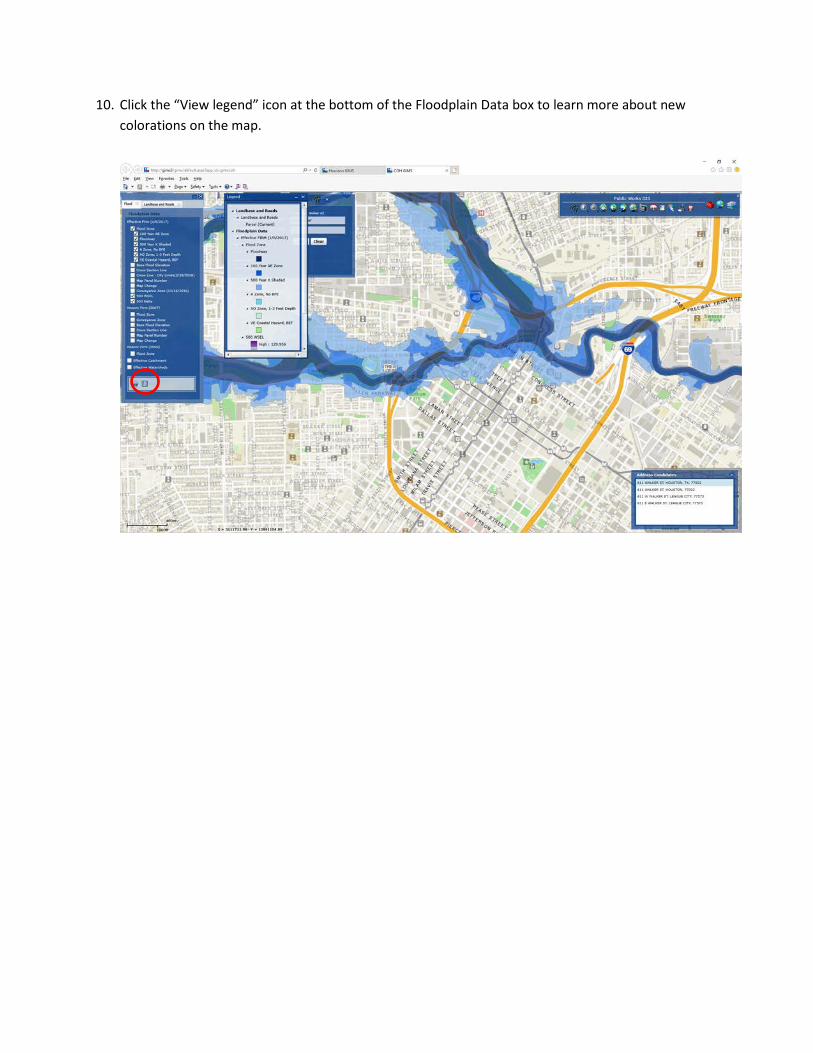
10. Click the “View legend” icon at the bottom of the Floodplain Data box to learn more about new colorations on the map.
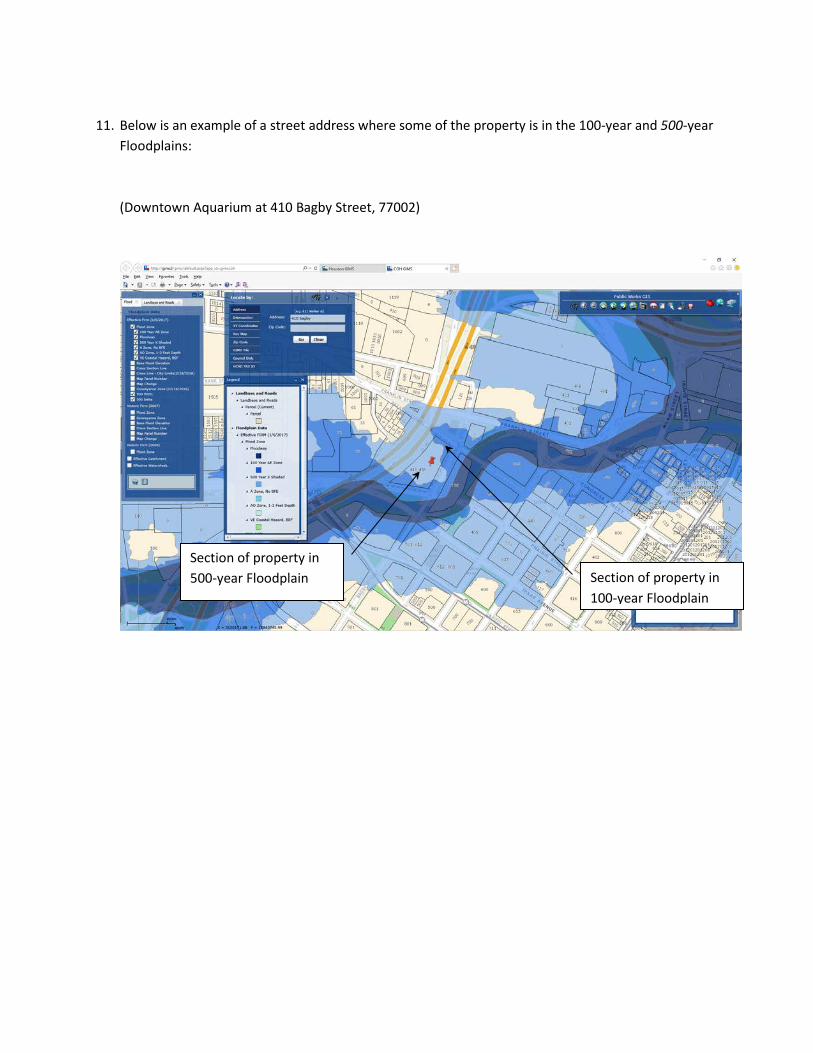
11. Below is an example of a street address where some of the property is in the 100-year and 500-year
Floodplains: (Downtown Aquarium at 410 Bagby Street, 77002)
Section of property in 500-year Floodplain Section of property in
100-year Floodplain
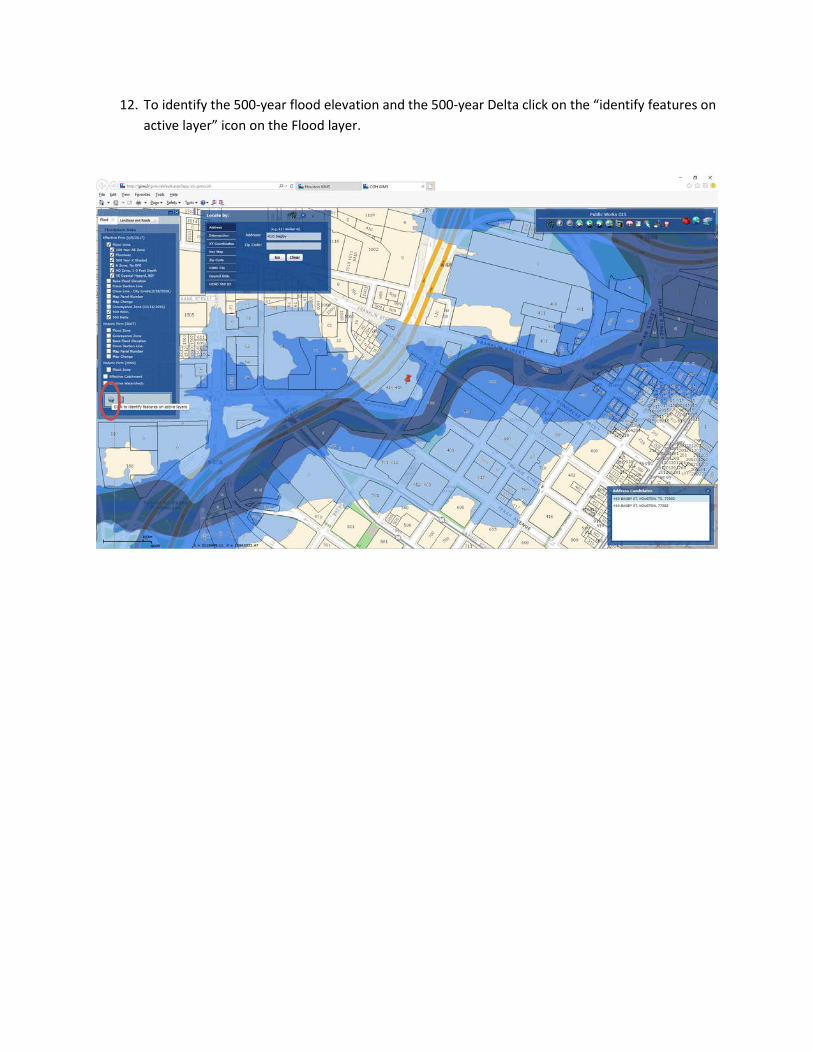
12. To identify the 500-year flood elevation and the 500-year Delta click on the “identify features on active layer” icon on the Flood layer.
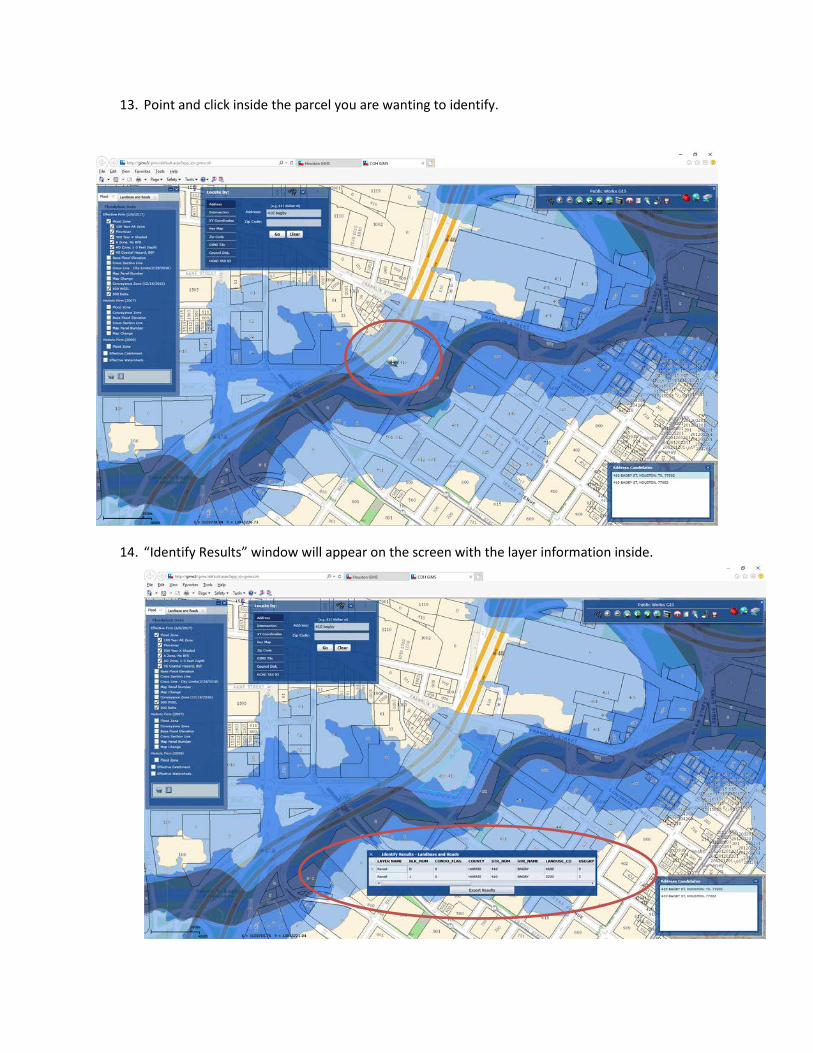
13. Point and click inside the parcel you are wanting to identify.
14. “Identify Results” window will appear on the screen with the layer information inside.
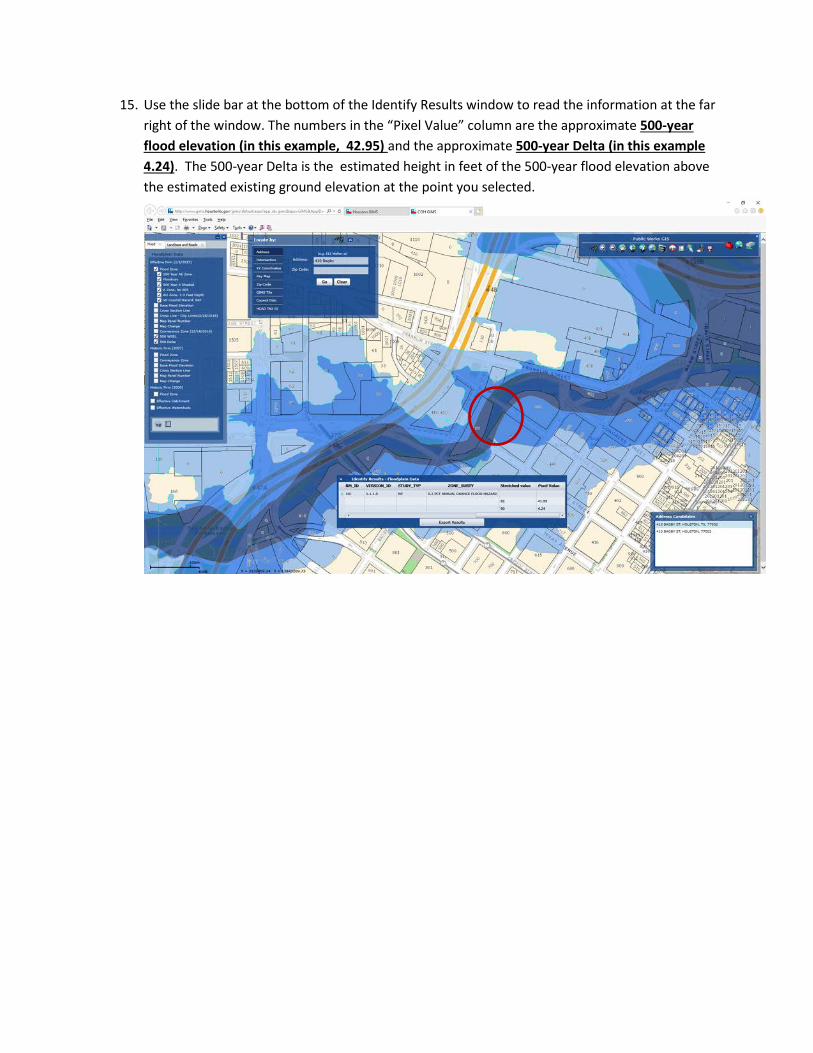
15. Use the slide bar at the bottom of the Identify Results window to read the information at the far right of the window. The numbers in the “Pixel Value” column are the approximate 500-year flood elevation (in this example, 42.95) and the approximate 500-year Delta (in this example 4.24). The 500-year Delta is the estimated height in feet of the 500-year flood elevation above the estimated existing ground elevation at the point you selected.