Embed Size (px)
Citation preview

Gibson CM. Ann Intern Med. 1999;130:841-847. Gibson CM. Ann Intern Med. 1999;130:841-847.
Characteristics of the Ideal Fibrinolytic AgentCharacteristics of the Ideal Fibrinolytic AgentCharacteristics of the Ideal Fibrinolytic AgentCharacteristics of the Ideal Fibrinolytic Agent
•Longer half-life/single-bolus administration•Increased fibrin specificity/decreased bleeding and ICH•More rapid and consistent achievement of TIMI grade 3 flow•No effect on blood pressure•No antigenicity•Lower reocclusion rates•Greater resistance to PAI-1•Compatible with other intravenous agents•Low cost
•Longer half-life/single-bolus administration•Increased fibrin specificity/decreased bleeding and ICH•More rapid and consistent achievement of TIMI grade 3 flow•No effect on blood pressure•No antigenicity•Lower reocclusion rates•Greater resistance to PAI-1•Compatible with other intravenous agents•Low cost

Fibrin SpecificityFibrin Specificity
Molecular Structures of FibrinolyticsMolecular Structures of FibrinolyticsMolecular Structures of FibrinolyticsMolecular Structures of Fibrinolytics
TNK-tPATNK-tPAt-PAt-PAr-PA / n-PAr-PA / n-PASKSK
TNK t-PA (tenecteplase) r-PA (reteplase)
t-PA (alteplase) n-PA (lanoteplase)
TenecteplaseTenecteplaseTenecteplaseTenecteplase(TNK-tPA)(TNK-tPA)(TNK-tPA)(TNK-tPA)
LanoteplaseLanoteplaseLanoteplaseLanoteplase(n-PA)(n-PA)(n-PA)(n-PA) StaphylokinaseStaphylokinaseStaphylokinaseStaphylokinase SaruplaseSaruplaseSaruplaseSaruplase
Half-life (minutes)Half-life (minutes) 2020 3737 66 99
DosingDosing Single bolusSingle bolus Single bolusSingle bolus 2 boluses2 boluses30 min apart30 min apart
Bolus + 60-Bolus + 60-min infusionmin infusion
Provides patient-
specific weight- based dosing
Provides patient-
specific weight- based dosing
YesYes YesYes ???? ????
Fibrin specificityFibrin specificity ++++++ ++ ++++++ ++
PAI-1 resistancePAI-1 resistance IncreasedIncreased ???? ???? ????
AntigenicAntigenic NoNo NoNo YesYes YesYes
PlasminogenPlasminogenactivationactivation
DirectDirect DirectDirect IndirectIndirect DirectDirect
Fibrinolytics in Development: Comparative OverviewFibrinolytics in Development: Comparative OverviewFibrinolytics in Development: Comparative OverviewFibrinolytics in Development: Comparative Overview

TNK-tPA: Molecular and Biochemical PropertiesTNK-tPA: Molecular and Biochemical PropertiesTNK-tPA: Molecular and Biochemical PropertiesTNK-tPA: Molecular and Biochemical Properties
K Domain
Ala-Ala-Ala-Ala for Lys-His-Arg at 296-299:More resistant to PAI 1, enzyme which breaks down lytic agents
K Domain
Ala-Ala-Ala-Ala for Lys-His-Arg at 296-299:More resistant to PAI 1, enzyme which breaks down lytic agents
NH2NH2 HOOCHOOC
EGFEGF
FingerFinger
Kringle 1Kringle 1Kringle 2Kringle 2
T Domain Asn for Thr at
103: Reduces clearance; single bolus
T Domain Asn for Thr at
103: Reduces clearance; single bolus
N Domain Gln for Asn at 117 : Increased fibrin specificityN Domain Gln for Asn at 117 : Increased fibrin specificity

63
19
55
22
63
16
66
22
0102030405060708090
100
t-PA TNK-tPA 30mg TNK-tPA 40mg TNK-tPA 50mg
TIMI grade 2
TIMI grade 3
63
19
55
22
63
16
66
22
0102030405060708090
100
t-PA TNK-tPA 30mg TNK-tPA 40mg TNK-tPA 50mg
TIMI grade 2
TIMI grade 3
n=312n=312 n=304n=304 n=146n=146 n=76n=76*P=0.047, TNK-tPA 30 mg vs t-PA; all others, P=NS.*P=0.047, TNK-tPA 30 mg vs t-PA; all others, P=NS.
TIMI-10B: TIMI Grade Flow at 90 MinutesTIMI-10B: TIMI Grade Flow at 90 MinutesTIMI-10B: TIMI Grade Flow at 90 MinutesTIMI-10B: TIMI Grade Flow at 90 MinutesP
erc
en
t o
f P
ati
ents
Pe
rce
nt
of
Pa
tien
ts
Cannon CP, Gibson CM, McCabe CH et al. Circulation. 1998;98:2805-2814.Cannon CP, Gibson CM, McCabe CH et al. Circulation. 1998;98:2805-2814.

0
10
20
30
40
50
60
70
TNK-tPA Dose/Weight (quintiles, mg/kg, mean)
Per
cen
t T
IMI
Gra
de
3 F
low
at
90
Min
ute
s
0
10
20
30
40
50
60
70
TNK-tPA Dose/Weight (quintiles, mg/kg, mean)
Per
cen
t T
IMI
Gra
de
3 F
low
at
90
Min
ute
s
0.20.2 0.30.3 0.40.4 0.50.5 0.60.6 0.70.7
PP=0.028=0.028PP=0.028=0.028
Cannon CP, Gibson CM, McCabe CH et al. Circulation. 1998;98:2805-2814.Cannon CP, Gibson CM, McCabe CH et al. Circulation. 1998;98:2805-2814.
TIMI-10B: TIMI Grade 3 Flow at 90 Minutes by Dose/WeightTIMI-10B: TIMI Grade 3 Flow at 90 Minutes by Dose/WeightTIMI-10B: TIMI Grade 3 Flow at 90 Minutes by Dose/WeightTIMI-10B: TIMI Grade 3 Flow at 90 Minutes by Dose/Weight
No further improvement
In flow above 0.53 mg/kg
No further improvement
In flow above 0.53 mg/kg

3835
31
40
35
31
0
5
10
15
20
25
30
35
40
Culprit All 3 Arteries
3835
31
40
35
31
0
5
10
15
20
25
30
35
40
Culprit All 3 Arteries
Gibson CM, et al. Am J Cardiol. 1999;84:976-980.Gibson CM, et al. Am J Cardiol. 1999;84:976-980.
TIM
I F
ram
e C
ount
TIM
I F
ram
e C
ount
TIMI-10B: Relationship Between TIMI Frame Count & Dose / TIMI-10B: Relationship Between TIMI Frame Count & Dose / WeightWeight
TIMI-10B: Relationship Between TIMI Frame Count & Dose / TIMI-10B: Relationship Between TIMI Frame Count & Dose / WeightWeight
N=166N=166 N=174N=174 N=171N=171 N=104N=104 N=107N=107 N=127N=127
0.52 to
1.24
mg/kg
0.52 to
1.24
mg/kg
0.40 to
0.51
mg/kg
0.40 to
0.51
mg/kg
0.20 to
0.39
mg/kg
0.20 to
0.39
mg/kg
High Dose = 0.52 to 1.24 mg / Kg.
Dose of 0.53 mg / kg selected for ASSENT 2 based upon logistic regression of CTFC
High Dose = 0.52 to 1.24 mg / Kg.
Dose of 0.53 mg / kg selected for ASSENT 2 based upon logistic regression of CTFC
p = 0.007p = 0.007 p = 0.002p = 0.002
LowLow MedMed HighHigh
0.20 to
0.39
mg/kg
0.20 to
0.39
mg/kg
LowLow
0.40 to
0.51
mg/kg
0.40 to
0.51
mg/kg
MedMed
0.52 to
1.24
mg/kg
0.52 to
1.24
mg/kg
HighHigh

Pathophysiology of Improved Flow With Weight Optimized TNK Dosing: Weight Pathophysiology of Improved Flow With Weight Optimized TNK Dosing: Weight Optimizing Reduces Thrombus Burden & Improves Percent StenosisOptimizing Reduces Thrombus Burden & Improves Percent Stenosis
Pathophysiology of Improved Flow With Weight Optimized TNK Dosing: Weight Pathophysiology of Improved Flow With Weight Optimized TNK Dosing: Weight Optimizing Reduces Thrombus Burden & Improves Percent StenosisOptimizing Reduces Thrombus Burden & Improves Percent Stenosis
34.3
2925
0
5
10
15
20
25
30
35
40
Thrombus
34.3
2925
0
5
10
15
20
25
30
35
40
Thrombus
75.7
71.4
69
70
71
72
73
74
75
76
77
% Stenosis
75.7
71.4
69
70
71
72
73
74
75
76
77
% Stenosis
Gibson CM, et al. Am J Cardiol. 1999;84:976-980.Gibson CM, et al. Am J Cardiol. 1999;84:976-980.
N=166N=166 N=174N=174 N=171N=171%
Ste
no
sis
% S
ten
osi
s
% P
atie
nts
% P
atie
nts
p = 0.06p = 0.06 p = 0.03p = 0.03
LowLow MedMed HighHigh
LowLow HighHigh
N=173N=173 N=173N=173

29
24
19
0
5
10
15
20
25
30
35
Post PTCA
29
24
19
0
5
10
15
20
25
30
35
Post PTCA
Gibson CM, et al. Am J Cardiol. 1999;84:976-980.Gibson CM, et al. Am J Cardiol. 1999;84:976-980.
TIM
I F
ram
e C
ount
TIM
I F
ram
e C
ount
TIMI-10B: Weight Optimized Dosing TIMI-10B: Weight Optimized Dosing “Facilitates Adjunctive PCI”“Facilitates Adjunctive PCI”
TIMI-10B: Weight Optimized Dosing TIMI-10B: Weight Optimized Dosing “Facilitates Adjunctive PCI”“Facilitates Adjunctive PCI”
N=46N=46 N=39N=39 N=20N=20
0.52 to
1.24
mg/kg
0.52 to
1.24
mg/kg
0.40 to
0.51
mg/kg
0.40 to
0.51
mg/kg
0.20 to
0.39
mg/kg
0.20 to
0.39
mg/kg
Dose of 0.53 mg / kg selected for ASSENT 2 based upon logistic regression of Frame Count data
Dose of 0.53 mg / kg selected for ASSENT 2 based upon logistic regression of Frame Count data
p = 0.05p = 0.05
LowLow MedMed HighHigh
TNK-tPATNK-tPATNK-tPATNK-tPA(n=8,461)(n=8,461)(n=8,461)(n=8,461)
t-PAt-PAt-PAt-PA(n=8,488)(n=8,488)(n=8,488)(n=8,488)
Relative RiskRelative RiskRelative RiskRelative Risk(95% CI)(95% CI)(95% CI)(95% CI) PP Value Value PP Value Value
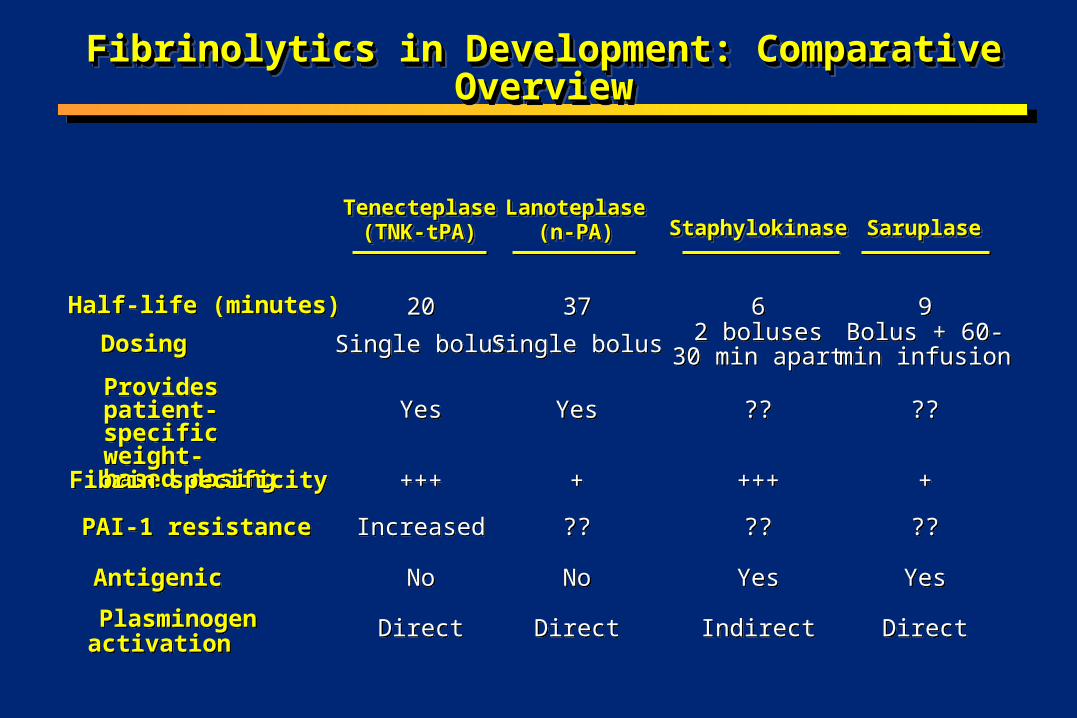
Total stroke (%)Total stroke (%) 1.781.78 1.661.66 1.071.07(0.856-1.349)(0.856-1.349)
0.5550.555
IntracranialIntracranialhemorrhage (%)hemorrhage (%)
0.930.93 0.940.94 0.9910.991(0.727-1.350)(0.727-1.350)
1.0001.000
IschemiaIschemia 0.720.72 0.640.64 1.131.13(0.787-1.632)(0.787-1.632)
0.5140.514
With hemorrhagicWith hemorrhagicconversion (%)conversion (%)
0.070.07 0.090.09 0.7520.752(0.261-2.168)(0.261-2.168)
0.7900.790
Unknown type (%)Unknown type (%) 0.130.13 0.080.08 1.5761.576(0.611-4.065)(0.611-4.065)
0.3580.358
ASSENT-2 Investigators. Lancet. 1999;354:716-722.ASSENT-2 Investigators. Lancet. 1999;354:716-722.
ASSENT-2: Similar Incidence of Stroke for TNK-tPA and t-PAASSENT-2: Similar Incidence of Stroke for TNK-tPA and t-PAASSENT-2: Similar Incidence of Stroke for TNK-tPA and t-PAASSENT-2: Similar Incidence of Stroke for TNK-tPA and t-PA

Confusion in Reperfusion:Confusion in Reperfusion:The “Old Old” (>75 yrs)The “Old Old” (>75 yrs)
Confusion in Reperfusion:Confusion in Reperfusion:The “Old Old” (>75 yrs)The “Old Old” (>75 yrs)
• Highest risk for complications, but potentially have the most to gain from treatment
• Understudied in randomized trials, but now over 1/3 rd of MIs are > 75 years
• Heterogeneous group, multiple risk factors at play, potential for interactions
• Tend to present late
• Highest risk for complications, but potentially have the most to gain from treatment
• Understudied in randomized trials, but now over 1/3 rd of MIs are > 75 years
• Heterogeneous group, multiple risk factors at play, potential for interactions
• Tend to present late
CM Gibson, GW symposium, AHA 2000CM Gibson, GW symposium, AHA 2000
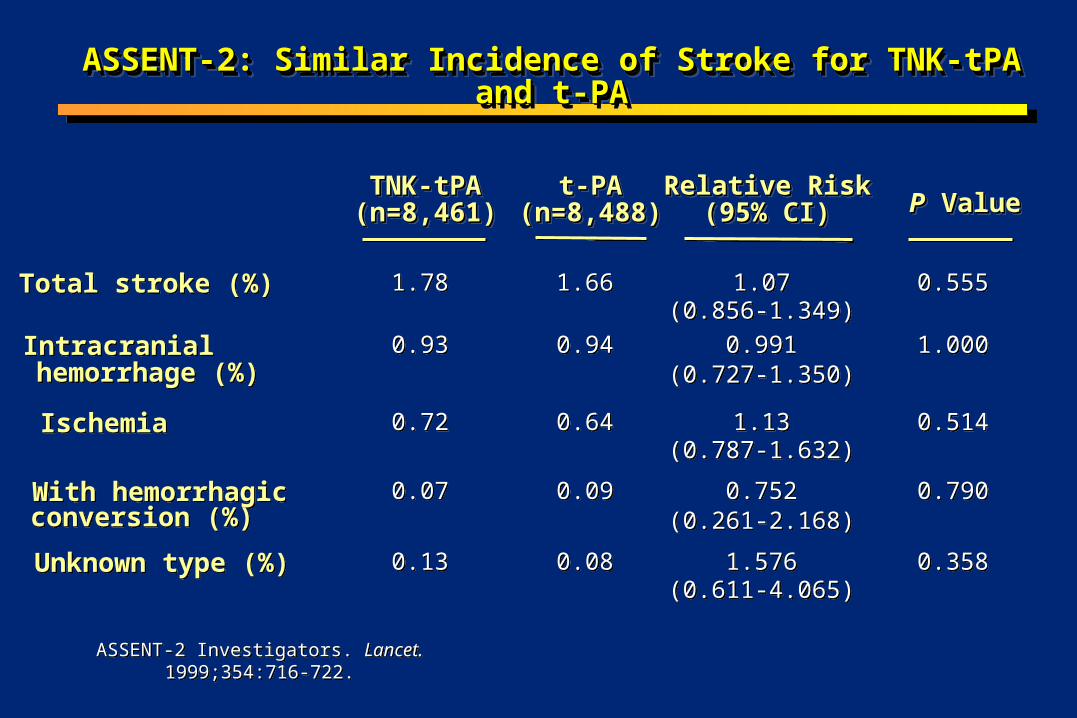
ICH Risk is Eight Time Higher in Elderly Females following t-PA
ICH Risk is Eight Time Higher in Elderly Females following t-PA
Gurwitz et al. 1998 Annals Int Med. 129; 597-604.
0
2
4
6
8
10
12
M<65 F<65 M 65-74 F 65-74 M>75 F>75
Ad
just
ed O
R

Unadjusted Dose Rises Rapidly in People of Low Unadjusted Dose Rises Rapidly in People of Low Body WeightBody Weight
Unadjusted Dose Rises Rapidly in People of Low Unadjusted Dose Rises Rapidly in People of Low Body WeightBody Weight
0
0.5
1
1.5
2
2.5
3
20 30 40 50 60 70 80 90 100 110
Weight (kg)
Do
se (
mg
/kg
)
tPA
Fixed dose
TNK
CM Gibson, GW symposium, AHA 2000CM Gibson, GW symposium, AHA 2000
New Answers to the Old Old QuestionNew Answers to the Old Old QuestionNew Answers to the Old Old QuestionNew Answers to the Old Old Question
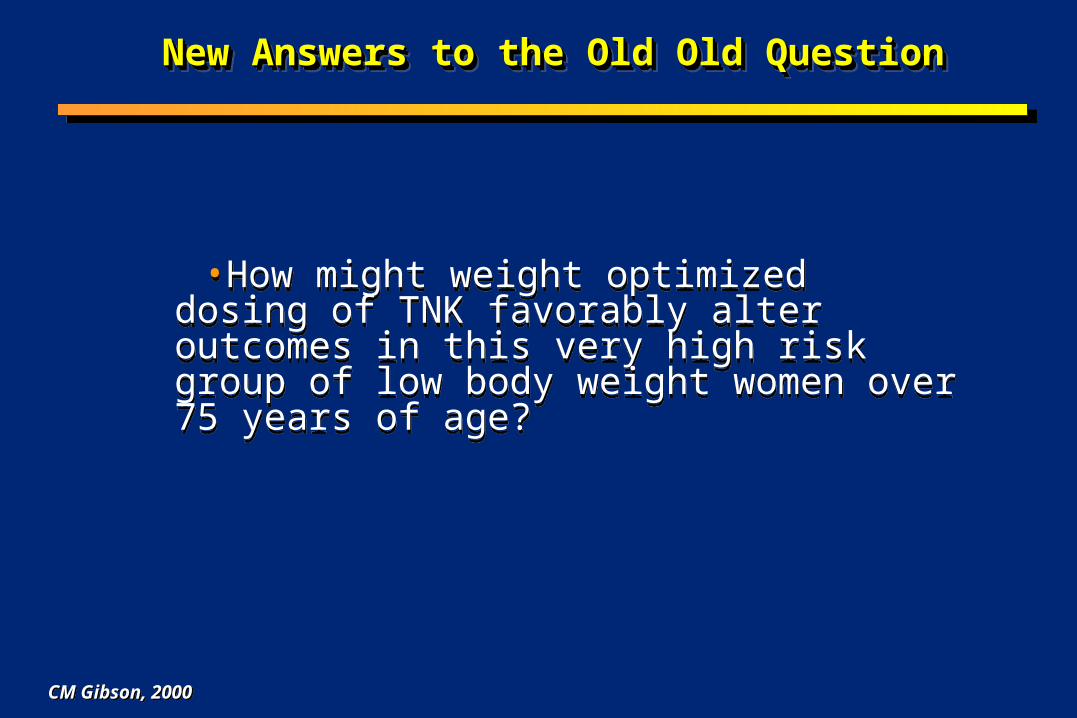
•How might weight optimized dosing of TNK favorably alter outcomes in this very high risk group of low body weight women over 75 years of age?
•How might weight optimized dosing of TNK favorably alter outcomes in this very high risk group of low body weight women over 75 years of age?
CM Gibson, 2000CM Gibson, 2000

Weight Optimizing Reduces ICH Rates : ASSENT IIWeight Optimizing Reduces ICH Rates : ASSENT II
1.72
2.62
1.77 1.78
1.44 1.41
0
0.5
1
1.5
2
2.5
3
>75 Female <67kg
TNKTNK TNKTNK TNKTNKtPAtPA tPAtPAtPAtPA
% o
f P
atie
nts
P=0.18
H Barron AHA 1999; Circulation 1999; 100: I-1H Barron AHA 1999; Circulation 1999; 100: I-1

ICH Rates Among Women > 75 Years who are < 67 Kg in ASSENT IIICH Rates Among Women > 75 Years who are < 67 Kg in ASSENT IIICH Rates Among Women > 75 Years who are < 67 Kg in ASSENT IIICH Rates Among Women > 75 Years who are < 67 Kg in ASSENT II
1.14
3.02
Pat
ien
ts (
%)
TNK-tPATNK-tPA tPAtPA
P <0.05
Weight Optimizing Reduces ICH Rates : ASSENT IIWeight Optimizing Reduces ICH Rates : ASSENT II
H Barron AHA 1999; Circulation 1999; 100: I-1H Barron AHA 1999; Circulation 1999; 100: I-1
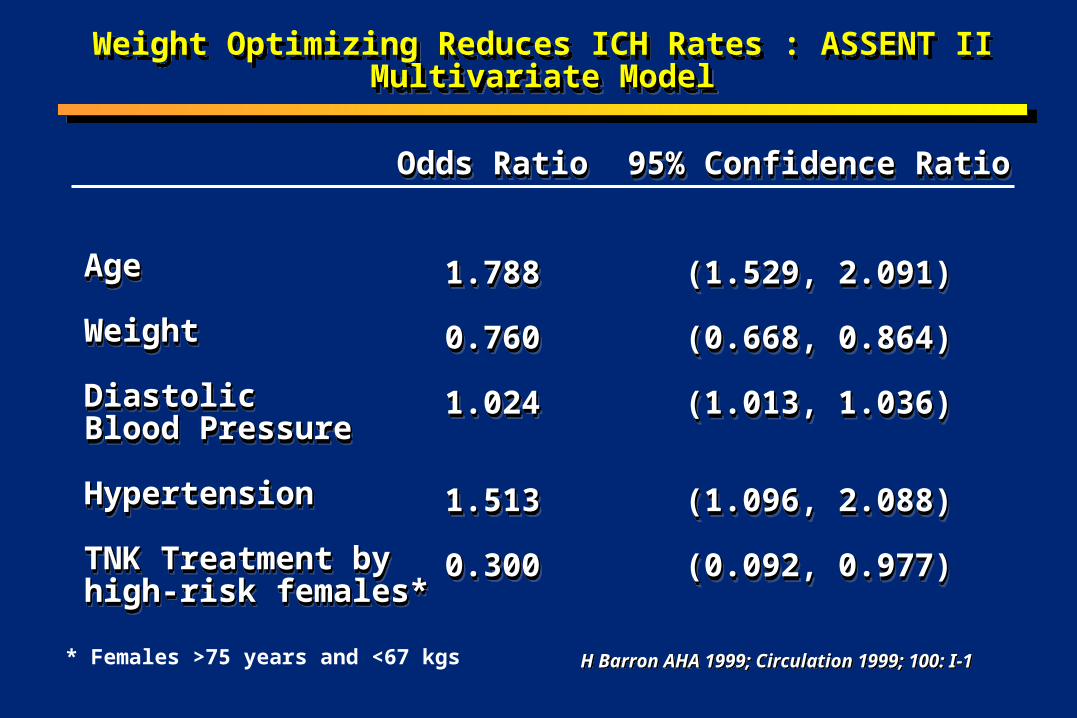
AgeAge
WeightWeight Diastolic Diastolic Blood Pressure Blood Pressure HypertensionHypertension TNK Treatment by TNK Treatment by high-risk females*high-risk females*
AgeAge
WeightWeight Diastolic Diastolic Blood Pressure Blood Pressure HypertensionHypertension TNK Treatment by TNK Treatment by high-risk females*high-risk females*
Odds RatioOdds Ratio
1.7881.788
0.7600.760
1.0241.024
1.5131.513
0.3000.300
Odds RatioOdds Ratio
1.7881.788
0.7600.760
1.0241.024
1.5131.513
0.3000.300
95% Confidence Ratio95% Confidence Ratio
(1.529, 2.091)(1.529, 2.091)
(0.668, 0.864)(0.668, 0.864)
(1.013, 1.036)(1.013, 1.036)
(1.096, 2.088)(1.096, 2.088)
(0.092, 0.977)(0.092, 0.977)
95% Confidence Ratio95% Confidence Ratio
(1.529, 2.091)(1.529, 2.091)
(0.668, 0.864)(0.668, 0.864)
(1.013, 1.036)(1.013, 1.036)
(1.096, 2.088)(1.096, 2.088)
(0.092, 0.977)(0.092, 0.977)
* Females >75 years and <67 kgs
Weight Optimizing Reduces ICH Rates : ASSENT II Multivariate ModelMultivariate Model
Weight Optimizing Reduces ICH Rates : ASSENT II Multivariate ModelMultivariate Model
H Barron AHA 1999; Circulation 1999; 100: I-1H Barron AHA 1999; Circulation 1999; 100: I-1

Weight Optimizing TNK Reduces the ICH Risk Among Weight Optimizing TNK Reduces the ICH Risk Among High Risk PatientsHigh Risk Patients
Weight Optimizing TNK Reduces the ICH Risk Among Weight Optimizing TNK Reduces the ICH Risk Among High Risk PatientsHigh Risk Patients
•In women > 75 years of age and < 67 kg weight optimizing TNK reduces the risk of ICH by 70% compared with t-PA
•In women > 75 years of age and < 67 kg weight optimizing TNK reduces the risk of ICH by 70% compared with t-PA
H Barron AHA 1999; Circulation 1999; 100: I-1H Barron AHA 1999; Circulation 1999; 100: I-1

70
81 82
6466
6870
7274
7678
8082
84
Open by 60 Min.
70
81 82
6466
6870
7274
7678
8082
84
Open by 60 Min.
Gibson CM, et al. Am J Cardiol. 1999;84:976-980.Gibson CM, et al. Am J Cardiol. 1999;84:976-980.
% o
f P
atie
nts
% o
f P
atie
nts
N=177N=177 N=178N=178 N=174N=174
Dose of 0.53 mg / kg selected for ASSENT 2 based upon logistic regression of Frame Count data
Dose of 0.53 mg / kg selected for ASSENT 2 based upon logistic regression of Frame Count data
p = 0.02 vs low dosep = 0.02 vs low dose
LowLow
MedMed HighHigh
Weight Optimized Dosing of TNK Improves Rate of Opening by 60 MinutesWeight Optimized Dosing of TNK Improves Rate of Opening by 60 MinutesWeight Optimized Dosing of TNK Improves Rate of Opening by 60 MinutesWeight Optimized Dosing of TNK Improves Rate of Opening by 60 Minutes
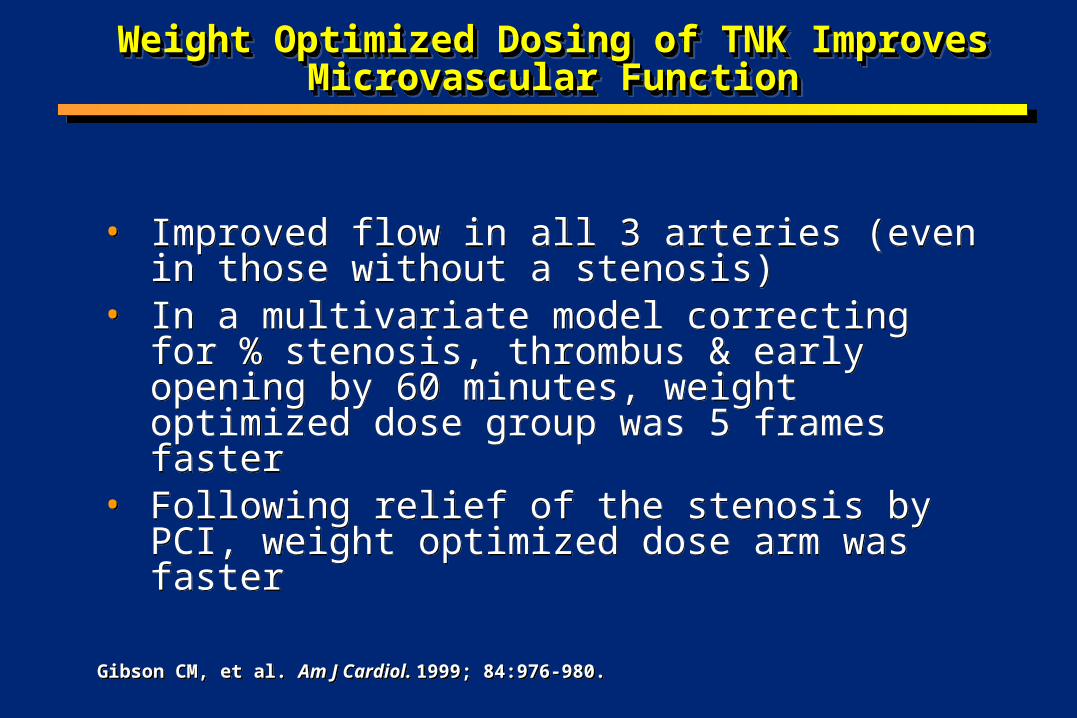
Weight Optimized Dosing of TNK Improves Weight Optimized Dosing of TNK Improves Microvascular FunctionMicrovascular Function
Weight Optimized Dosing of TNK Improves Weight Optimized Dosing of TNK Improves Microvascular FunctionMicrovascular Function
• Improved flow in all 3 arteries (even in those without a stenosis)
• In a multivariate model correcting for % stenosis, thrombus & early opening by 60 minutes, weight optimized dose group was 5 frames faster
• Following relief of the stenosis by PCI, weight optimized dose arm was faster
• Improved flow in all 3 arteries (even in those without a stenosis)
• In a multivariate model correcting for % stenosis, thrombus & early opening by 60 minutes, weight optimized dose group was 5 frames faster
• Following relief of the stenosis by PCI, weight optimized dose arm was faster
Gibson CM, et al. Am J Cardiol. 1999; 84:976-980.Gibson CM, et al. Am J Cardiol. 1999; 84:976-980.

t-PA-accelerated regimen(weight-adjusted)
t-PA-accelerated regimen(weight-adjusted)
TNK-tPA single bolus (weight-adjusted)
TNK-tPA single bolus (weight-adjusted)
Adapted from ASSENT-2 Investigators. Lancet. 1999;354:716-722.
Patients with AMI and ST-segment elevation, Patients with AMI and ST-segment elevation, symptom onset symptom onset 6 h (n = 16,950; 6 h (n = 16,950;
1,021 hospitals)1,021 hospitals)
Patients with AMI and ST-segment elevation, Patients with AMI and ST-segment elevation, symptom onset symptom onset 6 h (n = 16,950; 6 h (n = 16,950;
1,021 hospitals)1,021 hospitals)
Objective: demonstrate “equivalence”Objective: demonstrate “equivalence”Objective: demonstrate “equivalence”Objective: demonstrate “equivalence”
Primary endpoint: all-cause 30-day mortalityPrimary endpoint: all-cause 30-day mortalityPrimary endpoint: all-cause 30-day mortalityPrimary endpoint: all-cause 30-day mortality
Aspirin (150-325 mg)Aspirin (150-325 mg)IV heparinIV heparin
>67 kg: 5000-U bolus, 1000 U/h>67 kg: 5000-U bolus, 1000 U/h<67 kg: 4000-U bolus, 800 U/h<67 kg: 4000-U bolus, 800 U/h
Aspirin (150-325 mg)Aspirin (150-325 mg)IV heparinIV heparin
>67 kg: 5000-U bolus, 1000 U/h>67 kg: 5000-U bolus, 1000 U/h<67 kg: 4000-U bolus, 800 U/h<67 kg: 4000-U bolus, 800 U/h
RandomizationRandomizationRandomizationRandomization
ASSENT-2 Trial DesignASSENT-2 Trial DesignASSENT-2 Trial DesignASSENT-2 Trial Design

Superiority: Does the 95% CI contain zero?Superiority: Does the 95% CI contain zero?
Equivalence: Does the 95% CI lie between 1% and +1%?Equivalence: Does the 95% CI lie between 1% and +1%?
1%1%1%1% 0%0%0%0% +1%+1%+1%+1%
1%1%1%1% 0%0%0%0% +1%+1%+1%+1%
To left of To left of 1%1%is clinicallyis clinicallymeaningfulmeaningful
To left of To left of 1%1%is clinicallyis clinicallymeaningfulmeaningful
Between Between 1% and +1%1% and +1%is not clinicallyis not clinically
meaningfulmeaningful
Between Between 1% and +1%1% and +1%is not clinicallyis not clinically
meaningfulmeaningful
To right of To right of 1%1%is clinicallyis clinicallymeaningfulmeaningful
To right of To right of 1%1%is clinicallyis clinicallymeaningfulmeaningful
Understanding EquivalenceUnderstanding EquivalenceUnderstanding EquivalenceUnderstanding Equivalence
CM Gibson, 2000CM Gibson, 2000

-1 0 +1
MortalityMortality(%)(%)
AbsoluteAbsoluteDifferenceDifference(95% CI)(95% CI)
OtherOtherBetterBetter BetterBetter
PP Value for Value forEquivalenceEquivalence
InTIME-26.77 6.60
0.17(1.0, 0.68)
0.047
ASSENT-26.16 6.18
0.02(0.59, 0.62) 0.006
GUSTO-III7.47 7.24
0.23(1.11, 0.66)
NS
Comparison Among Equivalency Analyses for Comparison Among Equivalency Analyses for 30-Day Mortality 30-Day Mortality
Comparison Among Equivalency Analyses for Comparison Among Equivalency Analyses for 30-Day Mortality 30-Day Mortality
ASSENT-2 Investigators. Lancet. 1999;354:716-722; Adapted from GUSTO-III Investigators. N Engl J Med. 1997;337:1118-1123. Adapted from Giugliano RP, et al. Circulation. 1999;100:I-651.
n-PAn-PA
TNK-tPATNK-tPA
r-PAr-PA
t-PAt-PA
t-PAt-PA
t-PAt-PA
t-PAt-PA

Major Trials Comparing 30- or 35-Day Mortality Major Trials Comparing 30- or 35-Day Mortality Among Fibrinolytics Among Fibrinolytics
Major Trials Comparing 30- or 35-Day Mortality Major Trials Comparing 30- or 35-Day Mortality Among Fibrinolytics Among Fibrinolytics
12
9.2
7.4
6.37.2 7.5
9.59
6.6 6.776.15 6.17
0
2
4
6
8
10
12
ISIS-2 GUSTO-I GUSTO-III INJECT InTIME-2 ASSENT- 2
12
9.2
7.4
6.37.2 7.5
9.59
6.6 6.776.15 6.17
0
2
4
6
8
10
12
ISIS-2 GUSTO-I GUSTO-III INJECT InTIME-2 ASSENT- 2
SKSK SK t-PA SK t-PA SK r-PASK r-PAt-PA r-PAt-PA r-PA t-PA n-PA t-PA n-PAAgentsAgents
**
P=NSP=NS P=NSP=NS P=0.0003P=0.0003 P=0.006P=0.006
Mo
rta
lity
%M
ort
alit
y %
TNK -tPA
TNK -tPA PlaceboPlacebo t-PA t-PA
P=NSP=NS P=0.047P=0.0472P<0.000012P<0.00001 P=NSP=NS P=NSP=NSP=0.001P=0.001 P=NSP=NS
*Lower majorbleeds for TNK-tPA
(4.7% vs 5.9%; P=0.0002).
*Lower majorbleeds for TNK-tPA
(4.7% vs 5.9%; P=0.0002).
Equivalency:Equivalency:P=NSP=NS
Equivalency DemonstratedEquivalency
DemonstratedSuperiority
DemonstratedSuperiority
Demonstrated
Superiority:Superiority:
*Higher ICHrate for n-PA
(0.62% vs 1.13%;P=0.003).
*Higher ICHrate for n-PA
(0.62% vs 1.13%;P=0.003).CM Gibson, 2000CM Gibson, 2000

Age (years)Age (years)
<75<75
>75>75
4.6 4.6
17.417.4
4.3 4.3
19.319.3
1.063 (0.915-1.235)1.063 (0.915-1.235)
0.903 (0.754-1.081)0.903 (0.754-1.081)
0.4250.425
0.2860.286
SexSex
MaleMale
FemaleFemale
5.0 5.0
10.010.0
4.84.8
10.610.6
1.039 (0.894-1.209)1.039 (0.894-1.209)
0.943 (0.784-1.134)0.943 (0.784-1.134)
0.6270.627
0.5630.563
ASSENT-2: 30-Day Mortality By Age and SexASSENT-2: 30-Day Mortality By Age and SexASSENT-2: 30-Day Mortality By Age and SexASSENT-2: 30-Day Mortality By Age and Sex
TNK-tPATNK-tPATNK-tPATNK-tPA(n=8,461)(n=8,461)(n=8,461)(n=8,461)
t-PAt-PAt-PAt-PA(n=8,488)(n=8,488)(n=8,488)(n=8,488)
Relative RiskRelative RiskRelative RiskRelative Risk(95% CI)(95% CI)(95% CI)(95% CI) ValueValue ValueValuePPPP
ASSENT-2 Investigators. Lancet. 1999;354:716-722.ASSENT-2 Investigators. Lancet. 1999;354:716-722.

Infarct locationInfarct location
AnteriorAnteriorOtherOther
8.08.05.05.0
8.28.24.84.8
0.975 (0.830-1.146)0.975 (0.830-1.146)1.026 (0.865-1.218)1.026 (0.865-1.218)
0.7890.7890.7830.783
Previous AMIPrevious AMI
YesYesNoNo
9.89.8
5.55.58.68.6
5.75.7
1.137 (0.897-1.441)1.137 (0.897-1.441)
0.965 (0.843-1.105)0.965 (0.843-1.105)
0.3180.318
0.6090.609
Previous CABGPrevious CABG
YesYesNoNo
9.89.86.06.0
7.77.76.16.1
1.280 (0.776-2.111)1.280 (0.776-2.111)0.987 (0.875-1.115)0.987 (0.875-1.115)
0.4060.4060.8440.844
ASSENT-2 Investigators. Lancet. 1999;354:716-722.ASSENT-2 Investigators. Lancet. 1999;354:716-722.
ASSENT-2: 30-Day Mortality By Infarct Location, Previous AMI, or Previous CABG; ASSENT-2: 30-Day Mortality By Infarct Location, Previous AMI, or Previous CABG; Killip Class; and History of Hypertension or DiabetesKillip Class; and History of Hypertension or Diabetes
ASSENT-2: 30-Day Mortality By Infarct Location, Previous AMI, or Previous CABG; ASSENT-2: 30-Day Mortality By Infarct Location, Previous AMI, or Previous CABG; Killip Class; and History of Hypertension or DiabetesKillip Class; and History of Hypertension or Diabetes
TNK-tPATNK-tPA(n=8,461)(n=8,461)TNK-tPATNK-tPA(n=8,461)(n=8,461)
t-PAt-PA(n=8,488)(n=8,488)
t-PAt-PA(n=8,488)(n=8,488)
Relative RiskRelative Risk(95% CI)(95% CI)
Relative RiskRelative Risk(95% CI)(95% CI) PP Value Value PP Value Value
IIIIIIIIIIIIIVIV
4.74.713.513.529.029.051.451.4
4.84.813.413.424.524.561.161.1
0.983 (0.851-1.134)0.983 (0.851-1.134)1.011 (0.797-1.281)1.011 (0.797-1.281)1.185 (0.740-1.899)1.185 (0.740-1.899)0.842 (0.556-1.273)0.842 (0.556-1.273)
0.8180.8180.9440.9440.5160.5160.4770.477
HypertensionHypertension
YesYesNoNo
8.08.0
5.05.07.67.6
5.25.21.050 (0.888-1.241)1.050 (0.888-1.241)
0.962 (0.816-1.135)0.962 (0.816-1.135)0.5780.578
0.6570.657
DiabetesDiabetes
YesYesNoNo
8.88.8
5.65.68.78.7
5.75.71.002 (0.786-1.278)1.002 (0.786-1.278)
0.993 (0.868-1.136)0.993 (0.868-1.136)1.0001.000
0.9420.942
Killip ClassKillip Class

TNK-tPATNK-tPA(n=8,461)(n=8,461)
t-PAt-PA(n=8,488)(n=8,488)
Relative RiskRelative Risk(95% CI)(95% CI)
TNK-tPATNK-tPABetterBetter
t-PAt-PABetterBetter
PP Value Value
Total population (%) 6.16 6.18 1.00
(0.89, 1.12) 0.975
Time to therapy (h)
0-2 (%) 5.0 4.9 1.017(0.799 - 1.296) 0.897
>2-4 (%) 6.3 5.51.157
(0.970, 1.379)0.106
>4 (%) 7.0 9.2 0.766(0.617. 0.952) 0.018
0.40.4 11 1.41.4ASSENT-2 Investigators. Lancet. 1999;354:716-722.
ASSENT-2: Improved Survival forASSENT-2: Improved Survival forTNK-tPA in Late-Treated PatientsTNK-tPA in Late-Treated PatientsASSENT-2: Improved Survival forASSENT-2: Improved Survival forTNK-tPA in Late-Treated PatientsTNK-tPA in Late-Treated Patients

Cannon CP, Gibson CM, McCabe CH et al. Circulation. 1998;98:2805-2814.Cannon CP, Gibson CM, McCabe CH et al. Circulation. 1998;98:2805-2814.
Pe
rce
nt
Ch
an
ge
s in
Pa
ram
ete
rs(m
edia
n)
Pe
rce
nt
Ch
an
ge
s in
Pa
ram
ete
rs(m
edia
n)
TIMI-10B: Clinical Evidence of Increased Fibrin Specificity in TIMI-10B: Clinical Evidence of Increased Fibrin Specificity in TNK-tPA TNK-tPA
TIMI-10B: Clinical Evidence of Increased Fibrin Specificity in TIMI-10B: Clinical Evidence of Increased Fibrin Specificity in TNK-tPA TNK-tPA
-50
-40
-30
-20
-10
0
0 3 6
-50
-40
-30
-20
-10
0
0 3 6
AA
AAAA
50505050
5050
3030
3030
3030
4040
40404040
-60
-50
-40
-30
-20
-10
0
0 3 6
-60
-50
-40
-30
-20
-10
0
0 3 6
AA AAAA
50505050
5050
3030 3030 3030
40404040
4040
11 11
Hours Post-DoseHours Post-DoseHours Post-DoseHours Post-Dose
FibrinogenFibrinogen PlasminogenPlasminogen
TNK-tPATNK-tPA
TNK-tPATNK-tPA
alteplase (t-PA)alteplase (t-PA) alteplase (t-PA)alteplase (t-PA)

TNK-tPATNK-tPATNK-tPATNK-tPA(n=8,461)(n=8,461)(n=8,461)(n=8,461)
t-PAt-PAt-PAt-PA(n=8,488)(n=8,488)(n=8,488)(n=8,488) PP Value ValuePP Value Value
Total bleeds (%)Total bleeds (%) 26.426.4 29.029.0 0.00030.0003
Major bleeds (%)Major bleeds (%) 4.74.7 5.95.9 0.00020.0002
Minor bleeds (%)Minor bleeds (%) 21.821.8 23.023.0 0.05530.0553
Units transfusedUnits transfusedAnyAny
1-2 units1-2 units>2 units>2 units
4.34.32.62.61.71.7
5.55.53.23.22.22.2
0.00020.0002----
ASSENT-2: Significantly Fewer Noncerebral Bleeding Events ASSENT-2: Significantly Fewer Noncerebral Bleeding Events With TNK-tPAWith TNK-tPA
ASSENT-2: Significantly Fewer Noncerebral Bleeding Events ASSENT-2: Significantly Fewer Noncerebral Bleeding Events With TNK-tPAWith TNK-tPA
ASSENT-2 Investigators. Lancet. 1999;354:716-722.ASSENT-2 Investigators. Lancet. 1999;354:716-722.

How Does Weight Optimized Dosing Improve Patient Care?How Does Weight Optimized Dosing Improve Patient Care?How Does Weight Optimized Dosing Improve Patient Care?How Does Weight Optimized Dosing Improve Patient Care?
• Improves efficacy (earlier & better flow, less thrombus, less stenosis & better outcomes) in heavier patients
• Improves safety (lower intracranial hemorrhage) in high risk patients
• Improves efficacy (earlier & better flow, less thrombus, less stenosis & better outcomes) in heavier patients
• Improves safety (lower intracranial hemorrhage) in high risk patients
CM Gibson, GW symposium, AHA 2000CM Gibson, GW symposium, AHA 2000

Why Not Use a Fixed 40 mg Dose in All Patients?
In light patients: These patients receive relatively more drug. Weight optimized dosing may reduce the risk of serious bleeding events and reduce the risk of intracranial hemorrhage rate in lower-weight patients.
In light patients: These patients receive relatively more drug. Weight optimized dosing may reduce the risk of serious bleeding events and reduce the risk of intracranial hemorrhage rate in lower-weight patients.
In heavy patients: These patients receive relatively less drug. Weight optimized dosing may improve rates of TIMI grade 3 flow & TIMI Frame Counts, and thereby lower mortality.
In heavy patients: These patients receive relatively less drug. Weight optimized dosing may improve rates of TIMI grade 3 flow & TIMI Frame Counts, and thereby lower mortality.
CM Gibson, GW symposium, AHA 2000CM Gibson, GW symposium, AHA 2000

Other Acute MI Regimens Use Weight Adjusted DosingOther Acute MI Regimens Use Weight Adjusted DosingOther Acute MI Regimens Use Weight Adjusted DosingOther Acute MI Regimens Use Weight Adjusted Dosing
•Heparin•Reopro•Integrilin•Aggrastat•Low Molecular weight heparinoids•Dopamine, dobutamine•As TNK is combined with heparin &
glycoprotein 2b3a inhibitors, safety & efficacy will hopefully be improved as a result of weight optimized dosing
•Heparin•Reopro•Integrilin•Aggrastat•Low Molecular weight heparinoids•Dopamine, dobutamine•As TNK is combined with heparin &
glycoprotein 2b3a inhibitors, safety & efficacy will hopefully be improved as a result of weight optimized dosing
CM Gibson, GW symposium, AHA 2000CM Gibson, GW symposium, AHA 2000

TNK-tPA Dosing RegimenTNK-tPA Dosing RegimenTNK-tPA Dosing RegimenTNK-tPA Dosing Regimen
Dosing categories are about 22 lb wide– Minimizes the possibility of dosing errors
< 60 kg (< 132 lbs) 6 mL61 - 70 kg (133-154 lbs) 7 mL71 - 80 kg (155-176 lbs) 8 mL81 - 90 kg (177-198 lbs) 9 mL > 90 kg (> 199 lbs) 10 mL
Dosing categories are about 22 lb wide– Minimizes the possibility of dosing errors
< 60 kg (< 132 lbs) 6 mL61 - 70 kg (133-154 lbs) 7 mL71 - 80 kg (155-176 lbs) 8 mL81 - 90 kg (177-198 lbs) 9 mL > 90 kg (> 199 lbs) 10 mL

Confusion in Reperfusion: Dose ErrorsConfusion in Reperfusion: Dose ErrorsConfusion in Reperfusion: Dose ErrorsConfusion in Reperfusion: Dose Errors
• Do dose errors cause death ?
Or
• Does death cause dose errors ?
• Do dose errors cause death ?
Or
• Does death cause dose errors ?
CM Gibson, GW symposium, AHA 2000CM Gibson, GW symposium, AHA 2000

Dosing Errors to be StudiedDosing Errors to be StudiedDosing Errors to be StudiedDosing Errors to be Studied
•Timing of dose– No potential for error with a single bolus agent such as
TNK
•Duration of injection– Little or no real potential for error with a 5 second
administration of TNK
•Compatibility with other drugs– Little potential for error with TNK
•Timing of dose– No potential for error with a single bolus agent such as
TNK
•Duration of injection– Little or no real potential for error with a 5 second
administration of TNK
•Compatibility with other drugs– Little potential for error with TNK
CM Gibson, GW symposium, AHA 2000CM Gibson, GW symposium, AHA 2000

Two Common Questions Asked About the 50 mg Dose of TNKTwo Common Questions Asked About the 50 mg Dose of TNKTwo Common Questions Asked About the 50 mg Dose of TNKTwo Common Questions Asked About the 50 mg Dose of TNK
•Is the 50 mg dose safe? Is there an excess risk of intracranial hemorrhage and bleeding associated with 50 mg?
•Is the 50 mg dose efficacious? Is 50 mg of TNK in heavy patients (I.e. those > 90 Kg) adequate? In other words, are very heavy patients being “under dosed”?
•Is the 50 mg dose safe? Is there an excess risk of intracranial hemorrhage and bleeding associated with 50 mg?
•Is the 50 mg dose efficacious? Is 50 mg of TNK in heavy patients (I.e. those > 90 Kg) adequate? In other words, are very heavy patients being “under dosed”?
CM Gibson, GW symposium, AHA 2000CM Gibson, GW symposium, AHA 2000

•In TIMI 10B, 50 mg of TNK was given to patients of all weights
•In ASSENT 2, 50 mg of TNK was given only to patients weighing over 90 Kg
•In TIMI 10B, 50 mg of TNK was given to patients of all weights
•In ASSENT 2, 50 mg of TNK was given only to patients weighing over 90 Kg
Safety and Efficacy of 50 mg of TNKSafety and Efficacy of 50 mg of TNKSafety and Efficacy of 50 mg of TNKSafety and Efficacy of 50 mg of TNK
Differences Between TIMI 10B and ASSENT 2Differences Between TIMI 10B and ASSENT 2Differences Between TIMI 10B and ASSENT 2Differences Between TIMI 10B and ASSENT 2
CM Gibson, GW symposium, AHA 2000CM Gibson, GW symposium, AHA 2000

<60 kg11%
61-70 kg17%
71-80 kg25%
81-90 kg25%
>90 kg22%
<60 kg11%
61-70 kg17%
71-80 kg25%
81-90 kg25%
>90 kg22%
• In TIMI 10B there were a small number of patients (78) who received 50 mg of TNK, the majority of whom were of lighter weights (under 90 Kg)
• Only 22.4% of pts. in TIMI 10B weighed > 90 Kg, the weight required for therapy with 50 mg of TNK in ASSENT 2 & in clinical practice
• In TIMI 10B there were a small number of patients (78) who received 50 mg of TNK, the majority of whom were of lighter weights (under 90 Kg)
• Only 22.4% of pts. in TIMI 10B weighed > 90 Kg, the weight required for therapy with 50 mg of TNK in ASSENT 2 & in clinical practice
Wide Range of Weights Among Pts. Given 50 mg TNK in TIMI 10BWide Range of Weights Among Pts. Given 50 mg TNK in TIMI 10BWide Range of Weights Among Pts. Given 50 mg TNK in TIMI 10BWide Range of Weights Among Pts. Given 50 mg TNK in TIMI 10B
CM Gibson, GW symposium, AHA 2000CM Gibson, GW symposium, AHA 2000

Differences Between TIMI 10B and ASSENT 2 in Examining the Differences Between TIMI 10B and ASSENT 2 in Examining the Safety and Efficacy of 50 mg of TNKSafety and Efficacy of 50 mg of TNK
Differences Between TIMI 10B and ASSENT 2 in Examining the Differences Between TIMI 10B and ASSENT 2 in Examining the Safety and Efficacy of 50 mg of TNKSafety and Efficacy of 50 mg of TNK
•In TIMI 10B, only 78 patients received 50 mg of TNK•There were 3 intracranial hemorrhages•None of the patients in TIMI 10 B with an intracranial
hemorrhage weighed over 90 Kg (mean wt. only 77.2 Kg)*•These 3 patients all weighed < 90 Kg, and none of them
would have received 50mg as a weight adjusted dose in ASSENT 2 or in clinical practice
•There were 9 major hemorrhages, and only 1 patient weighed over 90 Kg*
•Thus, 89%* of all patients (8/9) who developed a major hemorrhages at the 50mg dose would not have received this dose had they been enrolled in the ASSENT 2 trial or treated in clinical practice
•This was in part the motivation for weight adjusting the dose of TNK
CM Gibson, GW symposium, AHA 2000CM Gibson, GW symposium, AHA 2000

ASSENT-2: Outcomes With 50 mg TNK ASSENT-2: Outcomes With 50 mg TNK vs Lower Doses of TNKvs Lower Doses of TNK
ASSENT-2: Outcomes With 50 mg TNK ASSENT-2: Outcomes With 50 mg TNK vs Lower Doses of TNKvs Lower Doses of TNK
0.57
4.7
1.07
6.4
0
1
2
3
4
5
6
7
ICH Death
%
50 mg
< 50 mg
P = 0.06
P = 0.006
• Mortality and ICH were both lower with the 50 mg dose
• The difference in outcome, however, is not significant when adjusting for multiple variables including weight
• Mortality and ICH were both lower with the 50 mg dose
• The difference in outcome, however, is not significant when adjusting for multiple variables including weight
Alexander et al, AHA 2000Alexander et al, AHA 2000

Treatment With 50 mg TNK is Associated with low ICH Rates:Treatment With 50 mg TNK is Associated with low ICH Rates:Major Trials Comparing Intracranial Hemorrhage Rates Among FibrinolyticsMajor Trials Comparing Intracranial Hemorrhage Rates Among Fibrinolytics
Treatment With 50 mg TNK is Associated with low ICH Rates:Treatment With 50 mg TNK is Associated with low ICH Rates:Major Trials Comparing Intracranial Hemorrhage Rates Among FibrinolyticsMajor Trials Comparing Intracranial Hemorrhage Rates Among Fibrinolytics
0.94
0.62
0.87
0.37
00.1
0.77
0.91
1.13
0.93
0
0.2
0.4
0.6
0.8
1
1.2
ISIS-2 INJECT GUSTO-III InTIME-II ASSENT-2
Placebo SKPlacebo SK SK r-PA SK r-PA t-PA r-PAt-PA r-PA t-PA n-PAt-PA n-PA t-PAt-PA
P =NSP =NS
2P<0.022P<0.02
P=NSP=NS
P=NSP=NS
P=0.003P=0.003
ICH
(%
)
TNK tPA TNK tPA
50 mg TNK in
ASSENT 2
0.57*
Califf RM, et al. Am Heart J. 1997;133:630-639; ISIS-2 Collaborative Group. Lancet. 1988;2:349-360; GUSTO III Investigators. N Engl J Med. 1997;337:1118-1123; INJECT. Lancet. 1995;346:329-336; Van de Werf F, et al. ACC 1999 CME Online. 1999;1-12. *Data on file, Genentech
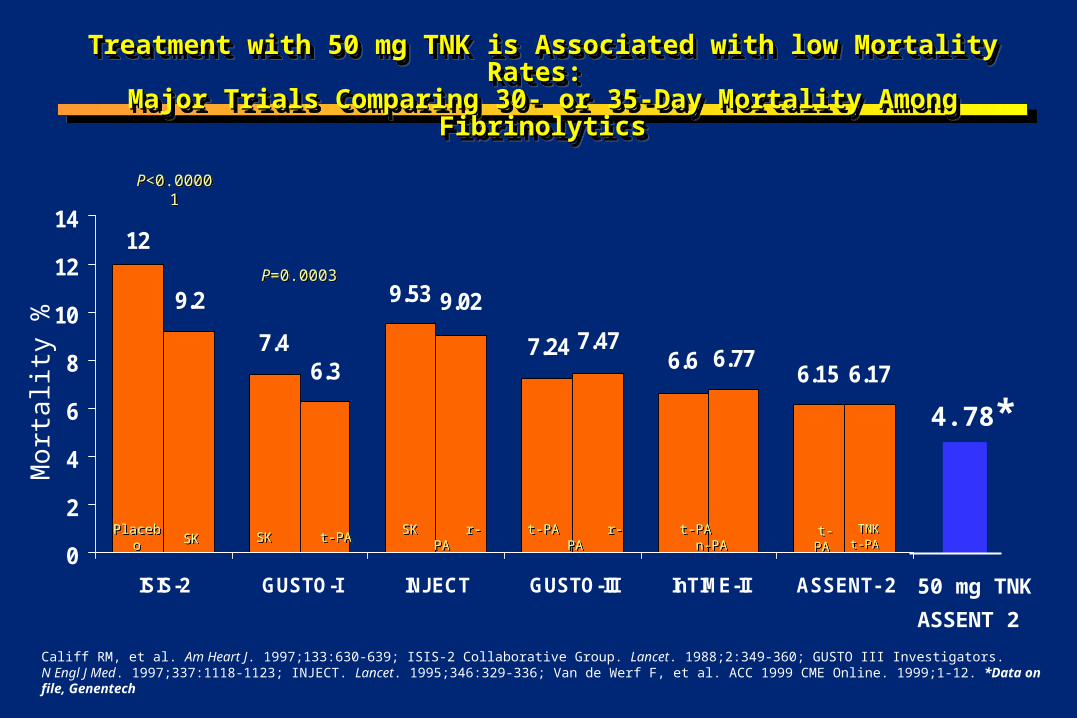
Treatment with 50 mg TNK is Associated with low Mortality Rates: Treatment with 50 mg TNK is Associated with low Mortality Rates: Major Trials Comparing 30- or 35-Day Mortality Among FibrinolyticsMajor Trials Comparing 30- or 35-Day Mortality Among FibrinolyticsTreatment with 50 mg TNK is Associated with low Mortality Rates: Treatment with 50 mg TNK is Associated with low Mortality Rates: Major Trials Comparing 30- or 35-Day Mortality Among FibrinolyticsMajor Trials Comparing 30- or 35-Day Mortality Among Fibrinolytics
6.156.6
7.24
9.53
12
7.4
9.2
6.3
9.02
7.47
6.176.77
0
2
4
6
8
10
12
14
ISIS-2 GUSTO-I INJECT GUSTO-III InTIME-II ASSENT- 2
SKSK SK t-PASK t-PA SK r-PASK r-PA t-PA r-PAt-PA r-PA t-PA n-PA t-PA n-PA
P<0.00001P<0.00001
P=0.0003P=0.0003
Mo
rta
lity
%
TNK t-PA
TNK t-PA PlaceboPlacebo t-PA t-PA
50 mg TNK
ASSENT 2
4.78*
Califf RM, et al. Am Heart J. 1997;133:630-639; ISIS-2 Collaborative Group. Lancet. 1988;2:349-360; GUSTO III Investigators. N Engl J Med. 1997;337:1118-1123; INJECT. Lancet. 1995;346:329-336; Van de Werf F, et al. ACC 1999 CME Online. 1999;1-12. *Data on file, Genentech

Is 50 mg of TNK Administered to Patients with an Is 50 mg of TNK Administered to Patients with an Estimated Weight > 90 Kg Both Safe & Effective?Estimated Weight > 90 Kg Both Safe & Effective?Is 50 mg of TNK Administered to Patients with an Is 50 mg of TNK Administered to Patients with an Estimated Weight > 90 Kg Both Safe & Effective?Estimated Weight > 90 Kg Both Safe & Effective?
It is safe:Using the dose schedule in ASSENT 2 (I.e. 50 mg TNK for pts. with estimated
wt. > 90 Kg):
Risk of ICH in TIMI 10B: 0.0%*Risk of ICH in ASSENT 2: 0.57%*Risk of ICH in TIMI 10B & ASSENT 2 combined: 0.566%*
It is effective:Risk of mortality was 4.78% in pts. treated with 50 mg in ASSENT 2,which compares favorably with the 6.18% rate among all patients in the ASSENT 2 study*The 4.78%* mortality observed among the subgroup of pts. treated
with 50 mg of TNK is the lowest mortality rate observed among recent thrombolytic trials
CM Gibson, GW symposium, AHA 2000CM Gibson, GW symposium, AHA 2000

Therapeutic Margin of Weight Adjusted Dosing of TNKTherapeutic Margin of Weight Adjusted Dosing of TNKTherapeutic Margin of Weight Adjusted Dosing of TNKTherapeutic Margin of Weight Adjusted Dosing of TNK
• Questions have been raised about the “margin for error” with weight optimized dosing of TNK
• What if the estimated weight is off by 10 Kg (22 pounds) which would be one dose category? What if the weight estimate is off by 2 weight categories (20 Kg or 44 pounds)?
• Is this safe? Dose this pose an undue risk of ICH?
CM Gibson, GW symposium, AHA 2000CM Gibson, GW symposium, AHA 2000

Low Body Weight As A Risk Factor For Adverse OutcomesLow Body Weight As A Risk Factor For Adverse OutcomesLow Body Weight As A Risk Factor For Adverse OutcomesLow Body Weight As A Risk Factor For Adverse Outcomes
• Low Body weight has been identified as a risk factor for adverse outcomes following thrombolytic administration, even when the dose is administered correctly
• Low body weight is a risk factor for adverse outcomes in primary PTCA patients
• Low body weight is a risk factor for adverse outcomes even among patients who receive no reperfusion strategy
CM Gibson, GW symposium, AHA 2000CM Gibson, GW symposium, AHA 2000

•Thus, low body weight is a potential confounder in the analysis of dose errors. Low body weight patients may be more likely to receive excess dosing of a drug, but may simultaneously be at risk for adverse outcomes simply on the basis of their low body weight alone
• The question becomes “Is it the low body weight of the patient or the dose error that resulted in an adverse outcome” ?
• To answer this question body weight must be accounted for in the analysis of dose errors
Low Body Weight As A Risk Factor For Adverse OutcomesLow Body Weight As A Risk Factor For Adverse OutcomesLow Body Weight As A Risk Factor For Adverse OutcomesLow Body Weight As A Risk Factor For Adverse Outcomes
CM Gibson, GW symposium, AHA 2000CM Gibson, GW symposium, AHA 2000

Margin of Safety with TNK OverdosesMargin of Safety with TNK Overdoses Margin of Safety with TNK OverdosesMargin of Safety with TNK Overdoses
• Across all dose arms, if an overdose error of 1 to 2 dose categories (up to 20 Kg, 44 pounds) was made, the odds ratio for ICH and death were no different than in the trial as a whole in a multivariate model adjusting for patient weight
•TNK has a broad therapeutic margin of safety and errors of estimating weight by up to 20 Kg or 44 pounds are well tolerated with no increased risk of ICH or death
CM Gibson, GW symposium, AHA 2000CM Gibson, GW symposium, AHA 2000

Association Between Recording of Weight on Case Report Association Between Recording of Weight on Case Report Form and MortalityForm and Mortality
Association Between Recording of Weight on Case Report Association Between Recording of Weight on Case Report Form and MortalityForm and Mortality
0
2
4
6
8
10
12
Trial as aWhole
WeightMissing
6.16%6.16%
10.1%10.1%
Mo
rta
lity
Mo
rta
lity
Recently concerns have been expressed regarding the need to weigh patients prior to administration of a thrombolytic agent.
Dosing in ASSENT 2 was based upon either estimated or actual weights
Patients with missing weights had a higher mortality
Is this a cause of a higher mortality, or is it a marker of a sicker patient or a patient who died before being weighed?

Among rPA Treated Patients Missing Weight is Associated with Among rPA Treated Patients Missing Weight is Associated with Higher Mortality: A Textbook Case of Statistical ConfoundingHigher Mortality: A Textbook Case of Statistical Confounding
Among rPA Treated Patients Missing Weight is Associated with Among rPA Treated Patients Missing Weight is Associated with Higher Mortality: A Textbook Case of Statistical ConfoundingHigher Mortality: A Textbook Case of Statistical Confounding
0
5
10
15
20
25
•Mortality highest if no weight recorded•No biologically plausible reason why there should be a higher mortality among patients receiving a fixed lytic dose in whom no weight was recorded• Likely explanation is statistical confounding: Missing weight is a marker of a sicker patient, or the patient died before weight obtained
Mo
rtal
ity
(%)
FDA PLA 95-1167, July 15, 1996, page 33
10.2%
16.3%
19.5%
Weight not recorded in 11% of INJECT Trial patients
Deaths N = 242 N = 48 N = 65
> 60 Kg < 60 Kg Missingweight

Weight Optimized Dosing of TNK: The AdvantagesWeight Optimized Dosing of TNK: The AdvantagesWeight Optimized Dosing of TNK: The AdvantagesWeight Optimized Dosing of TNK: The Advantages
•TNK dosing is optimized for the patient’s weight so that flow at 90 minutes after its administration is accelerated•Weight optimized dosing also improves flow after PTCA / stenting and “facilitates PCI”•Weight optimizing TNK dosing improves microvascular function and flow in all 3 arteries•While dose is optimized, the range of weights for a given dose is 22 pounds or 10 Kg, which may minimize dosing errors•TNK is a single dose agent, TNK is compatible with other medications such as heparin (other lytics may precipitate)•TNK is the only agent to demonstrate equivalency to tPA with an acceptable safety profile•Weight adjusted dosing of TNK is safe, efficacious, and has a favorable therapeutic margin of safety if errors are made•Indeed the safety profile is improved: the risk of bleeding and transfusion is reduced
•TNK dosing is optimized for the patient’s weight so that flow at 90 minutes after its administration is accelerated•Weight optimized dosing also improves flow after PTCA / stenting and “facilitates PCI”•Weight optimizing TNK dosing improves microvascular function and flow in all 3 arteries•While dose is optimized, the range of weights for a given dose is 22 pounds or 10 Kg, which may minimize dosing errors•TNK is a single dose agent, TNK is compatible with other medications such as heparin (other lytics may precipitate)•TNK is the only agent to demonstrate equivalency to tPA with an acceptable safety profile•Weight adjusted dosing of TNK is safe, efficacious, and has a favorable therapeutic margin of safety if errors are made•Indeed the safety profile is improved: the risk of bleeding and transfusion is reduced
CM Gibson, GW symposium, AHA 2000CM Gibson, GW symposium, AHA 2000