Embed Size (px)
Citation preview

Ghrelin as a biomarker for nutritional and
inflammatory status in patients on maintenance
hemodialysishemodialysis
N. Vanitha Rani
Lecturer, Dept. of Pharmacy Practice
Faculty of Pharmacy
Sri Ramachandra University

1. Dr. S. Kavimani
Prof. & Head, Dept. of Pharmacology, Mother
Theresa Institute of Post Graduate Studies,
Pondicherry
Co-authors
2. Dr. P. Soundararajan
Prof. & Head, Dept. of Nephrology, SRU
3. Dr. D. Chamundeeswari
Principal, Faculty of Pharmacy, SRU
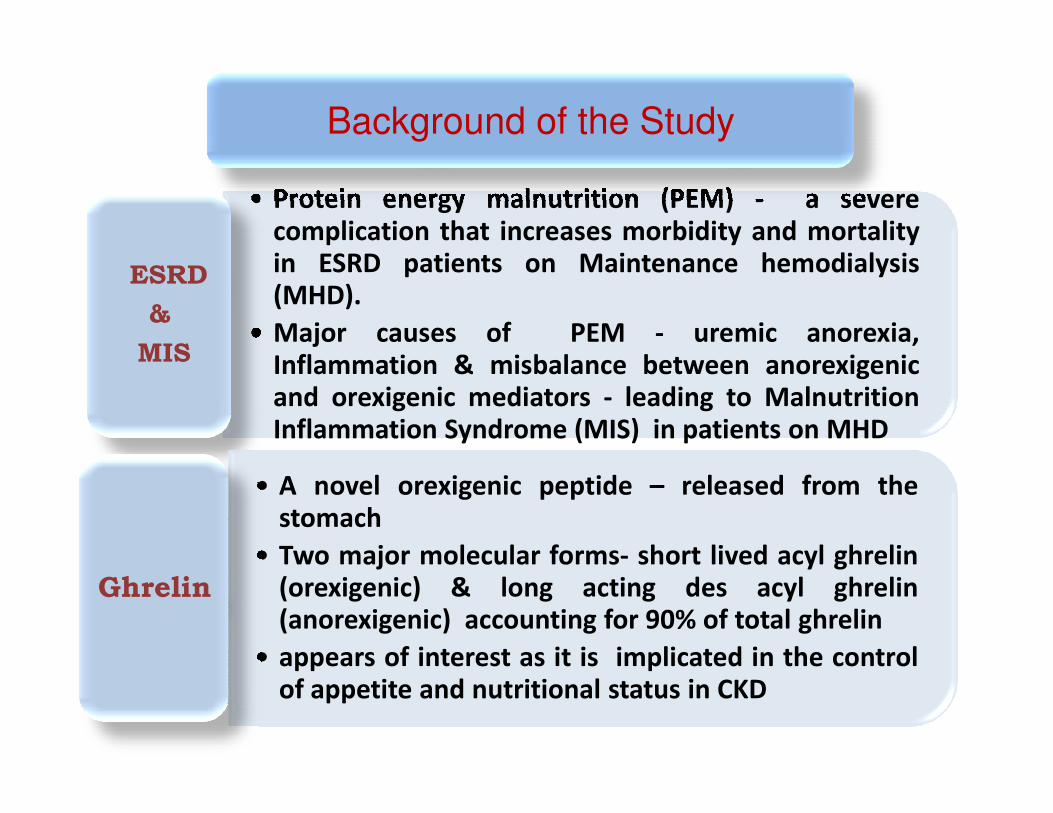
• Protein energy malnutrition (PEM) - a severe
complication that increases morbidity and mortality
in ESRD patients on Maintenance hemodialysis
(MHD).
• Major causes of PEM - uremic anorexia,
Inflammation & misbalance between anorexigenic
and orexigenic mediators - leading to Malnutrition
ESRD
&
MIS
Background of the Study
and orexigenic mediators - leading to Malnutrition
Inflammation Syndrome (MIS) in patients on MHD
• A novel orexigenic peptide – released from the
stomach
• Two major molecular forms- short lived acyl ghrelin
(orexigenic) & long acting des acyl ghrelin
(anorexigenic) accounting for 90% of total ghrelin
• appears of interest as it is implicated in the control
of appetite and nutritional status in CKD
Ghrelin

Elevated plasma ghrelin in PD, the
anorexic patients showing a lower
levels than that of the obese and
patients with normal appetite.-
Aguilera et al
Ghrelin is degraded in the kidney.
A significantly higher total ghrelin levels in
MHD Patients- Ayala et al
One fifth increase in the plasma levels of
ghrelin in MHD patients than the healthy
control in contrast to the strong tendency
for anorexia in MHD. This suggests
Literature …..
Ghrelin is degraded in the kidney.
Elevated total ghrelin levels in CKD is
due to decreased degradation of
ghrelin. Increase in the levels of des
acyl ghrelin and decrease in acyl
ghrelin – Muscaritoli et al
Mafra et al reported a similar finding
and suggest a potential association
between this finding and
inflammation
for anorexia in MHD. This suggests
ghrelin resistance in MHD either
peripheral, central or both. -Chang et al
A strong and consistent association
between anorexia and high levels of
inflammatory mediators in MHD. Pro
inflammatory cytokines TNF –alpha and
interleukin 6 are uremic toxins, act on
CNS and inhibit appetite, increase leptin
levels – Kalantar Zadeh et al.

To assess the inflammatory status of the study population (serum
To assess the nutritional status by anthropomery, Modified Subjective Global Assessment Score and biochemical markers of nutrition (serum hemoglobin & albumin levels) in CKD patients on MHD
Objectives
To correlate the serum levels of total ghrelin with serum inflammatory markers and with the nutritional status in study population
To assess the inflammatory status of the study population (serum TNF -alpha and hs CRP levels)

• Cross sectional Case control studyStudy design
• Dialysis Unit, Sri Ramachandra Medical Center and hospital
Study site
Methodology
• Cases - 90 patients of either sex, aged above 18 yrs, with stage V CKD, on twice/thrice weekly MHD for > 6 months
• Exclusion criteria: Patients with inflammatory diseases, uncontrolled DM, smoking history, acute illness, long term therapy with steroids and immunosuppressants, known malignancies and patients on once weekly MHD
• Control – 45 healthy volunteers
Study
population

Approval of IEC
Consent of the study participants
Data collection (case and control) :
demographics (age, sex, height , weight , Body mass index [wt in kg/ht in m2]), Comorbidities
Blood sample (case and control) :
After an overnight fast, 5ml of venous blood samples were collected in the morning at a similar baseline time, (before initiation of dialysis for cases), serum seperated and analyzed for serum Ghrelin levels and pro inflammatory cytokines TNF-α, hs CRP, BUN creatinine and biochemical markers of nutrition hemoglobin and albumin
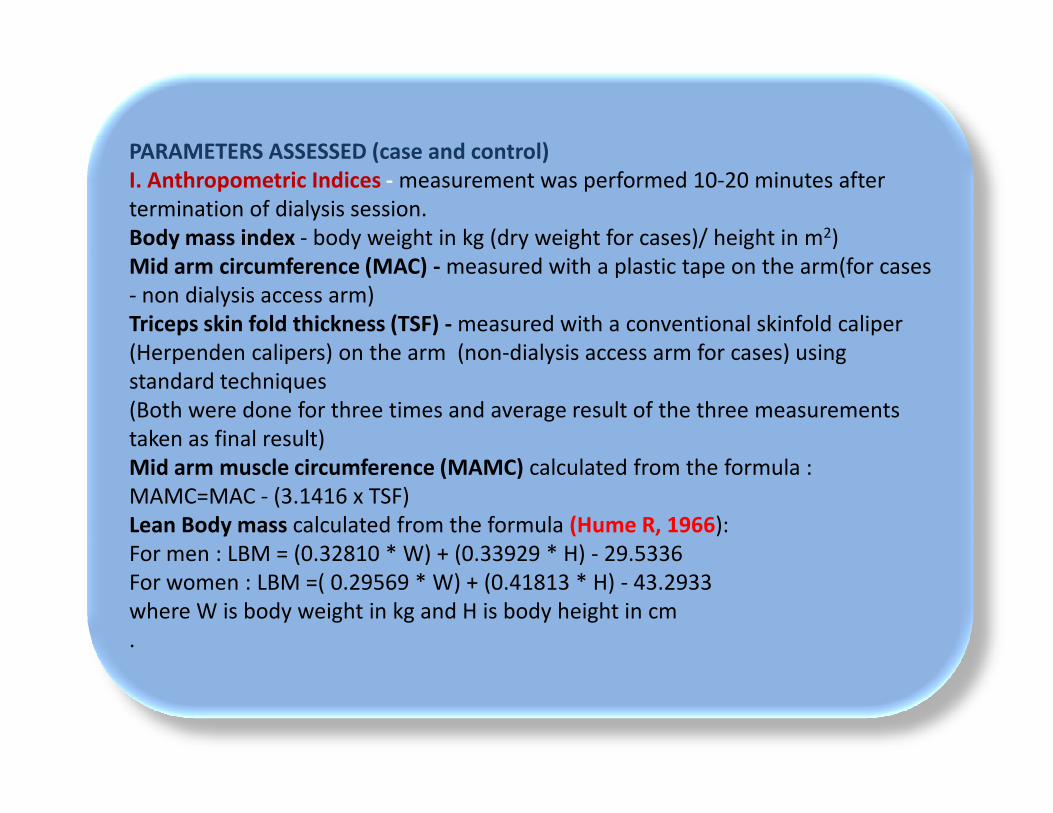
PARAMETERS ASSESSED (case and control)
I. Anthropometric Indices - measurement was performed 10-20 minutes after
termination of dialysis session.
Body mass index - body weight in kg (dry weight for cases)/ height in m2)
Mid arm circumference (MAC) - measured with a plastic tape on the arm(for cases
- non dialysis access arm)
Triceps skin fold thickness (TSF) - measured with a conventional skinfold caliper
(Herpenden calipers) on the arm (non-dialysis access arm for cases) using
standard techniques
(Both were done for three times and average result of the three measurements (Both were done for three times and average result of the three measurements
taken as final result)
Mid arm muscle circumference (MAMC) calculated from the formula :
MAMC=MAC - (3.1416 x TSF)
Lean Body mass calculated from the formula (Hume R, 1966):
For men : LBM = (0.32810 * W) + (0.33929 * H) - 29.5336
For women : LBM =( 0.29569 * W) + (0.41813 * H) - 43.2933
where W is body weight in kg and H is body height in cm
.

PARAMETERS ASSESSED (case and control)
2. Analysis of Serum samples:
• Serum total Ghrelin by DRG Elisa kit (DRG International, Inc., USA).
The minimum detectable dose of Ghrelin is < 30pg/mL
• Serum Tumor necrosis factor (TNF) alpha by DRG TNF-alpha ELISA Kit-
The minimum detectable dose of TNF-alpha is < 15 pg/mlThe minimum detectable dose of TNF-alpha is < 15 pg/ml
• Serum concentrations of hs-CRP were measured using Daiichi kit with
a linear range of 0.2 to 20 mg/L, (Daiichi Pure Chemicals Co. Ltd., Tokyo,
Japan) by immuno-turbidimetric method as mentioned in the kit.
• Serum levels of BUN, creatinine, hemoglobin and albumin were
assessed as per standard laboratory procedures.

PARAMETERS ASSESSED (cases)
3. SUBJECTIVE GLOBAL ASSESSMENT –DIALYSIS MALNUTRITION
SCORE (SGA-DMS) (Kalantar Zedeh, et al) - a fully quantitative scoring
system consisting of seven features: weight change, dietary intake,
gastrointestinal symptoms, functional capacity, co morbidity,
subcutaneous fat and signs of muscle wasting. Each component has a subcutaneous fat and signs of muscle wasting. Each component has a
score from 1(normal) to 5 (very severe). Thus the malnutrition score
(sum of all seven components) of 7 – 11 is (well nourished) , 12-25 is
moderately malnourished, 26-35 is severely malnourished. This
questionnaire was answered by the case population either at the time
of or within a week of blood sample collection.

Statistical analysis was done by SPSS 15.0 version and results were
expressed as mean ± Standard Deviation. Independent t test was
used to correlate the mean values of the case and control groups.
The correlation between the nutritional status, inflammation and
serum ghrelin levels was done by Analysis of variance. A P value of
<0.05 was considered statistically significant.

Characteristics Cases (N=90)
Mean ± SD
Control (N=45)
Mean ± SD
P
Sex Male
Female
56
34
29
16
-
Age (Years) 52.62 ± 11.7 50.6 ± 9.7 0.206
BuN (mg/dL) 40.16 ± 6.32 11.66 ± 2.6 <0.001**
Results
1. Characteristics of study population
BuN (mg/dL) 40.16 ± 6.32 11.66 ± 2.6 <0.001**
Sr. Creatinine
(mg/dL)
6.6 ± 3.1 0.9 ± 0.2 <0.001**
eGFR
(ml/min/ 1.73m2)
9.86 ± 4.52 102.2 ± 3.6 <0.001**
Dialysis vintage
(months)
20.8 ± 5. 2 - -
Kt/V 1.38 ± 0.05 - -
nPCR 1.76 ± 0.65 -- -

Characteristics Cases (N=90)
Mean ± SD
Control (N=45)
Mean ± SD
P
BMI
(wt in kg/ht in m2)
21.48 ± 3.6 23. 97 ± 2.8 < 0.001**
TSF (mm) 9.20 ± 1.31 10.20 ± 3.08 0.009*
2. Nutritional markers of study population
TSF (mm) 9.20 ± 1.31 10.20 ± 3.08 0.009*
MAC (cm) 20.06 ± 3.76 24.90 ± 1.27 < 0.001**
MAMC (cm2) 16.9 ± 2.8 22.01 ± 0.98 < 0.001**
LBM (kg) 43.84 ± 8.27 48.24 ± 5.41 0.002*
Hb (g/dL) 9.27 ± 1.4 13.61 ± 1.41 < 0.001**
Alb (mg/dL) 2.9 ± 1.2 3.8 ± 1 .5 < 0.001**
SGA – DMS 19.7 1 ± 7.45

Characteristics Cases (N=90)
Mean ± SD
Control (N=45)
Mean ± SD
P
Hs CRP mg/dL) 10.22 ± 2.87 2.58 ± 0.51 < 0.001**
TNF α (pg/mL) 39.65 ± 15.7 6.167 ± 1.10 < 0.001**
Ghrelin (pg/mL) 132.48 ± 42.26 75.54 ± 17.02 < 0.001**
3. Ghrelin and Infllammatory markers of study population
4. SGA – DMS Vs Inflammatory markers & Ghrelin in MHD patients
Markers Well
nourished
(n -13)
Moderately
malnourished
(n-51)
Severely
malnourished
(n-26)
P
Hs CRP mg/dL) 9.40 9.64 12.14 <0.001**
TNF α (pg/mL) 32.98 34.46 55.48 <0.001**
Ghrelin (pg/mL) 100.62 115.95 180.67 < 0.001**

• In the present study
Discussion
Findings of the present study
•Statistically significant low levels of anthropometry, albumin and
hemoglobin in cases. Patients on MHD had a compromised
nutritional status than healthy control.
•A significant increase in the inflammatory markers and ghrelin in
MHD patients than control
•Of the 90 patients on MHD, 14% were well nourished, 57% were
moderately nourished and 29% were severely malnourished asmoderately nourished and 29% were severely malnourished as
per SGA- DMS. The levels of inflammatory markers and ghrelin
were significantly higher in severely malnourished patients when
compared to moderately and well nourished patients.
• There was a strong positive correlation between ghrelin,
inflammatory markers (hs CRP & TNF ), dialysis vintage, serum
BUN and creatinine in hemodialysis patients; where as a negative
correlation was observed between ghrelin , eGFR and
nutritional status in MHD patients

• In the present study
Discussion
Reports have emphasized increased fasting total ghrelin in MHD
patients (Mafra et al, Muscaritoli et al). Given the fact that ghrelin
is a potent orexigenic hormone, and inflammation is related to loss
of appetite, the role of des acyl ghrelin in CKD patients needs to be
explored.
Since the majority of total circulating ghrelin is des acyl ghrelin, this
could reduce appetite in CKD patients, hence needs more focus.
Ghrelin and its forms acyl and des acyl ghrelin could be effective
markers for malnutrition and anorexia in ESRD patients on MHD .

Limitations:
• Small sample size
• Only total ghrelin levels were estimated
• Role of acylated and desacyl ghrelin in MIS in CKD need to be
assessed
Future scope:
There is a dire need for appetite stimulatory therapies in ESRD. Ghrelin
is more potent than other orexigenic factors in stimulating appetite
and it also possess anti-inflammatory effect, hence could be
considered as an ideal therapeutic agent for uremic cachexia and also
to combat ghrelin resistance observed in these patients.
Subcutaneous ghrelin administration has shown to enhance short term
food intake in MHD patients (Wynne et al)..

• Aguilera A, Codoceo R, Selgas R et al. Anorexigen (TNF-a, cholecystokinin) and orexigen (neuropeptide Y)plasma levels in peritoneal dialysis (PD)patients: their relationship with nutritional parameters. Nephrol DialTransplant 1998; 13: 1476–1483. J Renal Nutr 2004; 14: 143–148.
• Ayala ER, Pecoits-Filho R, Heimburger O, Lindholm B, Nordfors L, Stenvinkel P. Associations between plasma
ghrelin levels and body composition in end-stage renaldisease: a longitudinal study. Nephrol Dial Transplant
2004; 19:421–6
• Chang CC, Hung CH, Yen CS, et al: The relationship of plasma ghrelin level to energy regulation, feeding and left
ventricular function in non-diabetic haemodialysis patients. Nephrol Dial Transplant 2005;20:2172-2177
References
ventricular function in non-diabetic haemodialysis patients. Nephrol Dial Transplant 2005;20:2172-2177
• Hume, R (Jul 1966). "Prediction of lean body mass from height and weight.". Journal of clinical pathology 19 (4): 389–91.
doi:10.1136/jcp.19.4.389. PMC 473290. PMID 5929341
• Kalantar-Zadeh K. Kleiner M, Dunne E, Lee GH, Luft FC; A modified quantitative subjective global assessment of
nutrition for dialysis patients. Nephrol Dial Transplant 1999;14: 1732-38
• Mafra D, NE Farage, JC Lobo, et al. Relationship between total grhelin and inflammation in hemodialysis
patients. Peptides 2011 (32):358-61
• M. Muscaritoli, A. Molfino, M. G. Chiappini, et al., “Anorexia in hemodialysis patients: the possible role of des-
acyl ghrelin,” American Journal of Nephrology , 2007; vol. 27, no. 4, pp. 360–365
• Wynne K, Stanley S, McGowan B, et al: Appetite control. J Endocrinol 2005; 184:291-318.
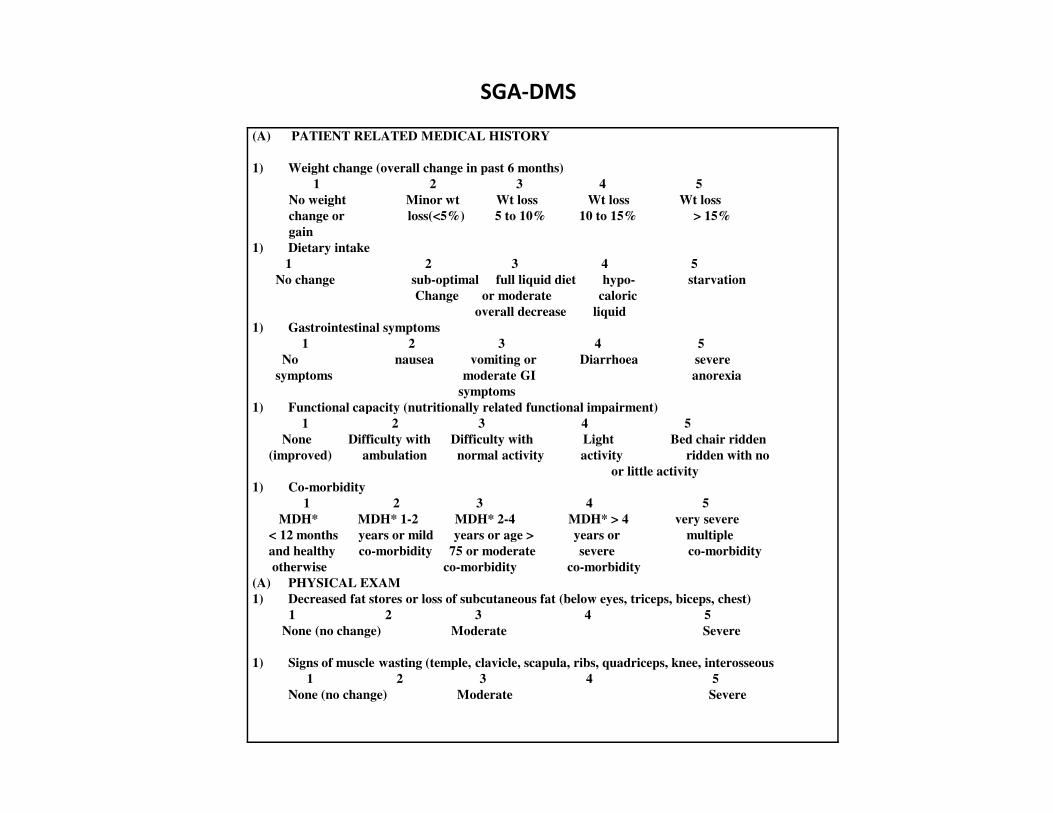
(A) PATIENT RELATED MEDICAL HISTORY
1) Weight change (overall change in past 6 months)
1 2 3 4 5
No weight Minor wt Wt loss Wt loss Wt loss
change or loss(<5%) 5 to 10% 10 to 15% > 15%
gain
1) Dietary intake
1 2 3 4 5
No change sub-optimal full liquid diet hypo- starvation
Change or moderate caloric
overall decrease liquid
1) Gastrointestinal symptoms
1 2 3 4 5
No nausea vomiting or Diarrhoea severe
symptoms moderate GI anorexia
symptoms
1) Functional capacity (nutritionally related functional impairment)
SGA-DMS
1) Functional capacity (nutritionally related functional impairment)
1 2 3 4 5
None Difficulty with Difficulty with Light Bed chair ridden
(improved) ambulation normal activity activity ridden with no
or little activity
1) Co-morbidity
1 2 3 4 5
MDH* MDH* 1-2 MDH* 2-4 MDH* > 4 very severe
< 12 months years or mild years or age > years or multiple
and healthy co-morbidity 75 or moderate severe co-morbidity
otherwise co-morbidity co-morbidity
(A) PHYSICAL EXAM
1) Decreased fat stores or loss of subcutaneous fat (below eyes, triceps, biceps, chest)
1 2 3 4 5
None (no change) Moderate Severe
1) Signs of muscle wasting (temple, clavicle, scapula, ribs, quadriceps, knee, interosseous
1 2 3 4 5
None (no change) Moderate Severe