Embed Size (px)
Citation preview

Aquaculture 435 (2015) 195–199
Contents lists available at ScienceDirect
Aquaculture
j ourna l homepage: www.e lsev ie r .com/ locate /aqua-on l ine
GHR and IGF-I gene expression and production characteristics associatedwith GH gene polymorphism in Nile tilapia
Fernanda Tanamati a, Stefânia Caroline Claudino da Silva a, Maria Del Pilar Rodriguez Rodriguez a,Guilherme Pereira Schuroff a, Carlos Souza do Nascimento b, Ana Paula Del Vesco c,1, Eliane Gasparino c,⁎,1
a Animal Science Department, Universidade Estadual de Maringá, Brazilb Animal Science Department, Universidade Federal de Viçosa, Brazilc Animal Science Department, Universidade Estadual de Maringá, Brazil
⁎ Corresponding author at: Universidade Estadual dMaringá, Paraná, Brazil. Tel.: +55 44 3011 4919; fax: +5
E-mail address: [email protected] (E. Gasparino).1 Sponsored by Brazilian National Council for Research
http://dx.doi.org/10.1016/j.aquaculture.2014.09.0330044-8486/© 2014 Elsevier B.V. All rights reserved.
a b s t r a c t
a r t i c l e i n f oArticle history:Received 4 July 2014Received in revised form 3 September 2014Accepted 19 September 2014Available online 28 September 2014
Keywords:Gene expressionPerformancePolymorphismOreochromis niloticus
The aim of this study was to investigate the effects of genotype on gene expression and performance character-istics in crossbred GIFT × Chitralada tilapia. We compared the effects of GH single band (GHsb) and GH doubleband (GHdb) genotypes on performance characteristics, growth hormone receptor (GHR) and insulin-likegrowth factor I (IGF-I) gene expression in the liver and white muscle. The experiment was conducted in a 2 ×2 factorial design with two categories of weight (20–35 g and 40–70 g) and two genotypes (GHsb and GHdb).Fin fragments were collected for genotyping, while the liver andwhitemuscle samples were collected to analyzegene expression via qRT-PCR. GHdb genotype animals presented greater body weight, empty weight, weight ofviscera, and filet weight and length, thereby indicating that GH variation may correlate with performance char-acteristics. Although some of the phenotypes wemeasured were correlatedwith genotype, we cannot say that itis due to the direct effect of the studied polymorphism. However, we recommend further studies be conducted toreveal the genetic nature of this polymorphism.
© 2014 Elsevier B.V. All rights reserved.
1. Introduction
Animal growth is considered an important characteristic in meatproduction and can be characterized by an increase in weight, length,height and circumference according to age (Filho et al., 2011). Hormon-al growth regulation involves a complex series of interactions betweendifferent hormones, with the somatotropic axis (growth hormone —
GH, growth hormone receptor— GHR, and insulin-like growth factorI — GF-I) considered to be the most important. GH can affect growthdirectly, but its effects are mostly mediated through IGF-I activity.The presence of GH in an organism promotes the synthesis and releaseof this hormone (Becker, 2001). The effect of GH on IGF-I is mediated bythe GH receptor (GHR) because GH-GHR binding is necessary to stimu-late IGF-I synthesis and release (Kita et al., 2005).
GH is a single chain polypeptide hormone synthesized in thesomatotropic cells of the anterior pituitary. When GH binds to its re-ceptors (GHR) on the cell surface of the target tissue, it forms a GH–GHRcomplex. This triggers their biological actions, such as the production andrelease of IGF-I in the liver and in most peripheral tissues (Moriyamaet al., 2000). IGF-I affects the processes of cell growth (Mommsen,
e Maringá, av. Colombo, 57905 44 3011 4855.
— CNPq.
2001), DNA and protein synthesis (Duan, 1998), lipid and carbohydrateregulation, and mineral metabolism of cells (Moriyama et al., 2000).
In fish, polymorphisms in the IGF-I gene (Tao and Boulding, 2003)and especially in the GH gene (Gross and Nilsson, 1999; Kang et al.,2002) have been correlated with growth traits. However, GH is also as-sociated with sex (Forbes et al., 1994), osmotic regulation (Sakamotoand McCormick, 2006), lipids, protein and carbohydrate metabolism,bone growth, reproduction, and immune functions (Reinecke et al.,2005).
Studies have reported the presence of two copies of GH (GH1 andGH2) in several teleost fish species. Examples of this duplication areseen in salmon, rainbow trout and tilapia. However, major studies onthis topic were conducted on salmon and rainbow trout (Agellon et al.,1988; Ber and Daniel, 1993; Forbes et al., 1994; Mori et al., 2001;Rezaei et al., 2011). Tilapias have a diploid genome, while Salmonidaehave a tetraploid genome arising from a common ancestor that doubledits genome about 25–50 million years ago (Allendorf and Thorgaard,1984). Since both species have the GH genes from a common ancestor,Ber and Daniel (1993) assume that the duplication of the second GH intilapia must have occurred after the evolutionary separation of theSalmonidae.
Our group recently demonstrated that crossbred GIFT × Chitraladatilapia present with a polymorphism in the GH promoter region. Be-cause of the gene duplication in the amplified region, we cannot yetstate in which gene (GH1 or GH2) the polymorphism is located, so the

196 F. Tanamati et al. / Aquaculture 435 (2015) 195–199
polymorphismwas named GH single band (GHsb) and GH double band(GHdb). Due to this observation, we hypothesize that in this study, var-iation in the tilapia GH genemay be related to performance characteris-tics and GHR and IGF-I gene expression in the liver and muscle.
2. Material and methods
2.1. GH polymorphism
The studied polymorphism results from an allelic variation that iscorresponding to a microsatellite locus in the growth hormone (GH)gene. The microsatellite presents a “CTGT” tandem repeat sequencethat occurs six or seven times.
In the tilapia used in this study this variation produced an amplifica-tion pattern that we named as GHsb (equal number of motifs) andGHdb (number of different motifs).
2.2. Animals
Ninety-five reverse crossbred GIFT (Genetic Improvement ofFarmed) × Chitralada tilapias from Piracema Fish Farming Maringá-Brazil were used in this study. The GIFT line was introduced intoBrazil in 2005 from crosses made by the World Fish Center. The ani-mals were initially 5 g ± 0.5 g. The animals were housed together infiber cement boxes with a volume of 1.00 m3, individual water re-newal systems (5%/day), and constant aeration via a porous stone at-tached to a central blower.
The animalswere fed a commercial extruded feed (40% of crudepro-tein). The total daily diet was distributed three times per day at 8, 12,and 18 h. The feeding method was manual, and the diet was providedad libitum. The temperature in each tank was measured, and the tankswere siphoned in the morning and in the afternoon for the removal ofwaste andmetabolites. After 60 days, all animals were euthanized, sep-arated by twoweight categories (20–35 g and 40–70 g)with an approx-imately equal number of fish, and genotyped for the GH polymorphism.
2.3. Sampling
Before the animals were slaughtered to collect tissues and measure-ments, they were fasted for 24 h. At the time of collection, the animalswere captured and anesthetized in order to determine body weight(BW), gutted or empty weight (EW), viscera weight (VW), filet weight(FW), length, andwidth.We also calculated the filet yield (FY), calculat-ed as (weight of filet without skin and rib / body weight) × 100, and theratio of filet to empty carcass, calculated as (weight of filet without skinand rib / empty weight) × 100.
To extract the DNA, fragments of the caudal fin were collected,placed in 90% ethanol, and stored in a freezer at −20 °C. Meanwhile,to analyze gene expression, the liver and white muscle samples werecollected, placed in the “RNA holder” (BioAgency Biotechnology Ltda.,São Paulo, SP, Brazil), and stored at−20 °C until RNA extraction.
2.4. Genotyping
DNA extraction was performed according to the alkaline extractionprotocol described by Rudbeck and Dissing (1998) and adapted byTanamati et al. (2013). Fin samples were cut, dried, and transferred to1.5 mL tubes. For the lysis and homogenization steps, 35 μL of NaOH at0.2 M was added to each sample and incubated in a water bath at74 °C for 20min.While the sampleswere in awater bath, theywere ho-mogenized every 5min. For the neutralization step, 70 μL of Tris–HCl atpH 8.0 was added to each tube. Next, the samples were stored at−20 °C for further amplification.
The primers usedwere designed according to the GenBank sequencefor the GH1 and GH2 genes (accession numbers M97766 and M97765,respectively), and the most conserved region of the gene in tilapia was
used. In this fragment, the GH1 and GH2 genes have a variation, withseven and six replicates of microsatellite ‘CTGT’, respectively. Only a dif-ference of 4 bp in intron 2 is expected for the amplicons.
GenomicDNAwas amplified in afinal reaction volumeof 15.5 μL andcomposed of 1 μL of template DNA and a “mix” of reagents containingthe following: 1.5 μL of buffer Tris–KCl 1× (Tris–HCl 20 mmol L−1
pH 8.4 and KCl 50 mmol L−1), 1.0 μL of MgCl2, 0.6 μL of primer, 0.5 μLof dNTPs, 10.8 μL of ultrapure water, and 0.1 units of Platinum TaqDNA Polymerase (Invitrogen, Carlsbad CA, USA) per reaction. PCR reac-tions were performed in a thermocycler (AB Applied Biosystems, LifeTechnologies, Carlsbad, CA, USA).
Initially, DNAwas denatured at 95 °C for 4min. Thiswas followed by35 cycles, with each cycle consisting of 30 s of denaturation at 95 °C,45 s of annealing at 60 °C, and 45 s of extension at 72 °C. A final exten-sion at 72 °C for 7minwas also performed. Amplification productswereseparated in a 2% agarose gel, and electrophoresis was performed at150 V for 2 h in a horizontal chamber using TBE 0.5× buffer (500 mMof Tris–HCl, 60 mM of boric acid and 83 mM of EDTA). A 20 minuteethidium bromide stain bath at 0.5 mg/mL was used to reveal theimage, which was captured by a U-pix system (Loccus Biotechnology).To estimate the fragment sizes, a DNA ladder (Life Technologies, Carlsbad,CA, USA) of 100 base pairs was used for comparison.
2.5. Gene expression
Total RNA was extracted using TRIzol® (Invitrogen, Carlsbad, CA,USA) according to the manufacturer's instructions (1 mL per 100 mgof tissue). All of the materials used had been previously treated withthe RNase inhibitor RNase AWAY® (Invitrogen, Carlsbad, CA, USA).The tissue and TRIzol mixture was titrated with a Polytron electric ho-mogenizer until complete dissociation. Next, 200 μL of chloroform wasadded to the sample, and the mixture was manually homogenized for1 min. The samples were then centrifuged for 15 min at 12,000 rpmand 4 °C. The aqueous phase was collected and transferred to a cleantube containing 500 μL of isopropanol per tube, then again homoge-nized and centrifuged for 15 min at 12,000 rpm and 4 °C. The superna-tant was discarded, and the precipitate was washed in 1 mL of 75%ethanol. The material was once again centrifuged at 12,000 rpm for5 min, and the supernatant was discarded. The pellet was dried for15 min and resuspended in ultrapure RNase-free water.
The total RNA concentration was measured using a spectrophotom-eter at a wavelength of 260 nm. RNA integrity was analyzed using a 1%agarose gel stainedwith 10% ethidiumbromide and visualized under ul-traviolet light. The RNA samples were treated with DNase I (Invitrogen,Carlsbad, CA, USA) according to themanufacturer's instructions in orderto remove possible genomic DNA contamination.
A SuperScript™ III First-Strand Synthesis Super Mix (Invitrogen,Carlsbad, CA, USA) kit was used for cDNA synthesis according to themanufacturer's instructions. For this reaction, 6 μL of total RNA, 1 μL ofoligo dT (50 μM oligo(dT)20) and 1 μL of annealing buffer were addedto a sterile RNA-free tube. The reaction was then incubated for 5 minat 65 °C and placed on ice for 1 min. Subsequently, 10 μL of 2× First-Strand Reaction Mix and 2 μL of solution containing SuperScript III re-verse transcriptase enzyme and RNase inhibitor were added to thetubes. The solution was incubated for 50 min at 50 °C for the synthesisof complementary DNA. Next, the reaction was incubated for 5 min at85 °C and immediately placed on ice. The samples were stored at−20 °C until further use.
Real-time PCR reactions were performed using the fluorescent dyeSYBR GREEN (SYBR® GREEN PCR Master Mix, Invitrogen, Carlsbad, CA,USA) in an ABI 7300 machine (Applied Biosystems, Carlsbad, CA, USA).All of the reactions were analyzed under the same conditions and nor-malized to the ROX Reference Dye (Invitrogen, Carlsbad, CA, USA) inorder to correct for fluctuations in the readings due to evaporation dur-ing the reaction.
197F. Tanamati et al. / Aquaculture 435 (2015) 195–199
The primers used in the GHR, and IGF-I amplification reactions weredesigned based on the tilapia gene sequences deposited at www.ncbi.nlm.nih.gov (accession numbers AY973232.1 and EU2721149.1, respec-tively) using the site www.idtdna.com. The β-actin gene (accessionnumber L08165) was used as an endogenous control because its ampli-fication was shown to be more efficient. All of the analyses were per-formed in duplicate, each in a volume of 25 μL.
2.6. Statistical analysis
The data was analyzed by the SAS GLM procedure (SAS Inst. Inc.,Cary, NC), and the univariate procedure was used to verify the data nor-mality. The 2−ΔCt method was used to analyze gene expression. Due tonon-compliance with the assumptions of normality, gene expressiondata was evaluated with the logarithmic transformation [ln (x + 1)](Voge et al., 2004). A variance analysis was performed, and meanswere compared via Tukey test at a 5% probability. In the model, weconsidered the effects of genotype (GHsb and GHdb), weight category(20–35 and 40–70 g), and their interaction. The results are shown as av-erages with standard errors.
3. Results
3.1. Genotyping and performance
With just one pair of primers, we identified two distinct ampliconpatterns, which we have called GHsb (fragment of 652 bp) and GHdb(fragment of 652 and 700 bp).
30 tilapiaswere placed in the 20–35 g category, and 43 tilapias in the40–70 g category. Sixteen animals from the 20–35 g category appearedto have GHsb (53%) and fourteen animals had GHdb (47%). For animalsfrom the 40–70 g category, seventeen presentedwith GHsb (39.5%) andtwenty-six had GHdb (60.5%).
There was no interaction between genotype (GHsb and GHdb) andweight categories (20–35 g and 40–70 g) for any of the performancecharacteristics studied. However, when assessed independently, geno-type had a significant effect on the BW, EW, VW, FW, and LEMvariables.Weight class had a significant effect (P b 0.05) on all characteristics(Table 1).
The GHdb genotype presented greater average values for almost alltraits, except for the filet/empty carcass ratio, FY, and WID averages.Similar results were observed for the 40–70 g weight category which,as expected, showed higher averages than the 20–35 g category, exceptfor FY.
Table 1Performance results of crossbred GIFT × Chitralada tilapia.
Category BW (g) EW (g) VW (g)
GHsb1 20−35 g 27.51 22.36 5.1540−70 g 47.09 40.52 5.98
GHdb 20−35 g 27.51 22.28 5.2440−70 g 48.86 42.08 6.78
Main effectGenotype GHsb 37.60b 31.72b 5.57b
GHdb 41.39a 35.15a 6.24a
Category 20−35 g 27.51b 22.32b 5.19b
40−70 g 48.16a 41.46a 6.46a
Probabilities Genotype 0.0005 0.0003 0.0317Category b0.0001 b0.0001 0.0002Interaction 0.4194 0.3810 0.2556
a,bMean values within a column with different superscript letters were significantly different (1 GHsb, GH simple band; GHdb, GH double band.2 BW, body weight; EW, empty weight; VW, viscera weight; FW, filet weight; FEC, filet to e
3.2. Gene expression
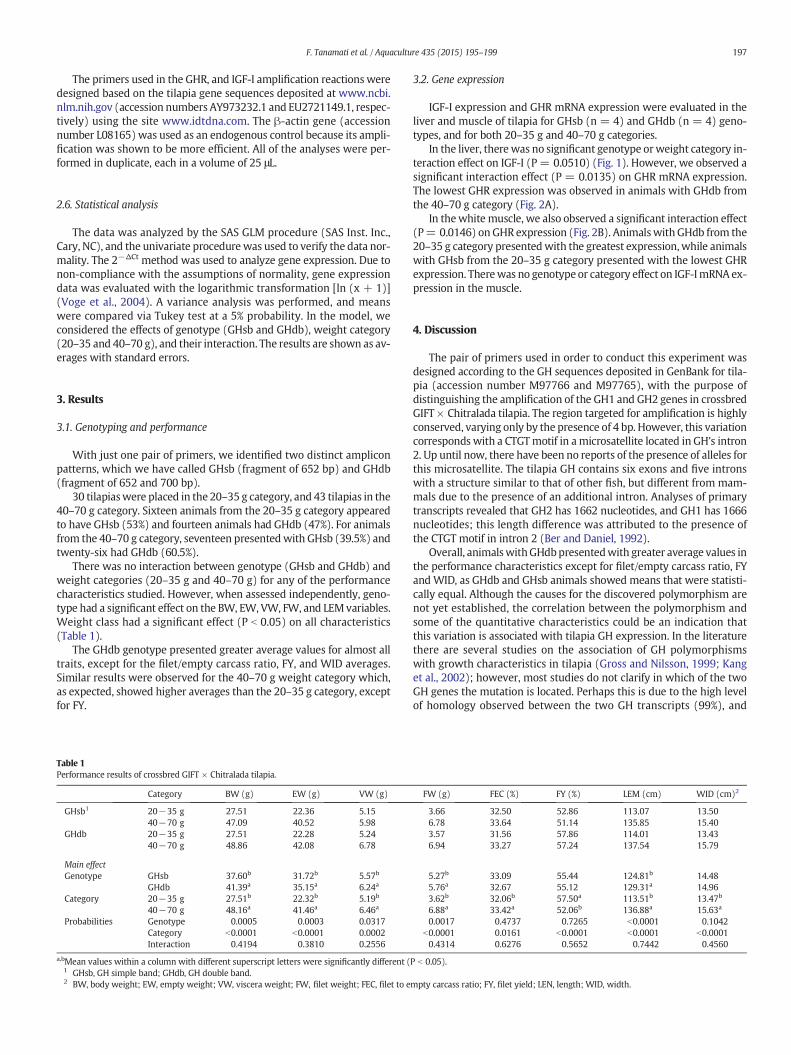
IGF-I expression and GHR mRNA expression were evaluated in theliver and muscle of tilapia for GHsb (n = 4) and GHdb (n = 4) geno-types, and for both 20–35 g and 40–70 g categories.
In the liver, there was no significant genotype orweight category in-teraction effect on IGF-I (P= 0.0510) (Fig. 1). However, we observed asignificant interaction effect (P = 0.0135) on GHR mRNA expression.The lowest GHR expression was observed in animals with GHdb fromthe 40–70 g category (Fig. 2A).
In thewhite muscle, we also observed a significant interaction effect(P= 0.0146) on GHR expression (Fig. 2B). Animalswith GHdb from the20–35 g category presentedwith the greatest expression,while animalswith GHsb from the 20–35 g category presented with the lowest GHRexpression. Therewas no genotype or category effect on IGF-ImRNA ex-pression in the muscle.
4. Discussion
The pair of primers used in order to conduct this experiment wasdesigned according to the GH sequences deposited in GenBank for tila-pia (accession number M97766 and M97765), with the purpose ofdistinguishing the amplification of the GH1 and GH2 genes in crossbredGIFT × Chitralada tilapia. The region targeted for amplification is highlyconserved, varying only by the presence of 4 bp. However, this variationcorresponds with a CTGTmotif in amicrosatellite located in GH's intron2. Up until now, there have been no reports of the presence of alleles forthis microsatellite. The tilapia GH contains six exons and five intronswith a structure similar to that of other fish, but different from mam-mals due to the presence of an additional intron. Analyses of primarytranscripts revealed that GH2 has 1662 nucleotides, and GH1 has 1666nucleotides; this length difference was attributed to the presence ofthe CTGT motif in intron 2 (Ber and Daniel, 1992).
Overall, animalswithGHdbpresentedwith greater average values inthe performance characteristics except for filet/empty carcass ratio, FYandWID, as GHdb and GHsb animals showed means that were statisti-cally equal. Although the causes for the discovered polymorphism arenot yet established, the correlation between the polymorphism andsome of the quantitative characteristics could be an indication thatthis variation is associated with tilapia GH expression. In the literaturethere are several studies on the association of GH polymorphismswith growth characteristics in tilapia (Gross and Nilsson, 1999; Kanget al., 2002); however, most studies do not clarify in which of the twoGH genes the mutation is located. Perhaps this is due to the high levelof homology observed between the two GH transcripts (99%), and
FW (g) FEC (%) FY (%) LEM (cm) WID (cm)2
3.66 32.50 52.86 113.07 13.506.78 33.64 51.14 135.85 15.403.57 31.56 57.86 114.01 13.436.94 33.27 57.24 137.54 15.79
5.27b 33.09 55.44 124.81b 14.485.76a 32.67 55.12 129.31a 14.963.62b 32.06b 57.50a 113.51b 13.47b
6.88a 33.42a 52.06b 136.88a 15.63a
0.0017 0.4737 0.7265 b0.0001 0.1042b0.0001 0.0161 b0.0001 b0.0001 b0.00010.4314 0.6276 0.5652 0.7442 0.4560
P b 0.05).
mpty carcass ratio; FY, filet yield; LEN, length; WID, width.

0
0.5
1
1.5
2
2.5
3
liver muscle
IGF-
I mRN
A ex
pres
sion
(AU
)
GHsb
GHdb
0
0.5
1
1.5
2
2.5
3
liver muscle
IGF-
I mRN
A ex
pres
sion
(AU
)
20-35
40-70
A
B
Fig. 1. Effects of genotype (A) and weight category (B) on IGF-I mRNA expression in thetilapias liver and muscle.
Fig. 2. Effect of genotype × weight category interaction on GHR mRNA expression in thetilapias liver (A) and muscle (B). Mean values with different letters were significantly dif-ferent (P b 0.05).
198 F. Tanamati et al. / Aquaculture 435 (2015) 195–199
because these transcripts encode a polypeptide that is 100% identical(Ber and Daniel, 1992).
In our study,we expected that the amplified regions of GH1andGH2would be different from each other due to the presence of four nucleo-tides located in intron 2; however, we observed that the variation wasgreater than expected. One hypothesis to explain this is that the nucle-otides were inserted in one of two genes, and maybe the gene was nottranscribed. This hypothesis may be possible, since it is not establisheduntil the timewhether both genes are targets of transcription in tilapia.Ber and Daniel (1992) characterized the cDNA of GH in tilapia, and thiscorresponded to the transcription of GH1, but they did not determine ifGH2 was also expressed.
In goldfish, two types of GH were also identified (Law et al., 1996),but these may have different physiological functions. GH has beendirectly or indirectly related to somatic growth, the stimulation of met-abolic processes, aswell as cell division, skeletal growth, protein synthe-sis, feed efficiency and reproductive functions. However, in tilapia thereare no reports indicating that there are any differences in the mecha-nism of action of the two GHs. In Salmonidae, whose genome is tetra-ploid due to a duplicate GH, it was observed that GH1 is more highlyexpressed than GH2 (Mori et al., 2001).
Most researchers have concentrated their efforts in finding an asso-ciation between polymorphismswith differential GHmRNAexpression;however, there are conflicting results about the effects of increased GHon growth stimulation. The increase in plasma GH and GH mRNAexpression in the pituitary are related to a decrease in body weightand the specific growth rate in fasted animals, as observed by Foxet al. (2006). It is true that growth involves the expression of severalgenes and their receptors. Genetic variation in the GH receptor (GHR)structure has been associated with the type of response to GH therapyin humans (Dos Santos et al., 2004). This suggests that not only serumlevels of GH, but also the way that GH interacts with its receptor moreor less improve the efficiency in triggering the biochemical processeswithin the cell, which can affect the growth.
The GHR mediates GH action on the target cell, so the GH/GHRcomplex stimulates the transcription of many genes, including IGF-I(Kobayashi et al., 1999).
In this study, there were no differences in mRNA expression of IGF-Iin the liver and muscle as a function of genotype or weight class.
We observed a significant interaction effect only on the GHR expres-sion, as animals from 40 to 70 gwith GHdb had the lowest expression inthe liver (0.0401 AU). In general, it was observed that the GHR expres-sion in the liverwas accompanied by a similar IGF-I expression, and thatlighter animals had a greater level of expression of the two genes stud-ied. In the muscle, the IGF-I levels did not experience a large variationwhen compared to the liver; however, it was found that animals of ge-notype GHsb, and animals from the 40–70 g weight category showedgreater levels of IGF-I expression.
5. Conclusion
Although some results have been correlated with the GHsb andGHdb genotypes, we cannot say that it is due to a direct effect of thestudied polymorphism. However, we suggest that further studies beconducted in order to reveal the genetic nature of this polymorphism,and subsequently new studies associating the genotype effect withcharacteristics of interest.
199F. Tanamati et al. / Aquaculture 435 (2015) 195–199
References
Agellon, L.B., Davies, S.L., Lin, C.M., Chen, T.T., Powers, D.A., 1988. Rainbow trout has twogenes for growth hormone. Mol. Reprod. Dev. 1, 11–17.
Allendorf, F.W., Thorgaard, G.H., 1984. Tetraploidy and the evolution of Salmonid fishes.In: Turner, B.J. (Ed.), Evolutionary Genetics of Fishes. Plenum, New York, pp. 1–53.
Becker, K.L., 2001. Principles and Practice of Endocrinology and Metabolism, 3th ed.Lippincott Williams & Wilkins (LWW), Philadelphia.
Ber, R., Daniel, V., 1992. Structure and sequence of the growth hormone-encoding genefrom Tilapia nilotica. Gene 113, 245–250.
Ber, R., Daniel, V., 1993. Sequence analysis suggests a recent duplication of the growthhormone-encoding gene in Tilapia nilotica. Gene 125, 143–150.
Dos Santos, C., Essioux, L., Teinturier, C., Tauber, M., Goffin, V., Bougnères, P., 2004. A com-mon polymorphism of the growth hormone receptor in associated with increase re-sponsiveness to growth hormone. Nat. Genet. 36, 720–724.
Duan, C., 1998. Nutritional and developmental regulation of insulin-like growth factors infish. J. Nutr. 128, 306S–314S.
Filho, M.R., Zangeronimo, M.G., Lopes, L.S., Ladeira, M.M., Andrade, I., 2011. Fisiologia docrescimento e desenvolvimento do tecido muscular e sua relação com a qualidadeda carne de bovinos. Nutritime 8, 1431–1443.
Forbes, S.H., Knudsen, K.L., North, T.W., Allendorf, F.W., 1994. One of two growth hormonegenes in coho salmon is sex-linked. Proc. Natl. Acad. Sci. U. S. A. 91, 1628–1631.
Fox, B.K., Riley, L.G., Hirano, T., Grau, E.G., 2006. Effects of fasting on growth hormone, growthhormone receptor, and insulin-like growth factor-I axis in seawater-acclimated tilapia,Oreochromis mossambicus. Gen. Comp. Endocrinol 148, 340–347.
Gross, R., Nilsson, J., 1999. Restriction fragment length polymorphism at the growth hor-mone 1 gene in Atlantic salmon (Salmo salar L.) and its association with weightamong the offspring of a hatchery stock. Aquaculture 173, 73–80.
Kang, J.H., Lee, S.J., Park, S.R., Ryu, H.Y., 2002. DNA polymorphism in the growth hormonegene and its associationwith weight in olive flounder Paralichthys olivaceus. Fish. Sci.68, 494–498.
Kita, K., Nagao, K., Okumura, J., 2005. Nutritional and tissue specificity of IGF-I and IGFBP-2 gene expression in growing chickens — a review. Asian Australas. J. Anim. Sci. 18,747–754.
Kobayashi, Y., Vandehaar, M.J., Tucker, H.A., Sharma, B.K., Lucy, M.C., 1999. Expression ofgrowth hormone receptor 1A messenger ribonucleic acid in liver of dairy cows dur-
ing lactation and after administration of recombinant bovine somatotropin. J. DairySci. 82, 1910–1916.
Law, M.S., Cheng, K.W., Fung, T.K., Chan, Y.H., Yu, K.L., Chan, K.M., 1996. Isolation and char-acterization of two distinct growth hormone cDNAs from the Goldfish, Carassiusauratus. Arch. Biochem. Biophys. 330, 19–23.
Mommsen, T.P., 2001. Paradigms of growth in fish. Comp. Biochem. Physiol. B Biochem.Mol. Biol. 129, 207–219.
Mori, T., Deguchi, F., Ueno, K., 2001. Differential expression of GH1 and GH2 genes bycompetitive RT-PCR in Rainbow trout pituitary. Gen. Comp. Endocrinol. 123,137–143.
Moriyama, S., Ayson, F.G., Kawauchi, H., 2000. Growth regulation by insulin-like growthfactor-I in fish. Biosci. Biotechnol. Biochem. 8, 1553–1562.
Reinecke, M., Björnsson, B.T., Dickhoff, W.W., Mccormick, S.D., Navarro, I., Power, D.M.,Gutiérrez, J., 2005. Growth hormone and insulin-like growth factors in fish: wherewe are and where to go. Gen. Comp. Endocrinol. 141, 20–24.
Rezaei, A., Akhshabi, S.H., Jamalzadeh, H.R., 2011. Sequencing and sequence analysis ofgrowth hormone type 1 (GH1) gene homologue in the Salmo trutta caspius. Adv. S.Biol. 3, 111–122.
Rudbeck, L., Dissing, J., 1998. Rapid, simple alkaline extraction of human genomic DNA fromwhole blood, buccal epithelial cells, semen and forensic stains for PCR. BioTechniques25, 588–592.
Sakamoto, T., Mccormick, S.D., 2006. Prolactin and growth hormone in fish osmoregula-tion. Gen. Comp. Endocrinol. 147, 24–30.
Tanamati, F., Silva, S.C.C., Voltolini, D.M., Garcia, A.L.S.G., Ribeiro, R.P., Gasparino, E., 2013.Uso da extração alcalina em tecidos de tilápia do Nilo. Zootec 2013. AssociaçãoBrasileira de Zootecnistas, Brasil.
Tao, W.J., Boulding, E.G., 2003. Associations between single nucleotide polymorphisms incandidate genes and growth rate in Arctic charr (Salvelinus alpinus L.). Heredity 91,60–69.
Voge, J.L., Santiago, C.A.T., Aad, P.Y., Goad, D.W., Malayer, J.R., Spicer, L.J., 2004. Quantifica-tion of insulin-like growth factor binding protein mRNA using real-time PCR in bovinegranulosa and theca cells: effect of estradiol, insulin, and gonadotropins. Domest.Anim. Endocrinol. 26, 241–258.