Embed Size (px)
Citation preview
IFPRI Discussion Paper 01497
January 2016
Ghana’s Macroeconomic Crisis
Causes, Consequences, and Policy Responses
Stephen D. Younger
Development Strategy and Governance Division
INTERNATIONAL FOOD POLICY RESEARCH INSTITUTE The International Food Policy Research Institute (IFPRI), established in 1975, provides evidence-based policy solutions to sustainably end hunger and malnutrition and reduce poverty. The Institute conducts research, communicates results, optimizes partnerships, and builds capacity to ensure sustainable food production, promote healthy food systems, improve markets and trade, transform agriculture, build resilience, and strengthen institutions and governance. Gender is considered in all of the Institute’s work. IFPRI collaborates with partners around the world, including development implementers, public institutions, the private sector, and farmers’ organizations, to ensure that local, national, regional, and global food policies are based on evidence. IFPRI is a member of the CGIAR Consortium.
AUTHOR Stephen D. Younger ([email protected]) is a scholar in residence in the Department of Economics at Ithaca College, Ithaca, NY, US.
Notices 1. IFPRI Discussion Papers contain preliminary material and research results and are circulated in order to stimulate discussion and critical comment. They have not been subject to a formal external review via IFPRI’s Publications Review Committee. Any opinions stated herein are those of the author(s) and are not necessarily representative of or endorsed by the International Food Policy Research Institute. 2. The boundaries and names shown and the designations used on the map(s) herein do not imply official endorsement or acceptance by the International Food Policy Research Institute (IFPRI) or its partners and contributors.
Copyright 2016 International Food Policy Research Institute. All rights reserved. Sections of this material may be reproduced for personal and not-for-profit use without the express written permission of but with acknowledgment to IFPRI. To reproduce the material contained herein for profit or commercial use requires express written permission. To obtain permission, contact [email protected].
iii
Contents
Abstract v
Acknowledgments vi
1. Introduction 1
2. Origins of the Crisis 2
3. Macroeconomic Consequences of the Crisis 9
4. Policy Options to Restore Macroeconomic Stability 14
5. Conclusion 21
References 22
iv
Tables
2.1 Actual and budgeted government expenditures, in percent (percent) 5
2.2 Actual and budgeted government revenues (percent) 5
2.3 Tests of election-year anomalies in macroeconomic variables 8
4.1 Government macroeconomic program, agreed with the International Monetary Fund 15
4.2 Selected revenue and expenditure items, share of GDP 19
Figures
2.1 Overall and primary fiscal balances, percent of GDP 2
2.2 Government debt, percent of GDP 7
3.1 Real GDP growth 9
3.2 Fiscal surplus and deficit, percent of GDP 10
3.3 Current account, percent of GDP 11
3.4 91-day T-bill interest rates 12
3.5 Expenditure on GDP, percent of GDP 12
3.6 Inflation, annual average rate 13
4.1 Selected government expenditures, percent of GDP 16
v
ABSTRACT
Ghana is in the midst of a severe but not unprecedented macroeconomic crisis. This paper helps to evaluate the government’s policy options by (1) explaining the crisis’ causes, and (2) comparing it to previous macroeconomic crises and the policies that corrected them. Two large shocks are to blame for the crisis: an increase in the fiscal deficit of about 6 percent of GDP and a reduction in hydroelectric production that has not been replaced with thermal generation. This latter is more difficult to quantify, but may be as large as 4 percent of GDP. While large, Ghana has recovered from similar shocks in the past, and with luck, should be able to do so now. But this will require reversal of the large increases in the public sector wage bill that drove much of the fiscal shock.
Keywords: Ghana, macroeconomy, stabilization
vi
ACKNOWLEDGMENTS
This work was undertaken as part of the CGIAR Research Program on Policies, Institutions, and Markets (PIM) led by the International Food Policy Research Institute (IFPRI). I would like to thank the United States Agency for International Development (USAID) for providing financial support for this study through IFPRI’s Ghana Strategy Support Program. This paper has not gone through IFPRI’s standard peer-review procedure. The opinions expressed here belong to the authors, and do not necessarily reflect those of USAID, PIM, IFPRI, or CGIAR.
While any errors in this document are my responsibility, I had many helpful discussions in Accra during the summer of 2015 that helped to clarify my understanding of Ghana’s macroeconomic situation. These included (by institution) the following:
• African Center for Economic Transformation: Francis Abebrese, Julius Gatune Kariuki, Ouborr Kutando, and Francis Mulangu
• Bank of Ghana: Grace Akrofi • Institute of Economic Affairs: Joe Gartey, Charles Jebuni, and Charles Mensah • International Food Policy Research Institute: Xinshen Diao, and Shashi Kolavalli • Institute for Statistical, Social, and Economic Research: Felix Ankomah Asante • Ministry of Finance and Economic Planning: Edward Abrokwah, Kofi Asamoa-Baah,
Joseph Kwadwo Asenso, Irene Egyir, Mawuli Gaddah, Alhassan Idrissu, and Sam Mensah
• University of Ghana: Ernest Aryeetey, William Baah-Boateng, and Eric Osei-Assibey • USAID: Fenton Sands • World Bank (Accra): Hans Jansen and Felix Oppong
1
1. INTRODUCTION
Ghana is going through a prolonged and severe macroeconomic crisis. Economic growth has decelerated rapidly from the petroleum-induced boom of 2011–2012 to rates that are well below pre-crisis projections and below the average rates of the previous two decades. The trade balance appears to be unsustainable given likely flows of foreign direct investment, remittances, and aid. The Ghanaian cedi has come under intense pressure and depreciated significantly. Inflation is once again increasing after a decade in which the monetary authorities succeeded in bringing it to single digits. Given the high hopes for economic development that Ghana’s oil discovery fostered in the last decade, it is important to ask what has gone wrong and whether it can be put right. This paper attempts to answer those questions and to put the current crisis in (recent) historical perspective.
2
2. ORIGINS OF THE CRISIS
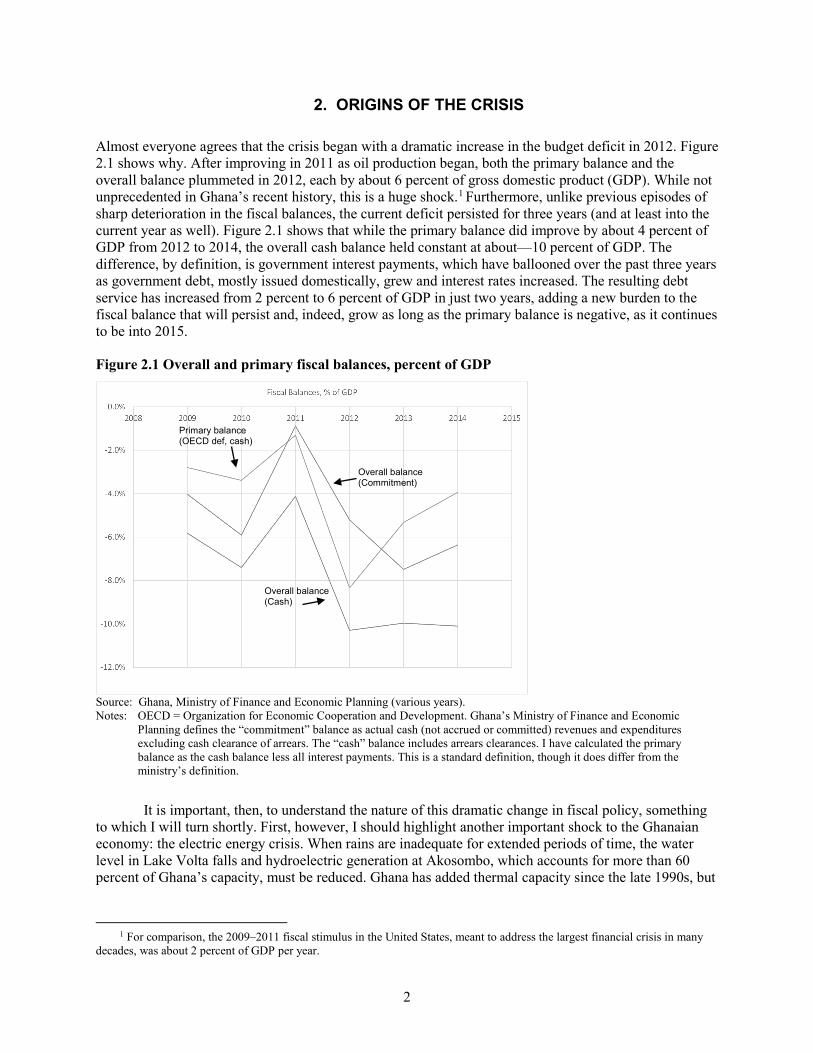
Almost everyone agrees that the crisis began with a dramatic increase in the budget deficit in 2012. Figure 2.1 shows why. After improving in 2011 as oil production began, both the primary balance and the overall balance plummeted in 2012, each by about 6 percent of gross domestic product (GDP). While not unprecedented in Ghana’s recent history, this is a huge shock.1 Furthermore, unlike previous episodes of sharp deterioration in the fiscal balances, the current deficit persisted for three years (and at least into the current year as well). Figure 2.1 shows that while the primary balance did improve by about 4 percent of GDP from 2012 to 2014, the overall cash balance held constant at about—10 percent of GDP. The difference, by definition, is government interest payments, which have ballooned over the past three years as government debt, mostly issued domestically, grew and interest rates increased. The resulting debt service has increased from 2 percent to 6 percent of GDP in just two years, adding a new burden to the fiscal balance that will persist and, indeed, grow as long as the primary balance is negative, as it continues to be into 2015.
Figure 2.1 Overall and primary fiscal balances, percent of GDP
Source: Ghana, Ministry of Finance and Economic Planning (various years). Notes: OECD = Organization for Economic Cooperation and Development. Ghana’s Ministry of Finance and Economic
Planning defines the “commitment” balance as actual cash (not accrued or committed) revenues and expenditures excluding cash clearance of arrears. The “cash” balance includes arrears clearances. I have calculated the primary balance as the cash balance less all interest payments. This is a standard definition, though it does differ from the ministry’s definition.
It is important, then, to understand the nature of this dramatic change in fiscal policy, something to which I will turn shortly. First, however, I should highlight another important shock to the Ghanaian economy: the electric energy crisis. When rains are inadequate for extended periods of time, the water level in Lake Volta falls and hydroelectric generation at Akosombo, which accounts for more than 60 percent of Ghana’s capacity, must be reduced. Ghana has added thermal capacity since the late 1990s, but
1 For comparison, the 2009–2011 fiscal stimulus in the United States, meant to address the largest financial crisis in many
decades, was about 2 percent of GDP per year.
Primary balance (OECD def, cash)
Overall balance (Commitment)
Overall balance (Cash)
3
it has been hampered in the current crisis by irregular supply of gas from Nigeria through the West African gas pipeline, leading to persistent and pervasive blackouts around the country.
As with the fiscal deficit, electricity shortages are not unprecedented in Ghana, but the current crisis is more severe and longer-lived than previous ones. While more difficult to measure than the fiscal shock, the electricity shock is undoubtedly important. In 2013, the World Bank’s Enterprise Survey found that 19 percent of Ghanaian firms cited electricity as an important impediment to their growth, second only to those reporting access to finance as a constraint (50 percent). The situation has surely worsened since 2013.
Conceptually, the energy crisis is a negative supply shock that tends to both decrease aggregate production and increase the price level. In the best of cases, it raises firms’ costs of production as they must switch from the grid to their own generators. In some cases, the shock is considerably worse: for firms without their own generators, production may collapse when the power goes off.
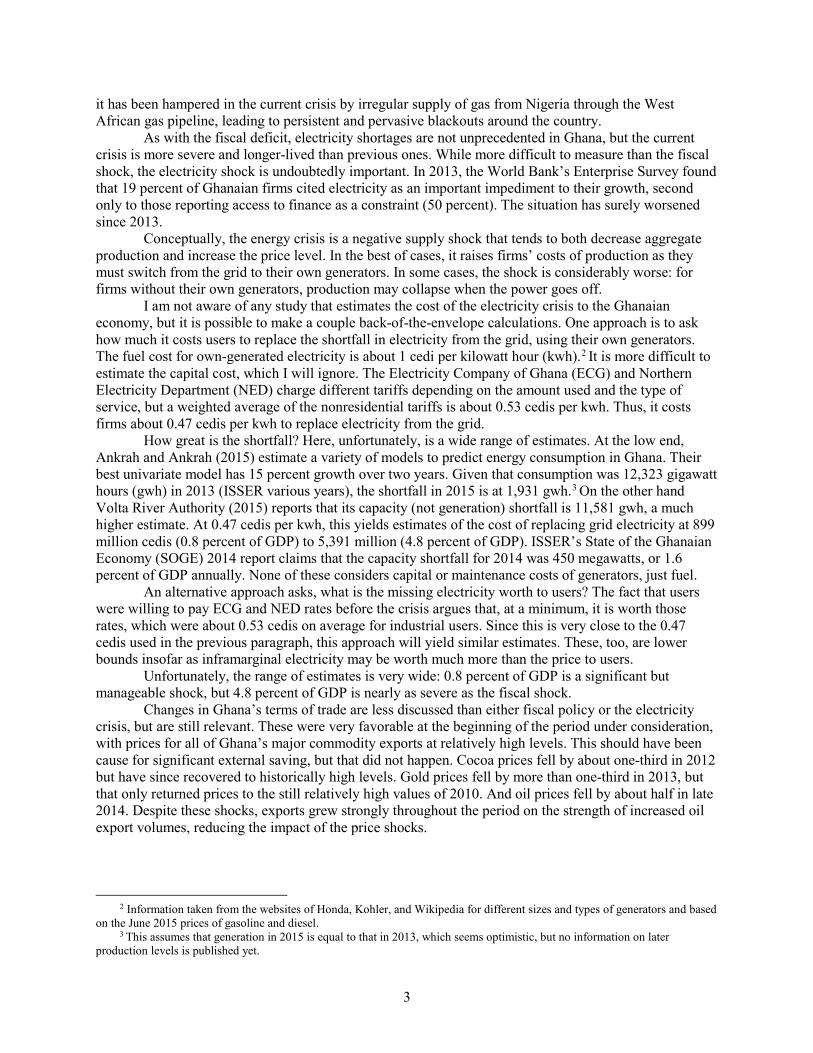
I am not aware of any study that estimates the cost of the electricity crisis to the Ghanaian economy, but it is possible to make a couple back-of-the-envelope calculations. One approach is to ask how much it costs users to replace the shortfall in electricity from the grid, using their own generators. The fuel cost for own-generated electricity is about 1 cedi per kilowatt hour (kwh).2 It is more difficult to estimate the capital cost, which I will ignore. The Electricity Company of Ghana (ECG) and Northern Electricity Department (NED) charge different tariffs depending on the amount used and the type of service, but a weighted average of the nonresidential tariffs is about 0.53 cedis per kwh. Thus, it costs firms about 0.47 cedis per kwh to replace electricity from the grid.
How great is the shortfall? Here, unfortunately, is a wide range of estimates. At the low end, Ankrah and Ankrah (2015) estimate a variety of models to predict energy consumption in Ghana. Their best univariate model has 15 percent growth over two years. Given that consumption was 12,323 gigawatt hours (gwh) in 2013 (ISSER various years), the shortfall in 2015 is at 1,931 gwh.3 On the other hand Volta River Authority (2015) reports that its capacity (not generation) shortfall is 11,581 gwh, a much higher estimate. At 0.47 cedis per kwh, this yields estimates of the cost of replacing grid electricity at 899 million cedis (0.8 percent of GDP) to 5,391 million (4.8 percent of GDP). ISSER’s State of the Ghanaian Economy (SOGE) 2014 report claims that the capacity shortfall for 2014 was 450 megawatts, or 1.6 percent of GDP annually. None of these considers capital or maintenance costs of generators, just fuel.
An alternative approach asks, what is the missing electricity worth to users? The fact that users were willing to pay ECG and NED rates before the crisis argues that, at a minimum, it is worth those rates, which were about 0.53 cedis on average for industrial users. Since this is very close to the 0.47 cedis used in the previous paragraph, this approach will yield similar estimates. These, too, are lower bounds insofar as inframarginal electricity may be worth much more than the price to users.
Unfortunately, the range of estimates is very wide: 0.8 percent of GDP is a significant but manageable shock, but 4.8 percent of GDP is nearly as severe as the fiscal shock.
Changes in Ghana’s terms of trade are less discussed than either fiscal policy or the electricity crisis, but are still relevant. These were very favorable at the beginning of the period under consideration, with prices for all of Ghana’s major commodity exports at relatively high levels. This should have been cause for significant external saving, but that did not happen. Cocoa prices fell by about one-third in 2012 but have since recovered to historically high levels. Gold prices fell by more than one-third in 2013, but that only returned prices to the still relatively high values of 2010. And oil prices fell by about half in late 2014. Despite these shocks, exports grew strongly throughout the period on the strength of increased oil export volumes, reducing the impact of the price shocks.
2 Information taken from the websites of Honda, Kohler, and Wikipedia for different sizes and types of generators and based
on the June 2015 prices of gasoline and diesel. 3 This assumes that generation in 2015 is equal to that in 2013, which seems optimistic, but no information on later
production levels is published yet.
4
Over the past three-and-a-half years, then, Ghana has seen both a persistent aggregate demand shock in the form of large fiscal deficits and a persistent if more difficult to quantify supply shock due to electricity shortages. It seems likely that these two shocks are independent of one another: one the result of poor macro policy, and the other just bad luck (and perhaps insufficiently cautious planning and investing for such contingencies). At a deeper level, though, both shocks reflect the sacrifice of sensible economic policy to short-term political expedience. Governments around the world, including in Ghana, commonly increase deficits in an attempt to please the electorate during an election year, as was 2012. I will consider whether Ghana suffers from a political business cycle in the following sections.
Holding down electricity rates is also politically expedient in the short run, even if it constrains supply and leads to crises such as the present one over time. Both the distribution companies and the Volta River Authority, the main generator, are state owned, so they do not necessarily need to make a profit, but they do need to cover costs. If tariffs are held too low, these firms must cut corners somewhere, and investment in new capacity and maintenance of existing capacity are the likely places.
Drivers of the Fiscal Deficit
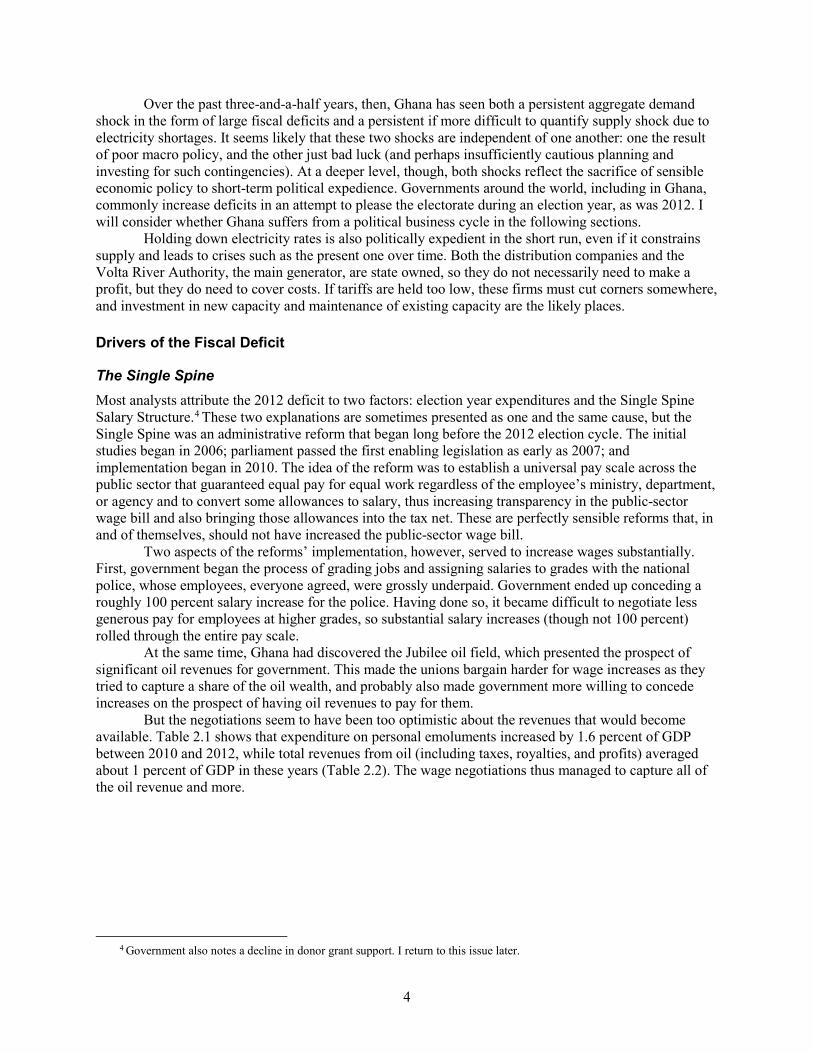
The Single Spine Most analysts attribute the 2012 deficit to two factors: election year expenditures and the Single Spine Salary Structure.4 These two explanations are sometimes presented as one and the same cause, but the Single Spine was an administrative reform that began long before the 2012 election cycle. The initial studies began in 2006; parliament passed the first enabling legislation as early as 2007; and implementation began in 2010. The idea of the reform was to establish a universal pay scale across the public sector that guaranteed equal pay for equal work regardless of the employee’s ministry, department, or agency and to convert some allowances to salary, thus increasing transparency in the public-sector wage bill and also bringing those allowances into the tax net. These are perfectly sensible reforms that, in and of themselves, should not have increased the public-sector wage bill.
Two aspects of the reforms’ implementation, however, served to increase wages substantially. First, government began the process of grading jobs and assigning salaries to grades with the national police, whose employees, everyone agreed, were grossly underpaid. Government ended up conceding a roughly 100 percent salary increase for the police. Having done so, it became difficult to negotiate less generous pay for employees at higher grades, so substantial salary increases (though not 100 percent) rolled through the entire pay scale.
At the same time, Ghana had discovered the Jubilee oil field, which presented the prospect of significant oil revenues for government. This made the unions bargain harder for wage increases as they tried to capture a share of the oil wealth, and probably also made government more willing to concede increases on the prospect of having oil revenues to pay for them.
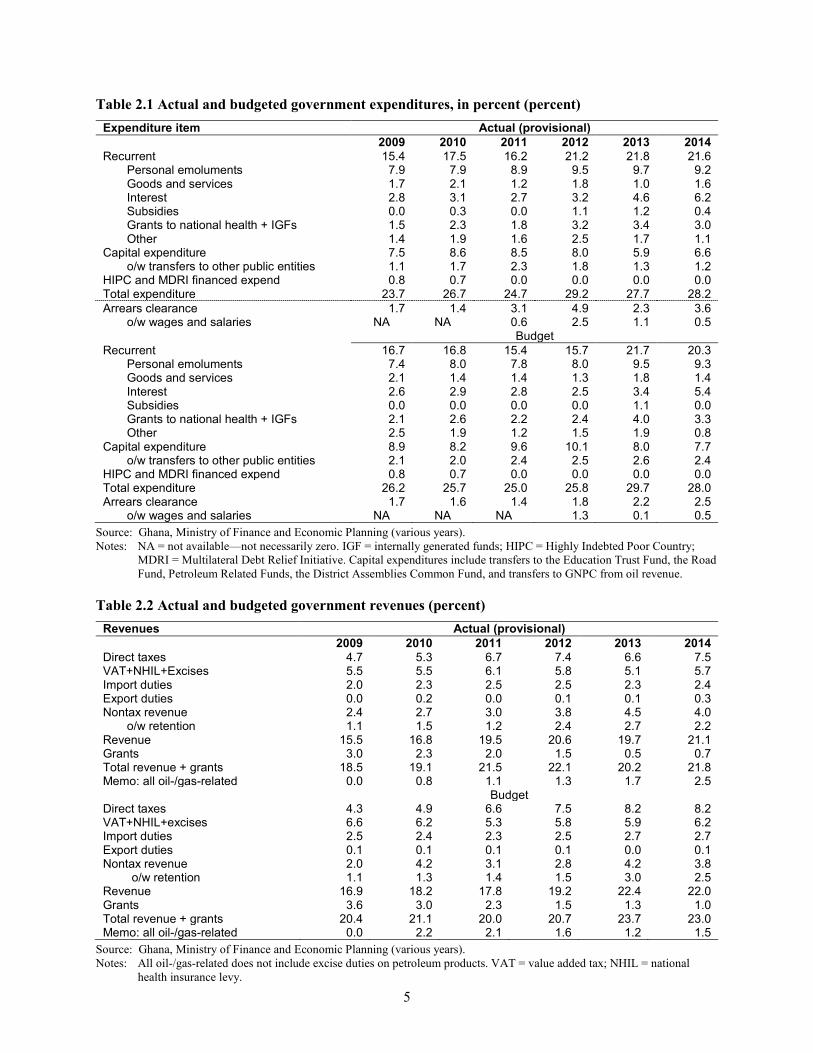
But the negotiations seem to have been too optimistic about the revenues that would become available. Table 2.1 shows that expenditure on personal emoluments increased by 1.6 percent of GDP between 2010 and 2012, while total revenues from oil (including taxes, royalties, and profits) averaged about 1 percent of GDP in these years (Table 2.2). The wage negotiations thus managed to capture all of the oil revenue and more.
4 Government also notes a decline in donor grant support. I return to this issue later.
5
Table 2.1 Actual and budgeted government expenditures, in percent (percent) Expenditure item Actual (provisional)
2009 2010 2011 2012 2013 2014 Recurrent 15.4 17.5 16.2 21.2 21.8 21.6
Personal emoluments 7.9 7.9 8.9 9.5 9.7 9.2 Goods and services 1.7 2.1 1.2 1.8 1.0 1.6 Interest 2.8 3.1 2.7 3.2 4.6 6.2 Subsidies 0.0 0.3 0.0 1.1 1.2 0.4 Grants to national health + IGFs 1.5 2.3 1.8 3.2 3.4 3.0 Other 1.4 1.9 1.6 2.5 1.7 1.1
Capital expenditure 7.5 8.6 8.5 8.0 5.9 6.6 o/w transfers to other public entities 1.1 1.7 2.3 1.8 1.3 1.2
HIPC and MDRI financed expend 0.8 0.7 0.0 0.0 0.0 0.0 Total expenditure 23.7 26.7 24.7 29.2 27.7 28.2 Arrears clearance 1.7 1.4 3.1 4.9 2.3 3.6
o/w wages and salaries NA NA 0.6 2.5 1.1 0.5 Budget
Recurrent 16.7 16.8 15.4 15.7 21.7 20.3 Personal emoluments 7.4 8.0 7.8 8.0 9.5 9.3 Goods and services 2.1 1.4 1.4 1.3 1.8 1.4 Interest 2.6 2.9 2.8 2.5 3.4 5.4 Subsidies 0.0 0.0 0.0 0.0 1.1 0.0 Grants to national health + IGFs 2.1 2.6 2.2 2.4 4.0 3.3 Other 2.5 1.9 1.2 1.5 1.9 0.8
Capital expenditure 8.9 8.2 9.6 10.1 8.0 7.7 o/w transfers to other public entities 2.1 2.0 2.4 2.5 2.6 2.4
HIPC and MDRI financed expend 0.8 0.7 0.0 0.0 0.0 0.0 Total expenditure 26.2 25.7 25.0 25.8 29.7 28.0 Arrears clearance 1.7 1.6 1.4 1.8 2.2 2.5
o/w wages and salaries NA NA NA 1.3 0.1 0.5 Source: Ghana, Ministry of Finance and Economic Planning (various years). Notes: NA = not available—not necessarily zero. IGF = internally generated funds; HIPC = Highly Indebted Poor Country;
MDRI = Multilateral Debt Relief Initiative. Capital expenditures include transfers to the Education Trust Fund, the Road Fund, Petroleum Related Funds, the District Assemblies Common Fund, and transfers to GNPC from oil revenue.
Table 2.2 Actual and budgeted government revenues (percent) Revenues Actual (provisional)
2009 2010 2011 2012 2013 2014 Direct taxes 4.7 5.3 6.7 7.4 6.6 7.5 VAT+NHIL+Excises 5.5 5.5 6.1 5.8 5.1 5.7 Import duties 2.0 2.3 2.5 2.5 2.3 2.4 Export duties 0.0 0.2 0.0 0.1 0.1 0.3 Nontax revenue 2.4 2.7 3.0 3.8 4.5 4.0
o/w retention 1.1 1.5 1.2 2.4 2.7 2.2 Revenue 15.5 16.8 19.5 20.6 19.7 21.1 Grants 3.0 2.3 2.0 1.5 0.5 0.7 Total revenue + grants 18.5 19.1 21.5 22.1 20.2 21.8 Memo: all oil-/gas-related 0.0 0.8 1.1 1.3 1.7 2.5 Budget Direct taxes 4.3 4.9 6.6 7.5 8.2 8.2 VAT+NHIL+excises 6.6 6.2 5.3 5.8 5.9 6.2 Import duties 2.5 2.4 2.3 2.5 2.7 2.7 Export duties 0.1 0.1 0.1 0.1 0.0 0.1 Nontax revenue 2.0 4.2 3.1 2.8 4.2 3.8
o/w retention 1.1 1.3 1.4 1.5 3.0 2.5 Revenue 16.9 18.2 17.8 19.2 22.4 22.0 Grants 3.6 3.0 2.3 1.5 1.3 1.0 Total revenue + grants 20.4 21.1 20.0 20.7 23.7 23.0 Memo: all oil-/gas-related 0.0 2.2 2.1 1.6 1.2 1.5
Source: Ghana, Ministry of Finance and Economic Planning (various years). Notes: All oil-/gas-related does not include excise duties on petroleum products. VAT = value added tax; NHIL = national
health insurance levy.
6
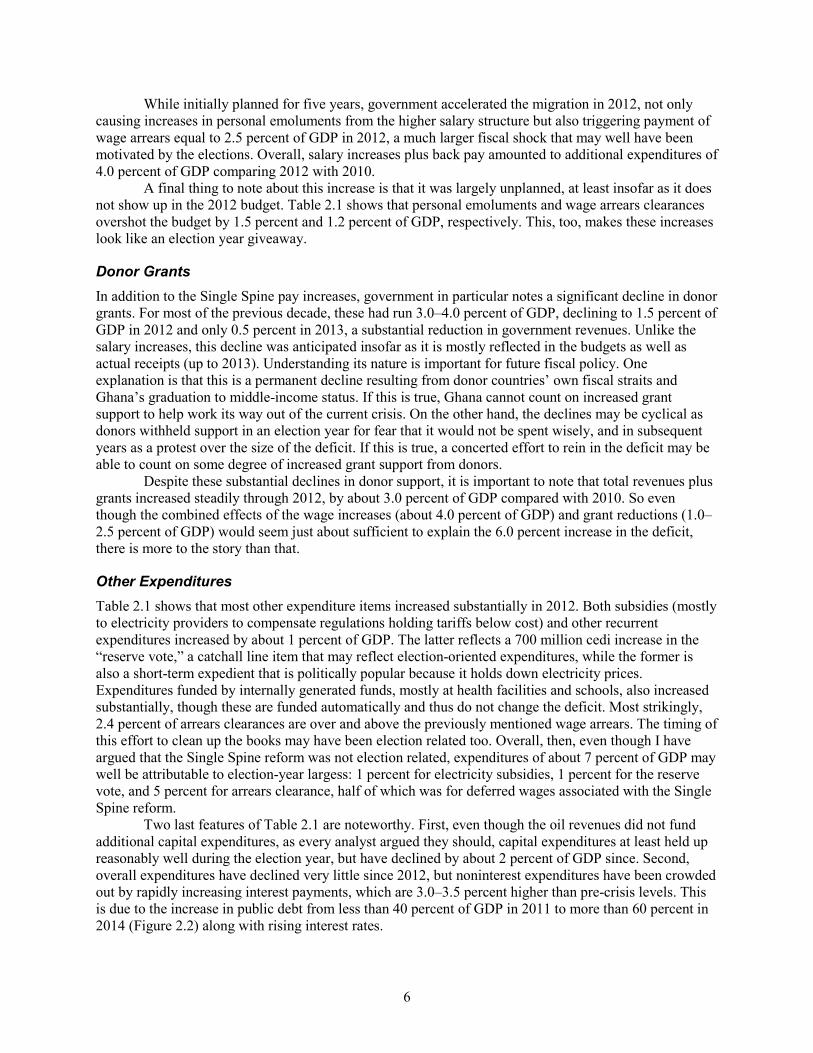
While initially planned for five years, government accelerated the migration in 2012, not only causing increases in personal emoluments from the higher salary structure but also triggering payment of wage arrears equal to 2.5 percent of GDP in 2012, a much larger fiscal shock that may well have been motivated by the elections. Overall, salary increases plus back pay amounted to additional expenditures of 4.0 percent of GDP comparing 2012 with 2010.
A final thing to note about this increase is that it was largely unplanned, at least insofar as it does not show up in the 2012 budget. Table 2.1 shows that personal emoluments and wage arrears clearances overshot the budget by 1.5 percent and 1.2 percent of GDP, respectively. This, too, makes these increases look like an election year giveaway.
Donor Grants In addition to the Single Spine pay increases, government in particular notes a significant decline in donor grants. For most of the previous decade, these had run 3.0–4.0 percent of GDP, declining to 1.5 percent of GDP in 2012 and only 0.5 percent in 2013, a substantial reduction in government revenues. Unlike the salary increases, this decline was anticipated insofar as it is mostly reflected in the budgets as well as actual receipts (up to 2013). Understanding its nature is important for future fiscal policy. One explanation is that this is a permanent decline resulting from donor countries’ own fiscal straits and Ghana’s graduation to middle-income status. If this is true, Ghana cannot count on increased grant support to help work its way out of the current crisis. On the other hand, the declines may be cyclical as donors withheld support in an election year for fear that it would not be spent wisely, and in subsequent years as a protest over the size of the deficit. If this is true, a concerted effort to rein in the deficit may be able to count on some degree of increased grant support from donors.
Despite these substantial declines in donor support, it is important to note that total revenues plus grants increased steadily through 2012, by about 3.0 percent of GDP compared with 2010. So even though the combined effects of the wage increases (about 4.0 percent of GDP) and grant reductions (1.0–2.5 percent of GDP) would seem just about sufficient to explain the 6.0 percent increase in the deficit, there is more to the story than that.
Other Expenditures Table 2.1 shows that most other expenditure items increased substantially in 2012. Both subsidies (mostly to electricity providers to compensate regulations holding tariffs below cost) and other recurrent expenditures increased by about 1 percent of GDP. The latter reflects a 700 million cedi increase in the “reserve vote,” a catchall line item that may reflect election-oriented expenditures, while the former is also a short-term expedient that is politically popular because it holds down electricity prices. Expenditures funded by internally generated funds, mostly at health facilities and schools, also increased substantially, though these are funded automatically and thus do not change the deficit. Most strikingly, 2.4 percent of arrears clearances are over and above the previously mentioned wage arrears. The timing of this effort to clean up the books may have been election related too. Overall, then, even though I have argued that the Single Spine reform was not election related, expenditures of about 7 percent of GDP may well be attributable to election-year largess: 1 percent for electricity subsidies, 1 percent for the reserve vote, and 5 percent for arrears clearance, half of which was for deferred wages associated with the Single Spine reform.
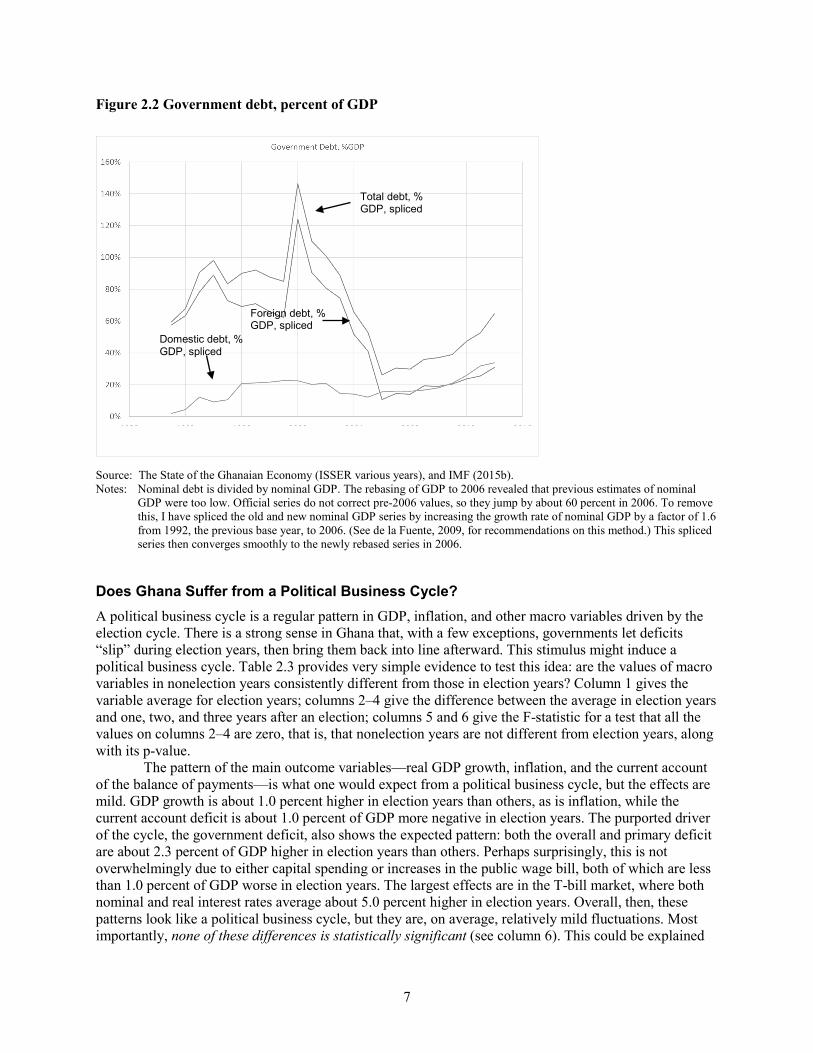
Two last features of Table 2.1 are noteworthy. First, even though the oil revenues did not fund additional capital expenditures, as every analyst argued they should, capital expenditures at least held up reasonably well during the election year, but have declined by about 2 percent of GDP since. Second, overall expenditures have declined very little since 2012, but noninterest expenditures have been crowded out by rapidly increasing interest payments, which are 3.0–3.5 percent higher than pre-crisis levels. This is due to the increase in public debt from less than 40 percent of GDP in 2011 to more than 60 percent in 2014 (Figure 2.2) along with rising interest rates.
7
Figure 2.2 Government debt, percent of GDP
Source: The State of the Ghanaian Economy (ISSER various years), and IMF (2015b). Notes: Nominal debt is divided by nominal GDP. The rebasing of GDP to 2006 revealed that previous estimates of nominal
GDP were too low. Official series do not correct pre-2006 values, so they jump by about 60 percent in 2006. To remove this, I have spliced the old and new nominal GDP series by increasing the growth rate of nominal GDP by a factor of 1.6 from 1992, the previous base year, to 2006. (See de la Fuente, 2009, for recommendations on this method.) This spliced series then converges smoothly to the newly rebased series in 2006.
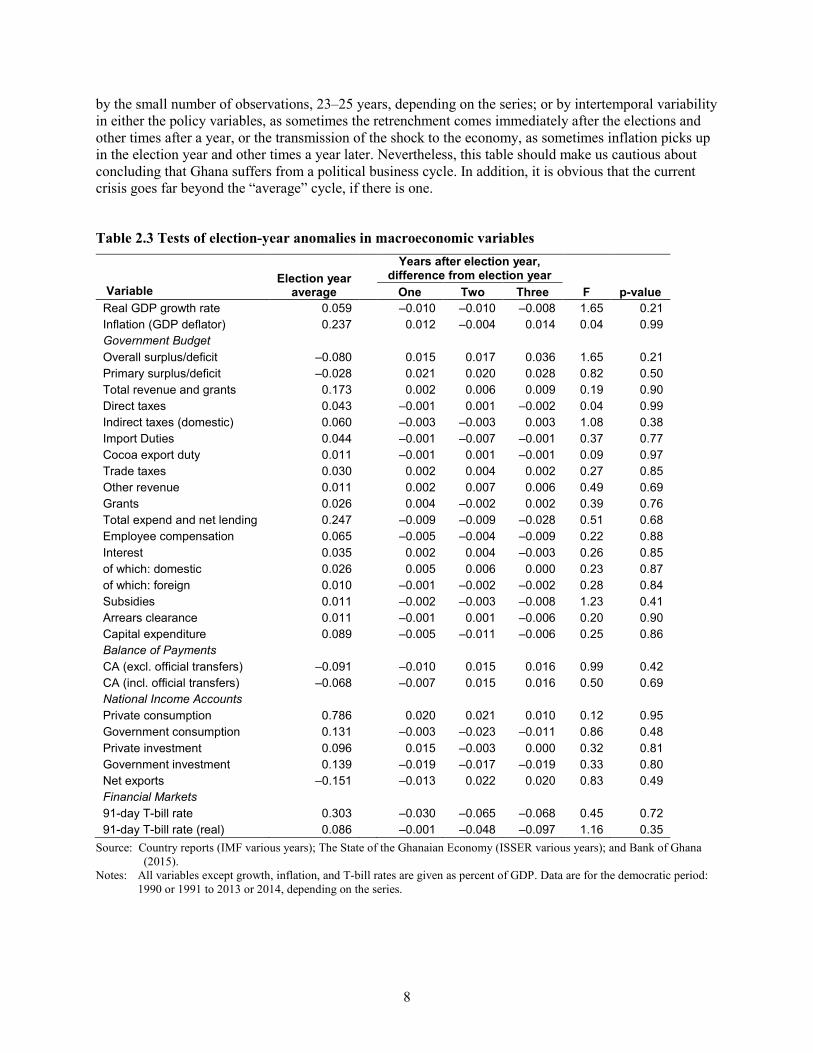
Does Ghana Suffer from a Political Business Cycle? A political business cycle is a regular pattern in GDP, inflation, and other macro variables driven by the election cycle. There is a strong sense in Ghana that, with a few exceptions, governments let deficits “slip” during election years, then bring them back into line afterward. This stimulus might induce a political business cycle. Table 2.3 provides very simple evidence to test this idea: are the values of macro variables in nonelection years consistently different from those in election years? Column 1 gives the variable average for election years; columns 2–4 give the difference between the average in election years and one, two, and three years after an election; columns 5 and 6 give the F-statistic for a test that all the values on columns 2–4 are zero, that is, that nonelection years are not different from election years, along with its p-value.
The pattern of the main outcome variables—real GDP growth, inflation, and the current account of the balance of payments—is what one would expect from a political business cycle, but the effects are mild. GDP growth is about 1.0 percent higher in election years than others, as is inflation, while the current account deficit is about 1.0 percent of GDP more negative in election years. The purported driver of the cycle, the government deficit, also shows the expected pattern: both the overall and primary deficit are about 2.3 percent of GDP higher in election years than others. Perhaps surprisingly, this is not overwhelmingly due to either capital spending or increases in the public wage bill, both of which are less than 1.0 percent of GDP worse in election years. The largest effects are in the T-bill market, where both nominal and real interest rates average about 5.0 percent higher in election years. Overall, then, these patterns look like a political business cycle, but they are, on average, relatively mild fluctuations. Most importantly, none of these differences is statistically significant (see column 6). This could be explained
Total debt, % GDP, spliced
Foreign debt, % GDP, spliced
Domestic debt, % GDP, spliced
8
by the small number of observations, 23–25 years, depending on the series; or by intertemporal variability in either the policy variables, as sometimes the retrenchment comes immediately after the elections and other times after a year, or the transmission of the shock to the economy, as sometimes inflation picks up in the election year and other times a year later. Nevertheless, this table should make us cautious about concluding that Ghana suffers from a political business cycle. In addition, it is obvious that the current crisis goes far beyond the “average” cycle, if there is one.
Table 2.3 Tests of election-year anomalies in macroeconomic variables
Election year average
Years after election year,
difference from election year Variable One Two Three F p-value Real GDP growth rate 0.059 –0.010 –0.010 –0.008 1.65 0.21 Inflation (GDP deflator) 0.237 0.012 –0.004 0.014 0.04 0.99 Government Budget Overall surplus/deficit –0.080 0.015 0.017 0.036 1.65 0.21 Primary surplus/deficit –0.028 0.021 0.020 0.028 0.82 0.50 Total revenue and grants 0.173 0.002 0.006 0.009 0.19 0.90 Direct taxes 0.043 –0.001 0.001 –0.002 0.04 0.99 Indirect taxes (domestic) 0.060 –0.003 –0.003 0.003 1.08 0.38 Import Duties 0.044 –0.001 –0.007 –0.001 0.37 0.77 Cocoa export duty 0.011 –0.001 0.001 –0.001 0.09 0.97 Trade taxes 0.030 0.002 0.004 0.002 0.27 0.85 Other revenue 0.011 0.002 0.007 0.006 0.49 0.69 Grants 0.026 0.004 –0.002 0.002 0.39 0.76 Total expend and net lending 0.247 –0.009 –0.009 –0.028 0.51 0.68 Employee compensation 0.065 –0.005 –0.004 –0.009 0.22 0.88 Interest 0.035 0.002 0.004 –0.003 0.26 0.85 of which: domestic 0.026 0.005 0.006 0.000 0.23 0.87 of which: foreign 0.010 –0.001 –0.002 –0.002 0.28 0.84 Subsidies 0.011 –0.002 –0.003 –0.008 1.23 0.41 Arrears clearance 0.011 –0.001 0.001 –0.006 0.20 0.90 Capital expenditure 0.089 –0.005 –0.011 –0.006 0.25 0.86 Balance of Payments CA (excl. official transfers) –0.091 –0.010 0.015 0.016 0.99 0.42 CA (incl. official transfers) –0.068 –0.007 0.015 0.016 0.50 0.69 National Income Accounts Private consumption 0.786 0.020 0.021 0.010 0.12 0.95 Government consumption 0.131 –0.003 –0.023 –0.011 0.86 0.48 Private investment 0.096 0.015 –0.003 0.000 0.32 0.81 Government investment 0.139 –0.019 –0.017 –0.019 0.33 0.80 Net exports –0.151 –0.013 0.022 0.020 0.83 0.49 Financial Markets 91-day T-bill rate 0.303 –0.030 –0.065 –0.068 0.45 0.72 91-day T-bill rate (real) 0.086 –0.001 –0.048 –0.097 1.16 0.35
Source: Country reports (IMF various years); The State of the Ghanaian Economy (ISSER various years); and Bank of Ghana (2015).
Notes: All variables except growth, inflation, and T-bill rates are given as percent of GDP. Data are for the democratic period: 1990 or 1991 to 2013 or 2014, depending on the series.
9
3. MACROECONOMIC CONSEQUENCES OF THE CRISIS
In the introduction, I noted that the macroeconomic situation in Ghana is quite disappointing: declining growth rates, an unsustainable current account, strong depreciation of the cedi, and resurgent inflation. To what extent are these problems the consequences of the fiscal deficit and electricity crisis outlined in the previous section? A good answer to this question would require a careful statistical analysis that is beyond the scope of this note and may, in any event, be beyond what available data can support. But it is helpful to do something much simpler: think through how the expenditure side of GDP might change in response to an increase in government spending.
The National Expenditure Accounts: Where Does the Demand Go? One national income accounting identity states that GDP must equal the sum of consumption, investment, government spending, and net exports:
GDP = C + I + G + (X – M).
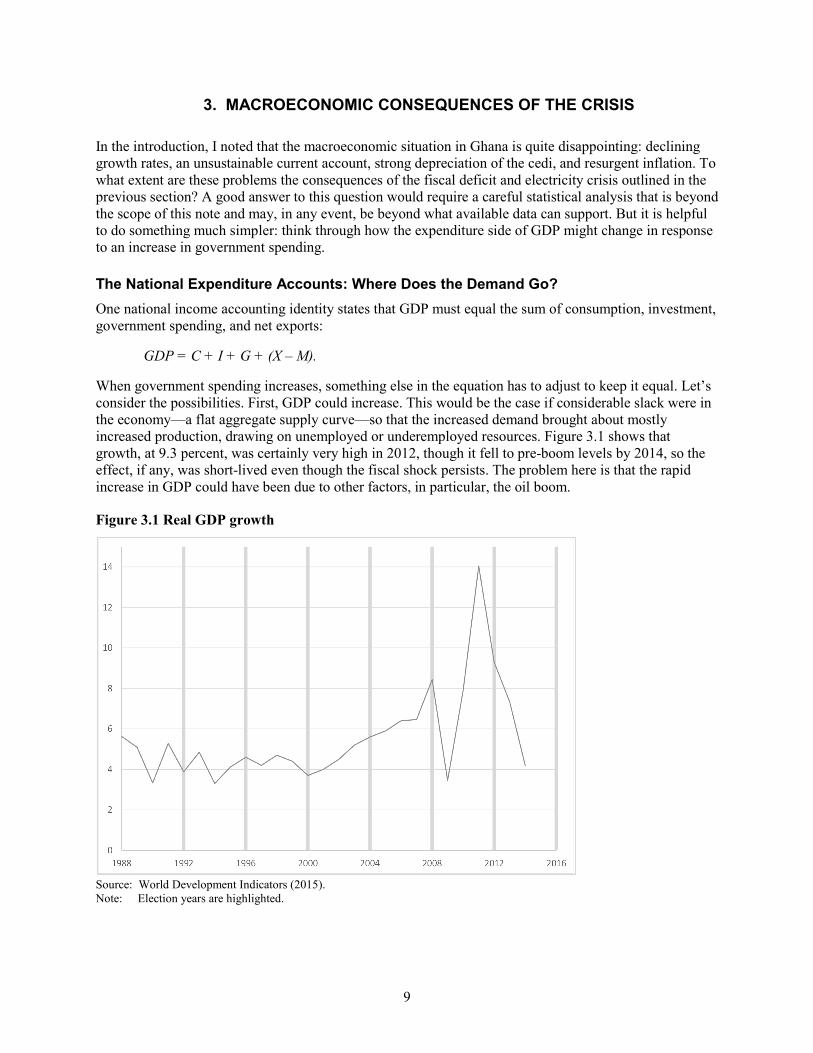
When government spending increases, something else in the equation has to adjust to keep it equal. Let’s consider the possibilities. First, GDP could increase. This would be the case if considerable slack were in the economy—a flat aggregate supply curve—so that the increased demand brought about mostly increased production, drawing on unemployed or underemployed resources. Figure 3.1 shows that growth, at 9.3 percent, was certainly very high in 2012, though it fell to pre-boom levels by 2014, so the effect, if any, was short-lived even though the fiscal shock persists. The problem here is that the rapid increase in GDP could have been due to other factors, in particular, the oil boom.
Figure 3.1 Real GDP growth
Source: World Development Indicators (2015). Note: Election years are highlighted.
10
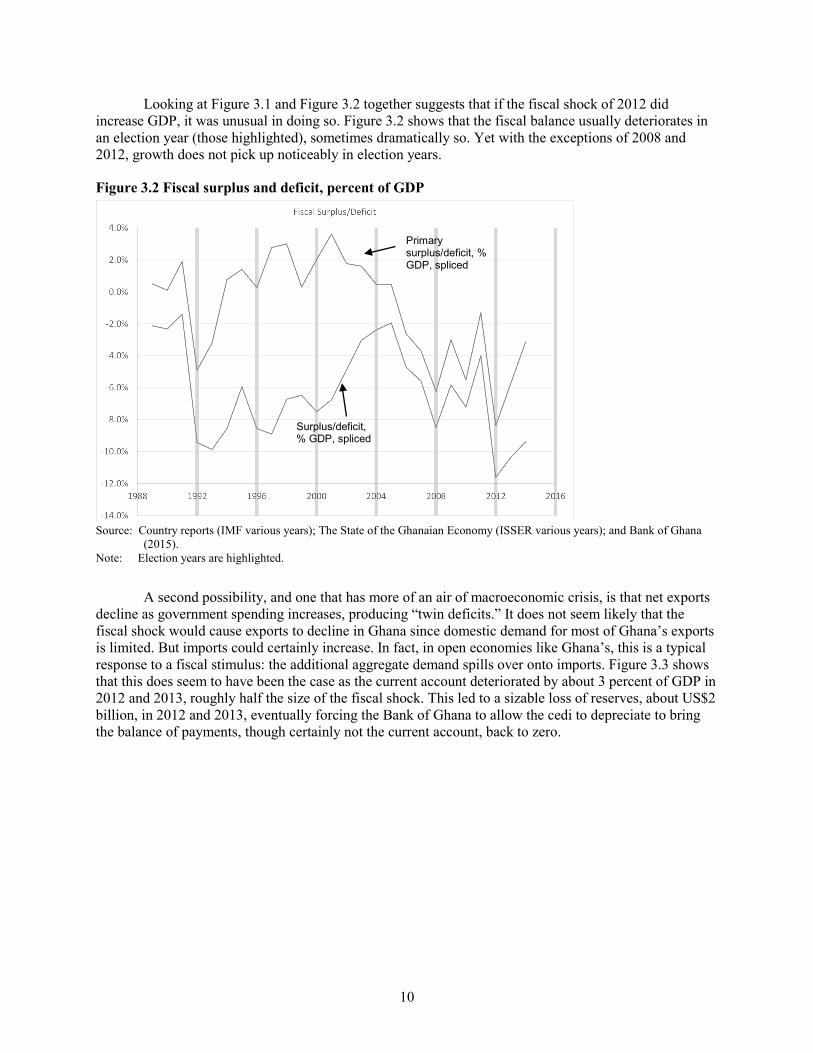
Looking at Figure 3.1 and Figure 3.2 together suggests that if the fiscal shock of 2012 did increase GDP, it was unusual in doing so. Figure 3.2 shows that the fiscal balance usually deteriorates in an election year (those highlighted), sometimes dramatically so. Yet with the exceptions of 2008 and 2012, growth does not pick up noticeably in election years.
Figure 3.2 Fiscal surplus and deficit, percent of GDP
Source: Country reports (IMF various years); The State of the Ghanaian Economy (ISSER various years); and Bank of Ghana (2015).
Note: Election years are highlighted.
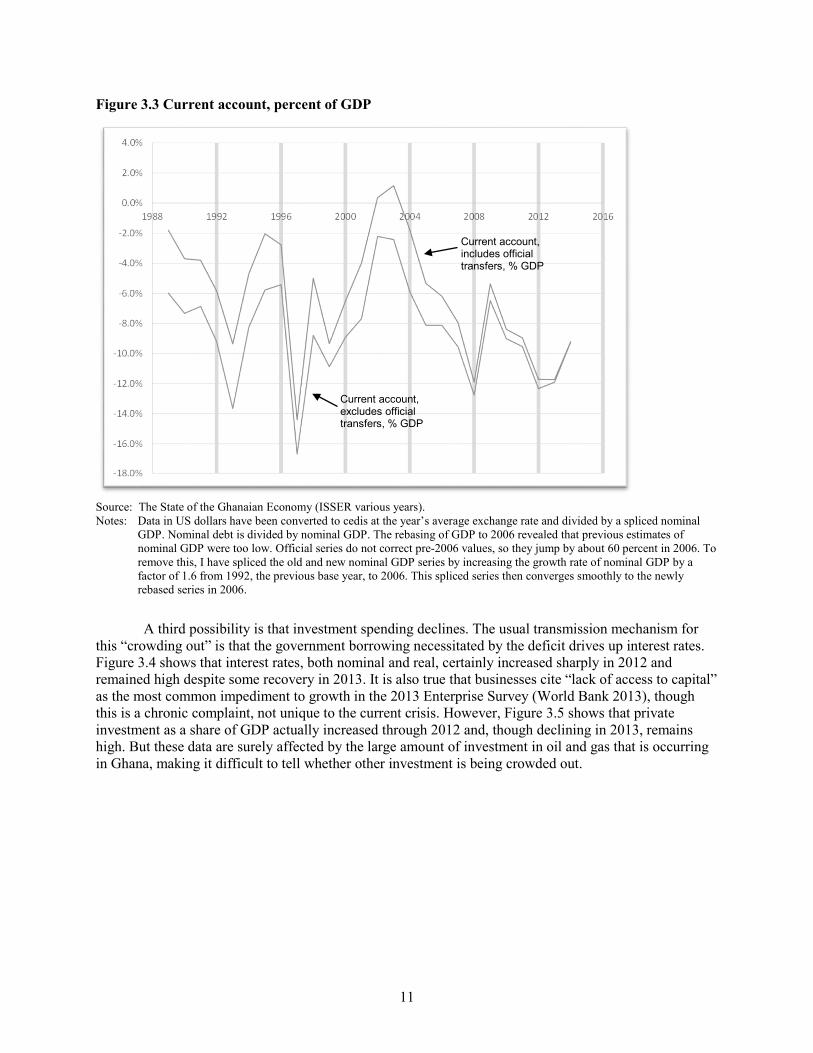
A second possibility, and one that has more of an air of macroeconomic crisis, is that net exports decline as government spending increases, producing “twin deficits.” It does not seem likely that the fiscal shock would cause exports to decline in Ghana since domestic demand for most of Ghana’s exports is limited. But imports could certainly increase. In fact, in open economies like Ghana’s, this is a typical response to a fiscal stimulus: the additional aggregate demand spills over onto imports. Figure 3.3 shows that this does seem to have been the case as the current account deteriorated by about 3 percent of GDP in 2012 and 2013, roughly half the size of the fiscal shock. This led to a sizable loss of reserves, about US$2 billion, in 2012 and 2013, eventually forcing the Bank of Ghana to allow the cedi to depreciate to bring the balance of payments, though certainly not the current account, back to zero.
Surplus/deficit, % GDP, spliced
Primary surplus/deficit, % GDP, spliced
11
Figure 3.3 Current account, percent of GDP
Source: The State of the Ghanaian Economy (ISSER various years). Notes: Data in US dollars have been converted to cedis at the year’s average exchange rate and divided by a spliced nominal
GDP. Nominal debt is divided by nominal GDP. The rebasing of GDP to 2006 revealed that previous estimates of nominal GDP were too low. Official series do not correct pre-2006 values, so they jump by about 60 percent in 2006. To remove this, I have spliced the old and new nominal GDP series by increasing the growth rate of nominal GDP by a factor of 1.6 from 1992, the previous base year, to 2006. This spliced series then converges smoothly to the newly rebased series in 2006.
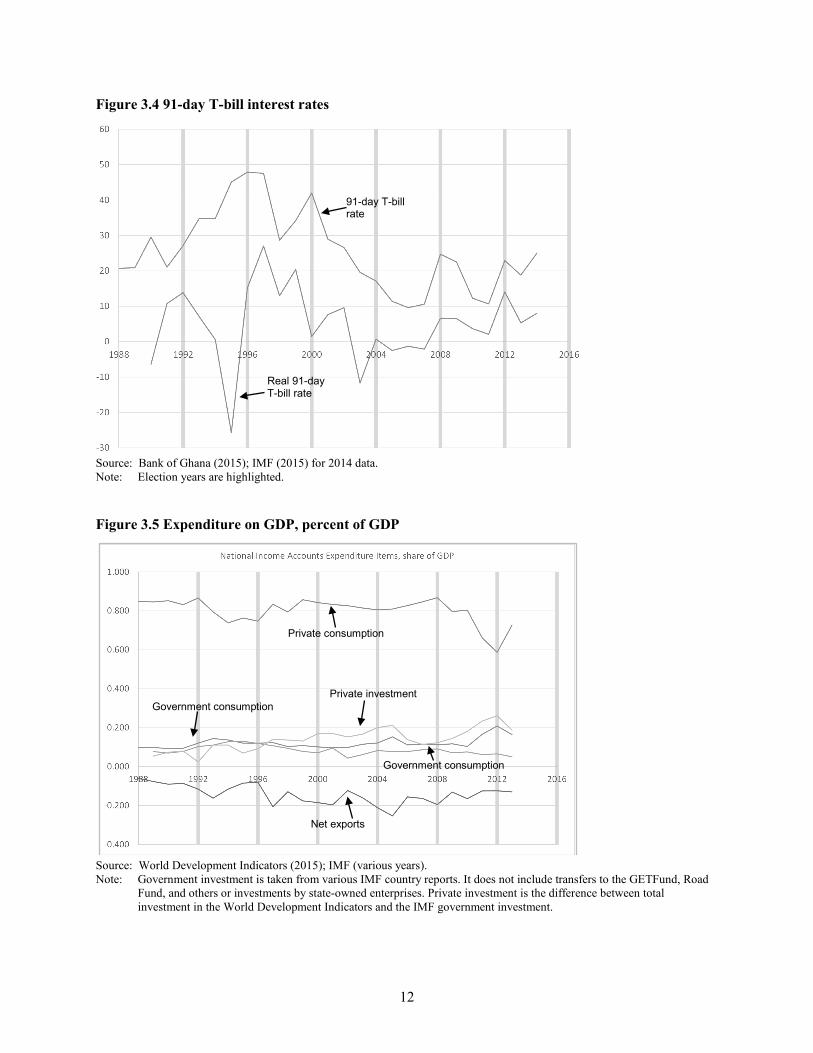
A third possibility is that investment spending declines. The usual transmission mechanism for this “crowding out” is that the government borrowing necessitated by the deficit drives up interest rates. Figure 3.4 shows that interest rates, both nominal and real, certainly increased sharply in 2012 and remained high despite some recovery in 2013. It is also true that businesses cite “lack of access to capital” as the most common impediment to growth in the 2013 Enterprise Survey (World Bank 2013), though this is a chronic complaint, not unique to the current crisis. However, Figure 3.5 shows that private investment as a share of GDP actually increased through 2012 and, though declining in 2013, remains high. But these data are surely affected by the large amount of investment in oil and gas that is occurring in Ghana, making it difficult to tell whether other investment is being crowded out.
Current account, includes official transfers, % GDP
Current account, excludes official transfers, % GDP
12
Figure 3.4 91-day T-bill interest rates
Source: Bank of Ghana (2015); IMF (2015) for 2014 data. Note: Election years are highlighted.
Figure 3.5 Expenditure on GDP, percent of GDP
Source: World Development Indicators (2015); IMF (various years). Note: Government investment is taken from various IMF country reports. It does not include transfers to the GETFund, Road
Fund, and others or investments by state-owned enterprises. Private investment is the difference between total investment in the World Development Indicators and the IMF government investment.
Private consumption
Private investment Government consumption
Net exports
Government consumption
91-day T-bill rate
Real 91-day T-bill rate
13
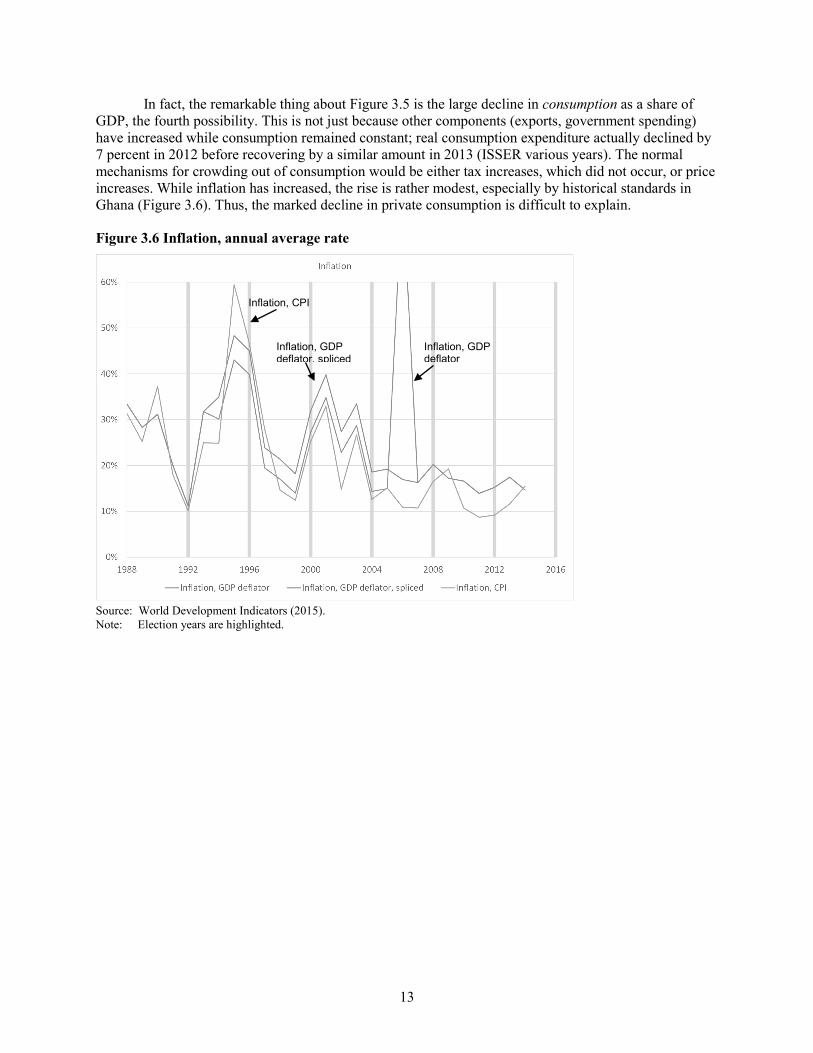
In fact, the remarkable thing about Figure 3.5 is the large decline in consumption as a share of GDP, the fourth possibility. This is not just because other components (exports, government spending) have increased while consumption remained constant; real consumption expenditure actually declined by 7 percent in 2012 before recovering by a similar amount in 2013 (ISSER various years). The normal mechanisms for crowding out of consumption would be either tax increases, which did not occur, or price increases. While inflation has increased, the rise is rather modest, especially by historical standards in Ghana (Figure 3.6). Thus, the marked decline in private consumption is difficult to explain.
Figure 3.6 Inflation, annual average rate
Source: World Development Indicators (2015). Note: Election years are highlighted.
Inflation, CPI
Inflation, GDP deflator
Inflation, GDP deflator, spliced
14
4. POLICY OPTIONS TO RESTORE MACROECONOMIC STABILITY
Large fiscal deficits are not unusual, in Ghana and elsewhere, and they do not always constitute a crisis. What makes the current situation a crisis? In general, governments can run deficits as long as someone is willing to lend them the money to cover them, and as long as the consequences of that borrowing—for example, inflation, rapid depreciation, high real interest rates—are tolerable. Perhaps the most unusual feature of the current crisis in Ghana is its duration: people have been willing to lend the government increasingly large amounts of money for more than three years. This is due in part to Ghana’s low debt levels prior to 2012 (thanks to the Highly Indebted Poor Country (HIPC) program of debt relief), and in part probably to the expectation of substantial oil revenues that will enable the government to repay its debts. Given both domestic interest rates and the rate on the most recent Eurobond issue, however, it seems that creditors’ willingness to buy more debt is reaching its limit (IMF and World Bank 2015). That, in turn, has brought on a crisis that requires a policy response.
Since the main drivers of the current crisis are two shocks that are reversible, one is tempted to say simply, “Reverse those.” On the fiscal side, government’s plan is to do that, more or less, though this is complicated by the fact that just reversing the policies that brought on the deficit will not fix it. The debt accumulated in the intervening years brings associated debt service, which adds 3 to 4 percent of GDP to expenditures every year.
On the energy front, government, energy suppliers, and donors seem to be hard at work at reversing the shortfall in generation. While it is difficult to get verifiable numbers on both the size of the current deficit and the timing of new generation capacity coming online, Volta River Authority (2015) argues that generation capacity will be greatly improved by the beginning of 2016. The Minister for Power (a newly created ministerial post) has promised to resign if regular power is not restored by the end of 2015. And government has agree to a $500 million compact with the Millennium Challenge Corporation that focuses on improving the functioning of the energy sector (though little of that money is being disbursed in the short term). Overall, then, while electricity may not be as cheap as the hydroelectric generation that has been dominant in Ghana, it will be much cheaper than own generation, and the supply shock should dissipate.
This is an opportune moment to address one important policy consideration: electricity prices. To the extent that government must accept responsibility for electricity prices, and raise them, there is no better time to do so than at the end of a long period of rolling blackouts. Consumers are more likely now than ever to appreciate that the price must cover the costs of electricity provision.
The government has announced its desire to get out of the business of setting electricity prices, though this will be difficult on two fronts. Technically, electricity distribution, though not generation, is a natural monopoly that requires some sort of regulation. Most electricity market deregulation schemes recognize this and focus on developing a competitive market at the generation stage, while maintaining a regulated scheme for distribution. In Ghana’s case, this mostly involves a state-owned enterprise, the Electricity Company of Ghana, consciously not exploiting its monopoly position.
The second difficulty is political. When a government has accepted the responsibility for controlling a price, it is very difficult politically to abjure that responsibility. In Ghana and many other countries, for example, even though the exchange has floated officially for many years, at any time of sharp depreciation, the public expects the government to do something about it. Because electricity prices are very public and charged (if not set) by a parastatal company, government will find it difficult to attribute future price increases to market forces and walk away.
Fiscal Policy Responses Much more can be said about the fiscal shock for which government has a detailed plan, agreed with the International Monetary Fund (IMF) under the auspices of a three-year Extended Credit Facility signed in late 2014. Table 4.1 gives key elements of the fiscal plan along with its projections for some
15
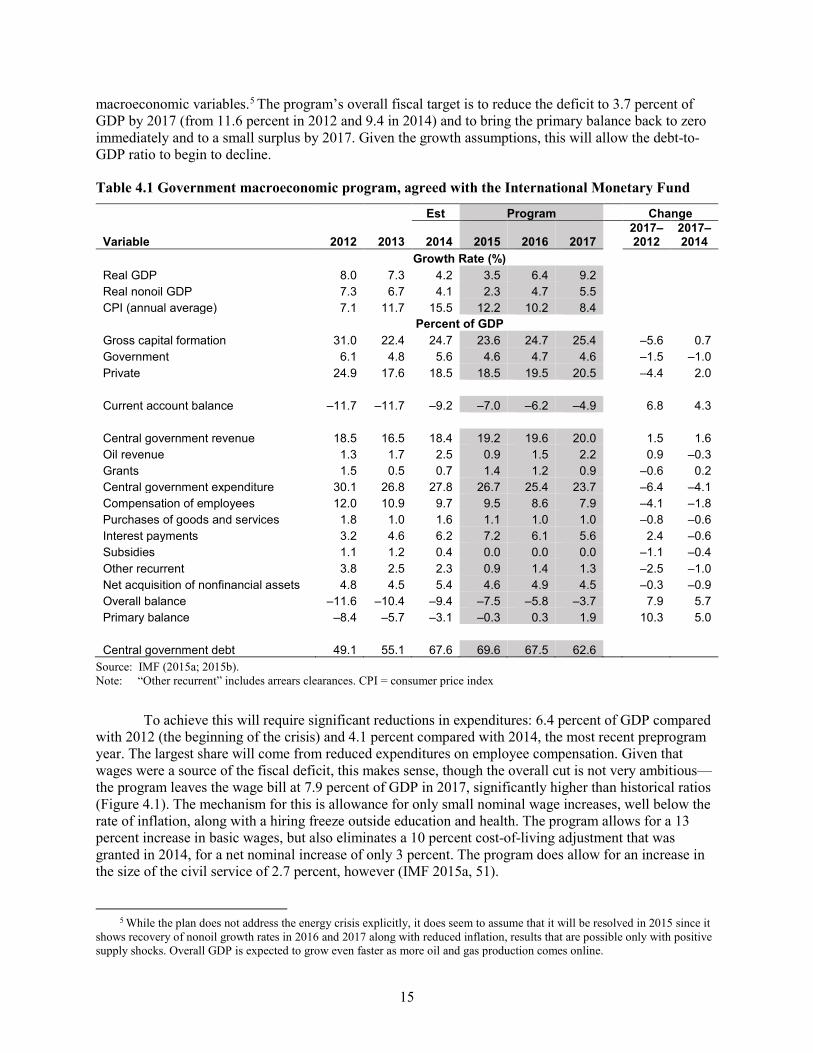
macroeconomic variables.5 The program’s overall fiscal target is to reduce the deficit to 3.7 percent of GDP by 2017 (from 11.6 percent in 2012 and 9.4 in 2014) and to bring the primary balance back to zero immediately and to a small surplus by 2017. Given the growth assumptions, this will allow the debt-to-GDP ratio to begin to decline.
Table 4.1 Government macroeconomic program, agreed with the International Monetary Fund
Est Program Change
Variable 2012 2013 2014 2015 2016 2017 2017–2012
2017–2014
Growth Rate (%) Real GDP 8.0 7.3 4.2 3.5 6.4 9.2 Real nonoil GDP 7.3 6.7 4.1 2.3 4.7 5.5 CPI (annual average) 7.1 11.7 15.5 12.2 10.2 8.4 Percent of GDP Gross capital formation 31.0 22.4 24.7 23.6 24.7 25.4 –5.6 0.7 Government 6.1 4.8 5.6 4.6 4.7 4.6 –1.5 –1.0 Private 24.9 17.6 18.5 18.5 19.5 20.5 –4.4 2.0 Current account balance –11.7 –11.7 –9.2 –7.0 –6.2 –4.9 6.8 4.3 Central government revenue 18.5 16.5 18.4 19.2 19.6 20.0 1.5 1.6 Oil revenue 1.3 1.7 2.5 0.9 1.5 2.2 0.9 –0.3 Grants 1.5 0.5 0.7 1.4 1.2 0.9 –0.6 0.2 Central government expenditure 30.1 26.8 27.8 26.7 25.4 23.7 –6.4 –4.1 Compensation of employees 12.0 10.9 9.7 9.5 8.6 7.9 –4.1 –1.8 Purchases of goods and services 1.8 1.0 1.6 1.1 1.0 1.0 –0.8 –0.6 Interest payments 3.2 4.6 6.2 7.2 6.1 5.6 2.4 –0.6 Subsidies 1.1 1.2 0.4 0.0 0.0 0.0 –1.1 –0.4 Other recurrent 3.8 2.5 2.3 0.9 1.4 1.3 –2.5 –1.0 Net acquisition of nonfinancial assets 4.8 4.5 5.4 4.6 4.9 4.5 –0.3 –0.9 Overall balance –11.6 –10.4 –9.4 –7.5 –5.8 –3.7 7.9 5.7 Primary balance –8.4 –5.7 –3.1 –0.3 0.3 1.9 10.3 5.0 Central government debt 49.1 55.1 67.6 69.6 67.5 62.6
Source: IMF (2015a; 2015b). Note: “Other recurrent” includes arrears clearances. CPI = consumer price index
To achieve this will require significant reductions in expenditures: 6.4 percent of GDP compared with 2012 (the beginning of the crisis) and 4.1 percent compared with 2014, the most recent preprogram year. The largest share will come from reduced expenditures on employee compensation. Given that wages were a source of the fiscal deficit, this makes sense, though the overall cut is not very ambitious—the program leaves the wage bill at 7.9 percent of GDP in 2017, significantly higher than historical ratios (Figure 4.1). The mechanism for this is allowance for only small nominal wage increases, well below the rate of inflation, along with a hiring freeze outside education and health. The program allows for a 13 percent increase in basic wages, but also eliminates a 10 percent cost-of-living adjustment that was granted in 2014, for a net nominal increase of only 3 percent. The program does allow for an increase in the size of the civil service of 2.7 percent, however (IMF 2015a, 51).
5 While the plan does not address the energy crisis explicitly, it does seem to assume that it will be resolved in 2015 since it
shows recovery of nonoil growth rates in 2016 and 2017 along with reduced inflation, results that are possible only with positive supply shocks. Overall GDP is expected to grow even faster as more oil and gas production comes online.
16
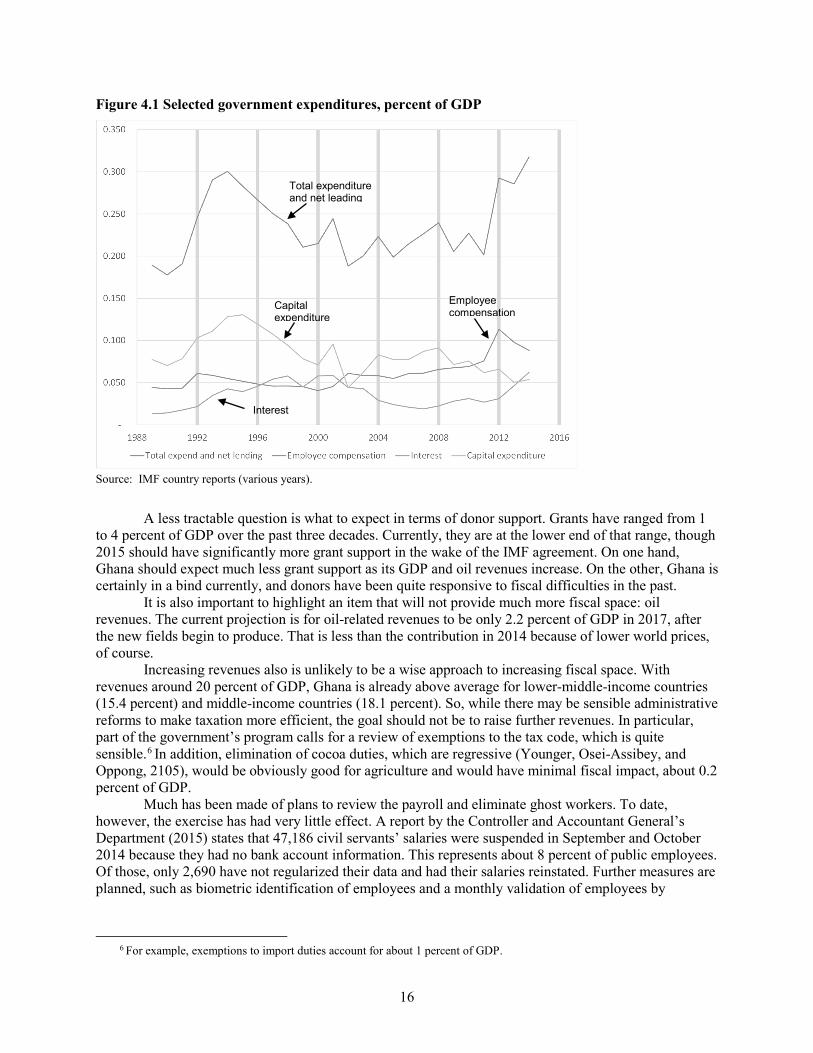
Figure 4.1 Selected government expenditures, percent of GDP
Source: IMF country reports (various years).
A less tractable question is what to expect in terms of donor support. Grants have ranged from 1 to 4 percent of GDP over the past three decades. Currently, they are at the lower end of that range, though 2015 should have significantly more grant support in the wake of the IMF agreement. On one hand, Ghana should expect much less grant support as its GDP and oil revenues increase. On the other, Ghana is certainly in a bind currently, and donors have been quite responsive to fiscal difficulties in the past.
It is also important to highlight an item that will not provide much more fiscal space: oil revenues. The current projection is for oil-related revenues to be only 2.2 percent of GDP in 2017, after the new fields begin to produce. That is less than the contribution in 2014 because of lower world prices, of course.
Increasing revenues also is unlikely to be a wise approach to increasing fiscal space. With revenues around 20 percent of GDP, Ghana is already above average for lower-middle-income countries (15.4 percent) and middle-income countries (18.1 percent). So, while there may be sensible administrative reforms to make taxation more efficient, the goal should not be to raise further revenues. In particular, part of the government’s program calls for a review of exemptions to the tax code, which is quite sensible.6 In addition, elimination of cocoa duties, which are regressive (Younger, Osei-Assibey, and Oppong, 2105), would be obviously good for agriculture and would have minimal fiscal impact, about 0.2 percent of GDP.
Much has been made of plans to review the payroll and eliminate ghost workers. To date, however, the exercise has had very little effect. A report by the Controller and Accountant General’s Department (2015) states that 47,186 civil servants’ salaries were suspended in September and October 2014 because they had no bank account information. This represents about 8 percent of public employees. Of those, only 2,690 have not regularized their data and had their salaries reinstated. Further measures are planned, such as biometric identification of employees and a monthly validation of employees by
6 For example, exemptions to import duties account for about 1 percent of GDP.
Total expenditure and net leading
Capital expenditure
Interest
Employee compensation
17
department heads, but it is not clear how many ghosts this will eliminate. It seems more likely that plans for the program’s later years must include comparably strict limits on wage increases.
The next largest reductions come from “other” expenditures, which includes arrears clearances and capital spending, both declining about 1 percent of GDP relative to 2014. Purchases of goods and services, interest payments, and elimination of electricity and petrol subsidies contribute smaller amounts. The reduced interest payments (relative to 2014) depend on significant declines in interest rates given that government debt declines only marginally. This may be optimistic.
The program also relies on increased tax revenue of 1.6 percent of GDP. Most of this increase comes from imposition of value added tax (17.5 percent) on petroleum products that had previously paid only excise duties, a step already taken in the 2015 budget. While met with strong protests, this is a mostly reasonable tax increase. Fuels are more lightly taxed in Ghana than in other countries, and taxes on petrol and diesel are progressive even after considering their indirect effects on transport costs and goods and services that use transport (Younger, Osei-Assibey, and Oppong, 2015). Taxes on kerosene, on the other hand, are quite regressive and thus less attractive.
Except for a temporary increase in 2015, the program does not envisage grant support returning to 2012 levels.
In all, the program brings the overall deficit to 3.7 percent of GDP and the primary balance to a surplus of 1.9 percent of GDP, both better than has been the case for most of the past 20 years (Figure 3.2). Since Ghana has done passably well with deficits of this size, the program would seem to be adequate to restore macroeconomic stability. A variety of methods indicate that the resulting current account deficit of 4.9 percent of GDP is also sustainable (IMF 2015b).
Further Fiscal Space Despite the fiscal strictures that Ghana faces, different interest groups argue for increased spending on specific pet programs or policies. Ghana’s cash transfer program, LEAP, has good targeting but a small budget. Increasing its coverage could be an effective way to reduce poverty.7 Ghana has signed a Comprehensive Africa Agriculture Development Programme (CAADP) compact to raise agricultural spending to 10 percent of total expenditures, an increase of about 6 percent of expenditures, or about 1.5 percent of GDP. The current electricity crisis makes the productivity of investment in this sector obvious. Given the exigencies of restoring macro stability and the government’s existing plan to do so, is further “fiscal space” remaining for any of these initiatives (or any others)? The outline of the existing macro plan would seem to say no. The plan cuts most spending, makes optimistic assumptions about growth rates, inflation, and interest rates on government debt, and still only just brings the fiscal and current account deficits to sustainable levels. There does not seem to be room for further spending on social welfare, agriculture, infrastructure, or anything else.
That said, the current program is less than ambitious in one place: the public-sector wage bill. Figure 4.1 shows that as recently as a decade ago, Ghana spent only 5–6 percent of GDP on employee compensation. That figure is now 9–10 percent of GDP, and the current program plans to lower it to only 8 percent by 2017. More aggressive reform seems possible on this front, though it would be politically difficult and probably require significant retrenchment and accompanying severance pay, and several years to achieve.
History Lessons This current crisis is not the first time that Ghana has struggled with large fiscal deficits and the resulting macroeconomic imbalances. Yet Figure 3.2 shows that Ghana has also made large reductions in fiscal deficits three times in the democratic period: 1993–1995, 2000–2005, and 2008–2011. How were these reductions achieved, and do they hold lessons for policy?
7 Many other lower- and lower-middle-income countries with cash transfers spend around 1 percent of GDP on those programs. Ghana spends a tiny fraction of that.
18
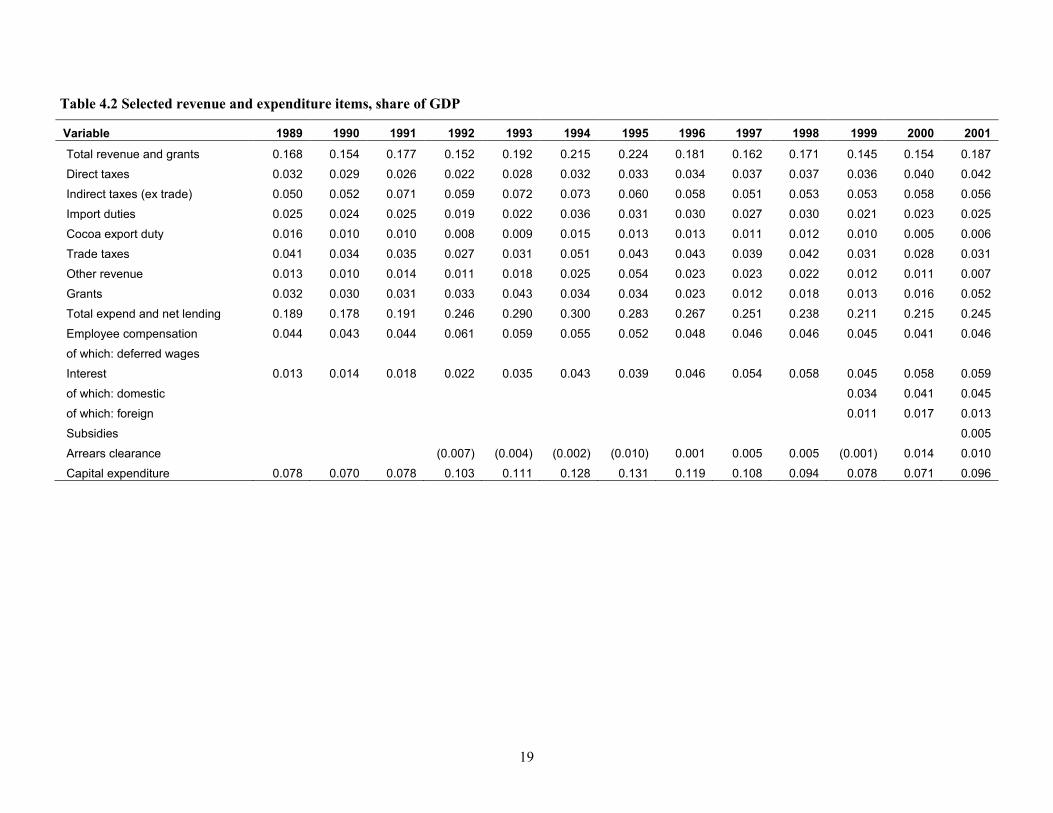
Table 4.2 shows that revenues increased by 7.2 percent of GDP between 1992 and 1995, an extraordinary increase. But most of the increase, 4.3 percent of GDP, was from “other revenues,” in particular, divestiture of state-owned companies and other assets acquired by the Non-Performing Assets Recovery Trust (NPART). Gains from other sources were much more modest—1.1 percent of GDP in direct taxes, 1.2 percent of GDP from import duties (which were exceptionally low in 1992)—and expenditures actually increased. Although the government of Ghana does still own some companies, their sale as part of the solution to the current crisis has not been discussed.
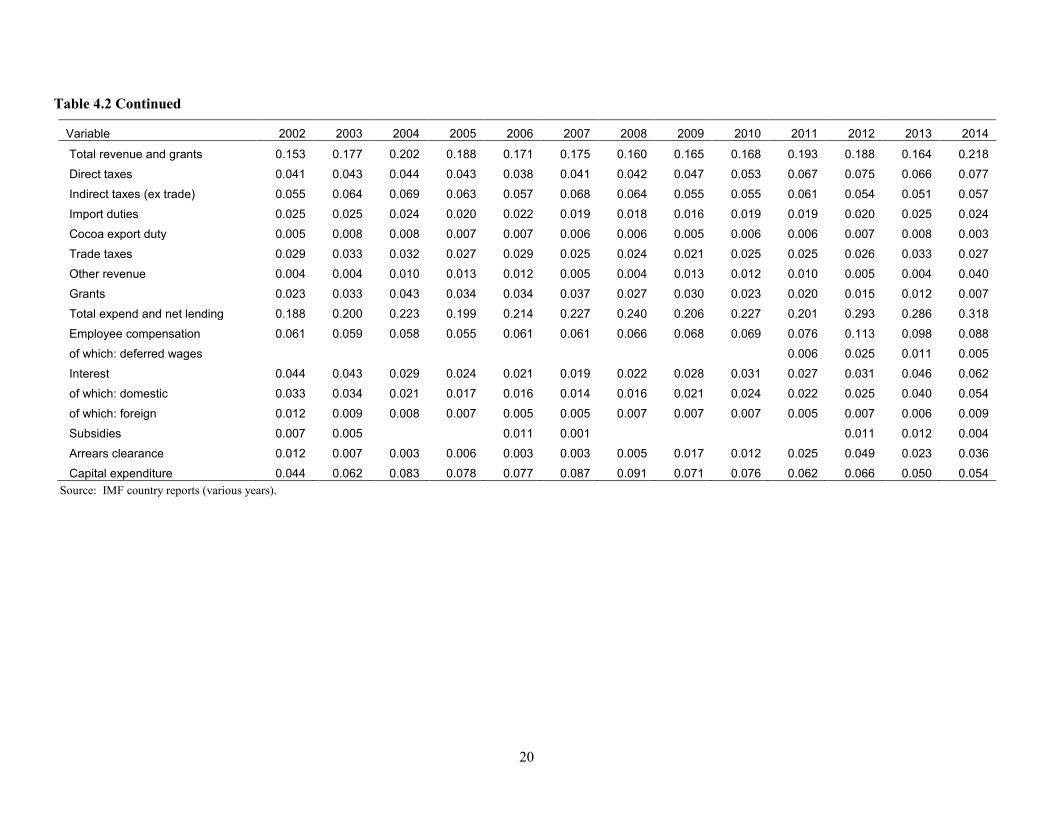
From 2000 to 2005, revenues again increased, by 3.4 percent of GDP, but expenditures also declined, by 1.6 percent of GDP. Most of the revenue gain came from a 1.8 percent of GDP increase in grants, and all of the expenditure reduction was accounted for by a 3.4 percent of GDP decline in interest expenditures. Both of these improvements came from the significant debt relief afforded Ghana under HIPC and the Multilateral Debt Relief Initiative. These options also are not on the table in the current crisis.
From 2008 to 2011, the story is somewhat different. Here, revenues once again increased, by about 3.3 percent of GDP, mostly on the strength of improved direct taxes, up 2.5 percent of GDP. Note that this does not reflect higher oil revenues, which did not kick in until 2011 and even then were less than 1.0 percent of GDP. Instead, both Pay As You Earn (PAYE) personal income tax and corporate income tax increased during this period, perhaps due to increased “formalization” of the economy (ISSER various years). Expenditures also declined in this period, by 3.9 percent of GDP, most of which was a decline in capital expenditures. These had been extraordinarily high in 2007 and 2008 as Ghana prepared to host several international events.
In sum, much of Ghana’s success in reducing fiscal deficits during the democratic period has come from one-off items: asset sales or debt relief. Neither is under discussion as a solution to the current crisis. To the extent that other policies contributed to restoration of fiscal balance in these episodes, they did so mostly through increases in direct taxes and reductions in capital spending. But the former are historically high in Ghana currently, and the latter historically low (Table 4.2). Pursuing similar policies now seems unlikely to be either wise or successful.
19
Table 4.2 Selected revenue and expenditure items, share of GDP
Variable 1989 1990 1991 1992 1993 1994 1995 1996 1997 1998 1999 2000 2001
Total revenue and grants 0.168 0.154 0.177 0.152 0.192 0.215 0.224 0.181 0.162 0.171 0.145 0.154 0.187
Direct taxes 0.032 0.029 0.026 0.022 0.028 0.032 0.033 0.034 0.037 0.037 0.036 0.040 0.042
Indirect taxes (ex trade) 0.050 0.052 0.071 0.059 0.072 0.073 0.060 0.058 0.051 0.053 0.053 0.058 0.056
Import duties 0.025 0.024 0.025 0.019 0.022 0.036 0.031 0.030 0.027 0.030 0.021 0.023 0.025
Cocoa export duty 0.016 0.010 0.010 0.008 0.009 0.015 0.013 0.013 0.011 0.012 0.010 0.005 0.006
Trade taxes 0.041 0.034 0.035 0.027 0.031 0.051 0.043 0.043 0.039 0.042 0.031 0.028 0.031
Other revenue 0.013 0.010 0.014 0.011 0.018 0.025 0.054 0.023 0.023 0.022 0.012 0.011 0.007
Grants 0.032 0.030 0.031 0.033 0.043 0.034 0.034 0.023 0.012 0.018 0.013 0.016 0.052
Total expend and net lending 0.189 0.178 0.191 0.246 0.290 0.300 0.283 0.267 0.251 0.238 0.211 0.215 0.245
Employee compensation 0.044 0.043 0.044 0.061 0.059 0.055 0.052 0.048 0.046 0.046 0.045 0.041 0.046
of which: deferred wages
Interest 0.013 0.014 0.018 0.022 0.035 0.043 0.039 0.046 0.054 0.058 0.045 0.058 0.059
of which: domestic 0.034 0.041 0.045
of which: foreign 0.011 0.017 0.013
Subsidies 0.005
Arrears clearance (0.007) (0.004) (0.002) (0.010) 0.001 0.005 0.005 (0.001) 0.014 0.010
Capital expenditure 0.078 0.070 0.078 0.103 0.111 0.128 0.131 0.119 0.108 0.094 0.078 0.071 0.096
20
Table 4.2 Continued
Variable 2002 2003 2004 2005 2006 2007 2008 2009 2010 2011 2012 2013 2014
Total revenue and grants 0.153 0.177 0.202 0.188 0.171 0.175 0.160 0.165 0.168 0.193 0.188 0.164 0.218
Direct taxes 0.041 0.043 0.044 0.043 0.038 0.041 0.042 0.047 0.053 0.067 0.075 0.066 0.077
Indirect taxes (ex trade) 0.055 0.064 0.069 0.063 0.057 0.068 0.064 0.055 0.055 0.061 0.054 0.051 0.057
Import duties 0.025 0.025 0.024 0.020 0.022 0.019 0.018 0.016 0.019 0.019 0.020 0.025 0.024
Cocoa export duty 0.005 0.008 0.008 0.007 0.007 0.006 0.006 0.005 0.006 0.006 0.007 0.008 0.003
Trade taxes 0.029 0.033 0.032 0.027 0.029 0.025 0.024 0.021 0.025 0.025 0.026 0.033 0.027
Other revenue 0.004 0.004 0.010 0.013 0.012 0.005 0.004 0.013 0.012 0.010 0.005 0.004 0.040
Grants 0.023 0.033 0.043 0.034 0.034 0.037 0.027 0.030 0.023 0.020 0.015 0.012 0.007
Total expend and net lending 0.188 0.200 0.223 0.199 0.214 0.227 0.240 0.206 0.227 0.201 0.293 0.286 0.318
Employee compensation 0.061 0.059 0.058 0.055 0.061 0.061 0.066 0.068 0.069 0.076 0.113 0.098 0.088
of which: deferred wages 0.006 0.025 0.011 0.005
Interest 0.044 0.043 0.029 0.024 0.021 0.019 0.022 0.028 0.031 0.027 0.031 0.046 0.062
of which: domestic 0.033 0.034 0.021 0.017 0.016 0.014 0.016 0.021 0.024 0.022 0.025 0.040 0.054
of which: foreign 0.012 0.009 0.008 0.007 0.005 0.005 0.007 0.007 0.007 0.005 0.007 0.006 0.009
Subsidies 0.007 0.005 0.011 0.001 0.011 0.012 0.004
Arrears clearance 0.012 0.007 0.003 0.006 0.003 0.003 0.005 0.017 0.012 0.025 0.049 0.023 0.036
Capital expenditure 0.044 0.062 0.083 0.078 0.077 0.087 0.091 0.071 0.076 0.062 0.066 0.050 0.054 Source: IMF country reports (various years).
21
5. CONCLUSION
Ghana is in the midst of a macroeconomic crisis brought about primarily by two shocks: a large and prolonged fiscal deficit and an electric energy crisis. The first shock is about 6 percent of GDP; the latter is more difficult to quantify, but may be as large as 4 percent of GDP. Both of these shocks are large but not unprecedented in Ghana’s recent history. The difference this time around is the persistence of the fiscal shock: government waited three years to address the deficit, while in the past, the necessary retrenchment was more immediate. This difference probably reflects Ghana’s much better debt position at the beginning of this crisis. Together, debt relief, the revaluation of GDP, and the perceived increase in oil revenues made government appear more creditworthy, thus allowing it to borrow large amounts for an extended period of time: government continued to borrow because it could. With sharp increases in interest rates on Ghanaian debt both at home and abroad, that leeway has ended.
Addressing this crisis is within government’s reach. Indeed, the current policy framework may do that, with some luck. Significant new generation capacity is set to come online in the latter part of 2015, though whether it will be sufficient is unknown. If the supply shock has been toward the worst end of the estimates produced here, reversing it would give the economy a strong boost in the form of a positive supply shock. That, in turn, might justify the rather optimistic projections for GDP growth, inflation, and interest rates inherent in the government’s macroeconomic program. The luck needed is no further supply or terms-of-trade shocks—something that can never be certain. In particular, 2015/2016 looks to be an El Niño year, which sometimes brings drought to West Africa, something that could be very costly to agriculture and electricity generation.
On the fiscal side, government ran up the current deficits; it should be able to reverse them. This is not as easy as it seems, both politically and financially. In addition to reversing its expenditure increases, government must cover an additional 3–4 percent of GDP in interest payments on the debts accumulated during the past four years. It is also important to note that the current macroeconomic program does not return either the budget or current account deficit to zero, but to about 4 percent of GDP, amounts that have been typical for Ghana but may not be optimal. In particular, the current plan does not appear to leave any room for expenditure items that matter to various constituencies and to Ghana’s future growth.
For those who would like to increase expenditures, the challenge is to find the fiscal space to fund them. Being optimistic is difficult. While Ghana has successfully reduced large deficits in the past, it has mostly relied on the one-off solutions of asset sales and debt relief. Other options such as tax increases or reductions in capital expenditure seem unwise, as the former are at historic highs as a share of GDP and the latter at historic lows. The one place where room appears for significant fiscal improvement is the public-sector wage bill, which despite the current plan’s intentions to rein it in, remains quite large as a share of GDP and much larger than it has been in the recent past. Understanding why this is the case and how government can address it should be a priority for medium-term fiscal policy.
22
REFERENCES
Ankrah, T., and I. Ankrah. 2015. “Prediction of Electricity Consumption in Ghana: Long or Short Memory.” Advances in Economics and Business 3 (3): 107–117.
Bank of Ghana. 2015. Monetary Time Series Data. Accessed August 2015. https://bog.gov.gh/index.php? option=com_wrapper&view=wrapper&Itemid=231.
Controller and Accountant General’s Department. 2015. Report on the Validation Exercise on Suspended Salaries of Employees without Bank Account Numbers for the Months of September and October, 2014, as at 27 February. Accra.
de la Fuente, A. 2009. A Mixed Splicing Procedure for Economic Time Series. Working Paper No. 415. Barcelona Economics Working Paper Series, Barcelona.
Ghana, Ministry of Finance and Economic Planning. Various years. Fiscal Data. Accessed August 2015. http://www.mofep.gov.gh/fiscal-data.
Ghana Statistical Service. 2010. Rebasing of Ghana’s National Accounts to Reference Year 2006. Information Paper on Economic Statistics. Accra.
IMF (International Monetary Fund). 1998. IMF Staff Country Report No. 98/2. Washington, DC.
———. 2000. IMF Staff Country Report No. 00/1. Washington, DC.
———. 2001. IMF Country Report No. 01/141. Washington, DC.
———. 2003. IMF Country Report No. 03/133. Washington, DC.
———. 2005. IMF Country Report No. 05/292. Washington, DC.
———. 2007. IMF Country Report No. 07/210. Washington, DC.
———. 2008. IMF Country Report No. 08/344. Washington, DC.
———. 2009. IMF Country Report No. 09/256. Washington, DC.
———. 2011. IMF Country Report No. 11/128. Washington, DC.
———. 2012. IMF Country Report No. 12/201. Washington, DC.
———. 2013. IMF Country Report No. 13/187. Washington, DC.
———. 2014. IMF Country Report No. 14/129. Washington, DC.
———. 2015a. IMF Country Report No. 15/103. Washington, DC.
———. 2015b. IMF Country Report No. 15/245. Washington, DC.
IMF (International Monetary Fund) and World Bank. 2015. First Review Under the Extended Credit Facility Arrangement and Request for Waiver and Modifications of Performance Criteria—Debt Sustainability Analysis. Washington, DC.
ISSER (Institute of Statistical, Social, and Economic Research). Various years. The State of the Ghanaian Economy. University of Ghana, Legon, Ghana.
Volta River Authority. 2015. “The Cost of ‘Dum-Sor’ on Ghana’s Economy.” VRA Newsletter 6, April–June.
World Bank. 2013. Enterprise Surveys. Accessed August 2015. http://www.enterprisesurveys.org/~/media/ GIAWB/EnterpriseSurveys/Documents/CountryHighlights/Ghana-2013.pdf.
———. 2015. World Development Indicators database. Accessed August 2015. http://databank.worldbank.org/ data/reports.aspx?source=world-development-indicators.
Younger, S. D., E. Osei-Assibey, and F. Oppong. 2015. Fiscal Incidence in Ghana. CEQ Working Paper 35. New Orleans, LA, US: Center for Inter-American Policy and Research and Department of Economics, Tulane University and Inter-American Dialogue.


RECENT IFPRI DISCUSSION PAPERS
For earlier discussion papers, please go to www.ifpri.org/pubs/pubs.htm#dp. All discussion papers can be downloaded free of charge.
1496. Temporary and permanent migrant selection: Theory and evidence of ability–search cost dynamics. Joyce J. Chen, Katrina Kosec, and Valerie Mueller, 2015.
1495. The effect of insurance enrollment on maternal and child healthcare use: The case of Ghana. Gissele Gajate-Garrido and Clement Ahiadeke, 2015.
1494. Stories of change in nutrition: A tool pool. Stuart Gillespie and Mara van den Bold, 2015.
1493. Optimal tariffs with smuggling: A spatial analysis of Nigerian rice policy options. Michael Johnson and Paul Dorosh, 2015.
1492. Smallholders and land tenure in Ghana: Aligning context, empirics, and policy. Isabel Lambrecht and Sarah Asare, 2015.
1491. Returns to agricultural public spending in Africa South of the Sahara. Samuel Benin, 2015.
1490. Lost in translation: The Fractured conversation about trade and food security. Eugenio Díaz-Bonilla, 2015.
1489. Gender roles and food safety in 20 informal livestock and fish value chains. Delia Grace, Kristina Roesel, Erastus Kang’ethe, Bassirou Bonfoh, and Sophie Theis, 2015.
1488. Farm household typologies and mechanization patterns in Nepal Terai: Descriptive analysis of the Nepal Living Standards Survey. Hiroyuki Takeshima, Rajendra Prasad Adhikari, Mahendra Nath Poudel, and Anjani Kumar, 2015.
1487. Public-private partnerships and the reduction of undernutrition in developing countries. John Hoddinott, Stuart Gillespie, and Sivan Yosef, 2015.
1486. How does women’s time in reproductive work and agriculture affect maternal and child nutrition?: Evidence from Bangladesh, Cambodia, Ghana, Mozambique, and Nepal. Hitomi Komatsu, Hazel Jean L. Malapit, and Sophie Theis, 2015.
1485. US maize data reveals adaptation to heat and water stress. Timothy S. Thomas, 2015.
1484. Customary tenure and innovative measures of safeguarding land rights in Africa: The community land initiative (iniciativa de terras comunitárias) in Mozambique. Hosaena Ghebru, Raul Pitoro, and Sileshi Woldeyohannes, 2015.
1483. The International Model for Policy Analysis of Agricultural Commodities and Trade (IMPACT): Model description for version 3. Sherman Robinson, Daniel Mason-D’Croz, Shahnila Islam, Timothy B. Sulser, Richard Robertson, Tingju Zhu, Arthur Gueneau, Gauthier Pitois, and Mark Rosegrant, 2015.
1482. Enhancing food security in South Sudan: The role of public food stocks and cereal imports. Paul A. Dorosh, Shahidur Rashid, Abigail Childs, and Joanna van Asselt, 2015.
1481. Gender, headship, and the life cycle: Landownership in four Asian countries. Kathryn Sproule, Caitlin Kieran, Agnes Quisumbing, and Cheryl Doss, 2015.
1480. The food-energy-water security nexus: Definitions, policies, and methods in an application to Malawi and Mozambique. Thea Nielsen, Franziska Schunemann, Emily McNulty, Manfred Zeller, Ephraim Nkonya, Edward Kato, Stefan Meyer, Weston Anderson, Tingju Zhu, Antonio Queface, and Lawrence Mapemba, 2015.
1479. The making of public investments: Champions, coordination, and characteristics of nutrition interventions, Tewodaj Mogues and Lucy Billings, 2015.
1478. The dynamics of smallholder marketing behavior: Explorations using Ugandan and Mozambican panel data. Bjorn Van Campenhout, 2015.
1477. Adjusting to external shocks in small open economies: The case of Honduras. Samuel Morley and Valeria Piñeiro, 2015.
1476. Drivers of growth in agricultural returns to scale: The hiring in of tractor services in the Terai of Nepal. Hiroyuki Takeshima, 2015.
1475. The contribution of increased equity to the estimated social benefits from a transfer program: An illustration from PROGRESA. Harold Alderman, Jere R. Behrman, and Afia Tasneem, 2015.
1474. Reconstructing public expenditure data: Use of classification systems to better measure public spending in agriculture — A Mozambique case study. Tewodaj Mogues, Leonardo Caceres, Francisco A. Fernandez, and Mariam B. Umarji, 2015.
INTERNATIONAL FOOD POLICY RESEARCH INSTITUTE
www.ifpri.org
IFPRI HEADQUARTERS 2033 K Street, NW Washington, DC 20006-1002 USA Tel.: +1-202-862-5600 Fax: +1-202-467-4439 Email: [email protected]