Embed Size (px)
Citation preview
WWW.AFROBAROMETER.ORG
Ghanaians’ evaluations of public service delivery Findings from the Afrobarometer Round 6 survey in Ghana
WWW.AFROBAROMETER.ORG
At a glance
Cell phone networks, public schools, electricity grids, and pipe water systems are the most common public services found by fieldworkers in survey communities. Post offices, police stations, tarred roads, health clinics, and sewage systems are the least common.
Government received negative performance ratings on its efforts at providing reliable supply of electricity, water and sanitation services, basic health services, educational needs, and maintenance of roads and bridges.
If government were to increase its spending, Ghanaians would appreciate if the increment goes into financing education and health care.
Ghanaians are divided in their opinion on whether they will willingly pay higher taxes or user fees for increased government spending on health care.
WWW.AFROBAROMETER.ORG
What is Afrobarometer?
• An African-led, non-partisan survey research project that
measures citizen attitudes on democracy and governance, the
economy, civil society, and other topics.
• Started in 12 countries in 1999, expanded to more than 30 African
countries in Round 5 (2011-2013).
• Goal: To give the public a voice in policymaking by providing
high-quality public opinion data to policymakers, policy
advocates, civil society organizations, academics, news media,
donors and investors, and ordinary Africans.
• National partners in each country conduct the survey. In Ghana, the Afrobarometer Round 6 survey was conducted by the Center for Democratic Development (CDD-Ghana).

Where Afrobarometer works
WWW.AFROBAROMETER.ORG
Methodology
• Nationally representative sample of adult citizens o All respondents are randomly selected.
o Sample is distributed across regions and urban-rural areas in
proportion to their share in the national population.
o Every adult citizen has an equal chance of being selected.
• Face-to-face interviews in the language of the respondent’s choice.
• Standard questionnaire allows comparisons across countries and over time.
• Sample size of 2,400 yields a margin of error of ±2% at a 95% confidence level.
• Fieldwork for Round 6 in Ghana was conducted May 24 to June 10, 2014.
WWW.AFROBAROMETER.ORG
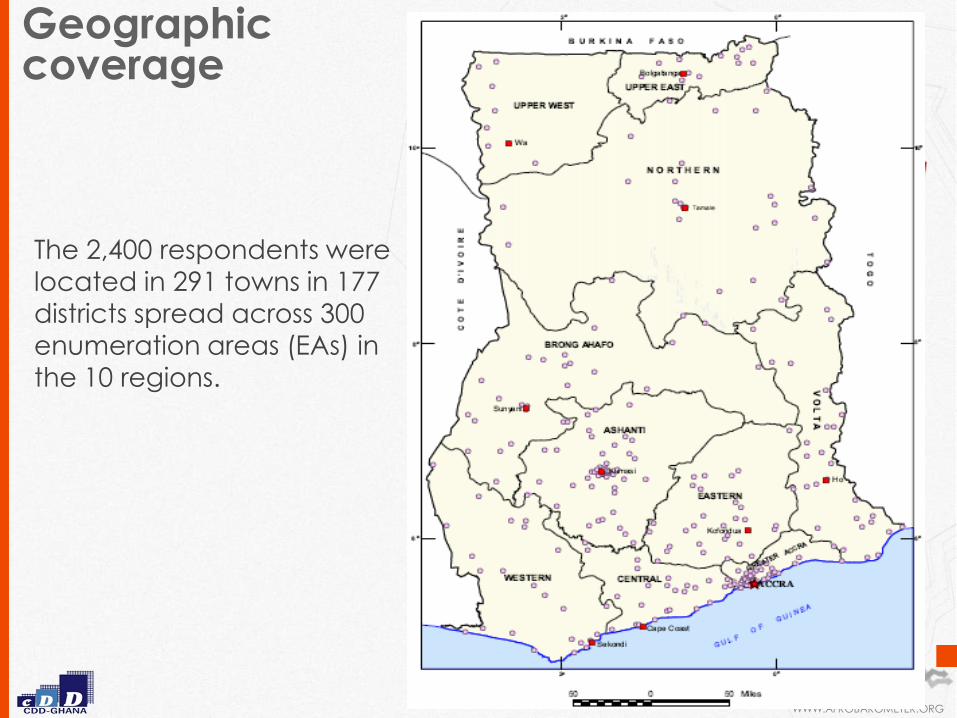
Geographic coverage
The 2,400 respondents were
located in 291 towns in 177
districts spread across 300
enumeration areas (EAs) in
the 10 regions.
WWW.AFROBAROMETER.ORG
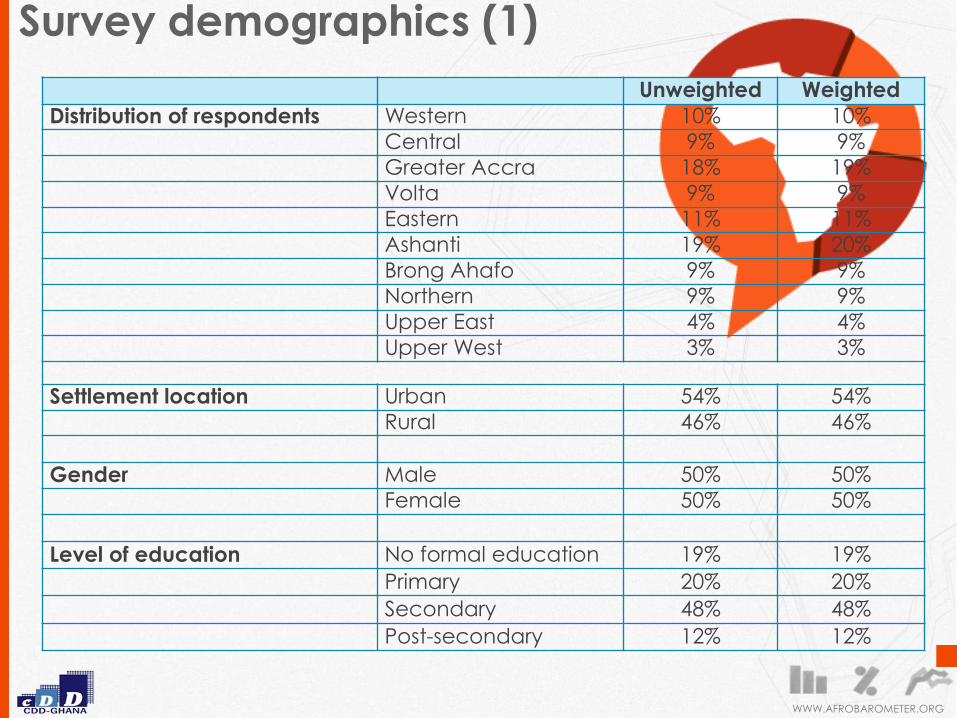
Survey demographics (1)
Unweighted Weighted
Distribution of respondents Western 10% 10%
Central 9% 9%
Greater Accra 18% 19%
Volta 9% 9%
Eastern 11% 11%
Ashanti 19% 20%
Brong Ahafo 9% 9%
Northern 9% 9%
Upper East 4% 4%
Upper West 3% 3%
Settlement location Urban 54% 54%
Rural 46% 46%
Gender Male 50% 50%
Female 50% 50%
Level of education No formal education 19% 19%
Primary 20% 20%
Secondary 48% 48%
Post-secondary 12% 12%
WWW.AFROBAROMETER.ORG
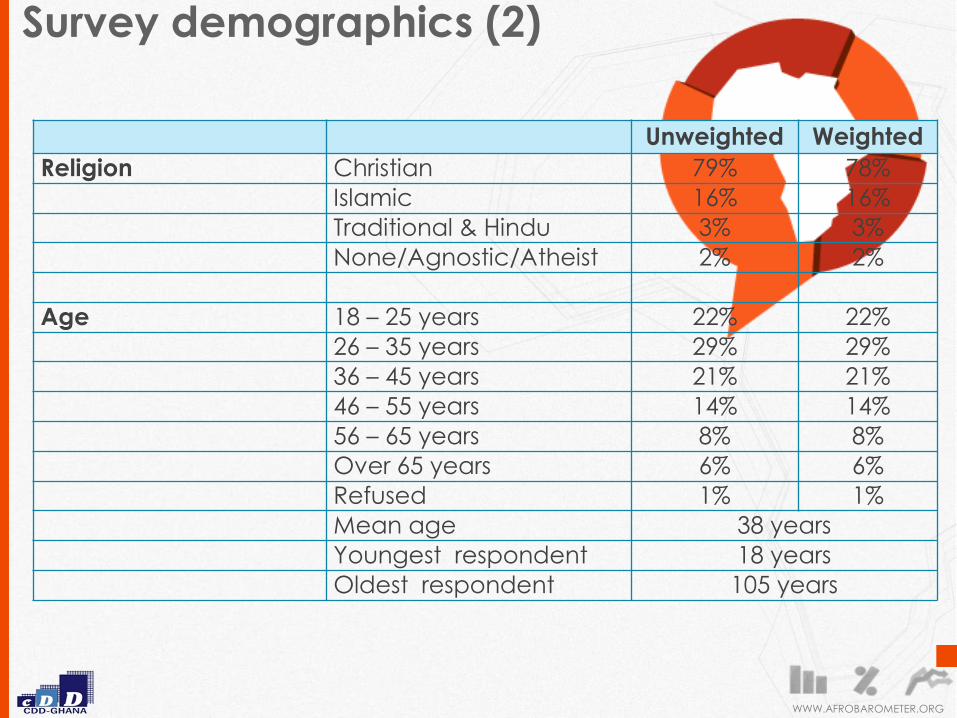
Unweighted Weighted
Religion Christian 79% 78%
Islamic 16% 16%
Traditional & Hindu 3% 3%
None/Agnostic/Atheist 2% 2%
Age 18 – 25 years 22% 22%
26 – 35 years 29% 29%
36 – 45 years 21% 21%
46 – 55 years 14% 14%
56 – 65 years 8% 8%
Over 65 years 6% 6%
Refused 1% 1%
Mean age 38 years
Youngest respondent 18 years
Oldest respondent 105 years
Survey demographics (2)
Results

WWW.AFROBAROMETER.ORG
Presence of public services in survey locations
WWW.AFROBAROMETER.ORG
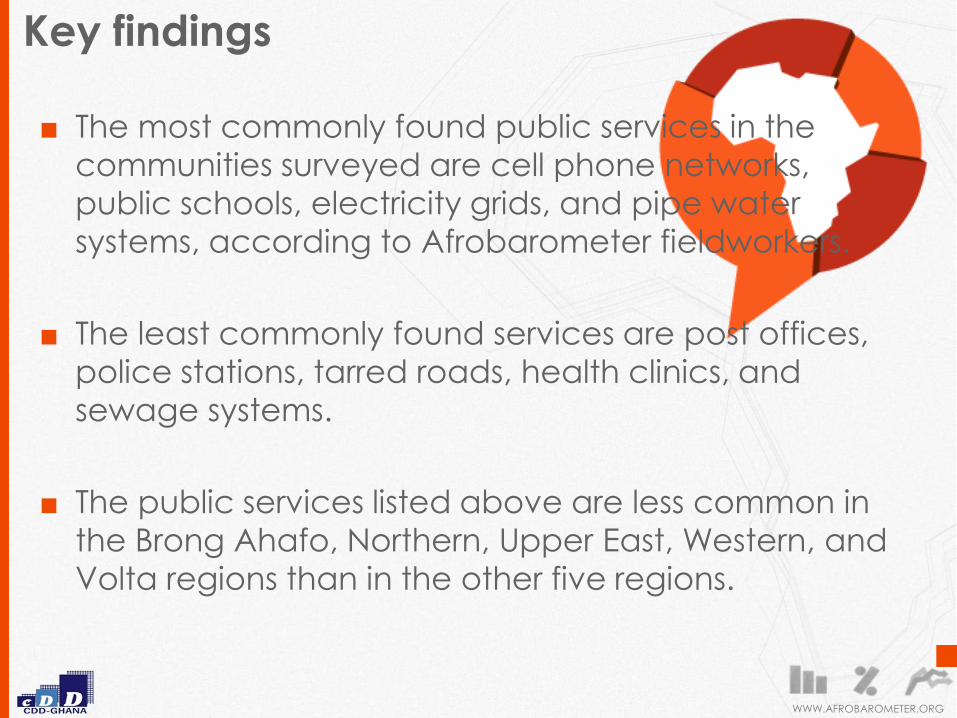
Key findings
■ The most commonly found public services in the
communities surveyed are cell phone networks,
public schools, electricity grids, and pipe water
systems, according to Afrobarometer fieldworkers.
■ The least commonly found services are post offices,
police stations, tarred roads, health clinics, and
sewage systems.
■ The public services listed above are less common in
the Brong Ahafo, Northern, Upper East, Western, and
Volta regions than in the other five regions.

Most common public services
Fieldworkers were asked: Are the following services present in the primary sampling unit / enumeration area? (a) Electricity grid that most houses could access; (b) Piped water system that most houses could access; and (c) Cell phone service. Fieldworkers were asked: Are the following services present in the primary sampling unit / enumeration area or in easy walking distance? (a) School .
0%
20%
40%
60%
80%
100%
Cell phone Public school Electricity grid Pipe water
system
94% 90% 84%
70%
6% 10% 16%
30%
Most common public services in survey communities
Yes No

Most common public services, by region
Survey localities in the Western Region were least likely to
have cell phone service.
Surveyed communities in the Northern, Volta and Brong
Ahafo regions were less likely to have public schools than
other regions.
Surveyed communities in Brong Ahafo, Northern, and
Upper East regions were less likely to have electricity grids
than other regions.
Surveyed communities in Central, Volta, Northern, Upper
East, and Upper West regions were much less likely to
have pipe water systems than other regions.

Most common public services, by region
Most common public services in survey communities, by region (% “Yes”)
Cell phone
Networks
Public
schools
Electricity
grids
Pipe water
systems Western 70% 96% 78% 81%
Central 100% 97% 97% 58%
Greater Accra 100% 100% 100% 86%
Volta 93% 75% 95% 42%
Eastern 99% 96% 84% 79%
Ashanti 98% 96% 96% 84%
Brong Ahafo 100% 57% 61% 84%
Northern 84% 82% 52% 38%
Upper East 100% 96% 51% 34%
Upper West 84% 100% 84% 19%
National Average 94% 90% 84% 70%

Fieldworkers were asked: Are the following services present in the primary sampling unit / enumeration area or in
easy walking distance? (a) Post office; (b) Police Station; and (c) Health Clinic .
Fieldworkers were asked: Are the following services present in the primary sampling unit / enumeration area? (a)
Sewage system that most houses could access. Fieldworkers were asked: Thinking of the journey here, was the road at the start point in the PSU / EA paved / tarred / concrete?
Least common public services
0%
20%
40%
60%
80%
Sewage
system
Health clinic Tarred road Police station Post office
54% 53% 51%
28% 23%
46% 47% 49%
72% 76%
Least common public services in survey communities
Yes No

Least common public services, by region
In each of the 10 regions, a substantial proportion of surveyed communities lacked sewage systems. The situation was worst in Volta, Upper West, Upper East, Central, and Western Regions.
The presence of health clinics is lower in survey communities in Northern, Western, Brong Ahafo, and Volta regions compared to the national average.
Compared to the national average, the regional averages for the presence of tarred roads in survey localities in the Greater Accra, Volta, Northern and Upper East Regions are lower.
Survey communities in three regions –Upper West, Eastern, and Ashanti – have relatively higher regional averages for the presence of police stations than the national one.
The regional averages for post offices in the localities surveyed in Eastern, Northern, and Ashanti Regions are much better than the national average.

Least common public services, by region
Least common public services in survey communities, by region (% “Yes”)
Sewage
systems
Health
clinics
Tarred
roads
Police
stations
Post
offices Western 48% 39% 53% 28% 24%
Central 27% 54% 54% 25% 14%
Greater Accra 80% 66% 33% 27% 22%
Volta 17% 5% 31% 0% 4%
Eastern 63% 73% 91% 49% 49%
Ashanti 67% 71% 64% 43% 29%
Brong Ahafo 57% 13% 49% 3% 3%
Northern 53% 43% 29% 24% 30%
Upper East 24% 71% 17% 13% 16%
Upper West 19% 81% 92% 45% 19%
National Average 54% 53% 51% 28% 23%

Presence of public services, by urban-rural location
• The most commonly found public services (i.e. pipe water
systems, electricity grids, public schools, and cell phone
networks) are much more often available in urban areas
(from a low of 89% to a high of 100%) than in rural
localities (from a low of 47% to a high of 87%).
• Similarly, the presence of the least commonly found
public services (i.e. post offices, police stations, tarred
roads, health clinics, and sewage systems) is better in
urban areas (from a low of 36% to a high of 78%) than in
rural communities (from a low of 7% to a high of 39%).

Presence of public services, trend over time
Since 2002, surveyed communities are more likely to have
electricity grids (24 percentage point increase), sewage
systems (23 percentage points), pipe water systems (17
percentage points), and tarred roads (14 percentage
points). Similarly, since 2008, the presence of cell phone
service has increased by 15 percentage points.
However, the presence of post offices declined by 14
percentage points between 2002 and 2014.
Between 2012 and 2014, the presence of pipe water
systems witnessed a significant 14 percentage point
improvement.

Presence of public services in survey communities
2002
2005
2008
2012
2014
Change
[2012-2014]
Change
[2002-2014]
Electricity grid 60% 77% 75% 82% 84% +2% +24%
Sewage system 31% 38% 39% 52% 54% +2% +23%
Pipe water system 53% 60% 66% 56% 70% +14% +17%
Cell phone service -- -- 79% 93% 94%
+1% +15 %
(Since 2008)
Tarred/ paved road 37% 57% 43% 52% 51% -1% +14%
Health Clinic 52% 47% 57% 51% 53% +2% +1% Post office
37% 29% 66% 23% 23% 0% -14%
Police station 33% 31% 37% 30% 28% -2% -5% Public school 94% 93% 92% 87% 90% +3% -4%
Presence of public services, trend over time
WWW.AFROBAROMETER.ORG
Opinions on access to public services

WWW.AFROBAROMETER.ORG
Key findings
■ Some of those who accessed public services found it easy to do so, while others experienced some difficulties. Some offered bribes, while others did not.
■ Ghanaians are sharply divided on whether they are willing to pay higher taxes or user fees for increased government spending on health care.
■ Most Ghanaians believe it is unethical to access government services without paying for them.

WWW.AFROBAROMETER.ORG
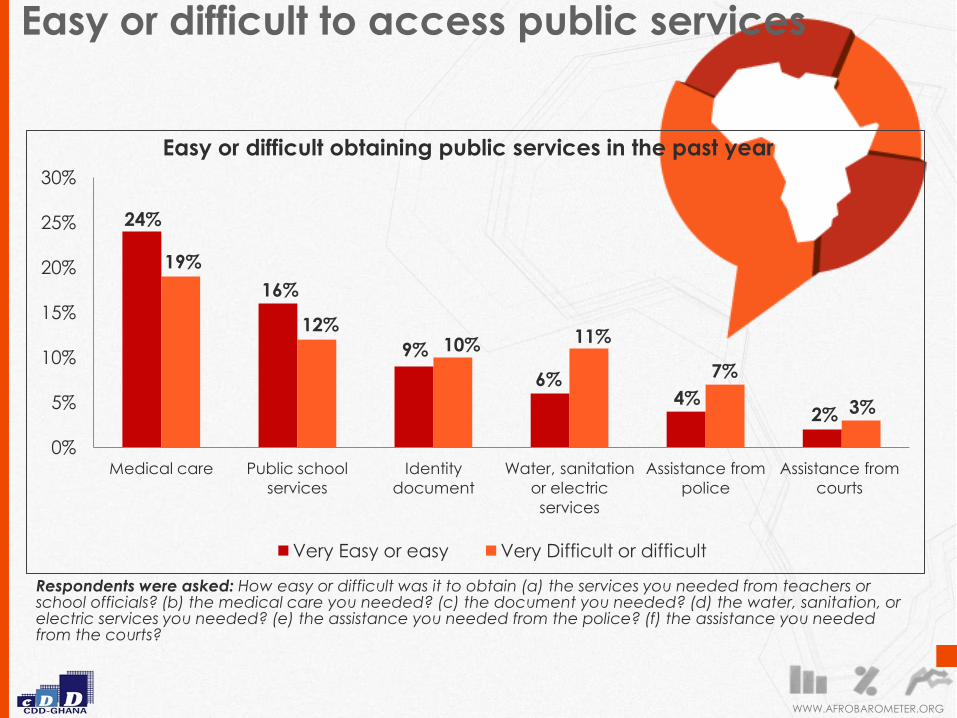
Easy or difficult to access public services
Some Ghanaians found it “very easy” or “easy” accessing
medical care (24%); public school services (16%); identity
document (9%); water, sanitation or electric services (6%);
Assistance from the police (4%); and assistance from the
courts (2%).
Others also said it was “very difficult” or “difficult” obtaining
these services (medical care, 19%; public school services, 12%;
identity document, 10%; water, sanitation or electric services,
11%; Assistance from the police, 7%; and assistance from the
courts, 3%).
WWW.AFROBAROMETER.ORG
Respondents were asked: How easy or difficult was it to obtain (a) the services you needed from teachers or school officials? (b) the medical care you needed? (c) the document you needed? (d) the water, sanitation, or electric services you needed? (e) the assistance you needed from the police? (f) the assistance you needed from the courts?
Easy or difficult to access public services
24%
16%
9%
6% 4%
2%
19%
12% 10% 11%
7%
3%
0%
5%
10%
15%
20%
25%
30%
Medical care Public school
services
Identity
document
Water, sanitation
or electric
services
Assistance from
police
Assistance from
courts
Easy or difficult obtaining public services in the past year
Very Easy or easy Very Difficult or difficult

WWW.AFROBAROMETER.ORG
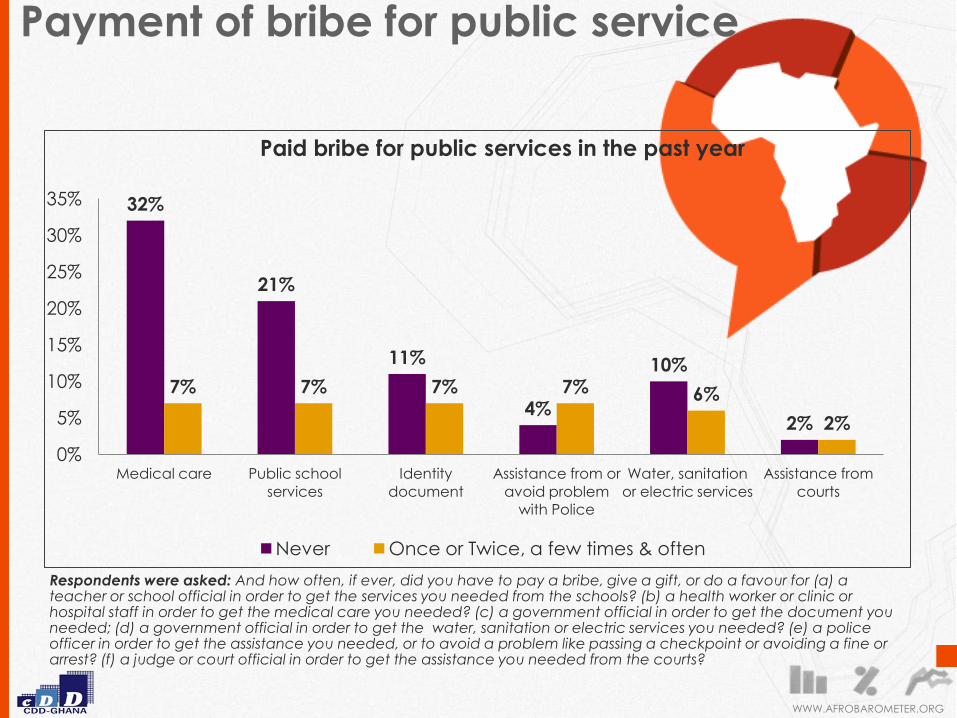
Payment of bribe for public service
• Some Ghanaians (7% each) offered bribe or did a favour in order to access medical care; public school services, identity document, and assistance from or avoid problem with the police.
• 6% and 2% also offered bribe to access water, sanitation or electric services and to obtain assistance from the courts, respectively.
• Others said they “never” offered bribe to obtain medical care (32%); public school services (21%); identity document (11%); water, sanitation or electric services (10%); assistance from or avoid problem with the police (4%); and assistance from the courts (2%).
WWW.AFROBAROMETER.ORG
Payment of bribe for public service
Respondents were asked: And how often, if ever, did you have to pay a bribe, give a gift, or do a favour for (a) a teacher or school official in order to get the services you needed from the schools? (b) a health worker or clinic or hospital staff in order to get the medical care you needed? (c) a government official in order to get the document you needed; (d) a government official in order to get the water, sanitation or electric services you needed? (e) a police officer in order to get the assistance you needed, or to avoid a problem like passing a checkpoint or avoiding a fine or arrest? (f) a judge or court official in order to get the assistance you needed from the courts?
32%
21%
11%
4%
10%
2%
7% 7% 7% 7% 6%
2%
0%
5%
10%
15%
20%
25%
30%
35%
Medical care Public school
services
Identity
document
Assistance from or
avoid problem
with Police
Water, sanitation
or electric services
Assistance from
courts
Paid bribe for public services in the past year
Never Once or Twice, a few times & often

Paying more for increased health spending
Respondents were asked: If the government decided to make people pay more taxes or user fees in order to
increase spending on public health care, would you support this decision or oppose it?
• 45% of Ghanaians are opposed to increasing taxes and
user fees in exchange for increased health expenditures
by the government; 41% favour such a policy.
2%
5%
6%
41%
45%
0% 5% 10% 15% 20% 25% 30% 35% 40% 45% 50%
Dont know
Neither
It depends
Strongly or somewhat support
Strongly or somewhat oppose
Support paying more taxes or user fees for increased health spending by government
Right or wrong: Not paying for government services
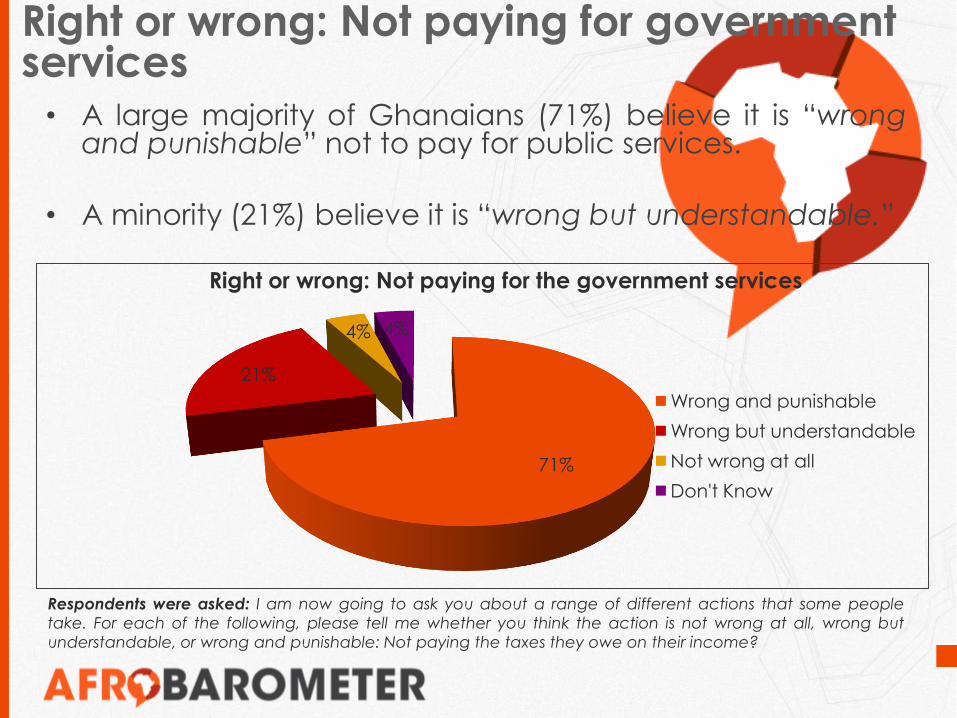
Respondents were asked: I am now going to ask you about a range of different actions that some people
take. For each of the following, please tell me whether you think the action is not wrong at all, wrong but
understandable, or wrong and punishable: Not paying the taxes they owe on their income?
• A large majority of Ghanaians (71%) believe it is “wrong and punishable” not to pay for public services.
• A minority (21%) believe it is “wrong but understandable.”
71%
21%
4% 4%
Right or wrong: Not paying for the government services
Wrong and punishable
Wrong but understandable
Not wrong at all
Don't Know
WWW.AFROBAROMETER.ORG
Government performance in public service delivery

WWW.AFROBAROMETER.ORG
Key findings
■ Ghanaians generally think government has not performed well in delivering public services such as basic health care, education, water and sanitation services, maintenance of roads and bridges, and reliable electricity.
■ There are sharp differences in urban and rural assessments, but no significant gender differences.
■ The over-time trend data generally show an upturn in negative ratings of government’s service delivery performance.
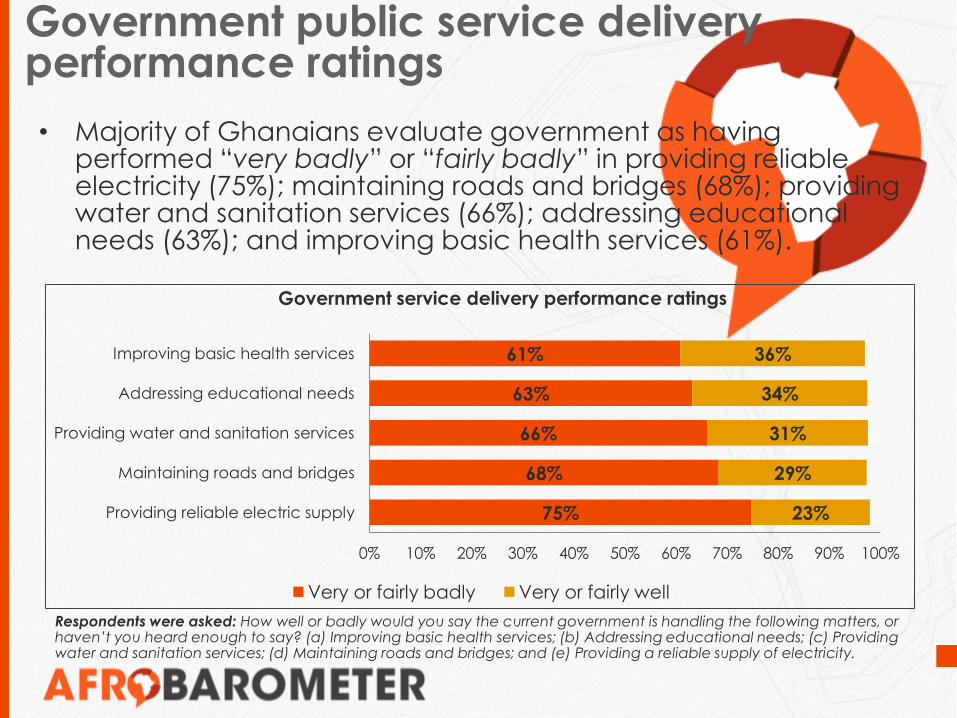
Government public service delivery performance ratings
• Majority of Ghanaians evaluate government as having performed “very badly” or “fairly badly” in providing reliable electricity (75%); maintaining roads and bridges (68%); providing water and sanitation services (66%); addressing educational needs (63%); and improving basic health services (61%).
75%
68%
66%
63%
61%
23%
29%
31%
34%
36%
0% 10% 20% 30% 40% 50% 60% 70% 80% 90% 100%
Providing reliable electric supply
Maintaining roads and bridges
Providing water and sanitation services
Addressing educational needs
Improving basic health services
Government service delivery performance ratings
Very or fairly badly Very or fairly well
Respondents were asked: How well or badly would you say the current government is handling the following matters, or haven’t you heard enough to say? (a) Improving basic health services; (b) Addressing educational needs; (c) Providing water and sanitation services; (d) Maintaining roads and bridges; and (e) Providing a reliable supply of electricity.
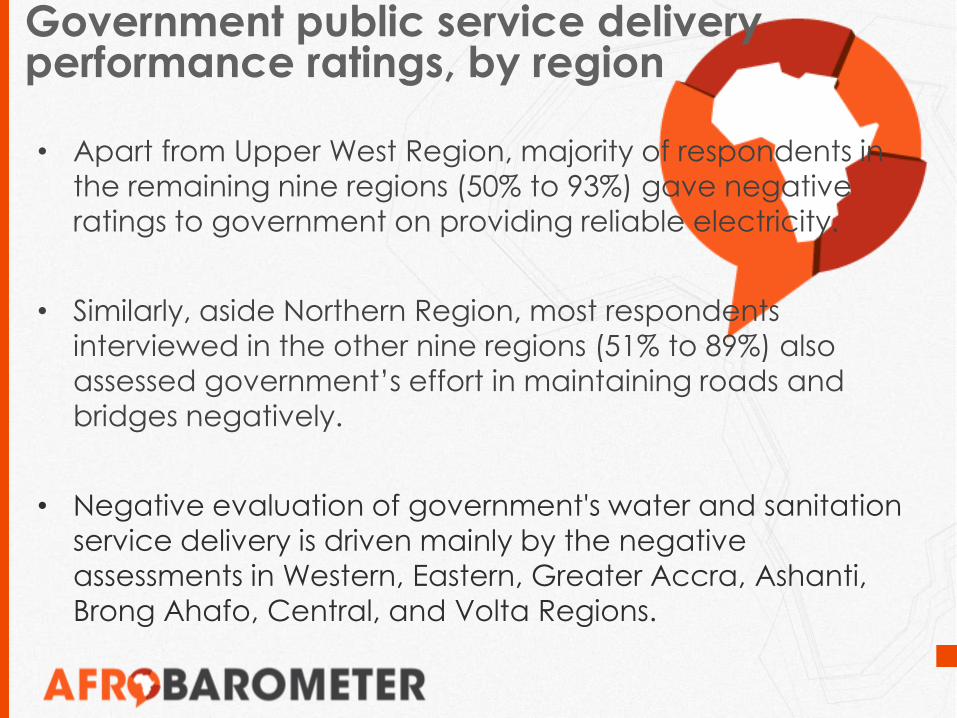
Government public service delivery performance ratings, by region
• Apart from Upper West Region, majority of respondents in
the remaining nine regions (50% to 93%) gave negative
ratings to government on providing reliable electricity.
• Similarly, aside Northern Region, most respondents
interviewed in the other nine regions (51% to 89%) also
assessed government’s effort in maintaining roads and
bridges negatively.
• Negative evaluation of government's water and sanitation
service delivery is driven mainly by the negative
assessments in Western, Eastern, Greater Accra, Ashanti,
Brong Ahafo, Central, and Volta Regions.
Government public service delivery performance ratings, by region
• Negative assessments in Western, Eastern, Ashanti, Greater
Accra, Brong Ahafo, and Central Regions are the key
drivers of the unfavourable performance rating for
government efforts at addressing educational needs.
• In Western, Eastern, Ashanti, and Greater Accra Regions,
the negative performance assessment ratings for
government’s delivery of basic health services are higher
than the national average.
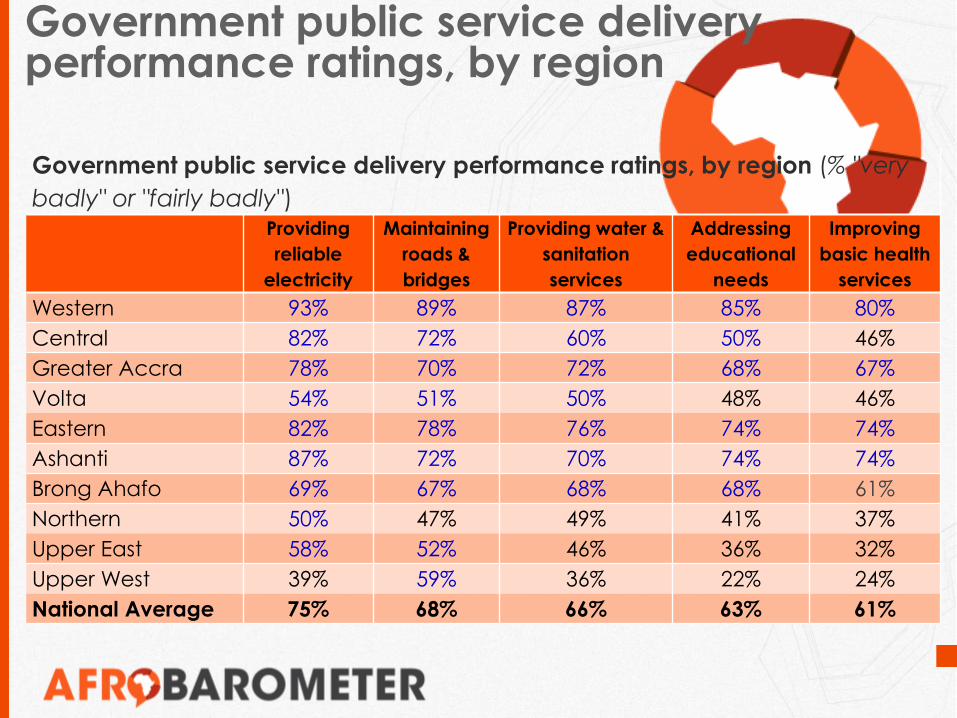
Government public service delivery performance ratings, by region
Government public service delivery performance ratings, by region (% "very
badly" or "fairly badly")
Providing
reliable
electricity
Maintaining
roads &
bridges
Providing water &
sanitation
services
Addressing
educational
needs
Improving
basic health
services
Western 93% 89% 87% 85% 80%
Central 82% 72% 60% 50% 46%
Greater Accra 78% 70% 72% 68% 67%
Volta 54% 51% 50% 48% 46%
Eastern 82% 78% 76% 74% 74%
Ashanti 87% 72% 70% 74% 74%
Brong Ahafo 69% 67% 68% 68% 61%
Northern 50% 47% 49% 41% 37%
Upper East 58% 52% 46% 36% 32%
Upper West 39% 59% 36% 22% 24%
National Average 75% 68% 66% 63% 61%
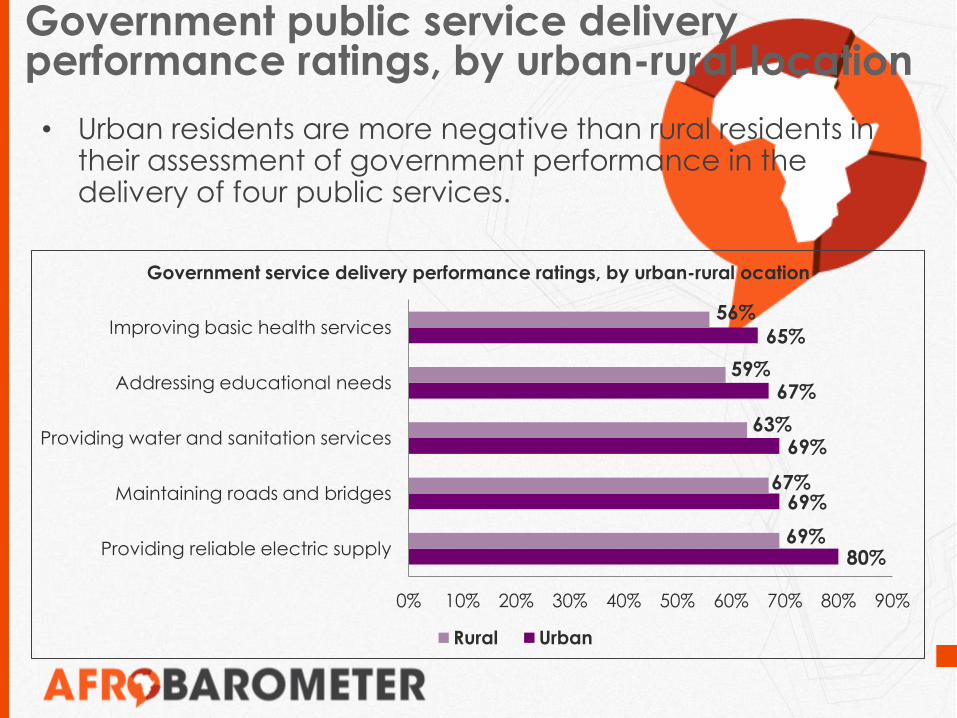
• Urban residents are more negative than rural residents in their assessment of government performance in the delivery of four public services.
Government public service delivery performance ratings, by urban-rural location
80%
69%
69%
67%
65%
69%
67%
63%
59%
56%
0% 10% 20% 30% 40% 50% 60% 70% 80% 90%
Providing reliable electric supply
Maintaining roads and bridges
Providing water and sanitation services
Addressing educational needs
Improving basic health services
Government service delivery performance ratings, by urban-rural ocation
Rural Urban

Government public service delivery performance ratings, trends over time
• In general, negative performance evaluations increased
between 2002/8 and 2014 and 2012 and 2014,
respectively. The increments were very significant.
Government service delivery performance ratings, trend over time (% "very badly" or "fairly badly")
2002 2005 2008 2012 2014 Change
[2012-2014] Change
[2002-2014]
Improving basic health
services 32% 25% 15% 36% 61% +25% +29%
Addressing educational
needs 31% 28% 16% 40% 63% +23% +32%
Providing water and
sanitation services 38% 39% 35% 51% 66% +15% +28%
Maintaining roads and
bridges -- -- 25% 48% 68% +20% +43%
(Since 2008)
Providing reliable electric
supply -- -- 17% 51% 75% +24% +58%
(Since 2008)

Government public service delivery performance ratings, trends over time
• Positive performance ratings however declined between
2002/8 and 2014 and 2012 and 2014, respectively. These
reductions were largely significant.
Government service delivery performance ratings, trend over time (% "very well" or "fairly well")
2002 2005 2008 2012 2014 Change
[2012-2014] Change
[2002-2014]
Improving basic health services 62% 74% 83% 62% 36% -26% -26%
Addressing educational needs 64% 69% 83% 60% 34% -26% -30%
Providing water and sanitation services 56% 59% 63% 48% 31% -17% -25%
Maintaining roads and bridges -- -- 72% 51% 29% -22%
-43% (Since 2008)
Providing reliable electric supply -- -- 76% 48% 23% -25%
-53% (Since 2008)

WWW.AFROBAROMETER.ORG
Priority areas for increased government investment
Top priority areas for additional government investment
• If government decides to increase its spending,
Ghanaians would want it to consider education
(47%) and health care (29%) as the two top priority
areas for additional investment.
Conclusions
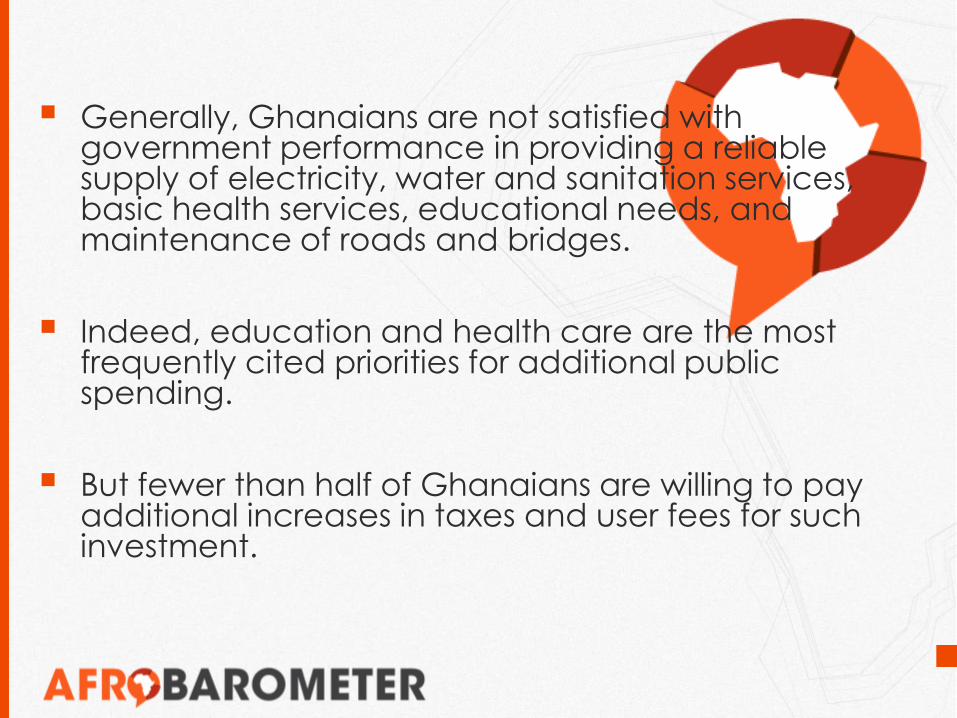
Generally, Ghanaians are not satisfied with government performance in providing a reliable supply of electricity, water and sanitation services, basic health services, educational needs, and maintenance of roads and bridges.
Indeed, education and health care are the most frequently cited priorities for additional public spending.
But fewer than half of Ghanaians are willing to pay additional increases in taxes and user fees for such investment.

WWW.AFROBAROMETER.ORG
Thank you

• Local government performance ratings
• Elected leaders’ job performance ratings
• Trust in public institutions / officials
• Perceived corruption by public institutions / officials
• Popular democratic beliefs and attitudes
• Popular beliefs and attitudes towards taxation
Forthcoming presentations


![WHO SPECIFICATIONS AND EVALUATIONS FOR PUBLIC · PDF filePage 1 of 30 WHO SPECIFICATIONS AND EVALUATIONS FOR PUBLIC HEALTH PESTICIDES PIPERONYL BUTOXIDE 5-[2-(2-butoxyethoxy)ethoxymethyl]-6-propyl-](https://img.pdfslide.us/doc/110x75/5a7a745d7f8b9a05348bc19a/who-specifications-and-evaluations-for-public-1-of-30-who-specifications-and.jpg)