Embed Size (px)
Citation preview
GHANAFERTILIZERASSESSMENT
Ghana Fertilizer Assessment
P.O. Box 2040 Muscle Shoals, Alabama 35662, U.S.A.
www.ifdc.org
In Support of:
The African Fertilizer and Agribusiness Partnership
June 2012
i
Acknowledgements
This study was commissioned and funded by the United States Agency for International
Development (USAID) under the Feed the Future initiative. This is part of a set of studies
covering 12 countries in Sub-Saharan Africa (SSA) in support of the African Fertilizer and
Agribusiness Partnership (AFAP), a collaboration among the International Fertilizer
Development Center (IFDC), Alliance for a Green Revolution in Africa (AGRA), African
Development Bank (AfDB), Agricultural Market Development Trust (AGMARK) and New
Partnership for Africa’s Development (NEPAD) and its specialized agencies, with the support of
the African Union Commission.
Joshua Ariga, IFDC scientist – economics, and Peter Heffernan, director of IFDC’s
Research and Development Division, conducted the actual data collection, analysis and report
write-up. Upendra Singh (principal scientist), with suppo rt from Paul Wilkens (scientist –
programmer) and Olivia Gist (GIS specialist), ran the crop models to generate the fertilizer
estimates, an important output of this exercise. Debbie Hellums (senior program support
specialist and program leader of the IFDC Agro-Economics Program) and Sarah Gavian (IFDC
chief economist) provided crucial support in finalizing the report.
The staff of the Ministry of Food and Agriculture, the Ghana Cocoa Board, fertilizer
dealers and the IFDC division and country offices in Accra provided useful information and data
to the research team. Victor Clottey (coordinator, Farmers’ Capacity Building component, MIR
Plus Project, IFDC) assisted the research team in setting up the necessary contacts with
interviewees. Mark Huisenga (senior program manager, USAID) provided important input in
shaping the terms of reference and the direction of the study.
The study also benefited from the comments of participants in a workshop held in
Nairobi on May 15-16, 2012; the purpose of the workshop was to brainstorm on the initial drafts
of the three country studies, improve the methodology and identify relevant partnerships as the
efforts continue with the remaining country studies. The authors are grateful for these
contributions and thank all who supported this effort.
ii
Table of Contents
Acknowledgements ..................................................................................................................... i Executive Summary .................................................................................................................. vi 1.0 Introduction ..........................................................................................................................1
1.1 Contribution of Agriculture to Gross Domestic Product .................................................1
1.2 Agricultural Investment Priorities and Targets ...............................................................3
1.2.1 Program Focus Areas ............................................................................................3
1.2.2 Crop Yield Targets ..............................................................................................5
2.0 The Conceptual Approach: A Framework for Linking Inputs to Outputs ..............................9
3.0 Capturing Agronomic Aspects: Description of the DSSAT Model ...................................... 12
3.1 Applying DSSAT to Estimate Fertilizer Requirements ................................................ 13
3.2 Data Collection Methodology ...................................................................................... 15
3.3 Description of Data ..................................................................................................... 17
3.3.1 Area Under Different Crops ............................................................................... 17
3.3.2 Production and Yield Trends for Crops .............................................................. 22
4.0 Ghana’s Fertilizer Market: Evolution and Recent Developments ........................................ 24
4.1 Overview of Fertilizer Consumption Patterns .............................................................. 24
4.1.1 Fertilizer Use in Cocoa ...................................................................................... 29
4.1.2 Cost Buildup ...................................................................................................... 30
5.0 Estimating Fertilizer Requirements: Implications for Value Chain ...................................... 31
5.1 Estimating Economically Viable Fertilizer Use on Maize Crop.................................... 32
5.2 Estimating Fertilizer Use on All Crops Using Nutrient Removal Approach ................. 34
6.0 Recommendations and Conclusions .................................................................................... 36
7.0 References .......................................................................................................................... 39
iii
List of Tables
Table 1. Share of Agriculture in GDP (%) ........................................................................... 1
Table 2. Agriculture and Other Sector Real GDP Growth Rates (%).................................... 2
Table 3. Average Yields of Selected Food Crops and Comparison With Achievable or Potential Yields ................................................................................................. 6
Table 4. Major Crops Grown in the Agro-Ecological Zones .............................................. 19
Table 5. Average National Crop Area (’000 ha) and Yields (2000-2009) ........................... 20
Table 6. Maize Area by Province (2006-2011) in ’000 ha .................................................. 21
Table 7. Maize Production and Yield by Province (2006-2011) ......................................... 23
Table 8. Percent of Households Using Seed and Fertilizer ................................................. 24
Table 9. Average and Median Distance to Nearest Fertilizer Seller (km) ........................... 25
Table 10. Fertilizer Imports: Ghana (’000 mt) ...................................................................... 28
Table 11. Estimated Fertilizer Use on Fertilized and Total Cultivated Maize Area (Based on Economically Viable Yields for Dominant Planting Season) ............... 33
Table 12. Using Nutrient Removal Factors to Estimate Fertilizer Requirements .................. 35
Table 13. Incremental Nutrient and Product Requirements for Target and Major Crops ....... 36
List of Figures
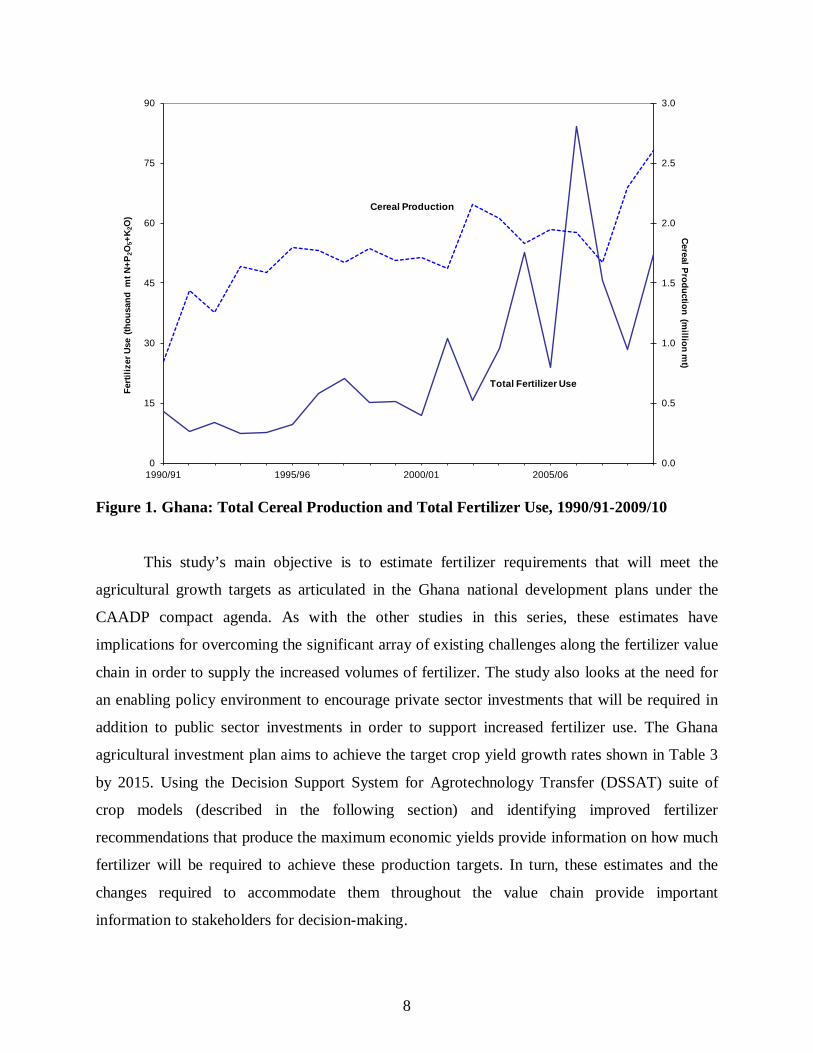
Figure 1. Ghana: Total Cereal Production and Total Fertilizer Use, 1990/91-2009/10 ........... 8
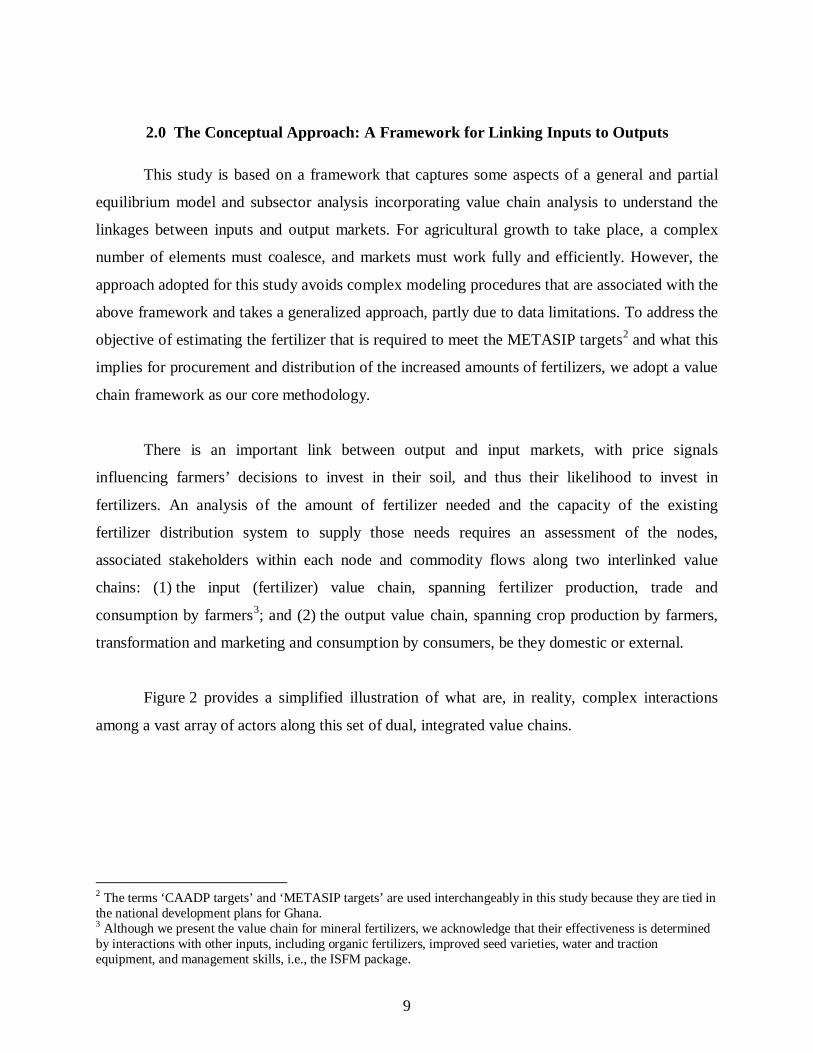
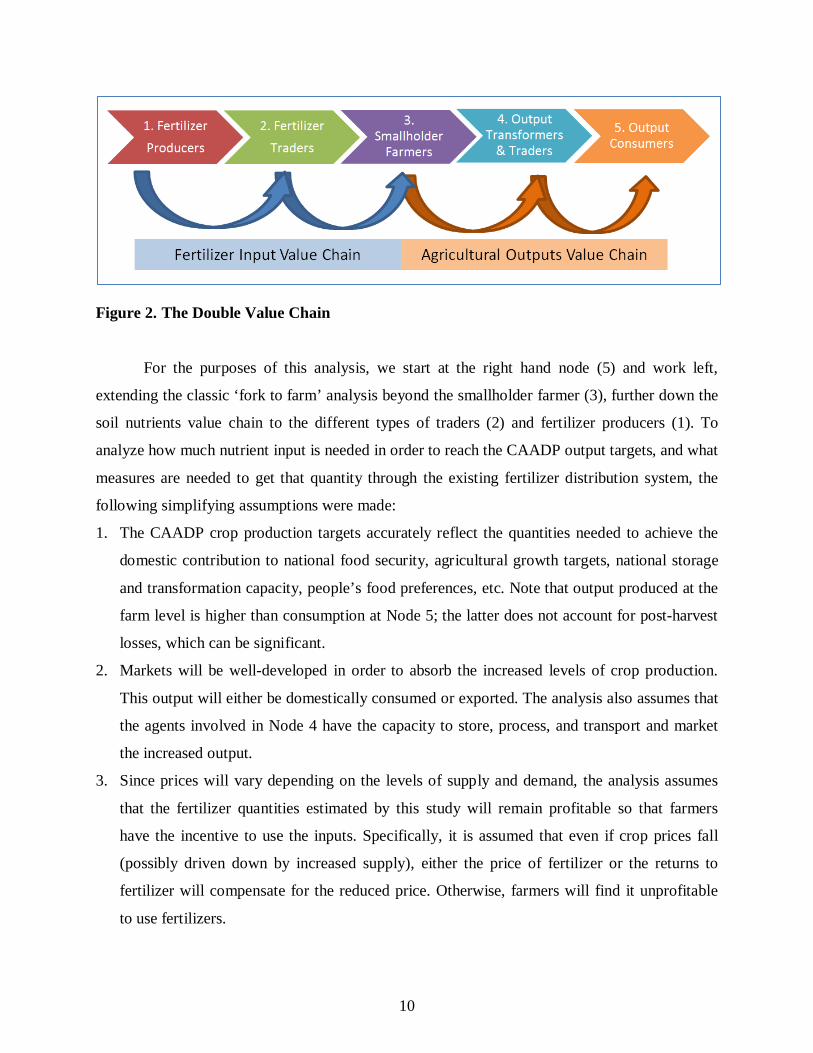
Figure 2. The Double Value Chain ..................................................................................... 10
Figure 3. Mean Potential Production (kg/ha) of Rainfed Maize in Ghana for Early Planting Date ....................................................................................................... 16
Figure 4. Map of Ghana Showing Administrative Provinces ............................................... 18
Figure 5. Area Trends for Top Five Crops (Based on Average Area for 2000-2009) ........... 21
Figure 6. Production Trends for Select Crops (million mt) .................................................. 22
Figure 7. Yields for Top Five Crops (Based on Average Area for 2000-2009) .................... 23
Figure 8. Supply Chain for Fertilizers in Ghana (2011) ....................................................... 27
Figure 9. Domestic Fertilizer Costs for Ghana .................................................................... 30
iv
Acronyms
AfDB African Development Bank AFAP African Fertilizer and Agribusiness Partnership AGMARK Agricultural Market Development Trust AGRA Alliance for a Green Revolution in Africa AS Ammonium Sulfate CAADP Comprehensive Africa Agriculture Development Program CERES Crop Environment Resource Synthesis COCOBOD Ghana Cocoa Board CRIG Cocoa Research Institute of Ghana CSM Cropping System Model DAP Diammonium Phosphate DSSAT Decision Support System for Agrotechnology Transfer ECOWAS Economic Community of West African States FAO Food and Agriculture Organization of the United Nations FASDEP II Food and Agriculture Sector Development Policy FtF Feed the Future, a U.S. government initiative GDP Gross Domestic Product GIS Geographic Information System GoG Government of Ghana ha hectare ICASA International Consortium for Agricultural Systems Applications IFDC International Fertilizer Development Center IFPRI International Food Policy Research Institute ISFM Integrated Soil Fertility Management K Potassium km kilometer km2 square kilometer LBCs Licensed Buying Companies MDG Millennium Development Goal MDS Minimum Data Set METASIP Medium Term Agriculture Sector Investment Plan MOFA Ministry of Food and Agriculture MOP Muriate of Potash mt metric ton N Nitrogen
v
NEPAD New Partnership for Africa’s Development NTB Non-Tariff Barriers P Phosphorus PFRD Pesticides and Fertilizer Regulatory Division PPPs Public-Private Partnership PPRSD Plant Protection and Regulatory Services Directorate SRID Statistics Research and Information Directorate, MOFA SSA Sub-Saharan Africa SSP Single Superphosphate TSP Triple Superphosphate USAID United States Agency for International Development
vi
Ghana Fertilizer Assessment
Executive Summary
In 2003, the African Heads of State adopted the Comprehensive African Agriculture
Development Program (CAADP) as a framework for promoting agriculture growth, food
security and rural development. As part of the CAADP process, the Ghanaian Ministry of Food
and Agriculture (MOFA) has articulated its long-term agriculture policy in the Food and
Agriculture Sector Development Policy (FASDEP II) document. The medium-term (2011-2015)
programs of FASDEP II are implemented through the accompanying Medium Term Agriculture
Sector Investment Plan (GoG, 2010). The METASIP targets a 6 percent agriculture growth rate
and the halving of poverty by 2015 through an allocation of at least 10 percent of the national
budget to agriculture. These ambitious targets are all consistent with the CAADP vision.
Achieving these targets will require a focused approach and investments from the public
and private sectors. The goal of this study is to estimate the fertilizer requirements needed to
achieve nationwide country investment plan crop production targets and to identify the primary
constraints in the fertilizer supply chain that might hinder the flow of fertilizers. The study
addresses two primary challenges: (1) estimating the additional quantity of fertilizers required to
achieve the crop production targets and (2) synthesizing investment and policy changes that will
be needed to ensure the flow of these quantities through the fertilizer supply chain to the
smallholder farmers.
In determining the additional fertilizer requirements, estimates were developed for the
METASIP priority food crops (cassava, cowpea, maize, rice and yam) and all major crops using
available agronomic models and a nutrient uptake analysis. The results indicate that Ghana will
need to increase annual fertilizer imports from an average of 0.20 million metric tons (mt) to
between 0.27 (based on nutrient uptake) and 0.37 million mt (using crop models) to achieve the
targets on the priority crops indicated in METASIP. In order to support robust production
increases to the wider set of crops, the total fertilizer requirement will be approximately
0.40 million mt, meaning that fertilizer imports will need to increase substantially over the next
few years.
vii
These estimates have important implications for the development of each node of the
fertilizer value chain. The logistics of moving this fertilizer through Ghana’s congested ports to
local warehouses, and then inland transport to local warehouses, will require major infrastructure
investments. While there are some opportunities for increased efficiencies in existing operations,
investments in transportation and storage and capacity building (e.g., agro-dealer networks,
farmer training, etc.) will be crucial.
On the demand side, for farmers to use fertilizers and other relevant inputs, they must
have access to sustainable output markets for their surplus production. Development of these
markets must receive equal attention, as these markets provide the demand that makes possible
the adoption of improved technologies at the farm level. The adoption of improved technologies
(seed, fertilizers, etc.), including organic fertilizers and appropriate management techniques, in
an integrated soil fertility management (ISFM) framework is crucial for overall agricultural
growth that takes advantage of complementarities among various inputs.
Considering the costs and other constraints associated with the current fertilizer
procurement and distribution system in Ghana, efforts to identify ways in which the public sector
can stimulate private sector investments to achieve these goals are needed. The structure of the
current fertilizer distribution system in Ghana contains some rigidity in price determination that
does not augur well for private sector investments, particularly in targeting remote areas where
traders lack the flexibility to adjust prices to cover costs incurred.
1
Ghana Fertilizer Assessment
1.0 Introduction
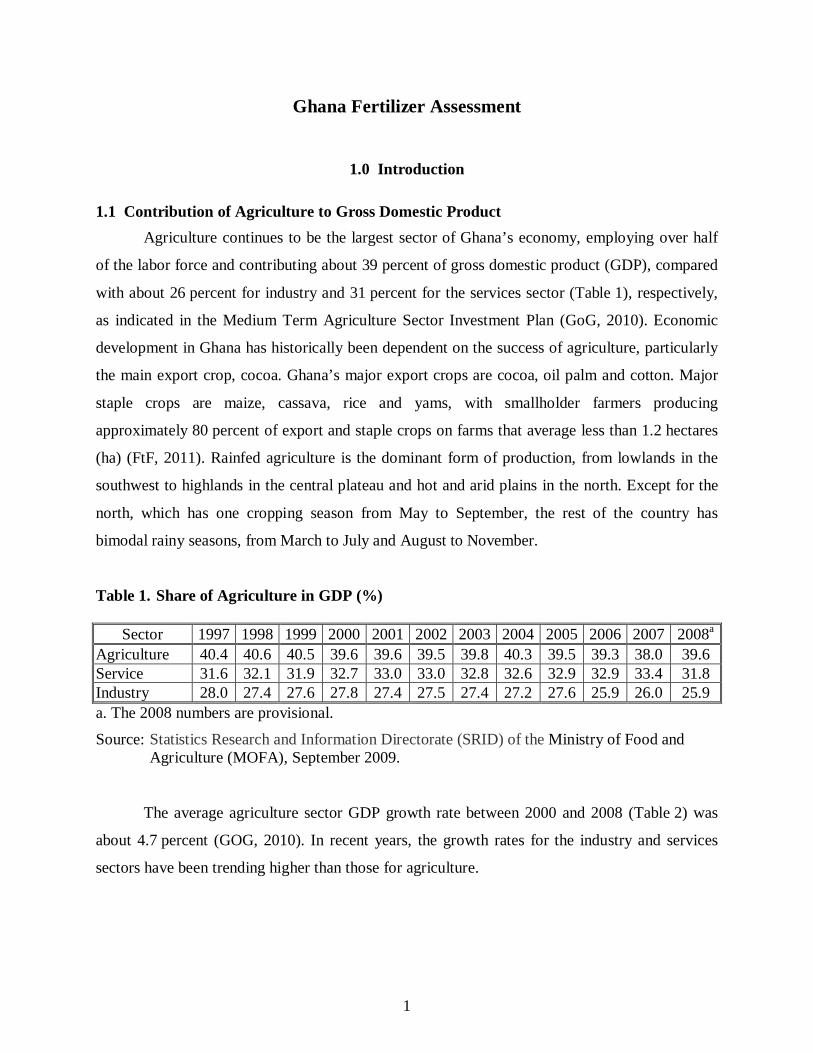
1.1 Contribution of Agriculture to Gross Domestic Product Agriculture continues to be the largest sector of Ghana’s economy, employing over half
of the labor force and contributing about 39 percent of gross domestic product (GDP), compared
with about 26 percent for industry and 31 percent for the services sector (Table 1), respectively,
as indicated in the Medium Term Agriculture Sector Investment Plan (GoG, 2010). Economic
development in Ghana has historically been dependent on the success of agriculture, particularly
the main export crop, cocoa. Ghana’s major export crops are cocoa, oil palm and cotton. Major
staple crops are maize, cassava, rice and yams, with smallholder farmers producing
approximately 80 percent of export and staple crops on farms that average less than 1.2 hectares
(ha) (FtF, 2011). Rainfed agriculture is the dominant form of production, from lowlands in the
southwest to highlands in the central plateau and hot and arid plains in the north. Except for the
north, which has one cropping season from May to September, the rest of the country has
bimodal rainy seasons, from March to July and August to November.
Table 1. Share of Agriculture in GDP (%)
Sector 1997 1998 1999 2000 2001 2002 2003 2004 2005 2006 2007 2008a Agriculture 40.4 40.6 40.5 39.6 39.6 39.5 39.8 40.3 39.5 39.3 38.0 39.6 Service 31.6 32.1 31.9 32.7 33.0 33.0 32.8 32.6 32.9 32.9 33.4 31.8 Industry 28.0 27.4 27.6 27.8 27.4 27.5 27.4 27.2 27.6 25.9 26.0 25.9 a. The 2008 numbers are provisional.
Source: Statistics Research and Information Directorate (SRID) of the Ministry of Food and Agriculture (MOFA), September 2009.
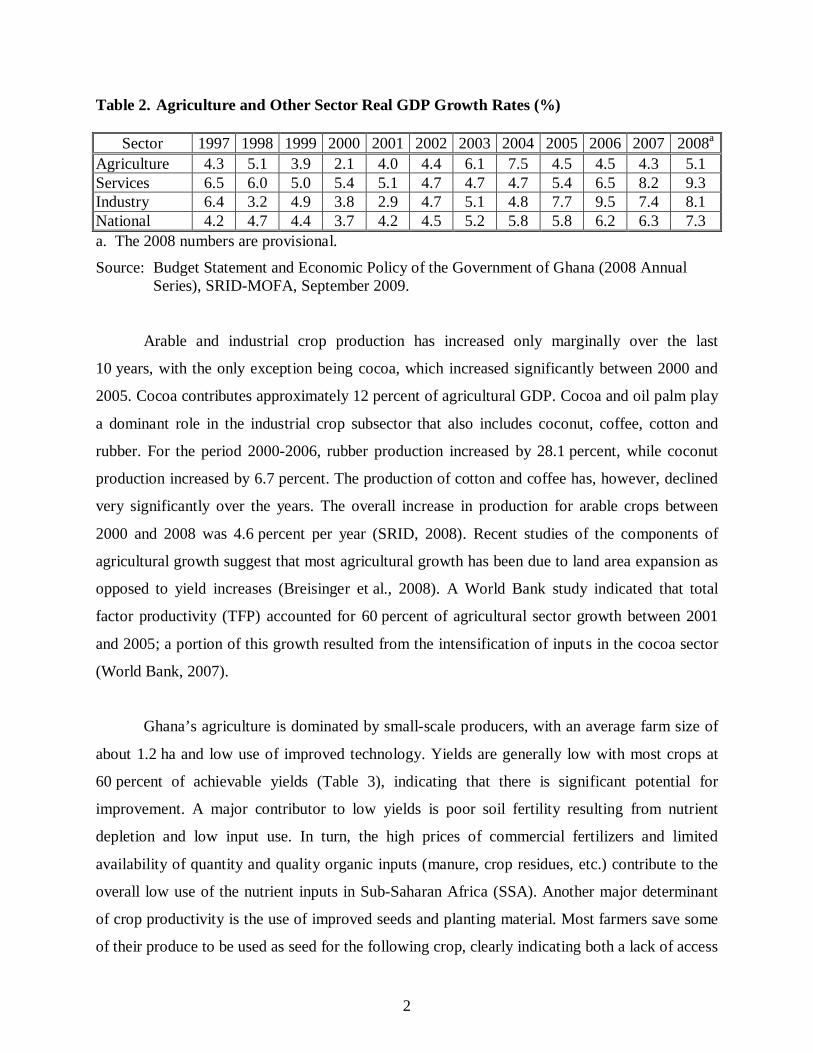
The average agriculture sector GDP growth rate between 2000 and 2008 (Table 2) was
about 4.7 percent (GOG, 2010). In recent years, the growth rates for the industry and services
sectors have been trending higher than those for agriculture.
2
Table 2. Agriculture and Other Sector Real GDP Growth Rates (%)
Sector 1997 1998 1999 2000 2001 2002 2003 2004 2005 2006 2007 2008a Agriculture 4.3 5.1 3.9 2.1 4.0 4.4 6.1 7.5 4.5 4.5 4.3 5.1 Services 6.5 6.0 5.0 5.4 5.1 4.7 4.7 4.7 5.4 6.5 8.2 9.3 Industry 6.4 3.2 4.9 3.8 2.9 4.7 5.1 4.8 7.7 9.5 7.4 8.1 National 4.2 4.7 4.4 3.7 4.2 4.5 5.2 5.8 5.8 6.2 6.3 7.3 a. The 2008 numbers are provisional.
Source: Budget Statement and Economic Policy of the Government of Ghana (2008 Annual Series), SRID-MOFA, September 2009.
Arable and industrial crop production has increased only marginally over the last
10 years, with the only exception being cocoa, which increased significantly between 2000 and
2005. Cocoa contributes approximately 12 percent of agricultural GDP. Cocoa and oil palm play
a dominant role in the industrial crop subsector that also includes coconut, coffee, cotton and
rubber. For the period 2000-2006, rubber production increased by 28.1 percent, while coconut
production increased by 6.7 percent. The production of cotton and coffee has, however, declined
very significantly over the years. The overall increase in production for arable crops between
2000 and 2008 was 4.6 percent per year (SRID, 2008). Recent studies of the components of
agricultural growth suggest that most agricultural growth has been due to land area expansion as
opposed to yield increases (Breisinger et al., 2008). A World Bank study indicated that total
factor productivity (TFP) accounted for 60 percent of agricultural sector growth between 2001
and 2005; a portion of this growth resulted from the intensification of inputs in the cocoa sector
(World Bank, 2007).
Ghana’s agriculture is dominated by small-scale producers, with an average farm size of
about 1.2 ha and low use of improved technology. Yields are generally low with most crops at
60 percent of achievable yields (Table 3), indicating that there is significant potential for
improvement. A major contributor to low yields is poor soil fertility resulting from nutrient
depletion and low input use. In turn, the high prices of commercial fertilizers and limited
availability of quantity and quality organic inputs (manure, crop residues, etc.) contribute to the
overall low use of the nutrient inputs in Sub-Saharan Africa (SSA). Another major determinant
of crop productivity is the use of improved seeds and planting material. Most farmers save some
of their produce to be used as seed for the following crop, clearly indicating both a lack of access
3
to improved seed and a lack of understanding of the benefits of the increased production
associated with improved seed technology.
Despite agriculture’s importance to the overall economy, fertilizer use in Ghana is about
7.2 kilograms per hectare (kg/ha), similar to the average rate in SSA, but significantly lower than
in other developing countries. However, fertilizer use is generally profitable (FAO, 2005), with
value-cost ratios of fertilizer use ranging from 2.7 for maize to 10 for irrigated rice (FAO, 2005).
1.2 Agricultural Investment Priorities and Targets The above conditions in the agricultural economy need an aggressive set of interventions
to improve farmers’ welfare. Significant improvements in the productivity of the agriculture
sector are required to raise the average real incomes and achieve the Millennium Development
Goal (MDG) of reducing hunger and poverty. In the national development agenda, agriculture is
expected to lead the growth and structural transformation of the economy and maximize the
benefits of accelerated growth. Strategies in the METASIP Plan to improve agricultural
performance focus on investments to address the above constraints in order to improve
agricultural productivity and market access.
The Ministry of Food and Agriculture (MOFA) articulated its long-term agriculture
policy in the Food and Agriculture Sector Development Policy (FASDEP II). The METASIP is
the investment plan to implement the medium-term (2011-2015) programs of FASDEP II. It has
been developed to achieve a target agricultural GDP growth of at least 6 percent annually,
halving poverty by 2015 in agreement with MDG 1, based on government expenditure allocation
of at least 10 percent of the national budget to agriculture within this period. The METASIP is
consistent with New Partnership for Africa’s Development’s (NEPAD’s) Comprehensive Africa
Agriculture Development Program (CAADP), which provides an integrated framework to
support agricultural growth, rural development and food security in the African region.
1.2.1 Program Focus Areas The METASIP focuses on a number of key investment areas or programs: food security
and emergency preparedness, increased growth in incomes, increased competitiveness and
enhanced integration into domestic and international markets, sustainable management of land
4
and environment, science and technology for food and agricultural development and institutional
coordination. The cost of these investments within the period 2011-2015 is estimated at GHc 1.5
billion, sourced from government revenues and private financial support through partnerships.
These program areas are elaborated below.
Apart from low fertilizer use, the agricultural sector faces a number of additional
challenges: reliance on rainfed agriculture and low-level, relatively inefficient irrigated
agriculture; the low level of mechanization in production and processing; high post-harvest
losses resulting from poor post-harvest management; low-level and ineffective agricultural
finance; poor extension services as a result of several institutional and structural inefficiencies;
and lack of ready markets and processing facilities. To overcome these bottlenecks, the
agricultural policy in Ghana has the objective of increasing: food security; incomes; the
competitiveness of and enhanced integration into domestic and international markets; sustainable
management of land and the environment; science and technology transfer; and improved
institutional coordination. The policy initiatives to achieve these goals are described in the
following paragraphs.
An increase in food security requires increased productivity measures that will raise
yields for most crops towards their achievable levels, mostly by using appropriate inputs. The
productivity increases also can be achieved through the diversification of crops, irrigation,
mechanization and the reduction of post-harvest losses through improved storage facilities.
Investment in rural infrastructure is another objective of METASIP, intended to create an
environment for improving incomes in rural areas by creating opportunities for investments.
The other approach is to expand domestic and regional market opportunities so that
farmers have access to these outlets. This will be accomplished by encouraging the export of
crops and harmonizing grades and standards so that international trade is unhindered by
differences in regulations and rules governing input and output trade. This also captures the
challenges of capitalization for businesses and farmers resulting from poor access to finance.
5
The policy thrust emphasizes technology transfer that embodies the integrated soil
fertility management (ISFM) approach; using ISFM, farmers do not access a single improved
technology alone, but a package that is holistic in addressing the productivity problems faced in
rural agricultural areas. The low adoption of technology (e.g., exploring biotechnology)
throughout the value chain and the need to encourage coordination among institutions to promote
the technology packages are emphasized.
Another area of policy concern is investment in storage facilities for price stabilization
and the reduction of post-harvest losses at farm and post-farm levels (estimated at over
30 percent of output). This is a major loss in terms of profits and a potential and significant cause
of food insecurity. Factors associated with losses include: limited knowledge of post-harvest
handling; poor harvesting methods; poor storage systems; poor access to information on pest
control methods; and poor transportation methods and equipment. A major focus to reduce post-
harvest losses will include capacity building of producers in better harvesting, transportation and
storage methods, the introduction of grading methods and linkages between producers and
markets. Including this training for capacity building in the existing extension service will be
important. Value addition increases the economic value and shelf life of food commodities.
Various interventions for value addition will be pursued, including warehousing, agro-
processing, packaging and distribution. Investment in warehousing will be promoted to improve
the quality of staples along the chain and to increase trade in legumes and cereals. Warehousing
is also expected to contribute to commodity price stabilization (GOG, 2010).
1.2.2 Crop Yield Targets Priority staple crops under FASDEP II include cassava, cowpea, maize, rice and yam.
Wide gaps have been identified between ‘best practice’ (achievable) yields and actual yields for
a range of crops (Table 3).
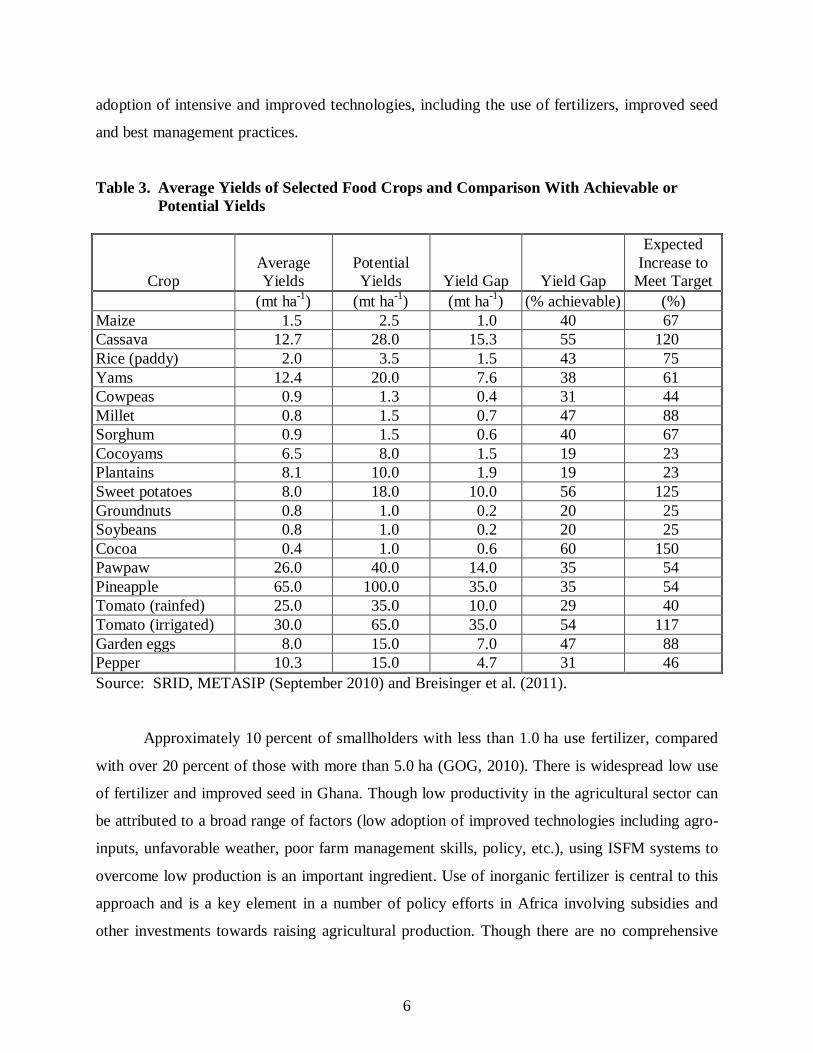
The current yields are significantly lower than their potential yields (Table 3) for most of
the crops. The national country investment plan targets are to increase these yields by more than
50 percent for most of the cereals, including maize, in order to bridge the gap. For cassava, cocoa
and sweet potato, the targets are much higher at over 100 percent increase in yields. These
targets highlight that the opportunity exists to increase the production of these crops through the
6
adoption of intensive and improved technologies, including the use of fertilizers, improved seed
and best management practices.
Table 3. Average Yields of Selected Food Crops and Comparison With Achievable or Potential Yields
Crop Average Yields
Potential Yields Yield Gap Yield Gap
Expected Increase to
Meet Target (mt ha-1) (mt ha-1) (mt ha-1) (% achievable) (%) Maize 1.5 2.5 1.0 40 67 Cassava 12.7 28.0 15.3 55 120 Rice (paddy) 2.0 3.5 1.5 43 75 Yams 12.4 20.0 7.6 38 61 Cowpeas 0.9 1.3 0.4 31 44 Millet 0.8 1.5 0.7 47 88 Sorghum 0.9 1.5 0.6 40 67 Cocoyams 6.5 8.0 1.5 19 23 Plantains 8.1 10.0 1.9 19 23 Sweet potatoes 8.0 18.0 10.0 56 125 Groundnuts 0.8 1.0 0.2 20 25 Soybeans 0.8 1.0 0.2 20 25 Cocoa 0.4 1.0 0.6 60 150 Pawpaw 26.0 40.0 14.0 35 54 Pineapple 65.0 100.0 35.0 35 54 Tomato (rainfed) 25.0 35.0 10.0 29 40 Tomato (irrigated) 30.0 65.0 35.0 54 117 Garden eggs 8.0 15.0 7.0 47 88 Pepper 10.3 15.0 4.7 31 46 Source: SRID, METASIP (September 2010) and Breisinger et al. (2011).
Approximately 10 percent of smallholders with less than 1.0 ha use fertilizer, compared
with over 20 percent of those with more than 5.0 ha (GOG, 2010). There is widespread low use
of fertilizer and improved seed in Ghana. Though low productivity in the agricultural sector can
be attributed to a broad range of factors (low adoption of improved technologies including agro-
inputs, unfavorable weather, poor farm management skills, policy, etc.), using ISFM systems to
overcome low production is an important ingredient. Use of inorganic fertilizer is central to this
approach and is a key element in a number of policy efforts in Africa involving subsidies and
other investments towards raising agricultural production. Though there are no comprehensive
7
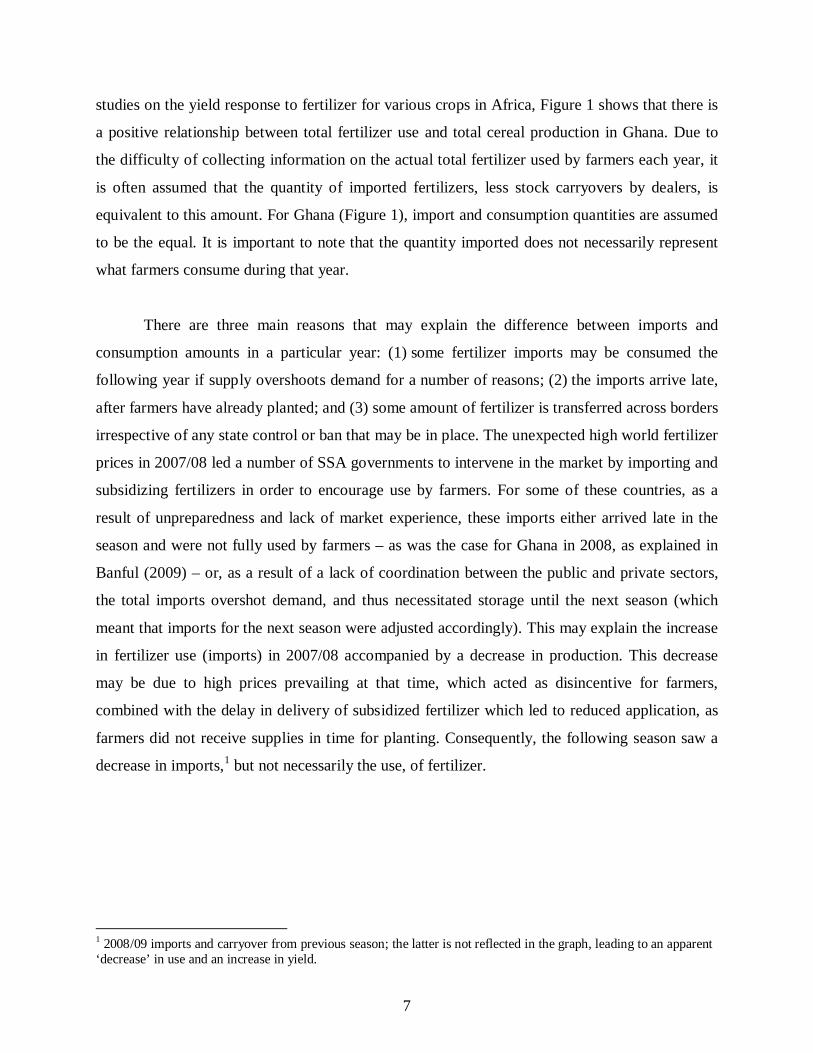
studies on the yield response to fertilizer for various crops in Africa, Figure 1 shows that there is
a positive relationship between total fertilizer use and total cereal production in Ghana. Due to
the difficulty of collecting information on the actual total fertilizer used by farmers each year, it
is often assumed that the quantity of imported fertilizers, less stock carryovers by dealers, is
equivalent to this amount. For Ghana (Figure 1), import and consumption quantities are assumed
to be the equal. It is important to note that the quantity imported does not necessarily represent
what farmers consume during that year.
There are three main reasons that may explain the difference between imports and
consumption amounts in a particular year: (1) some fertilizer imports may be consumed the
following year if supply overshoots demand for a number of reasons; (2) the imports arrive late,
after farmers have already planted; and (3) some amount of fertilizer is transferred across borders
irrespective of any state control or ban that may be in place. The unexpected high world fertilizer
prices in 2007/08 led a number of SSA governments to intervene in the market by importing and
subsidizing fertilizers in order to encourage use by farmers. For some of these countries, as a
result of unpreparedness and lack of market experience, these imports either arrived late in the
season and were not fully used by farmers – as was the case for Ghana in 2008, as explained in
Banful (2009) – or, as a result of a lack of coordination between the public and private sectors,
the total imports overshot demand, and thus necessitated storage until the next season (which
meant that imports for the next season were adjusted accordingly). This may explain the increase
in fertilizer use (imports) in 2007/08 accompanied by a decrease in production. This decrease
may be due to high prices prevailing at that time, which acted as disincentive for farmers,
combined with the delay in delivery of subsidized fertilizer which led to reduced application, as
farmers did not receive supplies in time for planting. Consequently, the following season saw a
decrease in imports,1
but not necessarily the use, of fertilizer.
1 2008/09 imports and carryover from previous season; the latter is not reflected in the graph, leading to an apparent ‘decrease’ in use and an increase in yield.
8
Figure 1. Ghana: Total Cereal Production and Total Fertilizer Use, 1990/91-2009/10 This study’s main objective is to estimate fertilizer requirements that will meet the
agricultural growth targets as articulated in the Ghana national development plans under the
CAADP compact agenda. As with the other studies in this series, these estimates have
implications for overcoming the significant array of existing challenges along the fertilizer value
chain in order to supply the increased volumes of fertilizer. The study also looks at the need for
an enabling policy environment to encourage private sector investments that will be required in
addition to public sector investments in order to support increased fertilizer use. The Ghana
agricultural investment plan aims to achieve the target crop yield growth rates shown in Table 3
by 2015. Using the Decision Support System for Agrotechnology Transfer (DSSAT) suite of
crop models (described in the following section) and identifying improved fertilizer
recommendations that produce the maximum economic yields provide information on how much
fertilizer will be required to achieve these production targets. In turn, these estimates and the
changes required to accommodate them throughout the value chain provide important
information to stakeholders for decision-making.
0.0
0.5
1.0
1.5
2.0
2.5
3.0
0
15
30
45
60
75
90
1990/91 1995/96 2000/01 2005/06
Cereal Production (million m
t)Fe
rtiliz
er U
se (t
hous
and
mt N
+P2O
5+K 2
O)
Cereal Production
Total Fertilizer Use
9
2.0 The Conceptual Approach: A Framework for Linking Inputs to Outputs
This study is based on a framework that captures some aspects of a general and partial
equilibrium model and subsector analysis incorporating value chain analysis to understand the
linkages between inputs and output markets. For agricultural growth to take place, a complex
number of elements must coalesce, and markets must work fully and efficiently. However, the
approach adopted for this study avoids complex modeling procedures that are associated with the
above framework and takes a generalized approach, partly due to data limitations. To address the
objective of estimating the fertilizer that is required to meet the METASIP targets2
and what this
implies for procurement and distribution of the increased amounts of fertilizers, we adopt a value
chain framework as our core methodology.
There is an important link between output and input markets, with price signals
influencing farmers’ decisions to invest in their soil, and thus their likelihood to invest in
fertilizers. An analysis of the amount of fertilizer needed and the capacity of the existing
fertilizer distribution system to supply those needs requires an assessment of the nodes,
associated stakeholders within each node and commodity flows along two interlinked value
chains: (1) the input (fertilizer) value chain, spanning fertilizer production, trade and
consumption by farmers3
; and (2) the output value chain, spanning crop production by farmers,
transformation and marketing and consumption by consumers, be they domestic or external.
Figure 2 provides a simplified illustration of what are, in reality, complex interactions
among a vast array of actors along this set of dual, integrated value chains.
2 The terms ‘CAADP targets’ and ‘METASIP targets’ are used interchangeably in this study because they are tied in the national development plans for Ghana. 3 Although we present the value chain for mineral fertilizers, we acknowledge that their effectiveness is determined by interactions with other inputs, including organic fertilizers, improved seed varieties, water and traction equipment, and management skills, i.e., the ISFM package.
10
Figure 2. The Double Value Chain
For the purposes of this analysis, we start at the right hand node (5) and work left,
extending the classic ‘fork to farm’ analysis beyond the smallholder farmer (3), further down the
soil nutrients value chain to the different types of traders (2) and fertilizer producers (1). To
analyze how much nutrient input is needed in order to reach the CAADP output targets, and what
measures are needed to get that quantity through the existing fertilizer distribution system, the
following simplifying assumptions were made:
1. The CAADP crop production targets accurately reflect the quantities needed to achieve the
domestic contribution to national food security, agricultural growth targets, national storage
and transformation capacity, people’s food preferences, etc. Note that output produced at the
farm level is higher than consumption at Node 5; the latter does not account for post-harvest
losses, which can be significant.
2. Markets will be well-developed in order to absorb the increased levels of crop production.
This output will either be domestically consumed or exported. The analysis also assumes that
the agents involved in Node 4 have the capacity to store, process, and transport and market
the increased output.
3. Since prices will vary depending on the levels of supply and demand, the analysis assumes
that the fertilizer quantities estimated by this study will remain profitable so that farmers
have the incentive to use the inputs. Specifically, it is assumed that even if crop prices fall
(possibly driven down by increased supply), either the price of fertilizer or the returns to
fertilizer will compensate for the reduced price. Otherwise, farmers will find it unprofitable
to use fertilizers.
11
4. Given that Ghana does not currently have the capacity to produce significant quantities of
mineral fertilizers, the analysis assumes that all fertilizers (or their components) are imported
(Node 2) and that Ghana is a price taker and thus does not influence international prices.
These assumptions allow for simplification of the analysis of the outputs value chain and
an increased focus on the input value chain to address the following question: What quantities of
fertilizer are required to produce (Node 3) economically viable crop outputs targeted in the
national CAADP strategy (Node 5)?
Ideally, this estimate is generated for each crop using a crop simulation model that brings
together the best available information on agronomic and climate conditions with information on
crop areas, production and yields to provide estimates of the levels of nitrogen (N), phosphorus
(P) and potassium (K) needed to achieve the economically viable target for each crop in the
CAADP strategy. The results of the analysis are aggregated to the zonal and national level.
Details on the specifics of this study in terms of the agronomic model, the data and the analysis
are presented in Section 3.
Next, the study assesses the capacity of the current fertilizer system (Node 2) to procure,
import, store, transport and distribute that quantity to farmers (Node 3) in time for the growing
season. We ask the question: What investments and policy changes will be necessary to ensure
the smooth flow of increased quantities of fertilizer through the chain to smallholders?
We model the fertilizer distribution system depicted by zeroing in on the numerous sub-
nodes and players involved in what is globally summarized as ‘fertilizer traders’ in Node 2 of
Figure 2. The key steps and players include:
1. Importation – Importers, bankers, shipping companies, port service providers (labor and
equipment), revenue authorities, quality inspectors, transporters and blending and bagging
agents.
2. Wholesale Distribution – Importers or independent wholesalers, bankers, quality inspectors
and transporters.
12
3. Retail Distribution – Agro-dealers/stockists and financial service providers.
4. Consumers – Cereal and cash crop farmers, both large and small.
We look at possible actions by value chain participants in light of increased fertilizer use
and the role of the support structure in the value or supply chain, including the effects of policy
on value chain players. For each node, we examine the physical, human, institutional and
financial capacity of these players and identify investments and policy changes needed to ensure
that the right quantities of the nutrients flow on time through the supply chain to the variety of
different end users. Additional details on the supply chain framework, the data and the analysis
are presented in sections that follow.
In summary, the study assumes some relationship between crop production and fertilizer
use, generating an equivalent quantity of fertilizer to satisfy the level agricultural production, and
then uses value chain analysis to identify what needs to change to accommodate the increase in
fertilizer consumption throughout the chain. The study uses simple tabular, graphic and
descriptive analysis to capture the results.
3.0 Capturing Agronomic Aspects: Description of the DSSAT Model
DSSAT plays an important role in generating the fertilizer estimates needed to meet the
CAADP crop targets. DSSAT4 evaluates the impact of technology adoption and environmental
shocks on a range of crop production outcomes. The model combines crop, soil and weather
databases with over 28 crop5
simulation models to simulate multi-year outcomes of various crop
management strategies on crop growth, development and yields. It allows users to appraise new
crops, products and practices for adoption.
4 DSSAT was developed through collaboration among scientists at the University of Florida, University of Georgia, University of Guelph, University of Hawaii, IFDC, USDA-Agricultural Research Service, Universidad Politecnica de Madrid, Washington State University and other scientists associated with ICASA (Hoogenboom et al, 2010; Jones et al, 2003). 5 These crop models have evolved from previous CROPGRO and Crop Environment Resource Synthesis (CERES) models.
13
DSSAT has been applied for more than 20 years by researchers, educators, consultants,
extension agents, growers and policy- and decision-makers in over 100 countries worldwide.
Using this tool, these users ask ‘what if’ questions by conducting simulation experiments on a
computer rather than in the field. The Cropping System Model (CSM) incorporates components
from different disciplines that can be modified depending on the particular needs and context.
DSSAT is structured to compare the simulated outputs from the crop model with real-world
observations, thus allowing validation and improved calibration.
The Minimum Data Set (MDS) for DSSAT includes weather (site-specific daily solar
radiation; minimum and maximum temperature and rainfall), soil (depth; percent sand, silt and
clay; carbon; pH; bulk density) and crop management data (planting date; density and depth; row
spacing; crop variety).
3.1 Applying DSSAT to Estimate Fertilizer Requirements To estimate fertilizer recommendations for this study, we used the DSSAT model to
generate the N, P and K requirements to increase the yields of the priority CAADP crops from
their current levels to their economically viable levels, where the latter is defined as a production
level that is profitable to farmers.6
The MDS requirements are quite extensive, and a consistent set of reasonably up-to-date
figures is seldom available in the African context. Furthermore, to the extent that such data are
available, it takes considerable time and expertise to attribute them to these mapping units, which
do not align with more traditional agro-ecological or administrative zones.
For this analysis, we used the following data and information:
1. Single improved seed variety used for all locations.
2. A 30-minute by 30-minute mapping unit (polygons) with a unique climate and combination
of soils. This grid is equivalent to 55 square kilometers (km2) on the ground, which translates
to 302,500 ha. For SSA, this has been derived from the World Harmonized Soil Database to 6 It is technically feasible to integrate the CAADP yields targets into the DSSAT model, but it would take considerable effort to recalibrate the model. The current formulation somewhat overshoots the METASIP target but maintains basic conditions of economic viability. We use a qualitatively determined correction coefficient to adjust downward the DSSAT fertilizer estimates to better align with the METASIP targets.
14
generate the proportion of a given soil within a mapping unit. Available digitized soil
databases were utilized for this estimation. For the rainfed yield potential simulation
(Figure 3), the HarvestChoice project soils data were used. Each of the mapping units
(polygons) contains from one to 15 soil profiles.
3. Unique combinations of soils and weather are used as input that links crop simulation models
to a geographic information system (GIS). Weather data are derived from many sources, but
for the work presented in Figure 3, MarkSim was used. This is a tool created to generate
simulated weather data for crop modeling and risk assessment. Climate files generated
spatially for each mapping unit are then used by the crop simulation models in the DSSAT to
generate daily weather data as inputs to the model.
4. Predicting grain yields under varying management conditions ranging from rainfed potential
yields to yields constrained by N, P and K status. The rainfed potential yield is dependent on
variety, rainfall, sunshine, temperature and soil physical attributes. Soil fertility, soil toxicity
(pH, aluminum status, etc.), pest and disease control and other management conditions are
assumed to be at ideal conditions for non-stressed crop growth.
5. Comparing simulated yields obtained under a wide range of management conditions with
observed yield. The reliability of fertilizer recommendations will be dependent on thorough
validation of the model’s prediction with observations from research stations, district level
yields and unique input data (soils and weather) from the districts (locations).
6. Collating economics data for inputs and produce (grains and stover).
7. Using the validated/calibrated models, long-term weather data and economics data to
determine maximum net returns and efficient (optimum) N, P and K fertilizer
recommendations.
8. The N, P and K recommendations can also be determined based on target yields – that may
be lower than optimum as described above (7).
To generate recommendations for a given country, the experimental files are generated
for each polygon (mapping unit), where a base experiment (e.g., N:P:K response) is used as a
template for testing every combination of soil profile and climate file. All biophysical output can
be mapped, along with the most economically efficient treatment (created by a net return
analysis coupled with Mean-Gini analysis), driven by a localized cost-price file. The efficient
15
treatments (recommendations) for each polygon are based on the dominant soil in terms of total
production. All other biophysical variables, such as optimal planting date, grain yield, nutrient
uptake, etc., can be given as a weighted mean of the soils present in the polygon. Apparent
discrepancies may appear in some mapping units between recommendations (based on dominant
soil) and yields (based on weighted mean), if the dominant soil represents a small area
(<30 percent). A ground-truth procedure is thus critical to ensure that constraints in the
smallholder farms and model assumptions are valid.
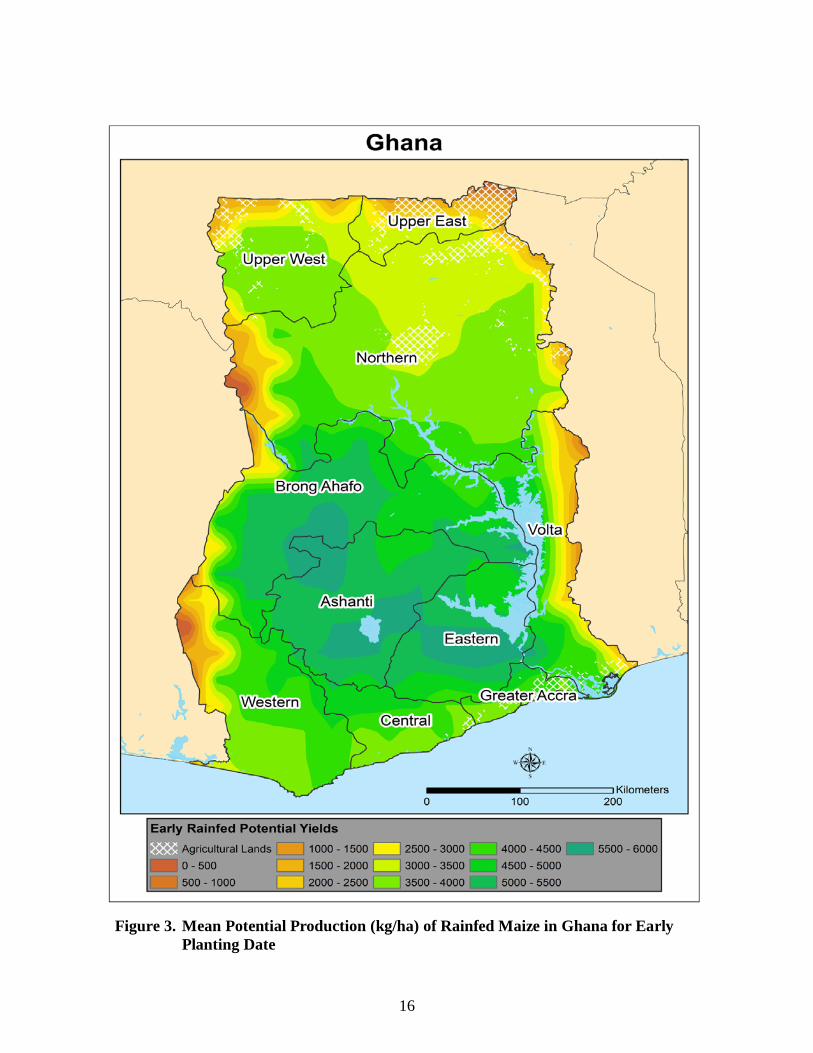
Figure 3 portrays the results from rainfed yield potential driven by climatic factors, soil
water-holding properties, planting date and variety for maize planted early March. All other soil
fertility status and management conditions were assumed to be non-limiting, and the potential
yields range to be from 0-500 to 5,000-5,500 kg/ha. This already indicates areas that are not
suitable for maize production; areas with low yield potential should have lower fertilizer
recommendation rates than higher yield-potential regions.
3.2 Data Collection Methodology Two methods were applied to obtain data and information for this study: (1) secondary
data and (2) empirical data collection through interview with key players in government and the
private sector (Ministry of Agriculture, fertilizer dealers and CAADP focal points). This study
acquired the majority of its data from existing or secondary literature or reports on fertilizer
issues covering the following areas:
• National CIP targets from country development plans and CAADP documents.
• Agricultural production data: crops, area cultivated and production.
• Fertilizer: imports, consumption, application rates per hectare and percentage of farmers
applying by crop and region.
• Agro-ecological zone data: weather and soils.
There was a significant amount of data that was not available from literature sources and
therefore required the study team to travel to Ghana to meet with key stakeholder representatives
to collect necessary information and to get opinions from industry players and MOFA officials,
importers and cocoa board staff.
16
Figure 3. Mean Potential Production (kg/ha) of Rainfed Maize in Ghana for Early
Planting Date
17
The analysis encountered a general dearth of data and information in Ghana compared
with Tanzania and Kenya. It is important to note that most of the fertilizer-related data was not
accessible in reports or from the ministry for two reasons:
1. Some of this information has not been collected or organized in one place; often, pieces
available from different sources are not reliable, since they do not indicate the source of the
data or reports from which they originated. For example, information on the percentage of
farmers using fertilizer by crop, region and application rates per hectare, were not available.
2. Some data sets covering the same topic, but in different reports/publications, do not reconcile
and often were very different.
It is crucial that MOFA and other private/public institutions embark on a serious data
collection and organization strategy to aid the development agenda in Ghana. The development
of CIPs and other national policy documents rely heavily on a well-organized system of
databases and information, making investments in this area important.
3.3 Description of Data Under this subsection, the data collected, crop areas, production and yields across
different agro-ecological zones is described. This is the information that will be used in the
analysis section that follows.
3.3.1 Area Under Different Crops In Ghana, the main industrial crops consist of cocoa, coconut, coffee, cotton, oil palm, and
rubber, while staple food crops include cassava, cocoyam, maize, plantain, rice, sorghum and yam.
Fruits and vegetables include banana, cashew, citrus, mangoes, onions, pepper, pineapple and
tomatoes. Maize and cassava are the two most dominant food crops produced by most rural
households (Table 4). Cassava cultivation has increased more rapidly compared with yam due to
three main reasons: yam production is highly labor-intensive; increased availability of improved
disease-resistant cassava varieties has boosted yields; and the development of simplified and more
efficient cassava-processing equipment has increased crop demand (e.g., Nigeria).
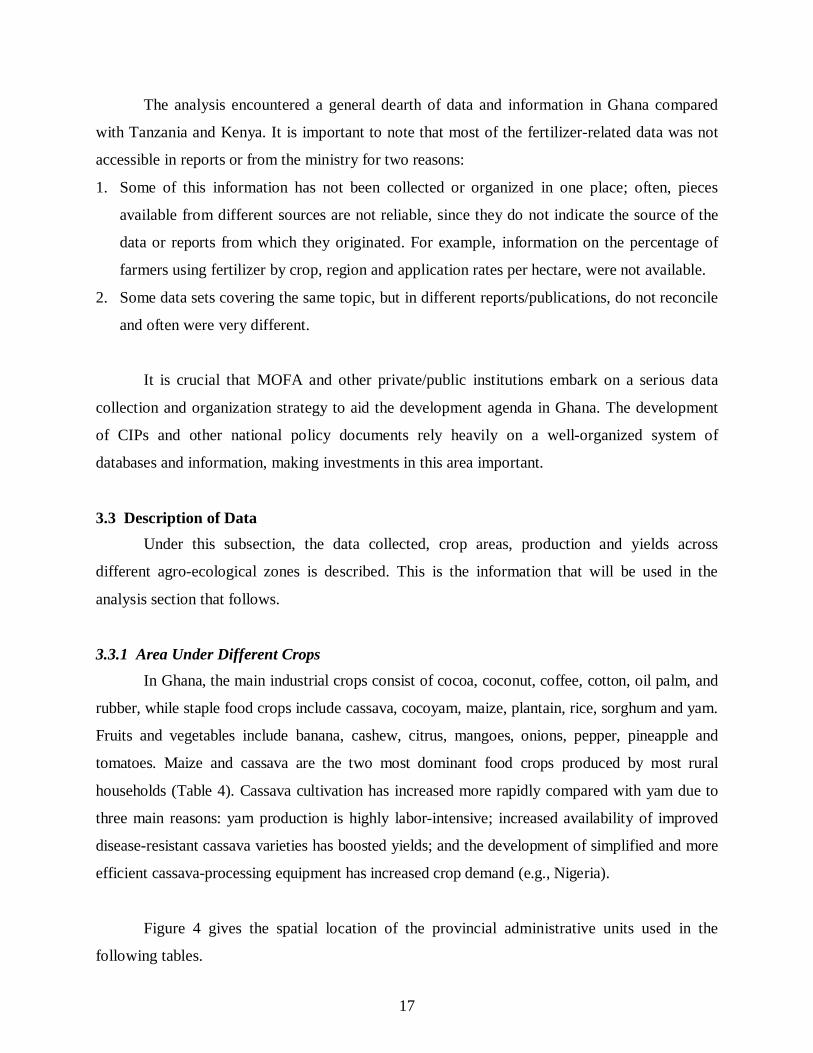
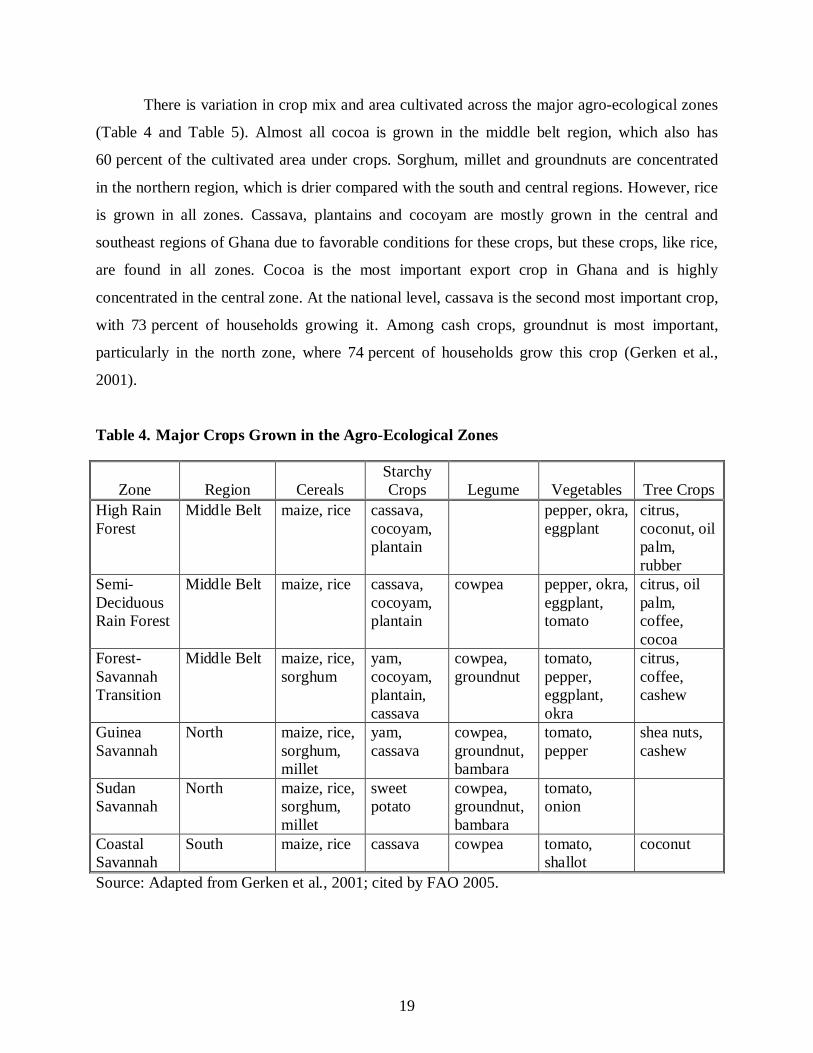
Figure 4 gives the spatial location of the provincial administrative units used in the
following tables.
18
Figure 4. Map of Ghana Showing Administrative Provinces
19
There is variation in crop mix and area cultivated across the major agro-ecological zones
(Table 4 and Table 5). Almost all cocoa is grown in the middle belt region, which also has
60 percent of the cultivated area under crops. Sorghum, millet and groundnuts are concentrated
in the northern region, which is drier compared with the south and central regions. However, rice
is grown in all zones. Cassava, plantains and cocoyam are mostly grown in the central and
southeast regions of Ghana due to favorable conditions for these crops, but these crops, like rice,
are found in all zones. Cocoa is the most important export crop in Ghana and is highly
concentrated in the central zone. At the national level, cassava is the second most important crop,
with 73 percent of households growing it. Among cash crops, groundnut is most important,
particularly in the north zone, where 74 percent of households grow this crop (Gerken et al.,
2001).
Table 4. Major Crops Grown in the Agro-Ecological Zones
Zone Region Cereals Starchy Crops Legume Vegetables Tree Crops
High Rain Forest
Middle Belt maize, rice cassava, cocoyam, plantain
pepper, okra, eggplant
citrus, coconut, oil palm, rubber
Semi-Deciduous Rain Forest
Middle Belt maize, rice cassava, cocoyam, plantain
cowpea pepper, okra, eggplant, tomato
citrus, oil palm, coffee, cocoa
Forest-Savannah Transition
Middle Belt maize, rice, sorghum
yam, cocoyam, plantain, cassava
cowpea, groundnut
tomato, pepper, eggplant, okra
citrus, coffee, cashew
Guinea Savannah
North maize, rice, sorghum, millet
yam, cassava
cowpea, groundnut, bambara
tomato, pepper
shea nuts, cashew
Sudan Savannah
North maize, rice, sorghum, millet
sweet potato
cowpea, groundnut, bambara
tomato, onion
Coastal Savannah
South maize, rice cassava cowpea tomato, shallot
coconut
Source: Adapted from Gerken et al., 2001; cited by FAO 2005.
20
Table 5. Average National Crop Area (’000 ha) and Yields (2000-2009)
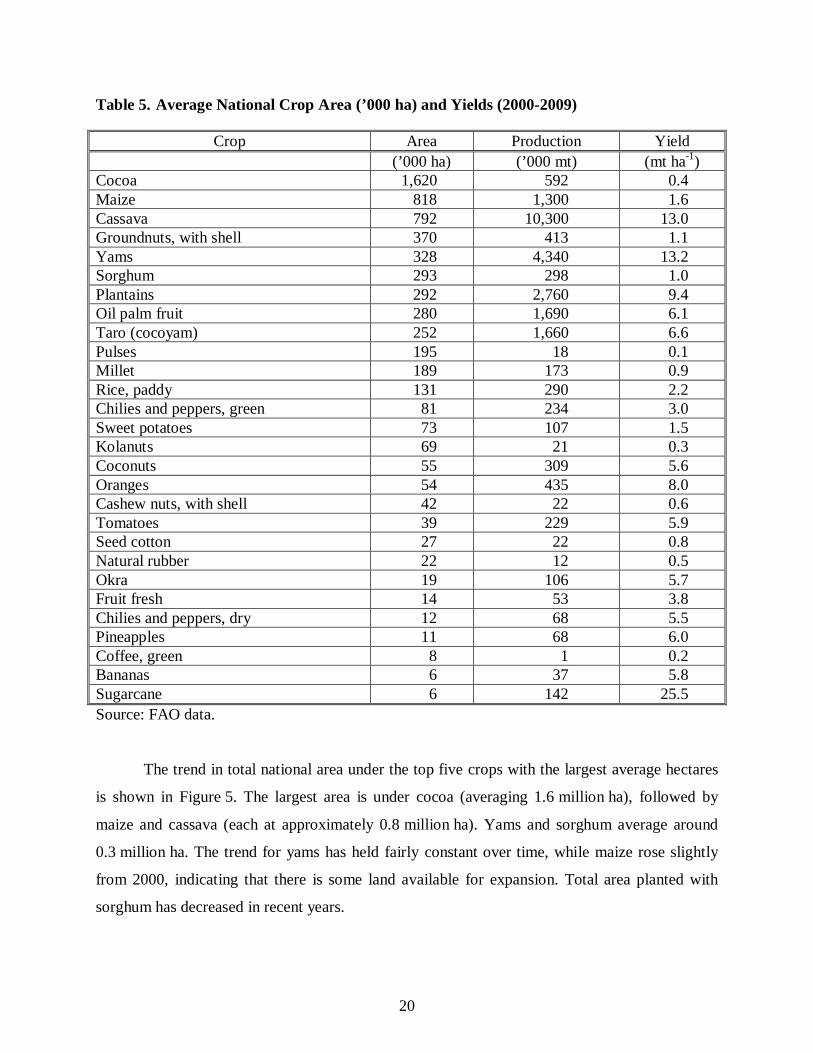
Crop Area Production Yield (’000 ha) (’000 mt) (mt ha-1) Cocoa 1,620 592 0.4 Maize 818 1,300 1.6 Cassava 792 10,300 13.0 Groundnuts, with shell 370 413 1.1 Yams 328 4,340 13.2 Sorghum 293 298 1.0 Plantains 292 2,760 9.4 Oil palm fruit 280 1,690 6.1 Taro (cocoyam) 252 1,660 6.6 Pulses 195 18 0.1 Millet 189 173 0.9 Rice, paddy 131 290 2.2 Chilies and peppers, green 81 234 3.0 Sweet potatoes 73 107 1.5 Kolanuts 69 21 0.3 Coconuts 55 309 5.6 Oranges 54 435 8.0 Cashew nuts, with shell 42 22 0.6 Tomatoes 39 229 5.9 Seed cotton 27 22 0.8 Natural rubber 22 12 0.5 Okra 19 106 5.7 Fruit fresh 14 53 3.8 Chilies and peppers, dry 12 68 5.5 Pineapples 11 68 6.0 Coffee, green 8 1 0.2 Bananas 6 37 5.8 Sugarcane 6 142 25.5 Source: FAO data.
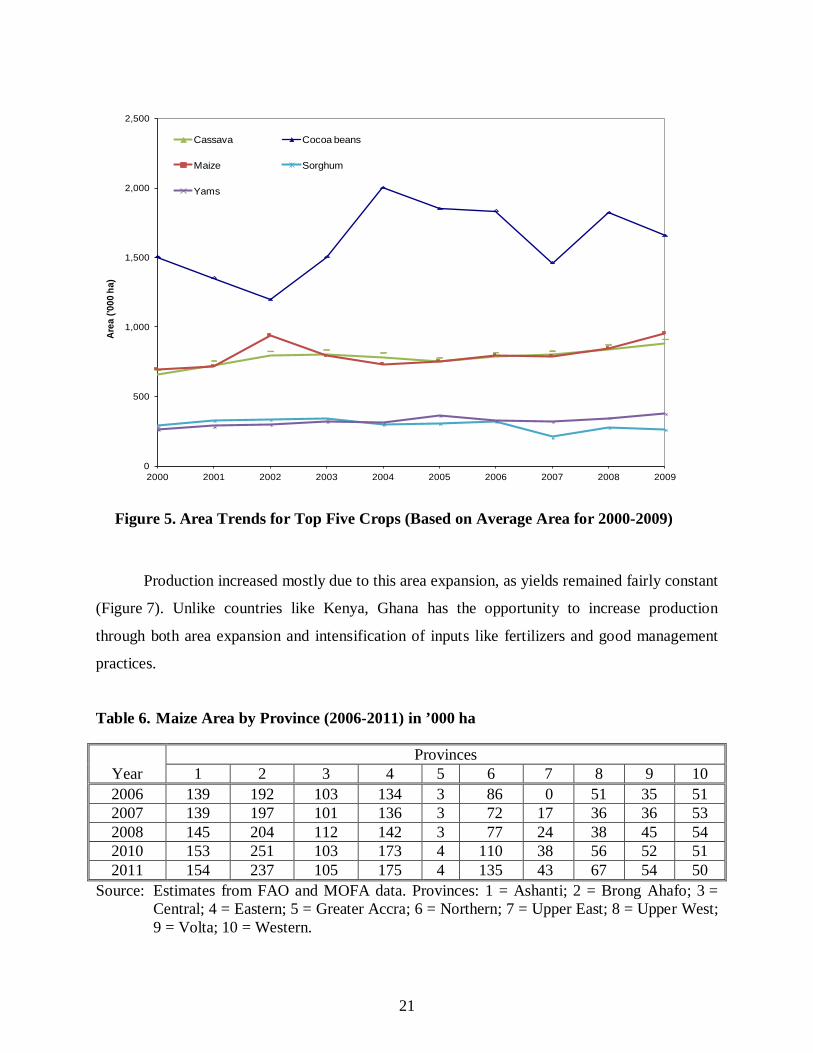
The trend in total national area under the top five crops with the largest average hectares
is shown in Figure 5. The largest area is under cocoa (averaging 1.6 million ha), followed by
maize and cassava (each at approximately 0.8 million ha). Yams and sorghum average around
0.3 million ha. The trend for yams has held fairly constant over time, while maize rose slightly
from 2000, indicating that there is some land available for expansion. Total area planted with
sorghum has decreased in recent years.
21
Figure 5. Area Trends for Top Five Crops (Based on Average Area for 2000-2009)
Production increased mostly due to this area expansion, as yields remained fairly constant
(Figure 7). Unlike countries like Kenya, Ghana has the opportunity to increase production
through both area expansion and intensification of inputs like fertilizers and good management
practices.
Table 6. Maize Area by Province (2006-2011) in ’000 ha
Year Provinces
1 2 3 4 5 6 7 8 9 10 2006 139 192 103 134 3 86 0 51 35 51 2007 139 197 101 136 3 72 17 36 36 53 2008 145 204 112 142 3 77 24 38 45 54 2010 153 251 103 173 4 110 38 56 52 51 2011 154 237 105 175 4 135 43 67 54 50
Source: Estimates from FAO and MOFA data. Provinces: 1 = Ashanti; 2 = Brong Ahafo; 3 = Central; 4 = Eastern; 5 = Greater Accra; 6 = Northern; 7 = Upper East; 8 = Upper West; 9 = Volta; 10 = Western.
0
500
1,000
1,500
2,000
2,500
2000 2001 2002 2003 2004 2005 2006 2007 2008 2009
Area
('00
0 ha
)
Cassava Cocoa beans
Maize Sorghum
Yams
22
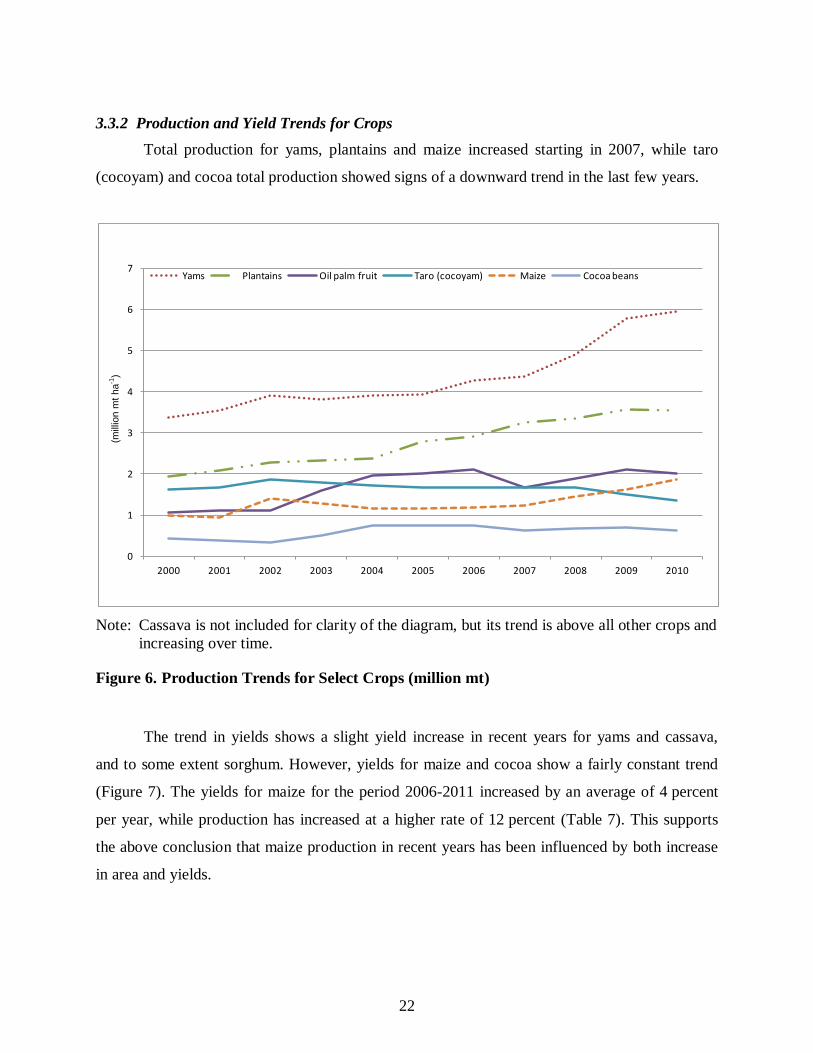
3.3.2 Production and Yield Trends for Crops
Total production for yams, plantains and maize increased starting in 2007, while taro
(cocoyam) and cocoa total production showed signs of a downward trend in the last few years.
Note: Cassava is not included for clarity of the diagram, but its trend is above all other crops and increasing over time.
Figure 6. Production Trends for Select Crops (million mt)
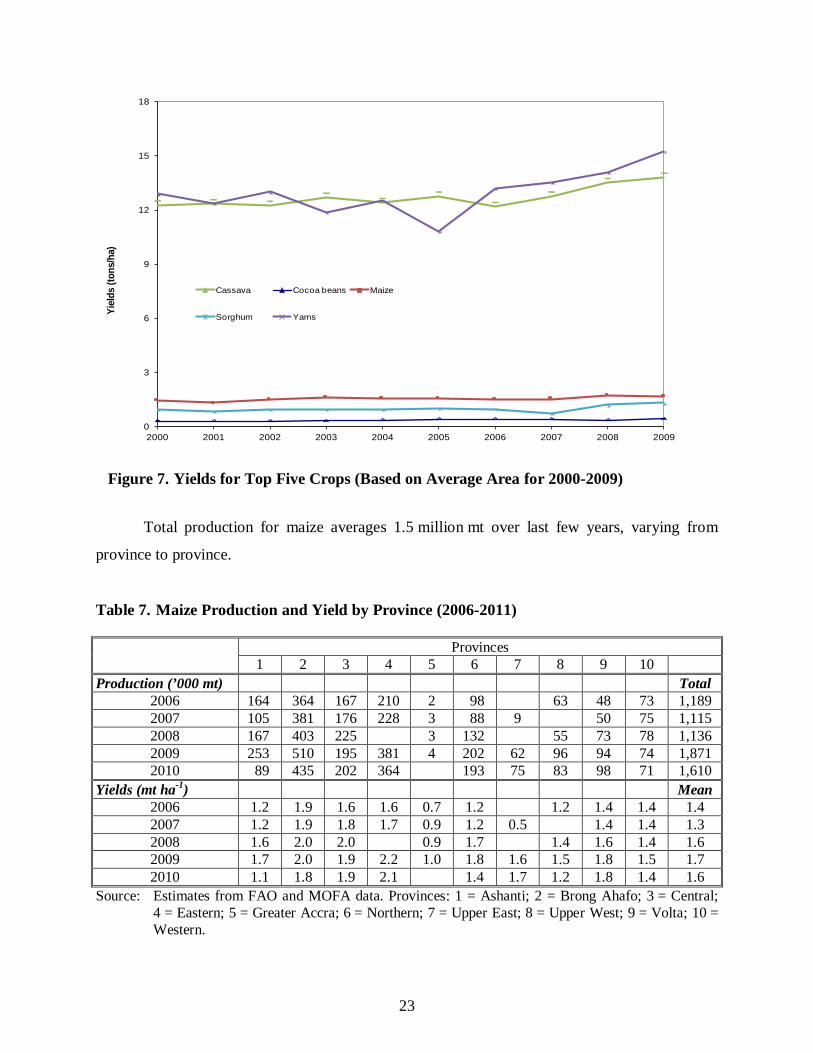
The trend in yields shows a slight yield increase in recent years for yams and cassava,
and to some extent sorghum. However, yields for maize and cocoa show a fairly constant trend
(Figure 7). The yields for maize for the period 2006-2011 increased by an average of 4 percent
per year, while production has increased at a higher rate of 12 percent (Table 7). This supports
the above conclusion that maize production in recent years has been influenced by both increase
in area and yields.
0
1
2
3
4
5
6
7
2000 2001 2002 2003 2004 2005 2006 2007 2008 2009 2010
Yams Plantains Oil palm fruit Taro (cocoyam) Maize Cocoa beans
(mill
ion
mt h
a-1)
23
Figure 7. Yields for Top Five Crops (Based on Average Area for 2000-2009)
Total production for maize averages 1.5 million mt over last few years, varying from
province to province.
Table 7. Maize Production and Yield by Province (2006-2011) Provinces
1 2 3 4 5 6 7 8 9 10 Production (’000 mt) Total
2006 164 364 167 210 2 98 63 48 73 1,189 2007 105 381 176 228 3 88 9 50 75 1,115 2008 167 403 225 3 132 55 73 78 1,136 2009 253 510 195 381 4 202 62 96 94 74 1,871 2010 89 435 202 364 193 75 83 98 71 1,610
Yields (mt ha-1) Mean 2006 1.2 1.9 1.6 1.6 0.7 1.2 1.2 1.4 1.4 1.4 2007 1.2 1.9 1.8 1.7 0.9 1.2 0.5 1.4 1.4 1.3 2008 1.6 2.0 2.0 0.9 1.7 1.4 1.6 1.4 1.6 2009 1.7 2.0 1.9 2.2 1.0 1.8 1.6 1.5 1.8 1.5 1.7 2010 1.1 1.8 1.9 2.1 1.4 1.7 1.2 1.8 1.4 1.6
Source: Estimates from FAO and MOFA data. Provinces: 1 = Ashanti; 2 = Brong Ahafo; 3 = Central; 4 = Eastern; 5 = Greater Accra; 6 = Northern; 7 = Upper East; 8 = Upper West; 9 = Volta; 10 = Western.
0
3
6
9
12
15
18
2000 2001 2002 2003 2004 2005 2006 2007 2008 2009
Yiel
ds (t
ons/
ha)
Cassava Cocoa beans Maize
Sorghum Yams
24
4.0 Ghana’s Fertilizer Market: Evolution and Recent Developments
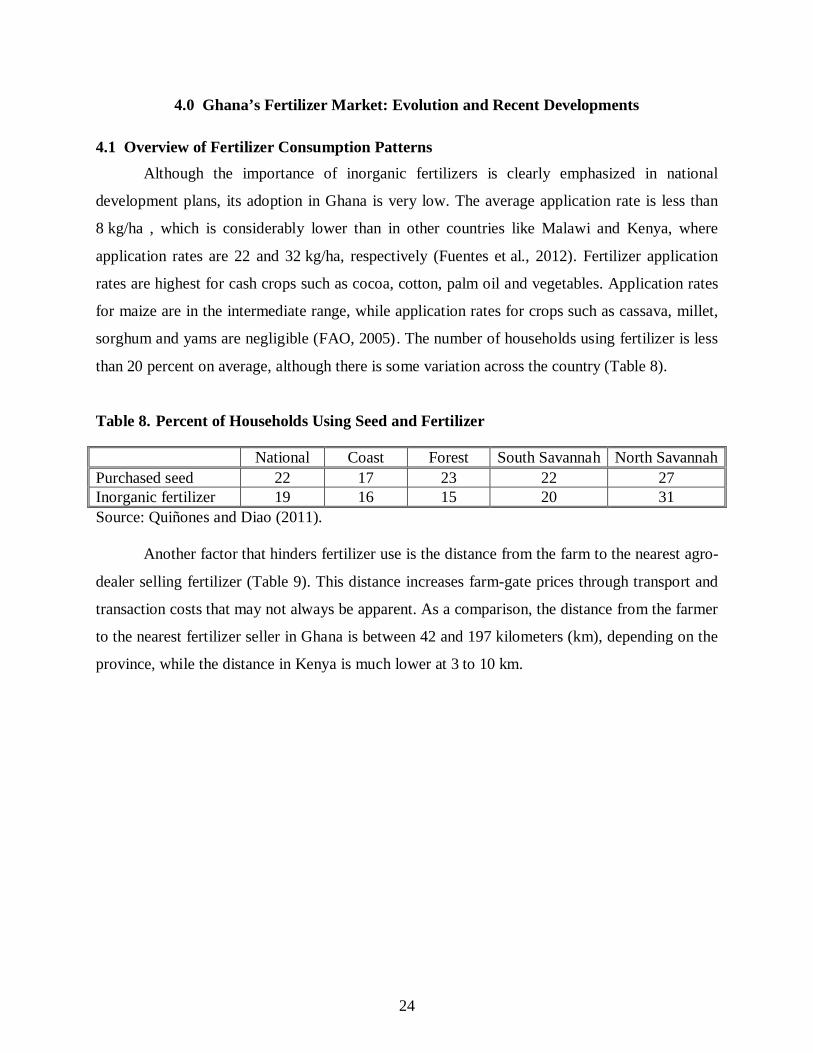
4.1 Overview of Fertilizer Consumption Patterns Although the importance of inorganic fertilizers is clearly emphasized in national
development plans, its adoption in Ghana is very low. The average application rate is less than
8 kg/ha , which is considerably lower than in other countries like Malawi and Kenya, where
application rates are 22 and 32 kg/ha, respectively (Fuentes et al., 2012). Fertilizer application
rates are highest for cash crops such as cocoa, cotton, palm oil and vegetables. Application rates
for maize are in the intermediate range, while application rates for crops such as cassava, millet,
sorghum and yams are negligible (FAO, 2005). The number of households using fertilizer is less
than 20 percent on average, although there is some variation across the country (Table 8).
Table 8. Percent of Households Using Seed and Fertilizer
National Coast Forest South Savannah North Savannah Purchased seed 22 17 23 22 27 Inorganic fertilizer 19 16 15 20 31 Source: Quiñones and Diao (2011).
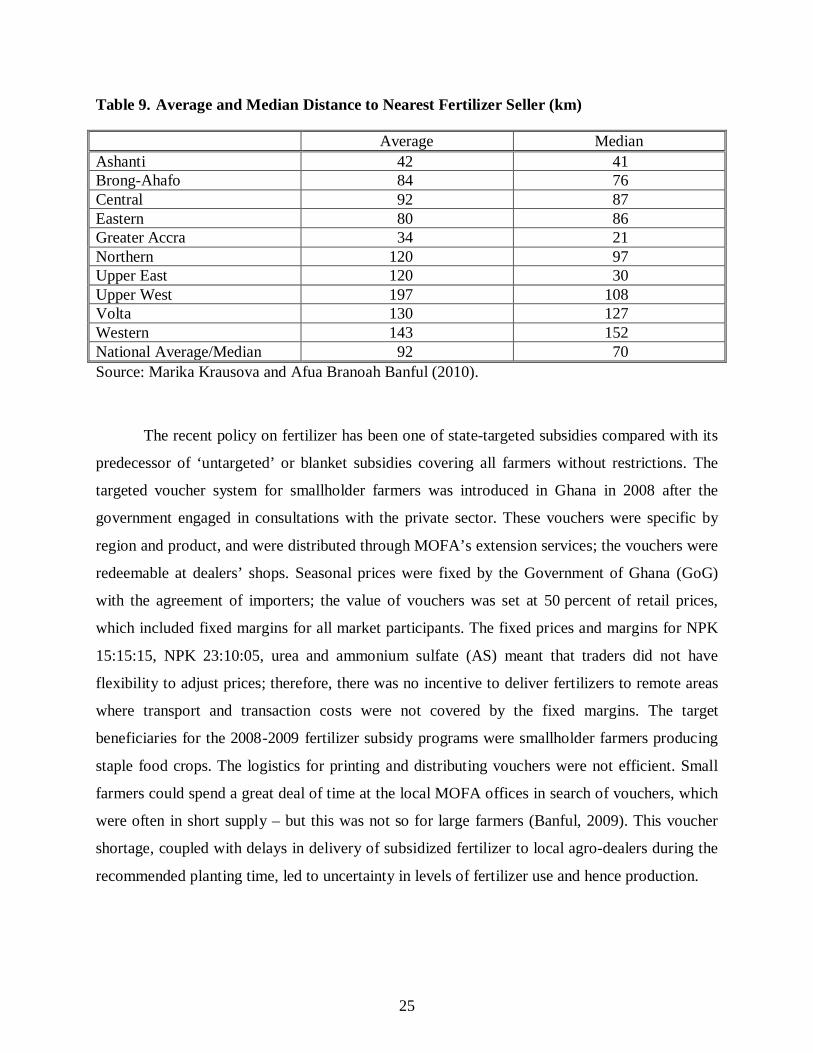
Another factor that hinders fertilizer use is the distance from the farm to the nearest agro-
dealer selling fertilizer (Table 9). This distance increases farm-gate prices through transport and
transaction costs that may not always be apparent. As a comparison, the distance from the farmer
to the nearest fertilizer seller in Ghana is between 42 and 197 kilometers (km), depending on the
province, while the distance in Kenya is much lower at 3 to 10 km.
25
Table 9. Average and Median Distance to Nearest Fertilizer Seller (km)
Average Median Ashanti 42 41 Brong-Ahafo 84 76 Central 92 87 Eastern 80 86 Greater Accra 34 21 Northern 120 97 Upper East 120 30 Upper West 197 108 Volta 130 127 Western 143 152 National Average/Median 92 70 Source: Marika Krausova and Afua Branoah Banful (2010).
The recent policy on fertilizer has been one of state-targeted subsidies compared with its
predecessor of ‘untargeted’ or blanket subsidies covering all farmers without restrictions. The
targeted voucher system for smallholder farmers was introduced in Ghana in 2008 after the
government engaged in consultations with the private sector. These vouchers were specific by
region and product, and were distributed through MOFA’s extension services; the vouchers were
redeemable at dealers’ shops. Seasonal prices were fixed by the Government of Ghana (GoG)
with the agreement of importers; the value of vouchers was set at 50 percent of retail prices,
which included fixed margins for all market participants. The fixed prices and margins for NPK
15:15:15, NPK 23:10:05, urea and ammonium sulfate (AS) meant that traders did not have
flexibility to adjust prices; therefore, there was no incentive to deliver fertilizers to remote areas
where transport and transaction costs were not covered by the fixed margins. The target
beneficiaries for the 2008-2009 fertilizer subsidy programs were smallholder farmers producing
staple food crops. The logistics for printing and distributing vouchers were not efficient. Small
farmers could spend a great deal of time at the local MOFA offices in search of vouchers, which
were often in short supply – but this was not so for large farmers (Banful, 2009). This voucher
shortage, coupled with delays in delivery of subsidized fertilizer to local agro-dealers during the
recommended planting time, led to uncertainty in levels of fertilizer use and hence production.
26
In 2010, there was a policy shift toward blanket subsidies (waybill system) in order to
reach more farmers in an attempt to increase fertilizer demand/use. Unlike the previous system
that used redeemable vouchers that targeted poor smallholder farmers, this new program used a
waybill system where farmers purchased subsidized fertilizers directly from agro-dealers without
vouchers. While the voucher system was based on a percentage reduction of 50 percent of the
market price, the waybill system refunded the transport cost, handling costs, clearing charges and
incidentals (including margins) for importers and dealers.
The new system is facing some of the same problems as the previously implemented
voucher system, including the late delivery of fertilizers that affects planting times and delays
refunds to businesses, thereby increasing the costs involved in fertilizer trade (Fuentes et al.,
2012). The solution to such constraints depends on how the state and the private sector interact to
solve the issues. Therefore, public-private partnerships (PPPs) geared toward reducing delivery
times and getting fertilizers to farmers on time and meeting the financial commitments of traders
by refunding their expenditures in a timely manner are important in raising fertilizer use.
A number of importers are involved in the fertilizer market in Ghana including Wienco,
Yara Ghana (subsidiary of Yara International ASA), Dizengoff (Subsidiary of Balton CP Ltd.),
Chemico, Golden Stork (subsidiary of SCPA Sivex International), AfCot (OLAM, Singapour).
The six main importers create competition, as the market is not large at 100,000 mt. To
overcome the constraints associated with the relatively small fertilizer market in Ghana, some of
these stakeholders/competitors enter into strategic alliances for joint importation in order to
obtain some economies-of-scale and reduce costs. Shipments are split on arrival prior to
distribution to dealers. Another measure to reduce costs is to make sure that ships carry as much
cargo as possible on the inbound and outbound journeys. Straight fertilizers for both West
African ports (Abidjan and Tema) are increasingly being sourced from the Baltic and Black Sea
ports that can load multiple product cargos. In addition, multiple products reduce exposure to
fertilizer price variations.
27
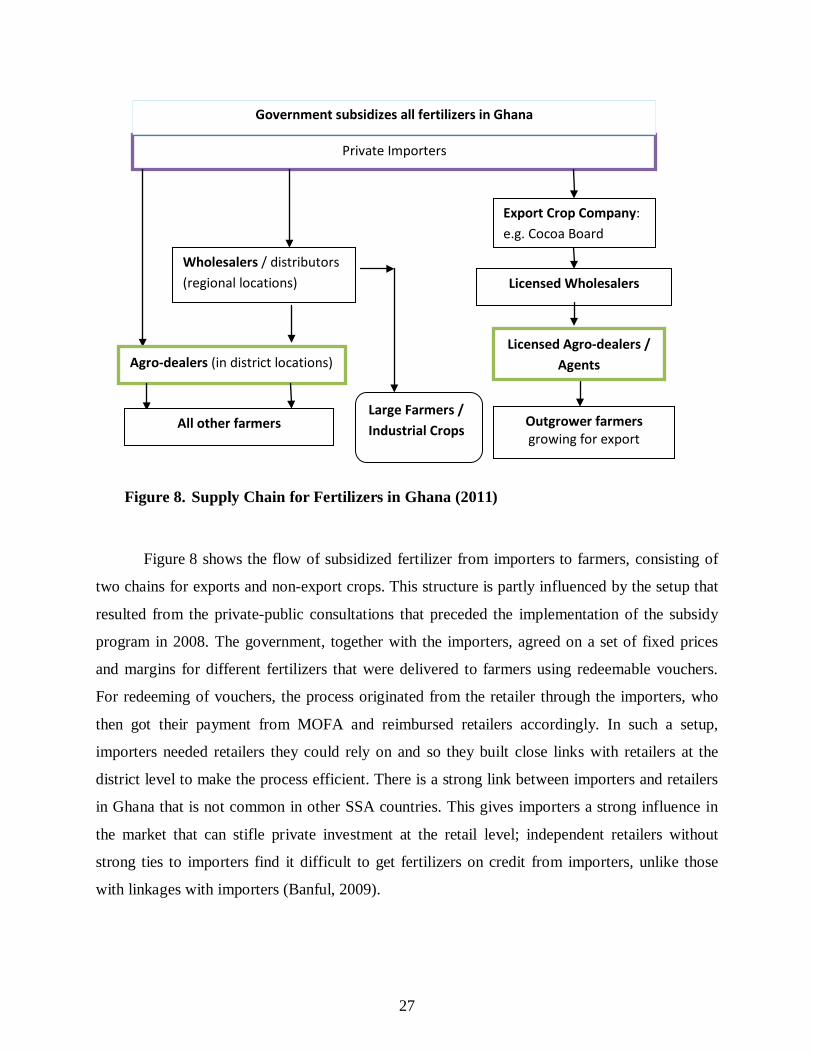
Figure 8. Supply Chain for Fertilizers in Ghana (2011)
Figure 8 shows the flow of subsidized fertilizer from importers to farmers, consisting of
two chains for exports and non-export crops. This structure is partly influenced by the setup that
resulted from the private-public consultations that preceded the implementation of the subsidy
program in 2008. The government, together with the importers, agreed on a set of fixed prices
and margins for different fertilizers that were delivered to farmers using redeemable vouchers.
For redeeming of vouchers, the process originated from the retailer through the importers, who
then got their payment from MOFA and reimbursed retailers accordingly. In such a setup,
importers needed retailers they could rely on and so they built close links with retailers at the
district level to make the process efficient. There is a strong link between importers and retailers
in Ghana that is not common in other SSA countries. This gives importers a strong influence in
the market that can stifle private investment at the retail level; independent retailers without
strong ties to importers find it difficult to get fertilizers on credit from importers, unlike those
with linkages with importers (Banful, 2009).
Private Importers
Export Crop Company: e.g. Cocoa Board
Wholesalers / distributors (regional locations)
Agro-dealers (in district locations)
Outgrower farmers growing for export
All other farmers
Licensed Wholesalers
Licensed Agro-dealers / Agents
Government subsidizes all fertilizers in Ghana
Large Farmers / Industrial Crops
28
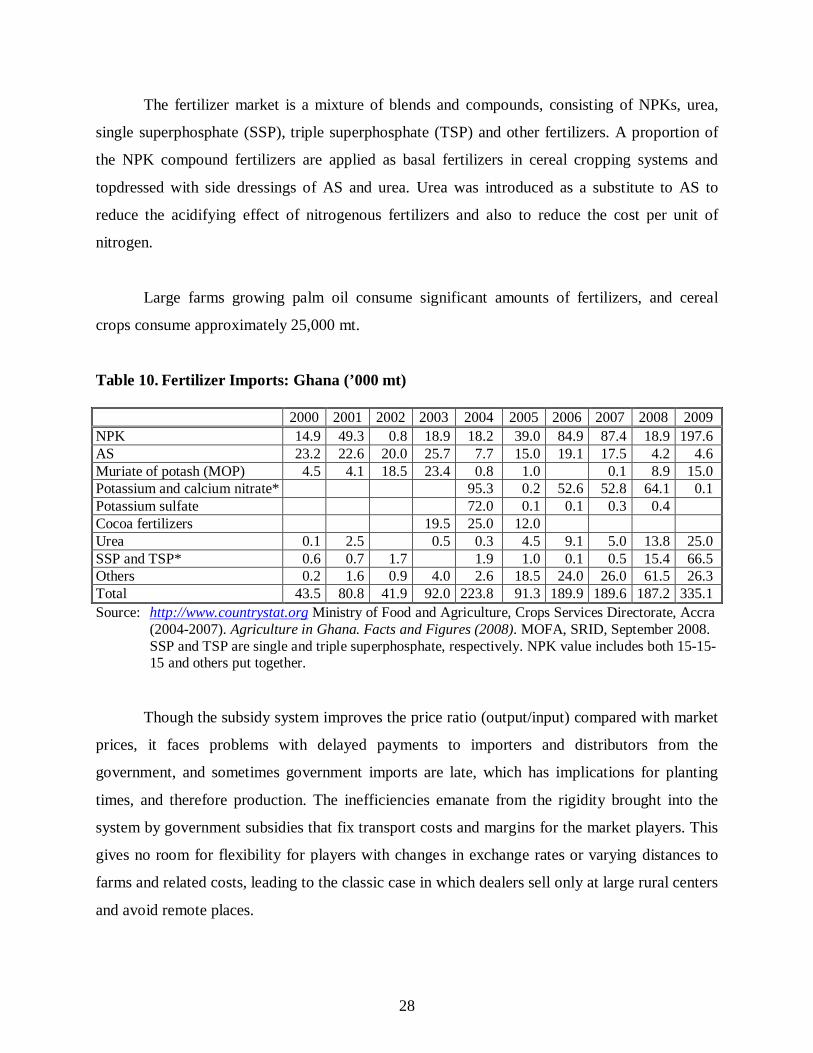
The fertilizer market is a mixture of blends and compounds, consisting of NPKs, urea,
single superphosphate (SSP), triple superphosphate (TSP) and other fertilizers. A proportion of
the NPK compound fertilizers are applied as basal fertilizers in cereal cropping systems and
topdressed with side dressings of AS and urea. Urea was introduced as a substitute to AS to
reduce the acidifying effect of nitrogenous fertilizers and also to reduce the cost per unit of
nitrogen.
Large farms growing palm oil consume significant amounts of fertilizers, and cereal
crops consume approximately 25,000 mt.
Table 10. Fertilizer Imports: Ghana (’000 mt) 2000 2001 2002 2003 2004 2005 2006 2007 2008 2009 NPK 14.9 49.3 0.8 18.9 18.2 39.0 84.9 87.4 18.9 197.6 AS 23.2 22.6 20.0 25.7 7.7 15.0 19.1 17.5 4.2 4.6 Muriate of potash (MOP) 4.5 4.1 18.5 23.4 0.8 1.0 0.1 8.9 15.0 Potassium and calcium nitrate* 95.3 0.2 52.6 52.8 64.1 0.1 Potassium sulfate 72.0 0.1 0.1 0.3 0.4 Cocoa fertilizers 19.5 25.0 12.0 Urea 0.1 2.5 0.5 0.3 4.5 9.1 5.0 13.8 25.0 SSP and TSP* 0.6 0.7 1.7 1.9 1.0 0.1 0.5 15.4 66.5 Others 0.2 1.6 0.9 4.0 2.6 18.5 24.0 26.0 61.5 26.3 Total 43.5 80.8 41.9 92.0 223.8 91.3 189.9 189.6 187.2 335.1 Source: http://www.countrystat.org Ministry of Food and Agriculture, Crops Services Directorate, Accra
(2004-2007). Agriculture in Ghana. Facts and Figures (2008). MOFA, SRID, September 2008. SSP and TSP are single and triple superphosphate, respectively. NPK value includes both 15-15-15 and others put together.
Though the subsidy system improves the price ratio (output/input) compared with market
prices, it faces problems with delayed payments to importers and distributors from the
government, and sometimes government imports are late, which has implications for planting
times, and therefore production. The inefficiencies emanate from the rigidity brought into the
system by government subsidies that fix transport costs and margins for the market players. This
gives no room for flexibility for players with changes in exchange rates or varying distances to
farms and related costs, leading to the classic case in which dealers sell only at large rural centers
and avoid remote places.
29
On the regulatory side, the Pesticides and Fertilizer Regulatory Division (PFRD),
operating within the Plant Protection and Regulatory Services Directorate (PPRSD) of MOFA,
focuses on the quality and regulation of products. It deals with the registration of products and
the inspection of products for quality purposes.
4.1.1 Fertilizer Use in Cocoa The cocoa crop is one of the largest consumers of fertilizer in Ghana. Prior to the 2002/03
season, the cocoa subsector faced low yields compared with an achievable 1.0 mt ha-1 due to low
soil fertility partly resulting from nutrient mining. Since 2000, the cocoa subsector has benefitted
from a varying combination of higher proportion of prices going to farmers; partial liberalization
allowing more private sector participation; and fertilizer intensification and research into disease
control and improved hybrids (Kolavalli and Vigneri, 2011). The Ghana Cocoa Board
(COCOBOD), the management agency of the cocoa subsector, initiated a fertilizer
intensification program in 2004 to raise productivity by raising the fertility of soils. The
COCOBOD estimates fertilizer requirements for the year, contracts importers (usually Wienco
and Chemico) to procure the specialized fertilizers that are then distributed to farmers through
Licensed Buying Companies (LBCs) and their agents. The LBCs receive the fertilizer quantities
from COCOBOD that match their respective cocoa-producing regions, from where these
companies and their agents supply accredited farmers who repay at the end of the season based
on agreed terms. These are sold to farmers at a 50 percent subsidy on a cash-and-carry basis. The
agents must provide security to the LBCs in order to participate in this program. Training,
extension and research are conducted jointly with MOFA and Cocoa Research Institute of Ghana
(CRIG).
There are an estimated 1.6 million ha under cocoa cultivation in Ghana. As of the
2010/11 season, only 20 percent of this area is being fertilized, with 2,600,000 bags
(0.13 million mt) on 325,000 ha. This translates to an application rate of 8 bags/ha. Fertilized
fields, on average, yield at least two times more than the unfertilized fields, according to
COCOBOD.
30
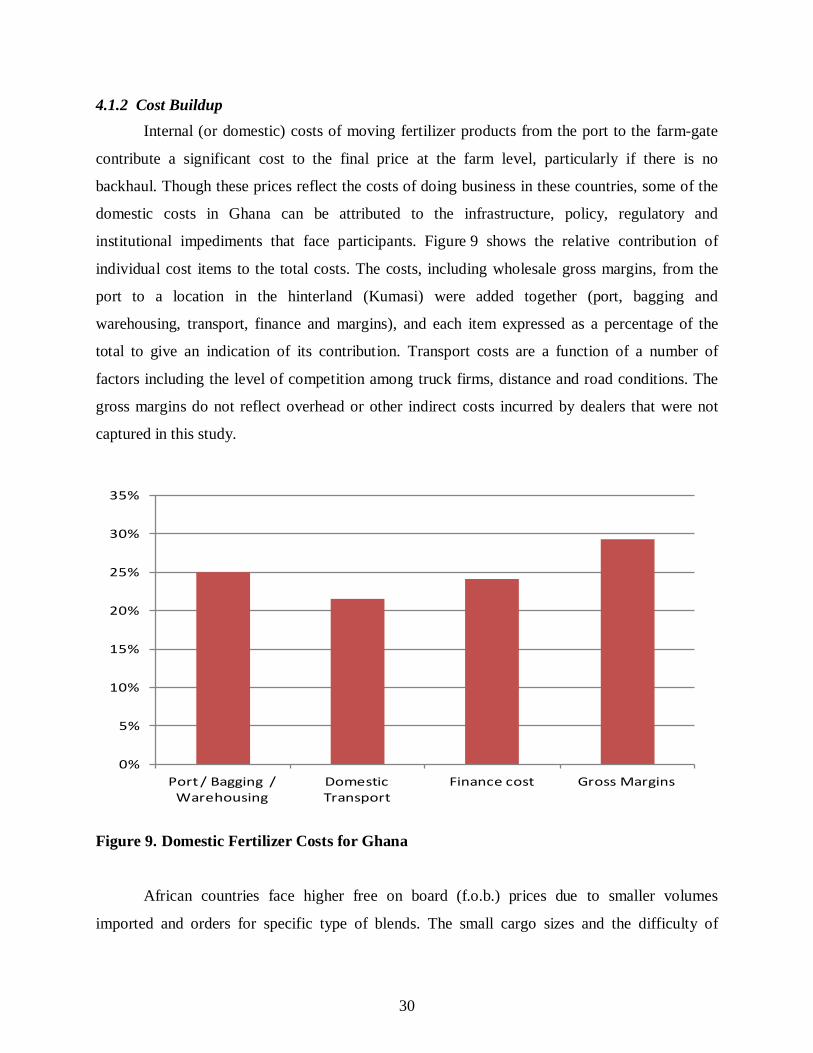
4.1.2 Cost Buildup Internal (or domestic) costs of moving fertilizer products from the port to the farm-gate
contribute a significant cost to the final price at the farm level, particularly if there is no
backhaul. Though these prices reflect the costs of doing business in these countries, some of the
domestic costs in Ghana can be attributed to the infrastructure, policy, regulatory and
institutional impediments that face participants. Figure 9 shows the relative contribution of
individual cost items to the total costs. The costs, including wholesale gross margins, from the
port to a location in the hinterland (Kumasi) were added together (port, bagging and
warehousing, transport, finance and margins), and each item expressed as a percentage of the
total to give an indication of its contribution. Transport costs are a function of a number of
factors including the level of competition among truck firms, distance and road conditions. The
gross margins do not reflect overhead or other indirect costs incurred by dealers that were not
captured in this study.
Figure 9. Domestic Fertilizer Costs for Ghana African countries face higher free on board (f.o.b.) prices due to smaller volumes
imported and orders for specific type of blends. The small cargo sizes and the difficulty of
0%
5%
10%
15%
20%
25%
30%
35%
Port / Bagging / Warehousing
Domestic Transport
Finance cost Gross Margins
31
finding return cargo also raise shipping costs relative to other areas with large volume
procurements and the availability of return cargo.
Port costs for Ghana are relatively high because of demurrage charges resulting from
delays in completion of activities at the port, underinvestment in necessary equipment and low
port capacity that cannot handle large ships of over 20,000 mt; these factors deny importers
economies-of-scale in procurement that could reduce costs.
Interest rates, and hence the cost of capital, are higher in Africa due to rates that can be as
high as 30 percent, compared with developed countries where interest rates are below 10 percent.
Transport costs are a significant part of these costs due to poor infrastructure and an
uncompetitive transport sector. Other factors that influence costs include non-tariff barriers
(NTB), uncertainty about quality of fertilizers in some countries due to poor quality control and
regulation or lack of appropriate port and equipment facilities. On the demand side, poor or
nonexistent extension systems in some areas, fertilizer recommendations that do not take into
account heterogeneity across regions and underdeveloped output markets pose challenges in
raising fertilizer use.
5.0 Estimating Fertilizer Requirements: Implications for Value Chain
In a perfect scenario, the best way to estimate fertilizer required to meet the targets for
the agricultural sector is to use as much information as possible to capture the different factors
and complexities involved in linking inputs to markets. In this regard, some of the tools will need
application of some elements of the CGE model and partial equilibrium analysis. However, these
methods require more data and more sophisticated analytical methods. Due to these limitations,
available data and appropriate techniques determined the analytical methods. This implies that
these estimates can only act as a guide to the true values based on identified constraints. The
greatest challenges are: the lack of disaggregated data on fertilizer use per crop and region; lack
of updated soil profiles; lack of updated trends in prices for various crops to be used in the
DSSAT model; incomplete, or the lack of, modules for some METASIP target crops in the
DSSAT model; and the lack of access to data on area and production by crop by season and by
32
zone to capture differences. Therefore, we use more than one approach or method in order to
create robustness and provide a reasonable range for these fertilizer estimates.
In this section, we use two approaches to estimate fertilizer required to achieve the
METASIP targets and close the yield gap (Table 3). We utilize the DSSAT model described
above and another approach with appropriate assumptions and caveats as an additional method
for comparison with the DSSAT results. This latter approach uses the nutrient removal by crops
at certain yield levels to estimate nutrient uptake to meet production. These nutrient uptake
factors are derived by research stations based on the relationship between production levels and
nutrient removal at different levels of production. Using the DSSAT model, we get an estimate
of the levels of N, P and K needed for an economically achievable level of production based on
the prevailing prices at the different locations, combining agronomic and economic aspects.
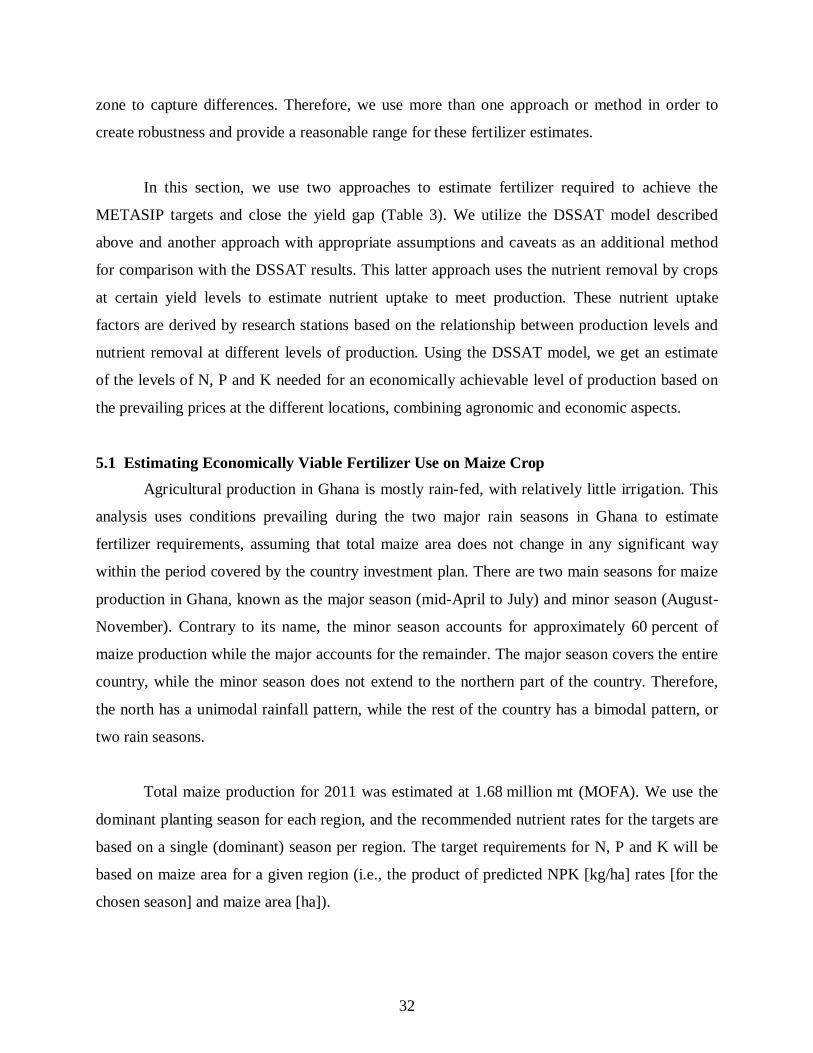
5.1 Estimating Economically Viable Fertilizer Use on Maize Crop Agricultural production in Ghana is mostly rain-fed, with relatively little irrigation. This
analysis uses conditions prevailing during the two major rain seasons in Ghana to estimate
fertilizer requirements, assuming that total maize area does not change in any significant way
within the period covered by the country investment plan. There are two main seasons for maize
production in Ghana, known as the major season (mid-April to July) and minor season (August-
November). Contrary to its name, the minor season accounts for approximately 60 percent of
maize production while the major accounts for the remainder. The major season covers the entire
country, while the minor season does not extend to the northern part of the country. Therefore,
the north has a unimodal rainfall pattern, while the rest of the country has a bimodal pattern, or
two rain seasons.
Total maize production for 2011 was estimated at 1.68 million mt (MOFA). We use the
dominant planting season for each region, and the recommended nutrient rates for the targets are
based on a single (dominant) season per region. The target requirements for N, P and K will be
based on maize area for a given region (i.e., the product of predicted NPK [kg/ha] rates [for the
chosen season] and maize area [ha]).
33
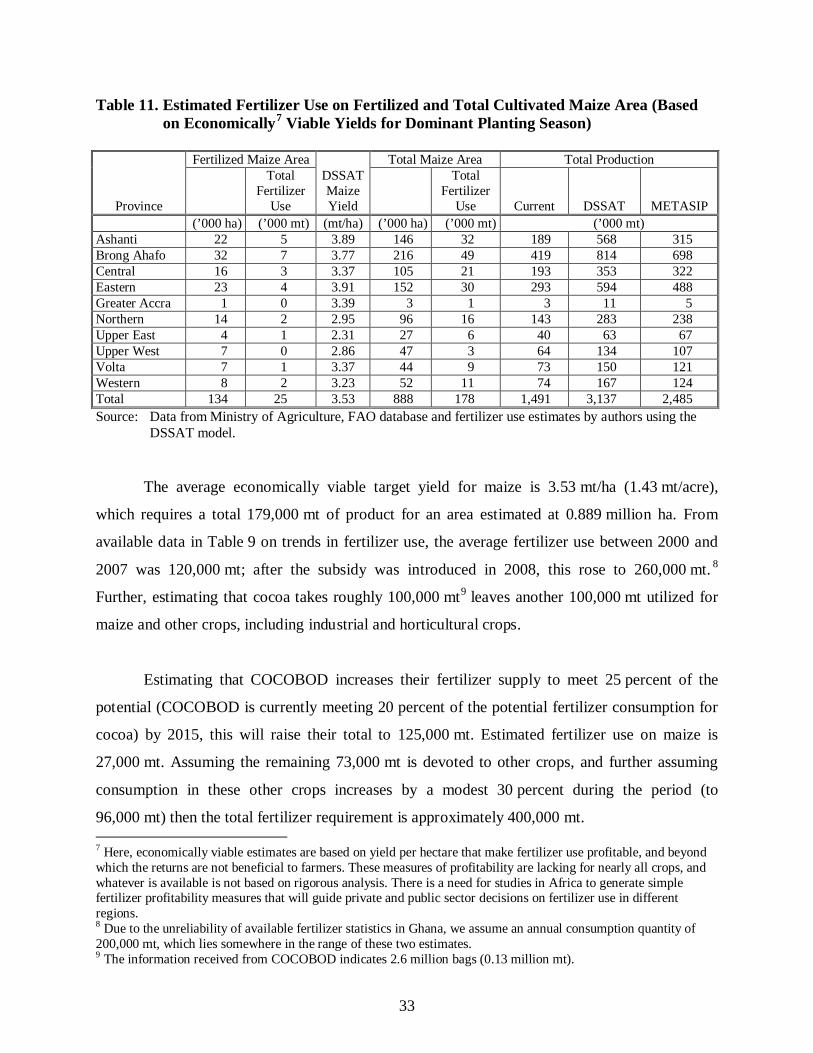
Table 11. Estimated Fertilizer Use on Fertilized and Total Cultivated Maize Area (Based on Economically7
Viable Yields for Dominant Planting Season)
Province
Fertilized Maize Area DSSAT Maize Yield
Total Maize Area Total Production
Total Fertilizer
Use
Total Fertilizer
Use Current DSSAT METASIP (’000 ha) (’000 mt) (mt/ha) (’000 ha) (’000 mt) (’000 mt) Ashanti 22 5 3.89 146 32 189 568 315 Brong Ahafo 32 7 3.77 216 49 419 814 698 Central 16 3 3.37 105 21 193 353 322 Eastern 23 4 3.91 152 30 293 594 488 Greater Accra 1 0 3.39 3 1 3 11 5 Northern 14 2 2.95 96 16 143 283 238 Upper East 4 1 2.31 27 6 40 63 67 Upper West 7 0 2.86 47 3 64 134 107 Volta 7 1 3.37 44 9 73 150 121 Western 8 2 3.23 52 11 74 167 124 Total 134 25 3.53 888 178 1,491 3,137 2,485 Source: Data from Ministry of Agriculture, FAO database and fertilizer use estimates by authors using the
DSSAT model.
The average economically viable target yield for maize is 3.53 mt/ha (1.43 mt/acre),
which requires a total 179,000 mt of product for an area estimated at 0.889 million ha. From
available data in Table 9 on trends in fertilizer use, the average fertilizer use between 2000 and
2007 was 120,000 mt; after the subsidy was introduced in 2008, this rose to 260,000 mt. 8
Further, estimating that cocoa takes roughly 100,000 mt9
leaves another 100,000 mt utilized for
maize and other crops, including industrial and horticultural crops.
Estimating that COCOBOD increases their fertilizer supply to meet 25 percent of the
potential (COCOBOD is currently meeting 20 percent of the potential fertilizer consumption for
cocoa) by 2015, this will raise their total to 125,000 mt. Estimated fertilizer use on maize is
27,000 mt. Assuming the remaining 73,000 mt is devoted to other crops, and further assuming
consumption in these other crops increases by a modest 30 percent during the period (to
96,000 mt) then the total fertilizer requirement is approximately 400,000 mt. 7 Here, economically viable estimates are based on yield per hectare that make fertilizer use profitable, and beyond which the returns are not beneficial to farmers. These measures of profitability are lacking for nearly all crops, and whatever is available is not based on rigorous analysis. There is a need for studies in Africa to generate simple fertilizer profitability measures that will guide private and public sector decisions on fertilizer use in different regions. 8 Due to the unreliability of available fertilizer statistics in Ghana, we assume an annual consumption quantity of 200,000 mt, which lies somewhere in the range of these two estimates. 9 The information received from COCOBOD indicates 2.6 million bags (0.13 million mt).
34
5.2 Estimating Fertilizer Use on All Crops Using Nutrient Removal Approach To supplement the DSSAT results, we also construct estimates for the targeted crop
production increases based on crop nutrient removal rates. This method estimates fertilizer
requirements based on nutrients removed by harvested crops, adjusted to reflect fertilizer
recovery efficiency. The approach assumes good management practices on the part of farmers,
but that fertilizer application is for maintaining rather than building soil fertility levels. Nutrient
levels contained in the incremental harvested crops were estimated, then adjusted by efficiency
factors for N, P and K. This approach assumes that the full nutrient uptake requirement of the
crops beyond removal levels is met by indigenous sources and recycling of residues. Table 12
shows the results from this method.
The analysis indicates that incremental nutrient removal associated with the increased
output of targeted crops would total 55,430 mt of nutrients. We assume that production of the
other major crops that were not specifically targeted in METASIP also increases modestly over
the same five-year target period. To do otherwise could have the irrational effect of redirecting
fertilizer to specifically targeted crops. We assume they grow 40 percent over the target period.
Meeting the fertilizer nutrient replacement requirement for these crops would necessitate
89,240 nutrient tons of fertilizer.
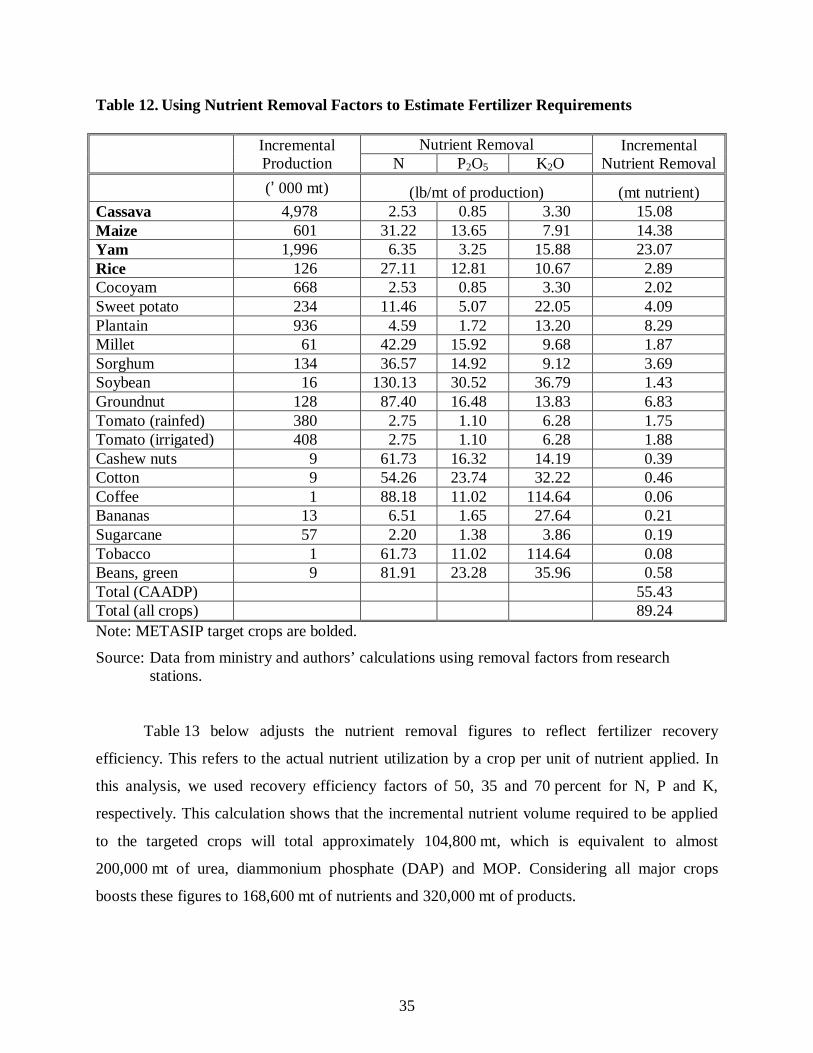
35
Table 12. Using Nutrient Removal Factors to Estimate Fertilizer Requirements Incremental
Production Nutrient Removal Incremental
Nutrient Removal N P2O5 K2O (ʼ 000 mt) (lb/mt of production) (mt nutrient) Cassava 4,978 2.53 0.85 3.30 15.08 Maize 601 31.22 13.65 7.91 14.38 Yam 1,996 6.35 3.25 15.88 23.07 Rice 126 27.11 12.81 10.67 2.89 Cocoyam 668 2.53 0.85 3.30 2.02 Sweet potato 234 11.46 5.07 22.05 4.09 Plantain 936 4.59 1.72 13.20 8.29 Millet 61 42.29 15.92 9.68 1.87 Sorghum 134 36.57 14.92 9.12 3.69 Soybean 16 130.13 30.52 36.79 1.43 Groundnut 128 87.40 16.48 13.83 6.83 Tomato (rainfed) 380 2.75 1.10 6.28 1.75 Tomato (irrigated) 408 2.75 1.10 6.28 1.88 Cashew nuts 9 61.73 16.32 14.19 0.39 Cotton 9 54.26 23.74 32.22 0.46 Coffee 1 88.18 11.02 114.64 0.06 Bananas 13 6.51 1.65 27.64 0.21 Sugarcane 57 2.20 1.38 3.86 0.19 Tobacco 1 61.73 11.02 114.64 0.08 Beans, green 9 81.91 23.28 35.96 0.58 Total (CAADP) 55.43 Total (all crops) 89.24 Note: METASIP target crops are bolded.
Source: Data from ministry and authors’ calculations using removal factors from research stations.
Table 13 below adjusts the nutrient removal figures to reflect fertilizer recovery
efficiency. This refers to the actual nutrient utilization by a crop per unit of nutrient applied. In
this analysis, we used recovery efficiency factors of 50, 35 and 70 percent for N, P and K,
respectively. This calculation shows that the incremental nutrient volume required to be applied
to the targeted crops will total approximately 104,800 mt, which is equivalent to almost
200,000 mt of urea, diammonium phosphate (DAP) and MOP. Considering all major crops
boosts these figures to 168,600 mt of nutrients and 320,000 mt of products.
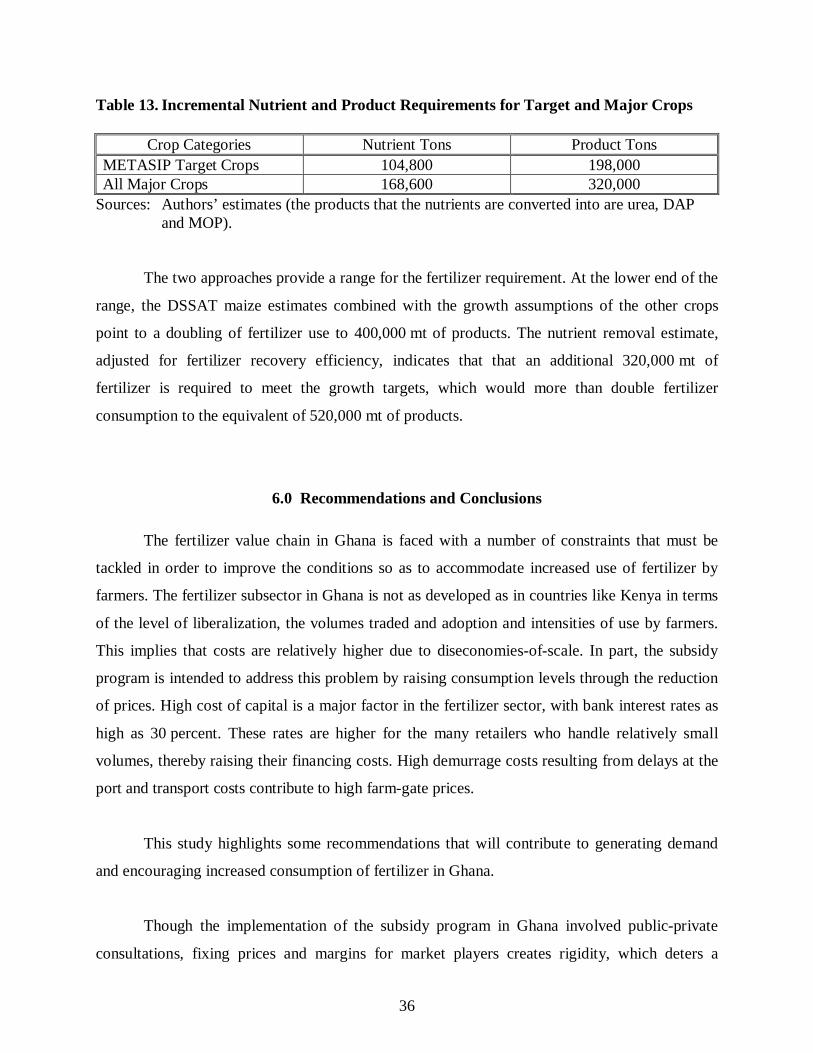
36
Table 13. Incremental Nutrient and Product Requirements for Target and Major Crops
Sources: Authors’ estimates (the products that the nutrients are converted into are urea, DAP and MOP).
The two approaches provide a range for the fertilizer requirement. At the lower end of the
range, the DSSAT maize estimates combined with the growth assumptions of the other crops
point to a doubling of fertilizer use to 400,000 mt of products. The nutrient removal estimate,
adjusted for fertilizer recovery efficiency, indicates that that an additional 320,000 mt of
fertilizer is required to meet the growth targets, which would more than double fertilizer
consumption to the equivalent of 520,000 mt of products.
6.0 Recommendations and Conclusions
The fertilizer value chain in Ghana is faced with a number of constraints that must be
tackled in order to improve the conditions so as to accommodate increased use of fertilizer by
farmers. The fertilizer subsector in Ghana is not as developed as in countries like Kenya in terms
of the level of liberalization, the volumes traded and adoption and intensities of use by farmers.
This implies that costs are relatively higher due to diseconomies-of-scale. In part, the subsidy
program is intended to address this problem by raising consumption levels through the reduction
of prices. High cost of capital is a major factor in the fertilizer sector, with bank interest rates as
high as 30 percent. These rates are higher for the many retailers who handle relatively small
volumes, thereby raising their financing costs. High demurrage costs resulting from delays at the
port and transport costs contribute to high farm-gate prices.
This study highlights some recommendations that will contribute to generating demand
and encouraging increased consumption of fertilizer in Ghana.
Though the implementation of the subsidy program in Ghana involved public-private
consultations, fixing prices and margins for market players creates rigidity, which deters a
Crop Categories Nutrient Tons Product Tons METASIP Target Crops 104,800 198,000 All Major Crops 168,600 320,000
37
flexible market system able to adapt to changing circumstances. This structure of controlled
prices implies that market penetration will be limited, and some areas will not be served, as they
do not offer attractive returns to traders within these restrictions. It will be difficult to meet the
fertilizer required to achieve agricultural growth goals under these circumstances. This will
succeed only if (1) there are increased taxpayer revenues diverted into this program despite other
competing needs elsewhere in the economy for the same funds; (2) there is development partner
or donor support; (3) policy reforms are enacted that encourage increased private sector
investment with minimal state intervention; or (4) a workable mix of the above requirements.
Available evidence indicates that encouraging private sector investment under an enabling policy
environment is the best way to achieve increased fertilizer use unless there are substantial public
resources to sustain state intervention through subsidies or by other means.
It is important to have policies that do not constrain private sector development.
Currently, Ghana is grappling with developing a coherent policy for fertilizer subsidies after
replacing targeted voucher subsidies with a blanket waybill system that covers all farmers. The
latter will require substantial amounts of public funds, which brings into question the
sustainability of the program.
Fertilizer demand can be raised through various approaches in order to meet the
agricultural growth targets. The establishment of PPPs for the development and dissemination of
improved technologies will complement efforts aimed at raising productivity through fertilizer
use. Facilitation of soil testing to encourage adoption of the right fertilizer products for each
location and crop will be useful in raising demand for fertilizers, as will be extension services to
inform farmers on the best practices and packages that increase production. As part of this
process, taking a holistic approach through ISFM will increase farm productivity.
Procurement costs can be reduced by raising trade volumes if importers were to source
fertilizers for the region (ECOWAS). This will require harmonizing trade policies across
countries to reduce tariffs, and NTBs and market players creating strategic alliances to make
joint imports to reduce shipping costs by using larger vessels. Unlike the East Africa region, the
west has substantial resources in gas that can be exploited with appropriate regional cooperation.
38
Just as in Kenya and Tanzania, Ghana has poor rural roads and limited warehouse or storage
facilities both for farmers and businesses. This is an area that requires both public and private
investments in order to enhance both input and output market development. It is also necessary
to ensure that quality control and the safe handling of products is implemented in order to create
trust with farmers as to the effectiveness and safety of the products.
39
7.0 References
Banful, A.B. 2009. “Operational Details of the 2008 Fertilizer Subsidy in Ghana – Preliminary
Report,” Ghana Strategy Support Program (GSSP) Background Paper 18, IFPRI-Accra.
Breisinger, C., X. Diao and S. Kolavalli. 2011. “A New Era of Transformation in Ghana:
Lessons from the Past and Scenarios for the Future,” International Food Policy Research
Institute (IFPRI) Research Monograph, Washington, D.C.
Breisinger, C., X. Diao, J. Thurlow and R. Hassan. 2008. “Agriculture for Development in
Ghana,” Paper presented at PEGNet Conference, Assessing Development Impact –
Learning from Experience, Accra (Ghana), September 11-12, 2008.
FAO. 2005. Fertilizer Use by Crop in Ghana, Land and Plant Nutrition Management Service,
Land and Water Development Division, Food and Agriculture Organization of the United
Nations, Rome.
FtF. 2011. Ghana FY 2011–2015 Multi-Year Strategy. U.S. Government Document.
http://www.feedthefuture.gov/sites/default/files/country/strategies/files/GhanaFeedtheFut
ureMulti-YearStrategy_2011-08-03.pdf
Fuentes, P., B. Bumb and M. Johnson. 2012. Improving Fertilizer Markets in West Africa: The
Fertilizer Supply Chain in Ghana, International Fertilizer Development Center (IFDC)
and IFPRI, Muscle Shoals, Alabama (forthcoming).
GoG. 2010. “Medium Term Agriculture Sector Investment Plan (METASIP) 2011-2015,”
MOFA.
Hoogenboom, G., J.W. Jones, P.W. Wilkens, C.H. Porter, K.J. Boote, L.A. Hunt, U. Singh, J.L.
Lizaso, J.W. White, O. Uryasev, F.S. Royce, R. Ogoshi, A.J. Gijsman and G.Y. Tsuji.
2010. Decision Support System for Agrotechnology Transfer (DSSAT) Version 4.5 [CD-
ROM], University of Hawaii, Honolulu, Hawaii.
Jones, J.W., G. Hoogenboom, C.H. Porter, K.J. Boote, W.D. Batchelor, L.A. Hunt, P.W.
Wilkens, U. Singh, A.J. Gijsman and J.T. Ritchie. 2003. “DSSAT Cropping System
Model,” European Journal of Agronomy, 18:235-265.
Kolavalli, S., and M. Vigneri. 2011. “Cocoa in Ghana: Shaping the Success of an Economy.”
Chapter 12 IN Yes Africa Can, Punam Chuhan-Pole and Manka Angwafo (Eds.), World
Bank, Washington, D.C.
40
Krausova, Marika, and Afua Branoah Banful. 2010. “Overview of the Agricultural Input Sector
in Ghana,” Development Strategy and Governance Division, Ghana.
SRID. 2008. Agriculture in Ghana: Facts and Figures. MOFA
SRID. 2010. Agriculture in Ghana: Facts and Figures. MOFA
Quiñones, Esteban J., and Xinshen Diao. 2011. “Assessing Crop Production and Input Use
Patterns in Ghana – What Can We Learn From the Ghana Living Standards Survey
(GLSS5)?,” Development, Strategy and Governance Division, IFPRI, Ghana Strategy
Support Program (GSSP) Working Paper No. 0024.
World Bank. 2007. “Country Economic Memorandum: Ghana,” in three volumes, World Bank,
Washington, D.C.