Embed Size (px)
Citation preview
1Jnited States General Accounting Office “.
.GAO .- _ I. “. _... *..” ,.... __.._.._-.---_..--- l._- _... ._-_-__-.- . . ..-_ -- ..-... - _.._. .._
Report to the Chairman, Subc&mittee on Civil Service, Committee on Post Office and Civil Service, House of Representatives
._ .._ _. I. __- ..__,... _.. ..__._... _..- ..__.-. .“” .___” l..“.l . . _--_ May 1992 SENIOR EXECUTIVE
SERVICE Opinions About the Federal Work Environment
--^.....--I -II_ ._“..- .“.l-.-~.. ., .-ll _-... “- ..--._.-.-----_.------
’ GAO/GGD-92-63
.
._ ” _ - .._ __--. -- .._ -._-- .._._._... --- _.... --. -._-- ------ -
ll. .,_.. ...-” _____. ____- -___.- -_-_~-
’ GAS3 United States General Accounting Office Waeh@tan, D.C. 20648
General Government Division
B-243518
May l,lQQ2
The Honorable Gerry Sikorski Chairman, Subcommittee on Civil Service Committee on Post Office and
Civil Service House of Representatives
Dear Mr. c-
At your request, we have begun to examine the working relationships among career executives and political appointees. As part of our initial effort, we analyzed the results of two surveys sent to Senior Executive Service (sxs) members in November 1989 and May 1991. They were identical and covered a broad spectrum of issues related to the work environment, including managerial and supervisory characteristics of career executives and political appointees. We discuss the results of both surveys in this report.
Career executives responding to our surveys reported positive or improving perceptions about many aspects of their work environment and their relations with political appointees. They also expressed less favorable views in certain areas, which may not be surprising given the tension between career executives and political appointees that may be inherent in our system of government. Although we do not have evidence to substantiate or refute their perceptions, it is nevertheless important for Congress and the executive branch to know what career sxs members’ perceptions are so that actions can be taken for continuous improvements.
Background Career executives are individuals with civil service status who are appointed competitively to SES positions. The Office of Personnel Management (OPM) or other appointing authorities are required to review and approve the qualifications and suitability of these executives before they are appointed. As executives who have made federal employment their careers, they provide expertise to program management and administration and are expected to be generally familiar with the history of programs and the myriad of laws and regulations that define program objectives and operating guidelines.
Political appointees include individuals appointed to noncompetitive executive level, noncareer SES, and Schedule C positions that involve formulating, advocating, and directing administration policies or a close
Page 1 WO/GGD-M-68 SE8 Suwey
,+, -. ,t _‘/
B-242518
and confidential working relationship with a key official. Such appointees serve in key positions in the federal government to ensure that the policy goals and objectives of the administration are met.
According to Alan K. Campbell, former Director of OPM, political appointees were included in the SES with the hope of reducing the antagonism between career executives and political appointees that he stated was one of the most dysfunctional parts of the federal government.* In 1989, the Volcker Commission addressed this issue and made several recommendations to improve the partnership relationship among career executives and political appointeea In testimony before the House Committee on Post Office and Civil Service in April 1989, we agreed with the Commission’s recommendations to strengthen the partnership among presidential appointees and career executives? Later that same year, we testified before your Subcommittee that political appointees needed to work with career SES members to improve their working relationships and to recognize that career SES members can make substantial contributions to the efficient operation of the government.4
Approach Our objectives were to (1) analyze the views career and noncareer SES members had of their work environment, including the managerial and supervisory characteristics of career executives and political appointees, and (2) determine whether career SES members’ views on their work environment had changed since 1989. To accomplish these objectives, we sent two identical questionnaires to SES members at 19 agencies and departments in November 1989 and May 1991. According to OPM, SES members at the 19 departments and agencies included in our surveys accounted for about 83 percent of the total 7,212 SES members in June 1989 and about 84 percent of the total 7,664 sxs members in December 1990. For this report, we refer to this universe as governmentwide. 6
We sent our 1989 survey to a random sample of 1,340 career and noncareer SES members. Governmentwide, about 70 percent of the 1,340 SES members responded to this survey. However, since noncareer sxs members
‘Statement of Alan K. Campbell, former Director, OPM, before the Subcommittee on Civil Service, Committee on Post OMce and Civil Service, Howe of Repreaentativ~, April 12,lQM.
%eademhip for America, Rebuilding the Public Service, The Report of the National Ckmunhaion on the Public Service, 1080, pp. 181-188.
%port on the National Commission on the Public Service (GAOII%GD-S%lQ, Apr. 27,lQSQ).
‘Po1itical Appointees in Federal Agencies (GAW-GGD-QM, Oct. 26,lQS3).
Pago 2 WGGD-8242 SE8 Survey
I E24BslB
accounted for only about 3 percent of the respondents and were considered too few to constitute a representative group, we did not report their responses to the 1989 survey,
We sent our 1991 survey to a random sam ple of 1,676 career SES m embers and all 482 noncareer 9~9 m embers at the 19 agencies and departm ents covered by our survey. About 74 percent of the career SES m embers and about 60 percent of the noncareer SES m embers responded to t&is survey. Although the SO-percent response rate for survey results was lower than the 7Q-percent response rate we generally report, we discuss noncareer sEs m embers’ views to provide som e insights on their perceptions about the federal work environm ent. For this reason, we report their responses as representative only of the 242 noncareer SES m embers who responded to our 1991 survey.
Career SE% m embers’ responses to both surveys can be projected to the governm entwide universe of career SES m embers in 1989 and in 1991. Additionally, the career SES m embers’ responses to both surveys can be projected to the agencywide population of career SES m embers at the Environm ental P rotection Agency (EPA) and the departm ents of the Army, Com m erce, Energy, and the Interior. We also surveyed and report career 8~s m embers’ views at Education, Health and Hum an Services (HHS), and Housing and Urban Developm ent (HUD). However, the response rates at these departm ents were insufficient to allow us to project to the agencywide population of career SES m embers. Thus, respondents’ views at these three departm ents represent only the views of those responding to our survey. We selected the eight departm ents and agencies for separate analysis because of congressional interest and to ensure coverage of small and large as well as civil and defense organizations.
We did not verify whether the opinions of career SES m embers and noncareer SES respondents accurately reflected situations that existed in their organizations but accepted their views as perceptions of what they believed existed when they com pleted our surveys. Where governm entwide responses showed m ajor differences, we analyzed them further to see how som e views varied among career SES m embers at selected departm ents.
We com pleted our work in Septem ber 1991. We did our work in accordance with generally accepted governm ent auditing standards. A m ore detailed discussion of our objectives, scope, and m ethodology, including our sam ple sizes and response rates, is included in appendix IV.
Results 91% members’ responses to governmentwide surveys in 1989 and 1991 indicated that while most sxs members were satisfied with many aspects of their work environment, some responses raised concerns about the work environment of these executives. Career SES members and noncareer SES respondents had similar opinions about many aspects of their work environment. However, career sxs members viewed career executives and polittcal appointees differently.
Governmentwide, there were few significant differences in the views career 8~9 members had about their work environment in 1989 and in 1991. For example, in 1989 over 70 percent of the career SES members were very satisfied or satisfied with their duties, work challenges, coworkers’ respect, job security, and the opportunities they had to have an impact on public affairs. In 1991 more than 70 percent of the career SES members were also very satisfied or satisfied with these aspects of their work environment. The most striking change in perceptions since 1989 involved salary, While only 11 percent of the career SES members in 1989 were very satisfied or satisfied with their salaries, about 78 percent were very satisfied or satisfied with their salaries in 1991. This reflects SES members’ views before and after their substantial pay raise in January 1991.
Additionally, while there was a significant decrease of about 14 percent since 1989 in the number of career SES members who were dissatisfied with the public image of federal employees, many career SES members were still dissatisfied with the public image of federal employees in 1991. In 1989 about 86 percent of the career SES members were very dissatisfied or dissatisfied with the public image of federal employees. About 71 percent of the career SES members were very dissatisfied or d.isWisfied with this aspect of federal employment in 1991. The percentage of career SES members who were very satisfied or satisi!Ied with the public image of federal employees in 1989 increased from 6.6 percent to about 11 percent in 1991. About 36 percent of the noncareer SES respondents in 1991 indicated that they were very satisfied or satisfied with the public image of federal employees, and about 36 percent indicated that they were very dissatisfied or dissatisfied.
Career SES members and noncareer SES respondents in 1991 had similar views about many aspects of their work environment. For example, more career SES members and noncareer SES respondents wanted to have substantial influence on decisions made at the subunit level than those who believed they actually had substantial influence on subunit decisions. The decisionmaking areas included the allocation of funds, development
PIQc4 WWD-B2-B2SESSurvey
of new programs, division of labor, hiring of staff, and employee motivation and rewards.
Generally, few career SES members and noncareer SES respondents indicated that they had personal experience with abuses of the sxs system. For example, less than 10 percent of career SES members in 1989 and in 1991 indicated that they had any personal experience with either %helving,” forced resignations, artificial reductions-in-force to remove an SES member, or arbitrary demotions. J.AS than 8 percent of the noncareer SJB respondents indicated that they had any personal experience with these abuses of the sxs system.
In both surveys, career SES members had different perceptions about career executives and political appointees. Their views were more positive toward career executives in 1989 and 1991. To ilhrstrate the extent of differences in career SES members’ perceptions, about Q6 percent of the career SE8 members in 1989 believed that career executives made grant, contract, and loan decisions solely on the basis of merit while about 68 percent believed that political appointees did this, a difference of about 38 percent. In 1991, about 93 percent of career SES members governmentwide believed that this was true in most or all cases where career executives were concerned while 66 percent of these SE9 members believed that this was true in most or all cases for the political appointees-again, a 3&percent difference in the perceptions career SE8 members had about career executives and political appointees in this area
Further analysis of career SES members’ responses in 1991 showed that their difference in opinions about career executives and political appointees relevant to grant, contract, and loan decisions were greater than the 38percent governmentwide difference at some l
departments-Commerce (49 percent), Energy (about 44 percent), and HHS (about 43 percent). Although the governmentwide difference on this issue did not change significantly from 1989 to 1991, the extent of difference in the perceptions career SES members had at some departments did change. For example, the 62-percent difference at HUD in 1989 decreased by one-half to 26 percent in 1991. This indicated a major improvement in career SES members’ views toward the political appointees at HUD on this issue.
On this same issue, noncareer SES respondents in 1991 viewed career executives and political appointees similarly-about 86 percent of them believed that in most or all cases career executives made grant, contract,
Page5 WGGD-82428ESSnrvay
B-648618
and loan decisions solely on the basis of merit, and about 34 percent believed that political appointees did this,
Agency Comments and Our Evaluation
We provided OPM and representatives from the eight agencies we highlighted in this report with a draft of the report for their comments. 0pM provided us with written comments that s ummarixed their concerns as well as those of the agencies. (See app. VI.)
om said that a majority of the agencies expressed concern that the report was based on unverified views and opinlons. It said that while this fact is included on page 3 of our report, it would not be apparent in looking at other parts of the report. To help ensure that the reader understands that the information provided consists of perceptions and views of the respondents and that these have not been verified, we have added appropriate language to the introduction of each appendix that contains details of the survey responses.
om also had some reservations regarding specifk questions in our survey and the manner in which we characterized responses in the report text These are summarized below.
Supporting Merit Principles
OPM said that our question asking career executives whether noncareer executives “support and uphold merit principles regarding the hiring of personnel” is confusing, apparently because the question did not speci@ whether the decisions affected competitive or noncompetitive positions. OPM pointed out that political appointees often handle noncompetitive appointments and, therefore, are not bound by competitive hiring criteria. OPM said that since respondents did not have the option of a “no basis to judge” response, we ended up with a forced response to a vague question. OPM also pointed out that there is no empirical evidence that noncareer executives are violating merit principles when it comes to competitive mg.
OPM did not have a complete copy of our questionnaire and, therefore, did not know that respondents had the option of a “no basis to judge” response. In total, 19.6 percent of the careerists in 1991 said they did not have a basis to say whether political appointees supported merit principles. Thus, rather than forcing a response, respondents had and used this option. Further, we do not believe this question was confusing. In designing our questionnaire, we followed standard methodological
P-e 6 WGGD-SZ-66 SE8 Survey
b248618
practices, including pretesting the questionnaire with randomly selected sxs members. Among other things, the purpose of pretesting is to identify and correct vague questions or those that might be confusing. Results of the pretest questionnaire did not indicate confusion with this question. In regard to OPM’S comment concerning the absence of empirical data on violations of merit system principles, we clearly pointed out that we are reporting perceptions and opinions of the respondents, not empirical data.
Promotion Opportunities OPM also took issue with our question to SES executives about their level of satisfaction witi their opportunities for promotion. OPM said the question was faulty because it did not define promotion, which could mean several different things to SES respondents (Le., either greater responsibility or increased salary). It also said that the question may not have been relevant because most SES respondents were already at the top echelons of their careers.
We disagree with OPM. None of our pretests revealed a problem with what was meant by “promotion” in this question. While a promotion might mean more responsibility to one person and more money to another, each is perceived as an advancement to one’s career, which is what the question was intended to address. Further, OPM'S statement that the question may not have been relevant because most SES respondents were already at the top echelons of their careers is not necessarily correct. Of the career SES respondents to this question, about 33 percent were at SES levels 3,4, and 6. Only about 3 percent were at level 6, the top echelon. Thus, the vast msjority had potential for advancement. Of the noncsreer SES respondents, 82 percent were evenly distributed throughout levels 1 through 6, also having the potential for advancement. Only 18 percent of the noncareer SES respondents were at level 6.
Reporting Levels of Satisfaction for Certain Questions
OPM also questioned our description of the responses to the questions dealing with the level of satisfaction or dissatisfaction regarding promotion potential, job security, and health insurance benefits. We collapsed the responses into three categories-very satisfied or satisfied, neither satisfied nor dissatisfied, and very dissatisfied or dissatisfied. OPM pointed out that when the percentages of “satisfied” and “neither satisfied nor dissatisfied” are totaled, they account for the majority of respondents. With this in mind, OPM questioned our characterization of these three aspects of the work environment as negative factors and cited this as a weakness in our survey methodology.
Page7 WGGD-S253SESSurvey
B-248618
~eagreewitho~~th8ttheresponsestothesequestfo~ didnotindicate that a majority of respondents viewed them negatively. The manner in which we initially described the responses, however, has no relationship to the methodology of the survey. In our draft, we characterized the responses aa negative because more respondents reported negative perceptions in these areas than in several other areas. However, we agree with OPM that the draft could have been misleading, and we revised our report accordingly.
Public Release of Our Report
Flnally, OPM said that although our survey data may be helpful to agencies internally, its public release could harm the image of public service. For this reason and because of its concern about the validity of some of our questions and conclusions, OPM suggested that the report not be released. Rather, it suggested that the report be used by the requesting Subcommittee for follow-up questioning of administration officials.
we disagree with OPM for three reasons. First, career SES members reported favorable or improving perceptions in several areas, including positive attitudes toward public service. For example, over 00 percent of both career and noncareer respondents indicated that they were very satisfied or satis5ed with the duties they perform and the challenges of their work ss SES members. In addition, few career and noncareer executives said that they had personal experience with ‘shelving,” arbitrary demotions, forced resignations, or artificial reductions-in-force to remove an sxs member, which are considered abuses of the SES system. Second, while the data indicated some tension in the working relationship of career executives and political appointees, this is not new and should not come as a surprise. As pointed out on page 2, such tension has been recognized for some time, and we believe Congress and the administration need to know career SES members’ perceptions. Third, we believe our h methodology and questions are valid, and, as previously indicated, we modified our report where appropriate to address OPM and agency concerns about possible misinterpretations due to the way we characterized some of the responses in our draft of this report.
Detailed information on the results of our questionnaire analyses is presented in appendixes I, II, III, and V. As agreed with the Subcommittee, we plan no further distribution of this report until 30 days after its issue date, unless you publicly announce its contents earlier. At that time, we
will send copies to the departments and agencies that participated in this study and to other interested parties.
The m$ior contributors to this report are listed in appendix VII. If you have any questions about this report, please contact me on (202) 275-6074.
Sincerely yours,
Bernard L Ungar Director, Federal Human Resource
Management Issues
Pages WGGD-S2428E5Survey
Contents
Letter 1
Appendix I How Satisfied Were SES Members With
Positive Fkatures Issues That Raised Concerns More Want Substantial Influence in Some Areas of
16 17 18 19
Selected Factors Decisionmaking
Affecting Their Work Abuses of the SES System 21
Environment? Appendix II 23
How Did SES To What Extent Did SES Members Believe Career 24
Members View Career Executives and Political Appointees Make Grant, Contract, and Loan Decisions Solely on the Basis of Merit?
Executives and To What Extent Did SES Members Believe Career 28
Political Appointees? Executives and Political Appointees Support and Uphold Merit Principles When Hiring Personnel?
To What Extent Did SES Members Believe Career Executives and Political Appointees See Their Jobs as Opportunities to Make Positive, Long-Term Improvements?
To What Extent Did SES Members Believe the Actions of Career Executives and Political Appointees Were Motivated More by Self-Interest Than by Public Interest?
To What Extent Did SES Members Believe There Were Too Many Career Executives and Political Appointees?
31
36
38
Appendix III 42
How Did SES Noncareer SES Respondents Had Major Differences of 43 Opinion About Career Executive and Political Appointee 6
Members View the Supervisors in 11 of 18 Categories Leadership Behavior Supervisory ‘Baita Where Career SES Viewed Career 44
and Abilities of Career Executives and Political Appointees Similarly c areer SES Members Had Some Differences of Opinion 44 Executives and About Political Appointee and Career Executive
Pblitical Appointees? Supervisors Career SES Members’ Views Varied at Selected 46
Y Departments
Page 10 GMWGD-92.62 SE8 Survey
Appendix IV Objectives, Scope, and Methodology
64
Appendix V 68 Responses to 1989 Significant Differences 68
and 1991 Surveys of Collapsed Response Categories 68 I. Organizational Beliefs 69
SES Members’ Views II. Subunit and Department Mission 61 66 on the Federal Work III. Decision Making
ll? 0rganizaUona.l Culture 69 Environment V. Leadership 71
VI. Personnel Practices 79 VII. Future Plans 82 VIII. Satisfaction 84 IX. SES Objectives 87 X. Decision to Stay in or Leave the Federal Government 93 XI. Personal Characteristics 96
Appendix VI 103
Comments From the Office of Personnel Management Appendix VII 107
Major Contributors to This Report b
Tables Table 1.1: Work Environment Factors With Which Most SES Members Were Satisfied (1989 and 1991)
Table 1.2: Work Environment Factors With Which Fewer SES Members Were Satisfied (1989 and 1991)
Table 1.3: Percentage of SES Members Who Perceived and Preferred to Have Substantial Influence on SubunitAevel Decisionmaking (1991)
Page 11 GMMWD-Se-22 SE8 Survey
Table 1.4: Percentage of SES Members Who Perceived and Preferred to Have Some to LittIe or No Influence on Department+Level Decisionmaking (1991)
Table IV.l: Noncareer SES Universe Size, Responses, and Response Rates (199 1)
21
66
Table IV.2: Career SES Universe Size, Questionnaires Mailed, Responses, and Response Rates (1991)
Table IV.3: Career SES Universe Size, Questionnaires Mailed, Responses, and Response Rates (1939)
Table IV.4: Margins of Error Rates for the 1989 and 1991 SES Surveys
66
66
67
Figures Figure I. 1: Career SES Members’ Satisfaction With Their 1989 and 1991 Salaries
18
Figure II. 1: Percentage of SES Members Who Believed Career Executives and Political Appointees Governmentwide Made Grant, Contract, and Loan Decisions Solely on the Basis of Merit (1991)
F’igure II.2 Percentage of Career SES Members Who Believed Career Executives and Political Appointees at Selected Departments Made Grant, Contract, and Loan Decisions Solely on the Basis of Merit (1991)
F’igure II.3 Percentage of SES Members Who Believed Career Executives and Political Appointees Governmentwide Supported and Upheld Merit Principles When Hiring Personnel (1991)
24
26
28
Figure II.4 Percentage of Career SES Members Who Beiieved Career Executives and Political Appointees at Selected Departments Supported and Upheld Merit Principles When Hiring Personnel (1991)
Figure 11.6: Percentage of SES Members Who Believed Career Executives and Political Appointees Governmentwide Viewed Their Jobs as Opportunities to Make Positive, Long-Term Government Improvements WQl)
30
32 ’
Pigure II.6: Percentage of Career SES Members Who Believed Career Executives and Political Appointees at Selected Departments Viewed Their Jobs as Opportunities to Make Positive, bong-Term Government Improvements (1991)
33
Page 12 -D-S242 SES Survey
,, i ,.I 1 .
F’igure.II.7: Percentage of SES Members Who BeIieved the Actions of Career Executives and Political Appointees Governmentwide Were Motivated More by Self-Interest Than by Public Interest (199 1)
F’igure II.& Percentage of Career SES Members Who Believed the Actions of Career Executives and Political Appointees at Selected Departments Were Motivated More by Self-Interest Than by Public Interest (1991)
F’igure II.9: Percentage of SES Members Who Believed There Were Too Many Career Executives and PoIitical Appointees Governmentwide (1991)
F’igure II.10: Percentage of Career SES Member Who Believed There Were Too Many Career Executivea and Political Appointees in Selected Departments (1991)
F’igure III.1: Percentage of Career SES Members Who Believed Career Executive and Political Appointee Supervisors at Selected Departments Meet Employees’ Development Needs (199 1)
F’igure III.2: Percentage of Career SES Members Who Believed Career Executive and PoIithl Appointee Supervisors at Selected Departments Ensure That Employees Realize Their Potential (1991)
Figure III.3: Percentage of Career SES Members Who Believed Career Executive and Political Appointee Supervisors at Selected Departments Keep Employees Informed About Subunit Activities (1991)
F’igure I11.4: Percentage of Career SES Members Who Believed Career Executive and Political Appointee Supervisors at Selected Departments Share Their Experience and Training (1991)
F’igure III.& Percentage of Career SES Members Who Believed Career Executive and Political Appointee Supervisors at Selected Departments Provide Needed Technical Knowledge (1991)
F’igure III.6 Percentage of Career SES Members Who Believed Career Executive and Political Appointee Supervisors at Selected Departments Provide Sound Job-Related Advice (1991)
36
37
38
40
46
47
49
60
I, 62
63
Page 18 QAIUQOD-OS-68 SES Survey
, .
Coateat
Abbreviations
DOD DOT EPA HHS HUD NASA OPM SES VA
Page 14
Department of Defense Department of Transportation Environmental Protection Agency Department of Health and Human Services Department of Housing and Urban Development National Aeronautics and Space Administration Office of Personnel Management Senior Executive Service Department of Veterans Affairs
WGGD-92-62 SE8 Survey
t&UNGGD-92-62 SE8 Survey
Appendix I
How Satisfied Were SES Members With Selected Factors Affecting Their Work Environment?
Among the many issues addressed in our surveys, we asked respondents to (1) indicate the extent to which they were satisfied or dissatisfied with their position as a Senior Executive Service (SES) member and as a federal employee in general, (2) rate the amount of influence they perceived they had and preferred to have on decisionmaldng at the subunit and department levels, and (3) indicate whether they had personal experience with possible abuses of the SES system. See appendix V, questions 22,7, and 16, respectively, for SES members’ responses about these aspects of their environment.
Survey results reported reflect the opinions of the universe of career SES members. on the other hand, results reported for noncareer SES respondents only apply to those 242 noncareer SES members who responded to our survey in 199L1 Also, we did not determine if the opinions of career SES members and noncareer 9~8 respondents accurately reflected situations that existed at their departments but reported their views and perceptions about issues addressed in the surveys.
Most career SES members and noncareer SES respondents in 1991 seemed generally satisfied with their salaries, duties, opportunities to have an impact on public affairs, and the challenges of their position in the SES. For example, more than 90 percent of the career SES members in 1989 and 1991 were satisfied or very satisfied with their duties and the challenges of their work. About 95 percent of the noncareer SES respondents in 1991 were also very satisfied or satisfied with their duties, and slightly more than 92 percent were very satisfied or satisfied with the challenges of their work. AIso, career SES members and noncareer SES respondents indicated that they were very satisfied or satisfied with the respect they received from coworkers, opportunities to have an impact on public affairs, and opportunities to improve themselves. In addition, in general, few career SES members and noncareer SES respondents indicated that they had b personal experience with abuses of the SES system, such as “shelving,” forced resignations, artificial reductions-in-force to remove SES members, or arbitrary demotions.
Respondent perceptions raised concerns about some aspects of serving in an SES position and federal employment in general. For example, while there was a 14-percent decrease from 1989 to 1991 in the number of career SES members who were very dissatisfied or dissatisfied with the public’s image of federal employees, slightly more than 71 percent were stib very
‘Noncareer SES reapondenta accounted for only 2.7 percent of the total SFA members who responded to our 1980 amvey. As a result, there were too few noncareer SES respondents for ue to determine how they felt about issues addressed in our lOB0 survey.
Page 16 WWD-92-M SE8 Survey
Appspldlr: 1 How lhtidld were SE8 Membera wltk Se&tad Faetora Afteetlq Tldr Work Eavlroameat?
dissa&&ed or dissatis5ed with this aspect of federal employment in 1991. Other areas that raised concerns included health benefits, public recognition, and opportunities for promotion.
Another area of concern involved SES members’ perceived and preferred influence on decisionmaking at the subunit and department levels. Career SES members and noncareer SES respondents preferred to have more influence on subunit decisionmaking than they had on these decisions in 1991. Most career SES members and noncareer SES respondents believed that they had little or no influence on department-level decisionmaking, and many preferred to have little or no influence on these decisions.
L Positive Features To address how satis5ed SES members were with their position in the SES
and with federal employment in general, we listed a number of factors related to the work environment and asked respondents to indicate if they were very satis5ed, satisfied, neither satisfled nor dissatisfied, dissatisfied, or very dlssatis5ed with these factors. (See app. V, question 22.)
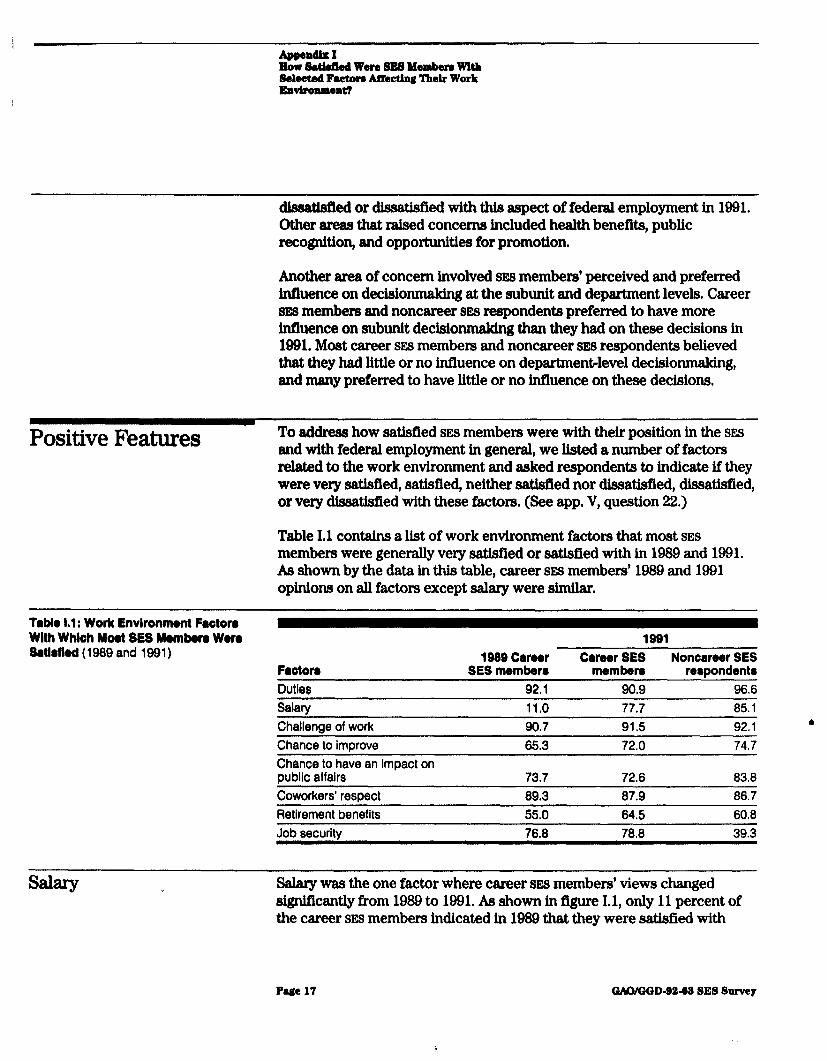
Table 1.1 contains a list of work environment factors that most SES members were generally very satis5ed or satisfied with in 1989 and 1991. As shown by the data in this table, career SES members’ 1989 and 1991 opintons on all factors except salary were similar.
TebIe 1.1: Work Envltonment Fwtoto With Whloh Most SES Mombwo Woto Sstlsfled (1989 and 1991)
1991 1989 Career Career SES Noncareer SES
SES member@ membera respondents Factor. Duties 92.1 90.9 96.6 Salary 11.0 77.7 85.1 Challenge of work 90.7 91.5 92.1 b
Chance to imorove 65.3 72.0 74.7 Chance to have an impact on public affairs Coworkers’ respect
73.7 72.6 83.8 89.3 87.9 86.7
Retirement benefits 55.0 64.5 60,8 Job securitv 76.8 78.8 39.3
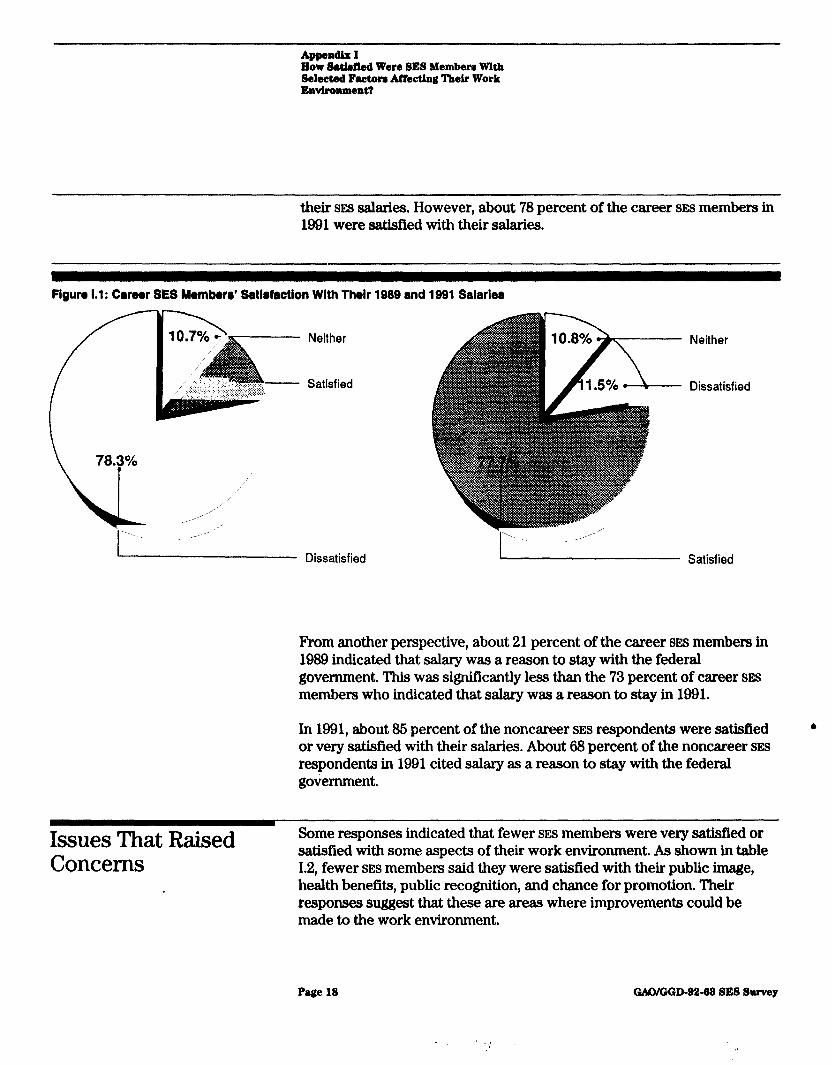
Salary was the one factor where career SES members’ views changed significantly from 1989 to 1991. As shown in figure 1.1, only 11 percent of the career SE9 members indicated in 1989 that they were satisfied with
PagQ 17 GAM3i3D-B2-02 SE8 Survey
How SatisfIcd Were SE8 Membera with Selected Faetwa M&in2 ‘I%& Work EllVi?OMl~Bt7
their SES saIaries. However, about 78 percent of the career SES members in 1991 were satisfied with their salaries.
Figuto 1.1: Camt SES Momban Satlrfactlon With Tholt 1989 and 1991 Salaries
Neither
Satisfied
Neither
Dissatisfied
Dissatisfied Satisfied
From another perspective, about 21 percent of the career 8~s members in 1989 indicated that salary was a reason to stay with the federal government, This was significantly less than the 73 percent of career sEs members who indicated that salary was a reason to stay in 1991.
In 1991, about 86 percent of the noncareer SES respondents were satisfied or very satisfied with their salaries. About 68 percent of the noncareer SES respondents in 1991 cited sdlary as a reason to stay with the federal government.
.
Issues That Raised Concerns
Y
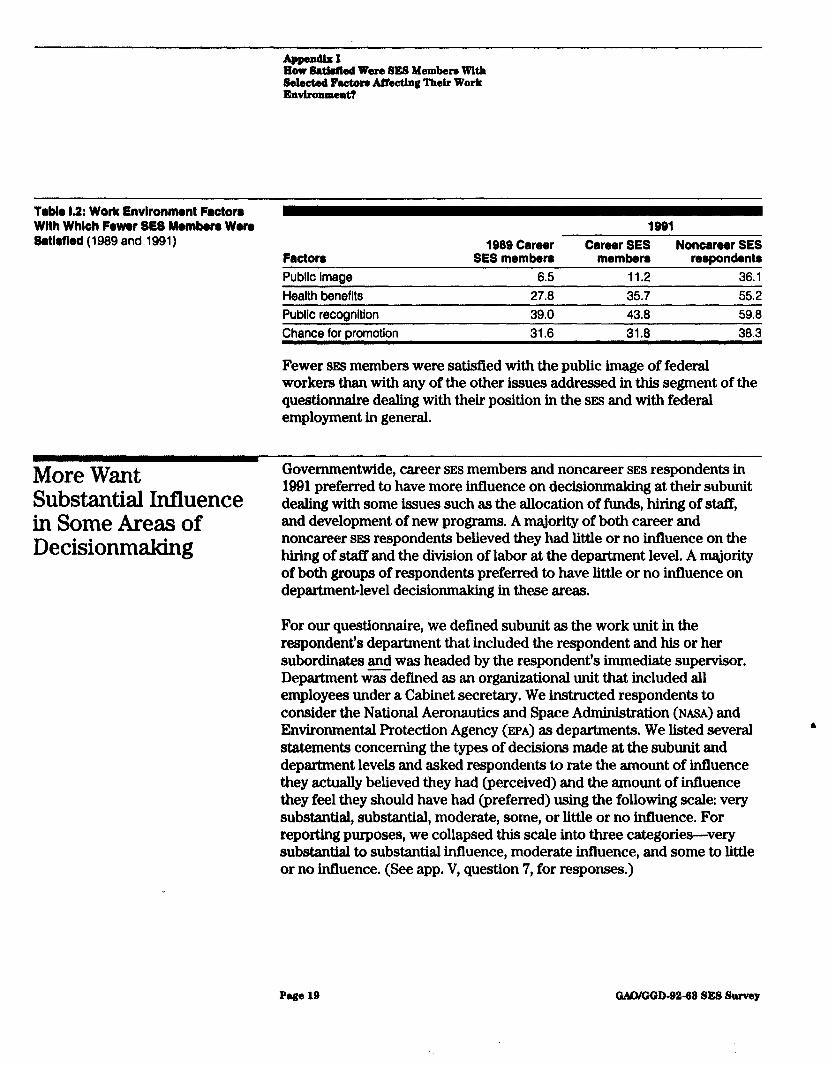
Some responses indicated that fewer SES members were very satisfied or satisfied with some aspects of their work environment. As shown in table 1.2, fewer SES members said they were satisfied with their public image, health benefits, public recognition, and chance for promotion. Their responses suggest that these are areas where improvements could be made to the work environment.
Page 18 GAO/GGD-92-62 SE8 Survey
How&tldledWeraSESMsmberrWi~ Belect8d Factmu Mectlng Their Work EIIVhlUUtmtT
Tabk 1.2: Work Envlronmont Factor8 Wlth Whloh Fewer SES Membera Wara SatlMed (1989 and 1991)
Facton Public Image Health benefits
1989 Career SES members
6.5 27.6
1991 Caraer SES Noncarear SES
membera respondent8 11.2 36.1 35.7 55.2
Public recognition 39.0 43.0 59.8 Chance for promotion 31.6 31.8 38.3
Fewer 9~9 members were satisfied with the public image of federal workers thsn with any of the other issues addressed in this segment of the questionnaire dealing with their position in the SES and with federal employment in general.
More Want Governmentwide, career SES members and noncareer SES respondents in
Substantial Influence 1991 preferred to have more influence on decisionmaking at their subunit dealing with some issues such as the allocation of funds, hiring of staff,
in Some Areas of and development of new programs. A majority of both career and
Decisionmaking noncareer SES respondents believed they had little or no influence on the hiring of staff and the division of labor at the department level. A majority of both groups of respondents preferred to have little or no influence on departmentclevel decisionmaking in these areas.
For our questionnaire, we defined subunit as the work unit in the respondent’s department that included the respondent and his or her subordinates and was headed by the respondent’s immediate supervisor. Department wxdefmed as an organizational unit that included all employees under a Cabinet secretary. We instructed respondents to consider the National Aeronautics and Space Administration (NASA) and Environmental Protection Agency (EPA) as departments. We listed several statements concerning the types of decisions made at the subunit and department levels and asked respondents to rate the amount of influence they actually believed they had (perceived) and the amount of influence they feel they should have had (preferred) using the following scale: very substantial, substantial, moderate, some, or little or no influence. For reporting purposes, we collapsed this scale into three categories-very substantial to substantial influence, moderate influence, and some to little or no influence. (See app. V, question 7, for responses.)
Page19 GAWGGD-92-92SESSuwey
How satwled were 538 Ml?mbeN wltb Selectad Factore Mectlng Tbek Work 2mlroxIment?
Subunit-Level Decisionmaking
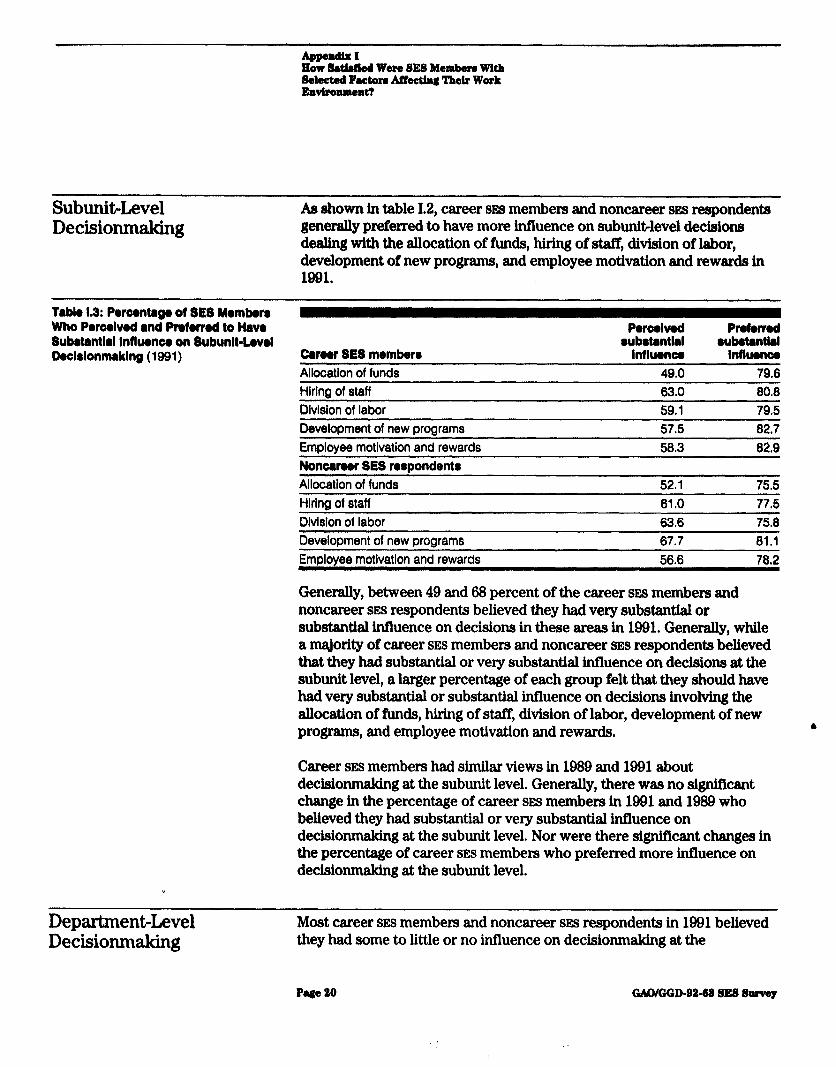
As shown in table 1.2, career SES members and noncareer 8~8 respondents generally preferred to have more influence on subunit+level decisions dealing with the allocation of funds, hiring of staff, division of labor, development of new programs, and employee motivation and rewards in 1991.
Tablo 1.3: Porcantrgo of 8813 Member8 Who Porwlvod and ProMrod to Have Subrkntlrl Influence on (Lubunit-Level Dacirlonmaklng (1991) Caroor SES memberr
Allocation of funds Hiring of staff Division of labor
Porcolvod PrOf0V.d rubrtantlrl l ubotantlrl
Influonw lnflwnco 49.0 79.6 63.0 80.8 59.1 79.5
Development of new programs Employee motivation and rewards Noncaroer SES reruondentr Allocation of funds Hiring of staff Division of labor
57.5 82.7 58.3 82.9
52.1 75,5 61.0 77.5 63.6 75.8
Development of new programs 67.7 81.1 Employee motivation and rewards 56.6 78.2
Generally, between 49 and 68 percent of the career SES members and noncareer SES respondents believed they had very substantial or substantial influence on decisions in these areas in 1991. Generally, while a majority of career SES members and noncareer SES respondents believed that they had substantial or very substantial influence on decisions at the subunit level, a larger percentage of each group felt that they should have had very substantial or substantial influence on decisions involving the allocation of funds, hiring of staff, division of labor, development of new programs, and employee motivation and rewards. L
Career SES members had similar views in 1969 and 1991 about decisionmaldng at the subunit level. Generally, there was no significant change in the percentage of career SES members in 1991 and 1989 who believed they had substa.ntiaI or very substantial influence on decisionmaking at the subunit level. Nor were there significant changes in the percentage of career SES members who preferred more influence on decisionmaking at the subunit level.
Department-Level Most career SES members and noncareer SES respondents in 1991 believed Decisionmaking they had some to little or no influence on decisionmaking at the
Page 20 GMVGGD-92-62 SE8 Survey
Row sawted were SES Membert with lb&tad Fattort Mettlng Tktk Work Ewlronment?
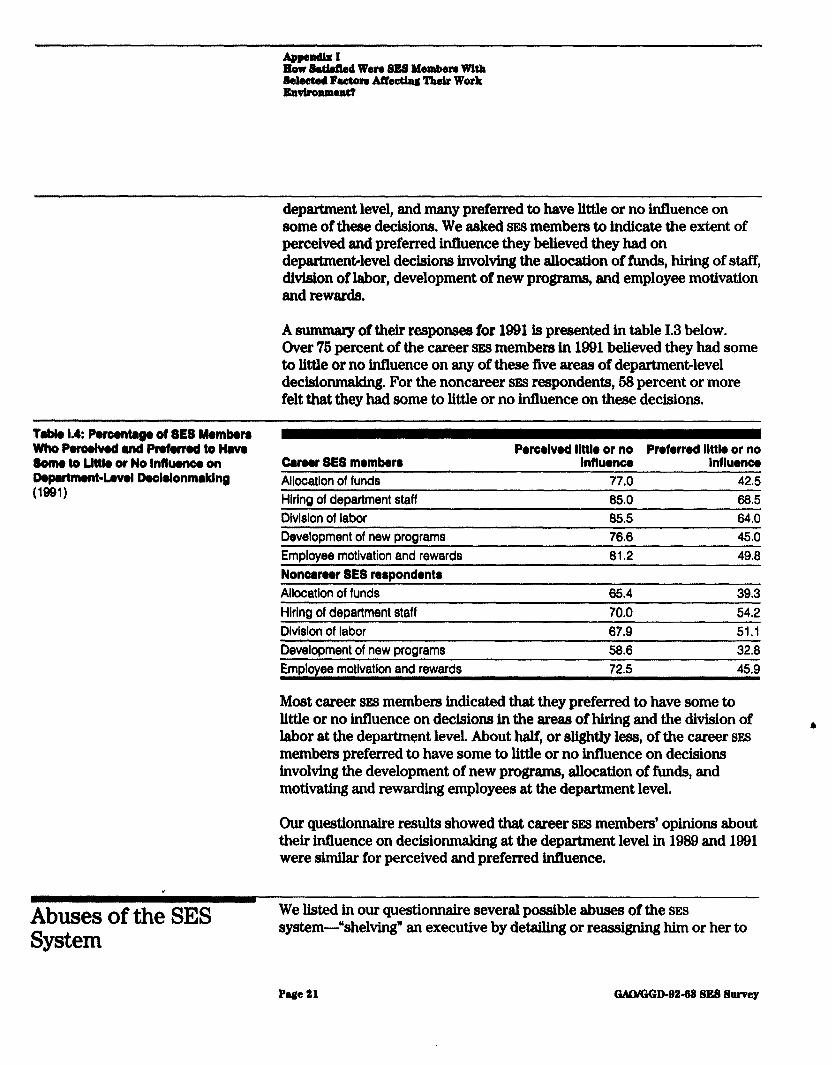
department level, and many preferred to have little or no influence on some of these decisions. We asked SEEJ members to indicate the extent of perceived and preferred influence they believed they had on departmenHeve1 decisions involving the allocation of funds, hiring of staff, division of labor, development of new programs, and employee motivation and rewards.
A summary of their responses for 1991 is presented in table I.3 below. Over 76 percent of the career SES members in 1991 believed they had some to little or no influence on any of these five areas of departmentlevel decisionmaking. For the noncareer SES respondents, 63 percent or more felt that they had some to little or no influence on these decisions.
Teble 1.4: Pwwntago of SE8 Mombon who Poroolvod and Protorrod to Have SomotoLlttloorNoInflwnooon Dopartmont-Lovol Dwldonmrklng WV
Wow SES memborr Allocation of funds Hirina of department staff
Perodvod Ilttlo or no Proforrod Ilttlo or no Influence Inflwnca
77.0 42.5 85.0 68.5
Division of labor 85.5 84.0 Development of new programs 78.8 45.0 Employee motivation and rewards 81.2 49.8 Noncamr SES MDOndOnt8 Allocation of funds Hiring of department staff
85.4 39.3 70.0 5402
Division of labor 87.9 51:1 Development of new programs 58.8 32.8 Emplovee motivation and rewards 72.5 45.9
Most career SES members indicated that they preferred to have some to little or no influence on decisions in the areas of hiring and the division of labor at the department level. About half, or slightly less, of the career sss members preferred to have some to little or no infiuence on decisions involving the development of new programs, allocation of funds, and motivating and rewarding employees at the department level.
Our questionnaire results showed that career 8~s members’ opinions about their influence on decisionmaking at the department level in 1939 and 1991 were similar for perceived and preferred influence.
I
AbusesoftheSES System
We listed in our questionnaire several possible abuses of the SES system-U shelving” an executive by delaillng or reassigning him or her to
Ptgt 21 -D-B242 SE8 Survty
How&Wed Were SES MtmbtrtWith Stltcttd Factore Affecting Thek Work Environment?
duties not of an SES nature, trying to force an SES executive to resign, arbitrarily lowering an SES executive’s performance rating, artificially structuring a reduction-in-force to remove a specitlc SES executive, and arbitrarily demoting a career sxs executive. For each of these abuses, we asked respondents to indicate the extent to which they had some personal experience with the practices. (See app. V, question 16.)
Generally, few career SES members and noncareer SES respondents indicated that they had personal experience with abuses of the sxs system. In 1991, about 20 percent of the career SES members and about 6 percent of the noncareer SES respondents indicated that they had personal experience with the arbitrary lowering of an sxs executive’s performance rating. Less than 10 percent of the career sxs members in 1991 indicated that they had personally experienced “shelving,” forced resignations, artificial reductions-in-force to remove an SE% member, or arbitrary demotions. Less than 8 percent of the noncareer SES respondents indicated that they had personally experienced these abuses.
Lowering Ratings Arbitrarily
Of the five abuses addressed in our questionnaire, the arbitrary lowering of ratings was the most frequently cited abuse that career SES members in 1991 and 1989 indicated they had personally experienced. About 20 percent of the career SES members in 1991 indicated that they had personal experience with the practice of arbitrarily lowering an SES member’s rating. More than half of this 20 percent, about 13 percent of these executives, believed that this had happened to them once; the remaining 7 percent believed it had happened to them more than once. Career SES members’ responses in 1989 and 1991 were similar-23 percent indicated in 1989 that they had personal experience with the lowering of ratings.
Slightly less than 6 percent of the noncareer SES respondents in 1991 b indicated that they had personal experience with the arbitrary lowering of an SES member’s performance rating.
Page22 WGGD-92.62SESSurvey
How Did SES Members View Career Executives and Political Appointees?
We asked career and noncareer SES members if they believed career executives and political appointees (1) made decisions about grants, contracts, loans, and loan guarantees solely on the basis of merit; (2) supported and upheld merit principles when hiring personnel; (3) viewed their jobs as opportunities to make positive, long-term government improvements; and (4) had more self-interest than public interest as reasons for their actions. We also asked career and noncareer SES members if they believed there were too many career executives or political appointees in their departments. The purpose of these questions was to determine how these SES members viewed career executives and political appointees. Survey results reflect the opinions of the universe of career SES members. Noncareer SES respondents’ views represent only those of the noncareer SES members who responded to our survey. It should also be noted that we did not verify whether the views of career SES members and noncareer SES respondents accurately reflected the situations that existed at their departments.
The 1991 responses of noncareer SES respondents indicated that they had similar views about career executives and political appointees1 For example, about 84.6 percent of the noncareer SES respondents believed that career executives made contract, grant, and loan decisions solely on the basis of merit, and 84.1 percent believed that this was true in most or all cases for political appointees. However, noncareer SES respondents governmentwide were more positive toward political appointees in some instances, For example, about 77 percent of the noncareer SES respondents believed that in most or all cases career executives viewed their jobs as opportunities to make positive, long-term government improvements while about 86 percent of these respondents believed that this was true in most or all cases for political appointees.
Responses to the 1989 and 1991 surveys showed that career SES members’ b perceptions were less positive about political appointees than they were about career executives on these issues. In addition, career SES members’ perceptions varied about career executives and political appointees at the eight selected departments and agencies-Army, Commerce, Energy, Health and Human Services (HHS), Housing and Urban Development (HUD), Interior, and EPA. There were not enough noncareer SES members responding from specific departments and agencies in 1991 for us to determine how noncareer SES respondents at the selected departments and agencies may have felt.
‘Noncareer SES respondenti accounted for only 2.7 percent of the total SES membera who responded to our 1989 survey. As a result, there were too few noncareer SES respondents for us to determine how they felt about issues addressed in our 1989 survey.
Ptgt 22 GAOIGGD-92-62 SE8 Survey
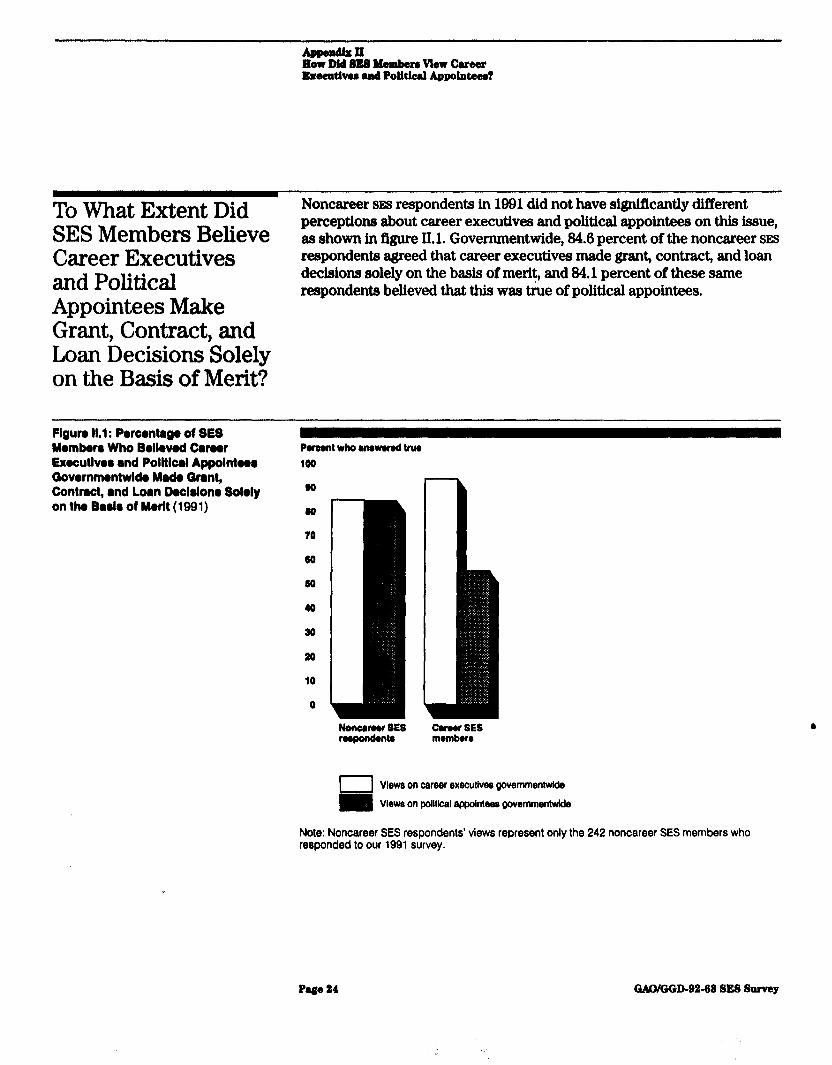
To What Extent Did Noncareer SET respondents in 1991 did not have signifkantly different
SES Members Believe perceptions about career executives and political appointees on MEI issue, as shown in figure ILL Governmentwide, 84.6 percent of the noncareer SES
Career Executives respondents agreed that career executives made grant, contract, and loan
and Political decisions solely on the basis of merit, and 84.1 percent of these same
Appointees Make respondents believed that this was true of political appointees.
Grant, Contract, and Loan Decisions Solely on the Basis of Merit?
Figure 11.1: Poroonkgo of SES Member8 Who Sollewd CImr Pomentwhornwmdtrw Exmcutlvar and Polltlocrl Appolntnr 100 Oovornmontwlde Mad0 Grant, Contract, and Loan Doclalona Solely 90 on the Bad8 of Mwlt (1091) 80
70
00
00
40
so
20
10
0
Nonormr SE8 career 8E8 mpondonts momborr
hiii Views on career executives govemmentwldo Views on polltksl eppdntees ~vemmentwlde
Note: Noncareer SES respondents’ views represent only the 242 noncareer SES members who responded to our 1991 survey.
Page24 WGGD-92-62SESSurvey
-n HowDtdmsMembeluvtewcueu &eeuttvoa 8md Pomlcul Appolmaa?
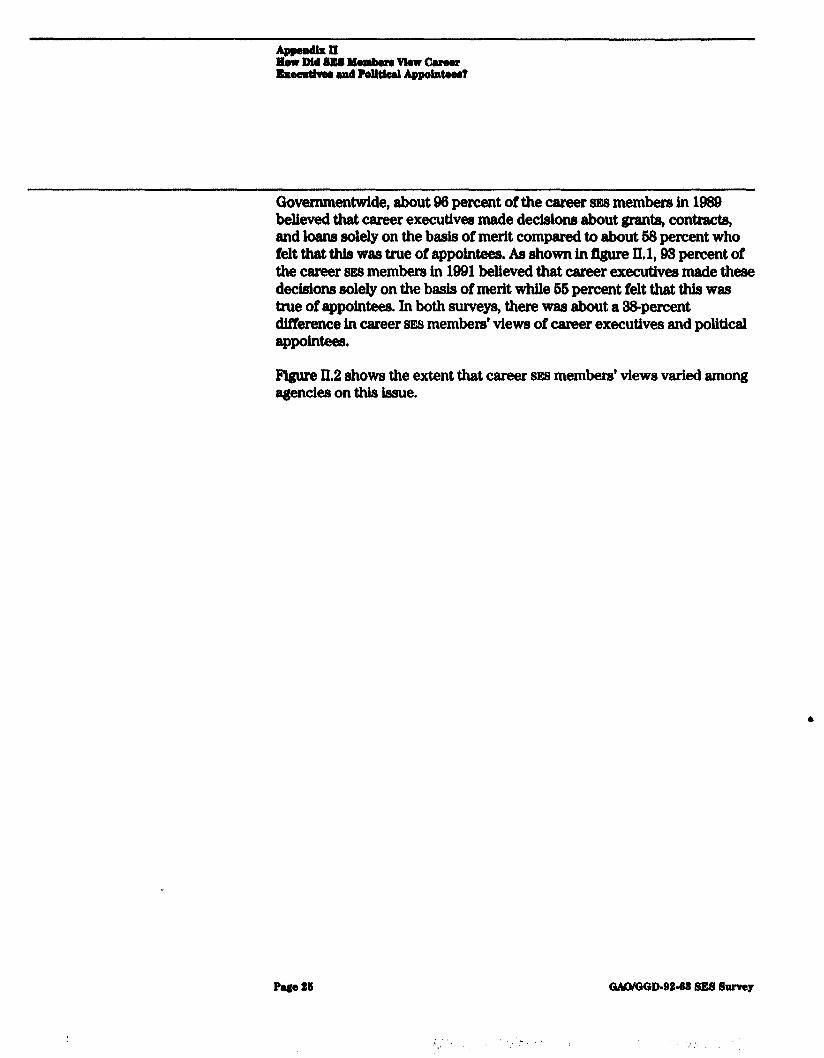
Governmentwide, about 96 percent of the career 8~8 members in 1089 believed that career executivea made decisions about grants, contracta, and loans solely on the basis of merit compared to about 58 percent who felt that this was true of appointees. Aa shown in figure El, 03 percent of the career 8~8 members in 1991 believed that -r executives made these decisions solely on the basis of merit while 66 percent felt that this was true of appointees. In both surveys, there was about a 33-percent difference in career as member’ views of career executives and political ryppo~-.
Flgure II.2 shows the extent that career sE8 members’ views varied among agencies on this issue.
Pegs 22
‘.) ‘,/,>, .,
GMVGGD-9242 SES Survey
‘J’
How Did SES Membarr View Cuaer Hxeculivw and PolItical Appointear?
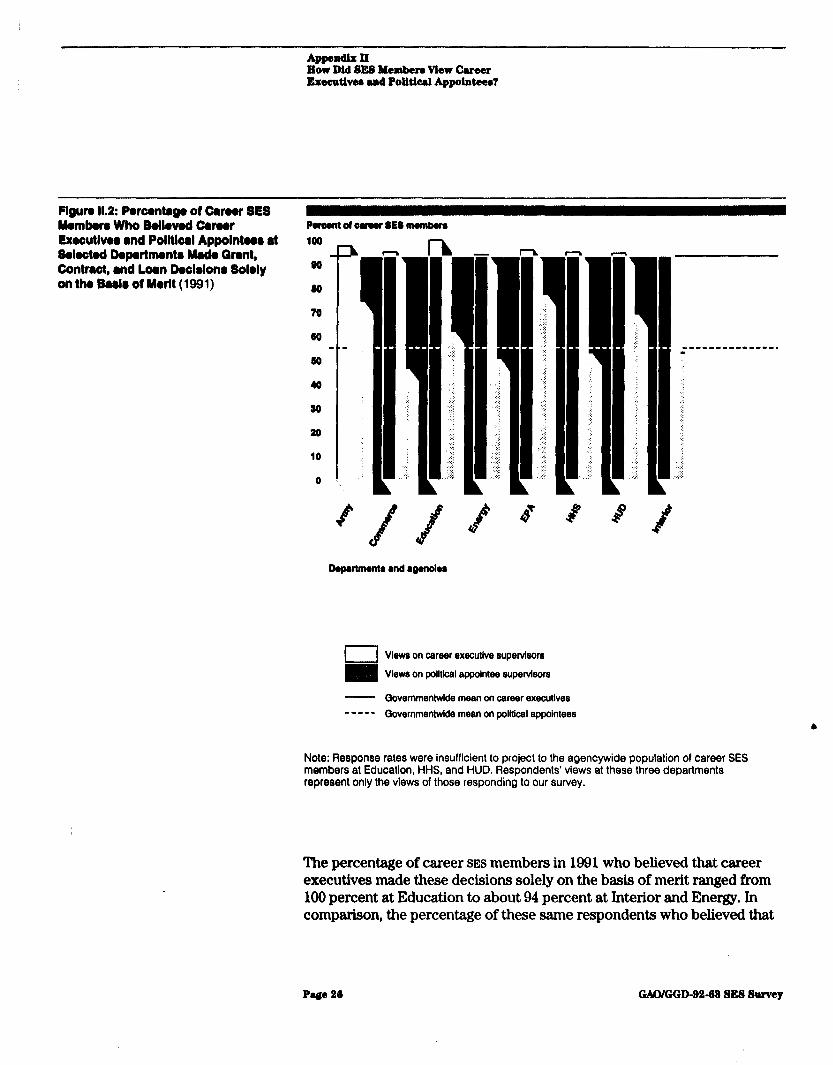
Plgura 11.2: Pmontqo of Camor SE8 Mmbofo Who Bollwod Camr -Of-~E8llWlIkn Exooutlver and Polltlcal Appointoar at (kImted Dopwtmont~ D&da Grant, Contra& and Loan De&km Solely on th8 SW8 of Merlt (1991)
Dapartmente end rgenclee
I View on career executive supervlsom
m Vlew on potitkal appointee wpervieom
- QovemmentwMe mean on career executives - - - - - Qovernmentwlde mean on political appointees
Note: Response rates were insufficient to project to the agencywide population of career SES members at Education, HHS, and HUD. Respondents’ views at these three departments represent only the views of those responding to our survey.
The percentage of career SES members in 1991 who believed that career executives made these decisions solely on the basis of merit ranged from 100 percent at Education to about 94 percent at Interior and Energy. In comparison, the percentage of these same respondents who believed that
Page 28 GMKGD-82-62 SE8 Survey
How Dtd BEa Momberm View Career Executivam ad Polttht Appointeem?
this was true of political appointees ranged from 77 percent at EPA to 46 percent at Commerce.
Governmentwide, 66 percent of the career SES members surveyed in 1991 believed that political appointees made these decisions solely on the basis of merit. Compared to this mean response, four departments were below this level-Commerce (46 percent) Energy (66 percent), Interior (about 63 percent), and HHS (about 62 percent). The other four agencies exceeded this governmentwide mean--EPA with 77 percent, Army with about 74 percent, HUD with about 69 percent, and Education with about 61 percent. Three of the departments also exceeded the governmentwide mean in 1039 and M l-Army, EPA, and Education.
In 1991, there was a governmentwide difference of about 33 percent between the percentage of career SET members who believed that career executives made grant, contract, and loan decisions solely on the basis of merit and the percentage of those who believed that this was true of political appointees. The differences at Commerce (40 percent), Energy (about 44 percent), and HHS (about 43 percent) exceeded this difference. The differences at EPA (about 10 percent), Army (about 24 percent) and HUD (26 percent) were considerably smaller than the governmentwide ditference of nearly 38 percent. The differences at Education (about 39 percent) and Interior (41 percent) were similar to the governmentwide difference of about 33 percent.
While the governmentwide difference on this issue did not change from 1039 to 1991, there were some changes at the departments. HUD and HHS had the largest increase in the percentage of career SE9 members who believed political appointees made grant, contract, and loan decisions solely on the basis of merit. In 1089, about 31 percent of the career respondents at HUD believed this was true of political appointees compared to about 69 percent who felt this way in 1991 about appointees at HUD. ‘I’he 1989 governmentwide difference of about 62 percent at HIJD in 1939 decreased to about 26 percent in 1991 due to a major increase of about 37 percent in the number of career SES members who believed that this was true of political appointees. The percentage of career sss respondents who believed that this was true of political appointees at HHS also increased--from about 41 percent in 1989 to about 62 percent in 1991.
P&ge27 GMAMiGD-9242SESSwvey
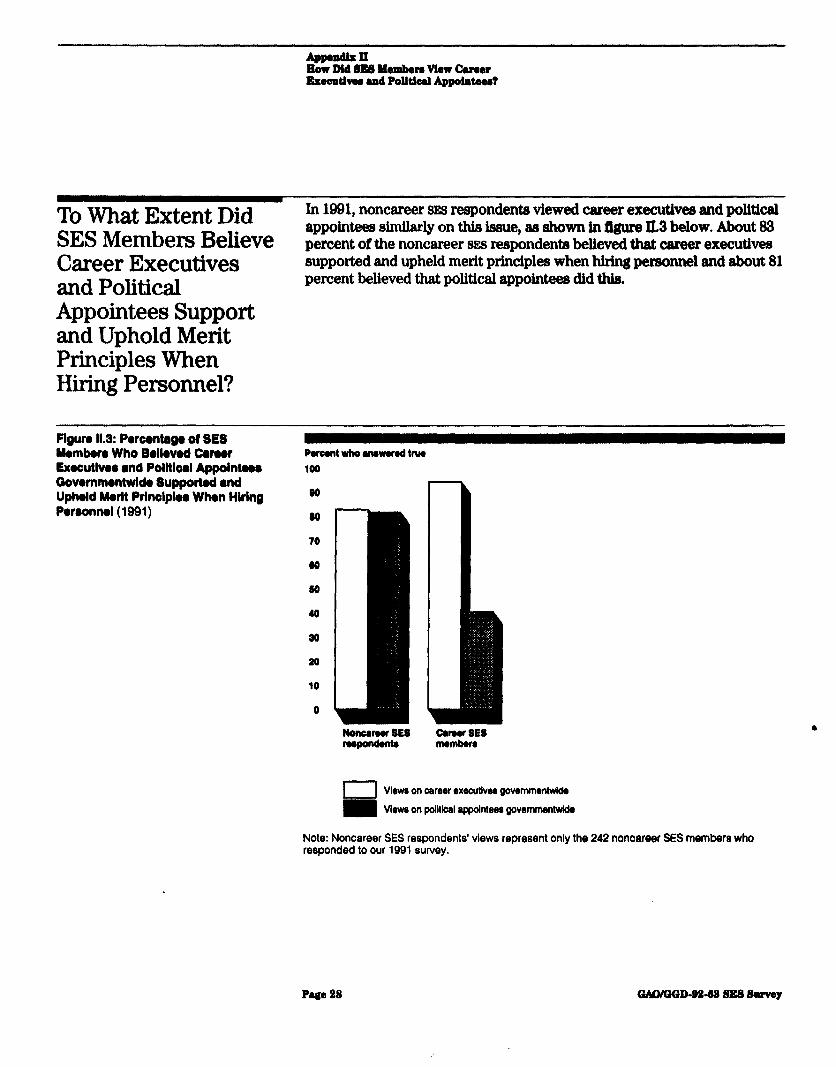
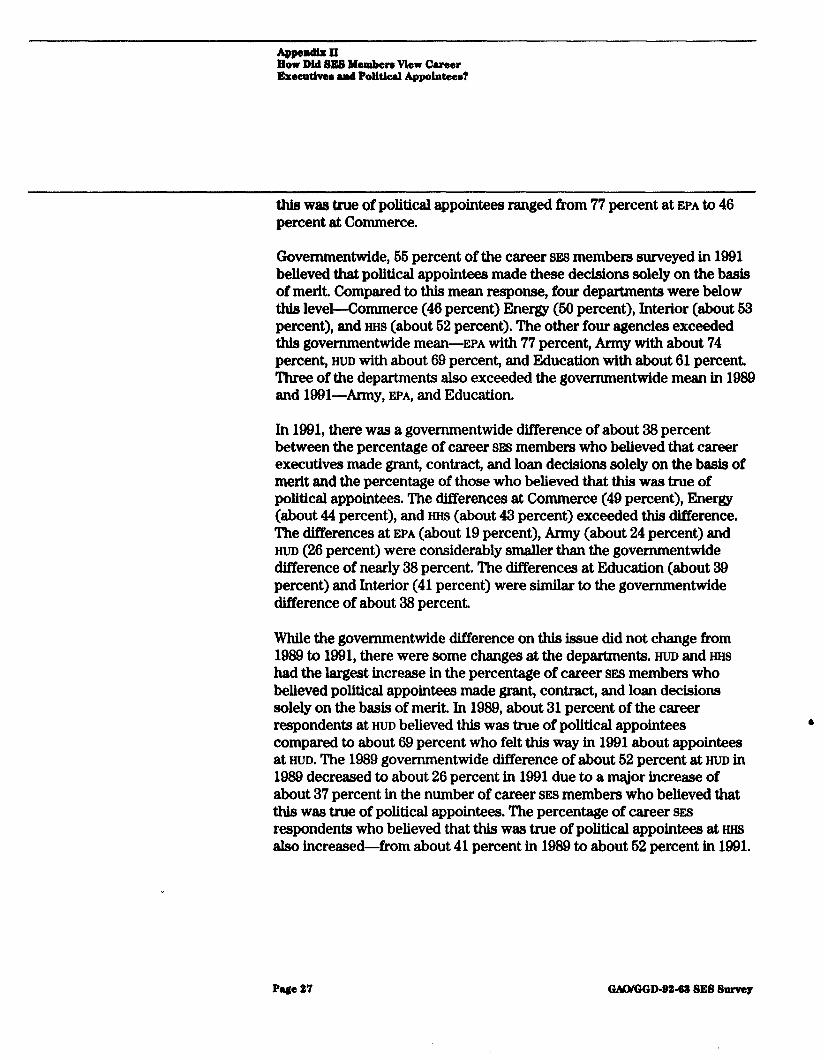
To What Extent Did In 1901, noncareer SES respondents viewed career executi~ and political
SES Members Believe appointees similarly on this issue, as shown in figure II.3 below. About 83 percent of the noncareer SES respondents believed that career executives
Career Executives and Political Appointees Support and Uphold Merit Principles When Hiring Personnel?
supported and upheld merit principles when hiring personnel and about 81 percent believed that poUtical appointees did this.
flgun 11.3: Porcontago of SE8 Momborr Who Bollovod Camr Executlvonr and Polltloal AppoInta Oovemmontwlda Supported and Upheld Mwlt Prlnolphr When Hlrlng
Pumlt who l newered true 100
00 Por@onnol(1Qo1) 00
70
00
60
40
30
20
10
0
Moocareer SE8 Career SES members
hid
Vlewa on csreer exscutivss ~ovemmsntwkb
Views on poiltkal appolnteer govemmentwldr
Note: Noncareer SES respondents’ views represent only the 242 noncareer SES members who responded to our 1991 survey.
m-n How Did BBS mlnben view Career Es84?tldv8a end Polttkd Appoint8am?
Governmentwide in 1989, about 94 percent of the career SES members surveyed believed that career executives supported and upheld merit principles when hiring personnel while 44 percent felt that this was true of political appointees. Career SES members’ views on this issue did not change in 1991. As shown in figure II.3, about 94 percent of the career SES members in 1991 continued to believe that career executives upheld merit principlea when hiring while slightly more than 40 percent believed that this was true of political appointees.
The data showed that the greatest governmentwide Merence in career SES members’ views about career executives and political appointees in 1991 involved the issue of upholding merit system principles when hiring. There was a governmentwide difference of about 64 percent in the percentage of career SES members who believed that this was true of career executives and political appointees.
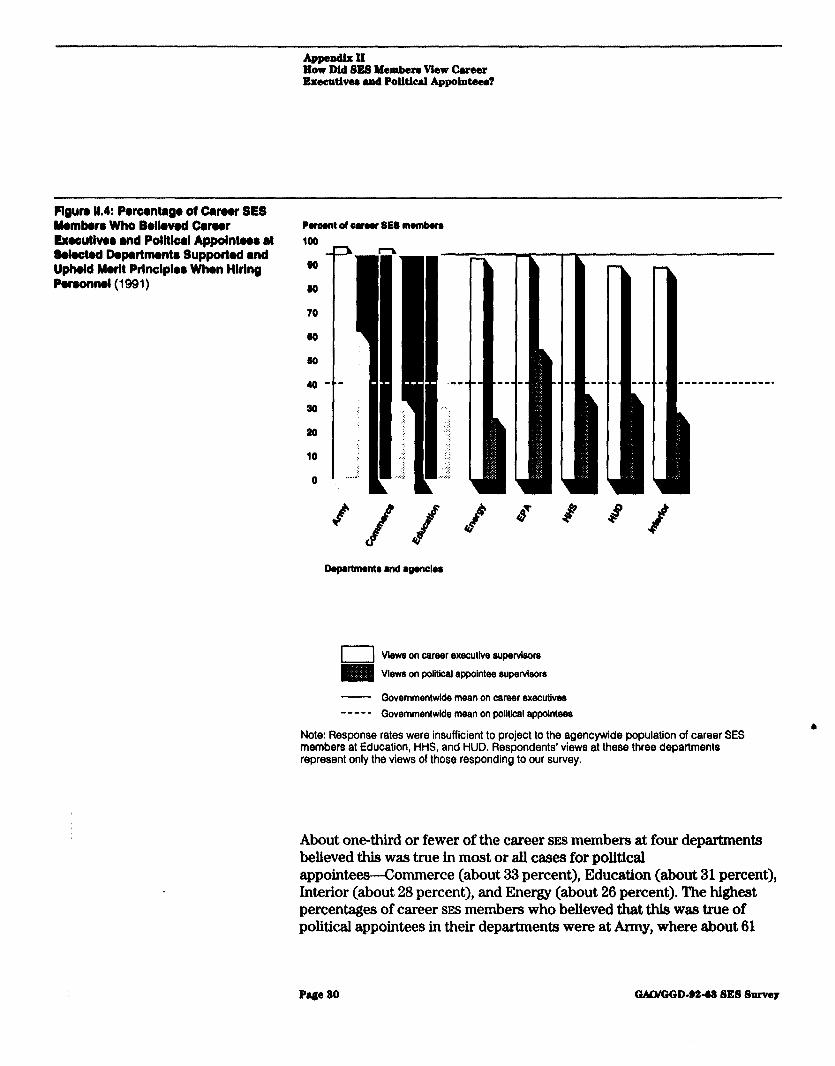
In 1991, over QO percent of the career SES members believed that career executives at each of the eight selected departments supported and upheld merit principles when hiring personnel, except at HUD and Interior, where about 89 percent believed so. Considerably fewer of these respondents believed that political appointees supported and upheld merit principles when hiring personnel, as shown in figure 11.4.
Pag8ZS -D-9Z48SESSurvay
How Did SE8 Member View Cheer Hxecutlver and Politic.al Appointees?
Rgun 11.4: Porwntago of Carwr SES Member. Who Bolkvod Carwr Puaont ol oernr SES mombero Exwutlvw and Polltlwl Appolntwo at 100 Sdwted Departmonto Supported and Upheld Morlt Prlnclplw When Hlrlng
so -
Porwnnol(1!391) so
70
w
So
40’
20
20
10
0 6 . . Dopartmont~ and l gmclw
Views on career executive supervIsor
View8 on poritkal appointee supervison
- Governmentwide mean on career executives - - - - - Qovemmentwlde mean on polItical appointees
6 Note: Response rates were insufficient to project to the agencywide population of career SES members at Education, HHS, and HUD. Respondents’ views at these three departments represent only the views of those responding to our survey.
About one-third or fewer of the career SES members at four departments believed this was true in most or all cases for political appointees-Commerce (about 33 percent), Education (about 31 percent), Interior (about 28 percent), and Energy (about 26 percent). The highest percentages of career SES members who believed that this was true of political appointees in their departments were at Army, where about 61
Page 20 GAWGGD-B2-22 SE8 Surw~y
percent beheved this was true, and at EPA, where about 64 percent felt this way.
Governmentwide in 1991, there was a difference of 64 percent between the percentage of career respondents who beIieved that career executives supported and upheld merit principles when hiring personnel and those who believed that political appointees did this. The differences at three departments-Energy (about 67 percent), Education (about 64 percent), and Commerce (about 64 percent)-exceeded the governmentwide difference by at least 10 percent.
There were few changes in career SES members’ responses from 1969 to 1991. In both surveys, EPA and Army had the highest percentage of career SES members who beheved that poIiticaI appointees in their organizations supported and upheld merit principles when hiring. In both surveys, about 36 percent or fewer of the career sxs members at the remaining six departments believed this was true of political appointees at their departments.
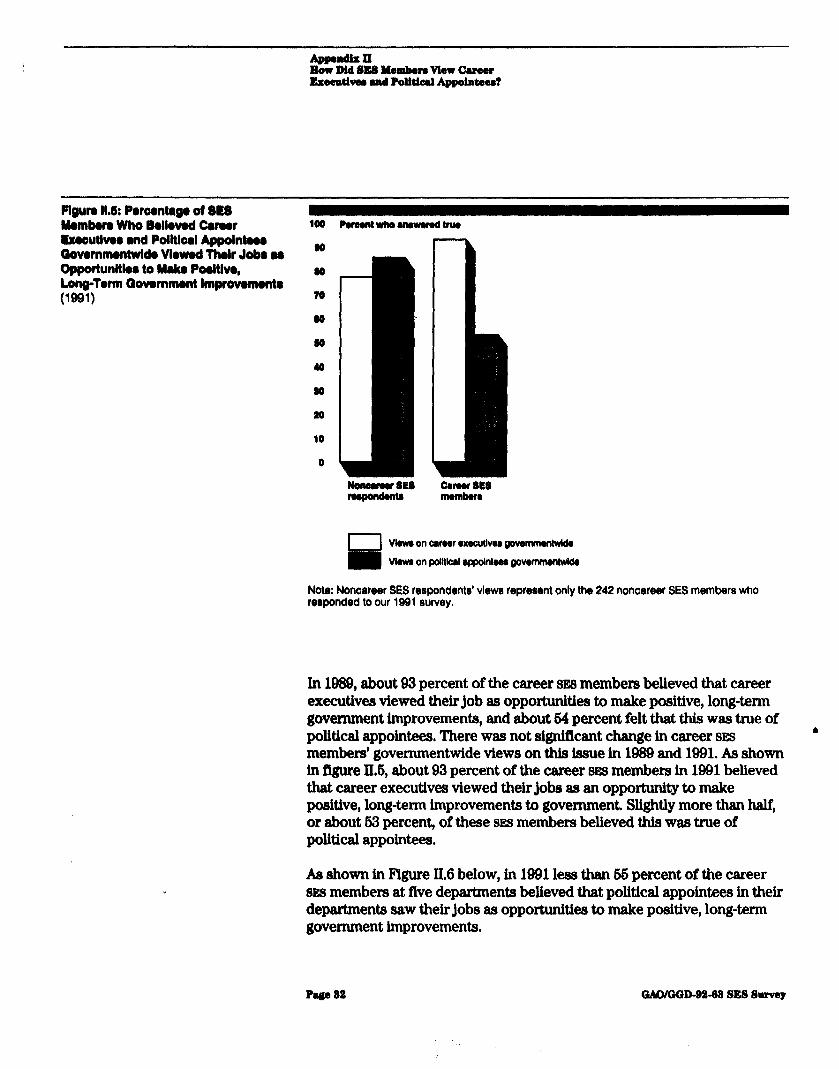
To What Extent Did In 1991, about 77 percent of the noncareer SES respondents believed that
SES Members Believe career executives viewed their jobs as opportunities to make positive, long-term government improvements. About 96 percent of these
Career Executives respondents beheved that this was true of political appointees. See figure
and Political 11.6.
Appointees See Their Jobs as Opportunities to Make Positive, Long-Term Improvements?
P*e31 WGGD-@%SSSESSumy
Plgun 11.1: Pwwntago of 8158 Mwnbw8 who B8liw8d cwwr Rxewtlma and Polltbl Appdntow Qovommontwlcla Vlowod Tlwlr Job8 a8 00 Opportunltkr to Mako Podtlvo, 00 Long-Twm Oovommont Improvomontr uw 70
00
00
0
Vhm on oafear rxocuUv~ go~mmonhffkb View8 on politW lppdnbn govrrnmuWck
Note: Nonoareer SES respondents’ views represent only the 242 noncareer SES members who responded to our ID91 survey.
In 1080, about 03 percent of the career SES members believed that career executives viewed their job as opportunities to make positive, long-term government improvements, and about 54 percent felt that this was true of political appointees. There was not sign&ant change in career sEs l
members’ governmentwide views on this issue in 1939 and 1991. As shown in Qure II.6, about 93 percent of the career sus members in 1991 believed that career executives viewed their jobs as an opportunity to make positive, long-term improvements to government, Slightly more than half, or about 63 percent, of these sxs members believed this was true of political appointees.
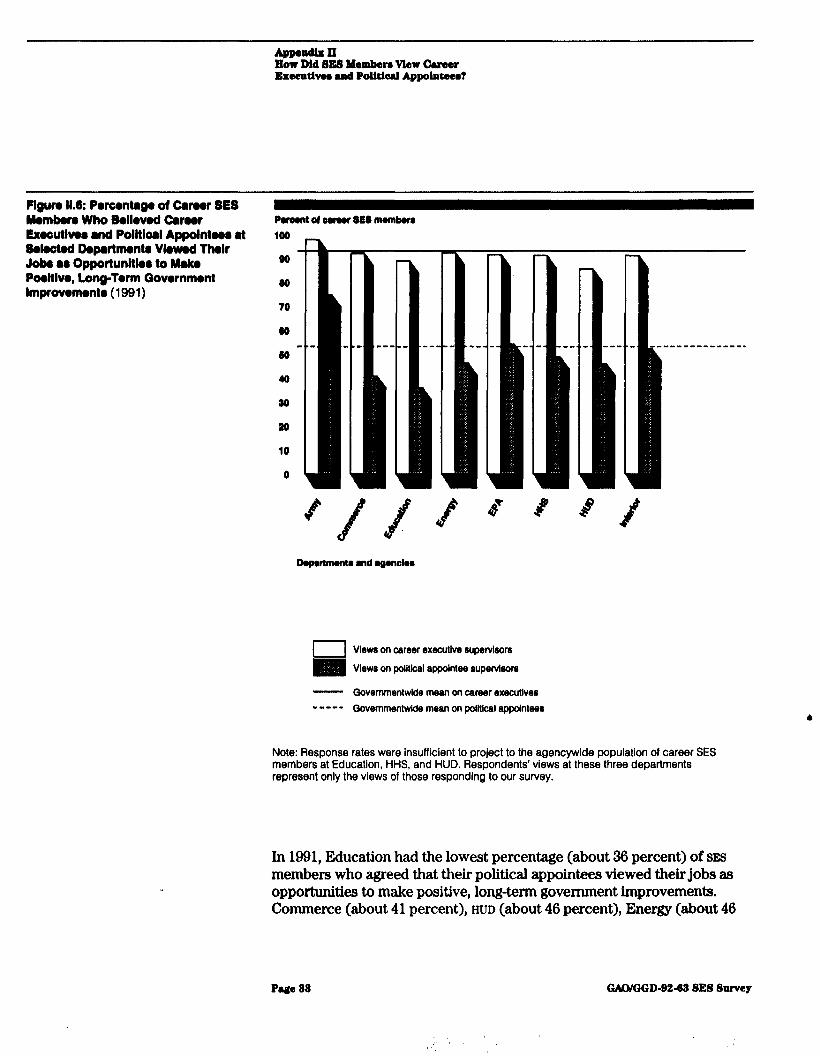
As shown in F’igure II.6 below, in 1991 leas than 56 percent of the career sxs members at five departments believed that political appointees in their departments saw their jobs as opportunities to make positive, long-term government improvements.
Pmge 82 WQGD-8%88 SES Survey
How Did SES Membau Vlar Career Exeeutivea and Polldeal Appohltaea?
PlSun 11.6: Porcantago of Cwwr SE8
Exo0utlvor and Polltlcal Appolntooo at 100 S8lwt8d Dopwtmontr Vkwod Tholr Job@ l r) Oppottunltkr to Make oo- PooJtlvo, Long-Term Qovornmant Improvomontr (1991)
w
70
00
WO-
40
W
W
10
0
DqWmmts and rgonclma
I I Views on career exsculive su~~~lsors
Vlewfi on politlcal appointee supervIsors
- GovernmentwIde mean on career executives - - - - - Qovemmentwide mean on political sppolntees
Note: Response rates were insufficient to project to the agencywide population of career SES members at Education, HHS, and HUD. Respondents’ views at these three departments represent only the views of those responding to our survey.
In lfIO1, Education had the lowest percentage (about 36 percent) of SES members who agreed that their political appointees viewed their jobs ss opportunities to make positive, long-term government improvements. Commerce (about 41 percent), HUD (about 46 percent), Energy (about 46
Page 88
. ,
I
GAWGGD-82.02 SE8 Survey
percent), and IUIS (49 percent) followed. In 1989, less than half of the career respondents from Commerce, HUD, Energy, and HW believed that political appointees viewed their jobs as opportunities to make positive, long-term government improvements. The percentage of respondents who believed that this was true of political appointees at Education decreased from about 69 percent in 1989 to about 36 percent in 1991.
Governmentwide in 1991 there was a difference of about 40 percent between the percentage of career SES members who believed that in most or all casea career executives viewed their jobs as opportunities to make positive, long-term improvements and the percentage of respondents who believed that this was true in most or all cases for political appointees. Only Army (about 23 percent) had a difference that was considerably smaller than tMs governmentwide difference. The largest differences were at Education (about 63 percent) and Commerce (about 61 percent).
According to several career sxs members in 1989 and 1991, the shortrterm initiatives of some political appointees disrupted long-term strategically planned activities and competed for resources. While some career sxs members felt that it may be understandable for some political appointees to focus more attention on shortterm initiatives to institute changes during their short tenures in office, one stated that many appointees leave the agency before they can see the negative effects of their changes and that careerists in some instances are left to deal with the adverse effects of quick changes and to provide some continuity for long-range programs. “The competing priorities of short-term and long-term programs,” according to one sxs member, “ensures discouragement of both.” Another respondent commented that abrupt policy changes and “new ways of doing business” are very disruptive and wasteful.
On the other hand, a noncareer SES respondent in 1991 commented that 6 there would never be a review of outdated or outmoded policies without political appointees, who can look more objectively and logically at policies and procedures that have gained a “life of their own.” This respondent felt that political appointees in this capacity serve a purpose that careerists would never undertake. Another noncareer SES respondent in 1991 commented that a mix of career and noncareer executives is not only appropriate but beneficial because the noncareer executive who brings a fresh outlook and new thinking can afford to be bold and take chances in the interest of progress while career executives provide stability. Another noncareer SES respondent in 1991 commented that
Page 84 WGGD-92-68 SESSurvey
career executives treat their jobs as “entitlements” and are rarely motivated to make improvements.
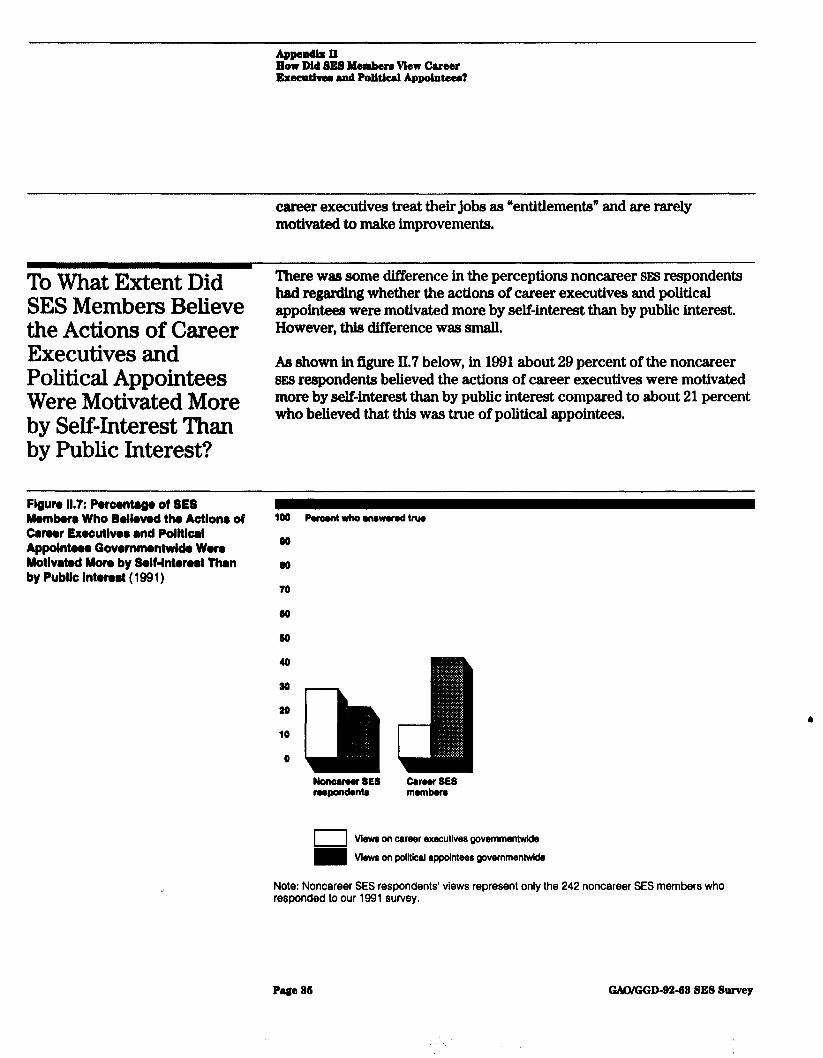
To What Extent Did There was some difference in the perceptions noncareer SES respondents
SES Members Believe had regarding whether the actions of career executives and political appointees were motivated more by self-interest than by public interest.
the Actions of Career However, this difference was small.
Executives and Political Appointees
As shown in figure II.7 below, in 1991 about 29 percent of the noncareer SJZS respondents believed the actions of career executives were motivated
Were Motivated More more by self-interest than by public interest compared to about 21 percent
by Self-Interest Than who believed that this was true of political appointees.
by Public Interest?
Flgun 11.7: Porcontago of SES Momkrr Who Bellwed tlu Actlono of Career Exaoutlvor and PolItIcal Appolntoor Govornmontwlda Won Motlvatmd Man by Solf-lntonot Than by Public Intonrt ( 1991)
loo Puaoni who rnBworod trua
00
00
70
00
60
40
a0
20
10
0
Noncareer SE8 Career SE8 mpandonta mmmbofr
Views on career executive.s govemmenhvlde
Views on politkal appointees ~vemmentwida
Note: Noncareer SES respondents’ views represent only the 242 noncareer SES members who responded to our 1991 survey.
Pa#e 811 WGGD-9248 SE8 8urvey
In 1991, about 42 percent of career SES members indicated that they believed that the actions of noncareer executives were motivated more by self-interest than public interest while 13.6 percent believed that this was true of career executives. This represents a governmentwide difference of about 28 percent.
In 1989, there was a similar governmentwide difference of 27 percent+the difference between about 13 and 40 percent of career SES members who believed that this was true of career executives and political appointees, respectively.
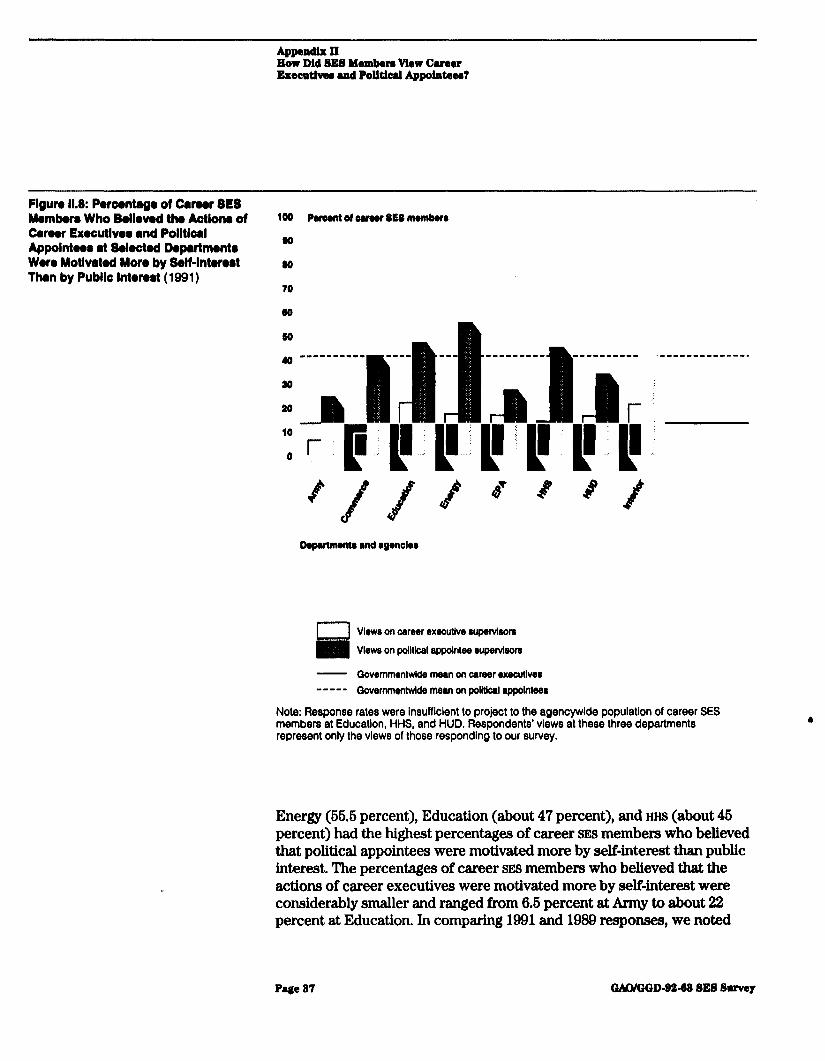
Figure II.8 shows that in 1991 Army (about 26 percent), EPA (about 27 percent), and HUD (34 percent) had the smallest percentage of responding career SES members who believed the actions of political appointees were motivated more by self-interest than public interest.
Page 86
i','
How Did SES Memben View Career Execntlvw urd Polttterl AppoLDteer?
Flgun 11.8: Percentago of Camr SE8 Mambatw Who Bollevod tha Aetionr of Carear Exoeutlvoo and PolItIcal Appolntoea at Soloctod Dopartmontr Wwr Motlvatod More by Self-lntorort Than by Public Intwwt (1991)
100 Parowl of ouow 8ES mombwr
w 00
70
so
Vlewe on csrwr executive supsrvkors
Vlewe on polllkal appoinlss supervIsors
- Govemmenlwide mean on career executives - - - - - Qovemmenlwlds mean on political appointees
Note: Response rates were insufficient to project to the agencywide population of career SES members at Education, HHS, and HUD. Respondents’ views at these three departments represent only the views of those responding to our survey.
Energy (66.6 percent), Education (about 47 percent), and HHS (about 46 percent) had the highest percentages of career SE9 members who believed that political appointees were motivated more by self-interest than public interest. The percentages of career SES members who believed that the actions of career executives were motivated more by self-interest were considerably smaller and ranged from 6.6 percent at Army to about 22 percent at Education. In comparing 1991 and 1989 responses, we noted
Page 27 OALUQQD-8258 SE8 Survey
How Did SES Man&em Mew Career Executiva~ and Politbl Appointaim?
that some of the same departments that exceeded the governmentwide mean response of about 40 percent in 1989 also exceeded the 42-percent governmentwide mean for 1991. Commerce, Energy, HHS, and Interior exceeded the governmentwide mean for both years.
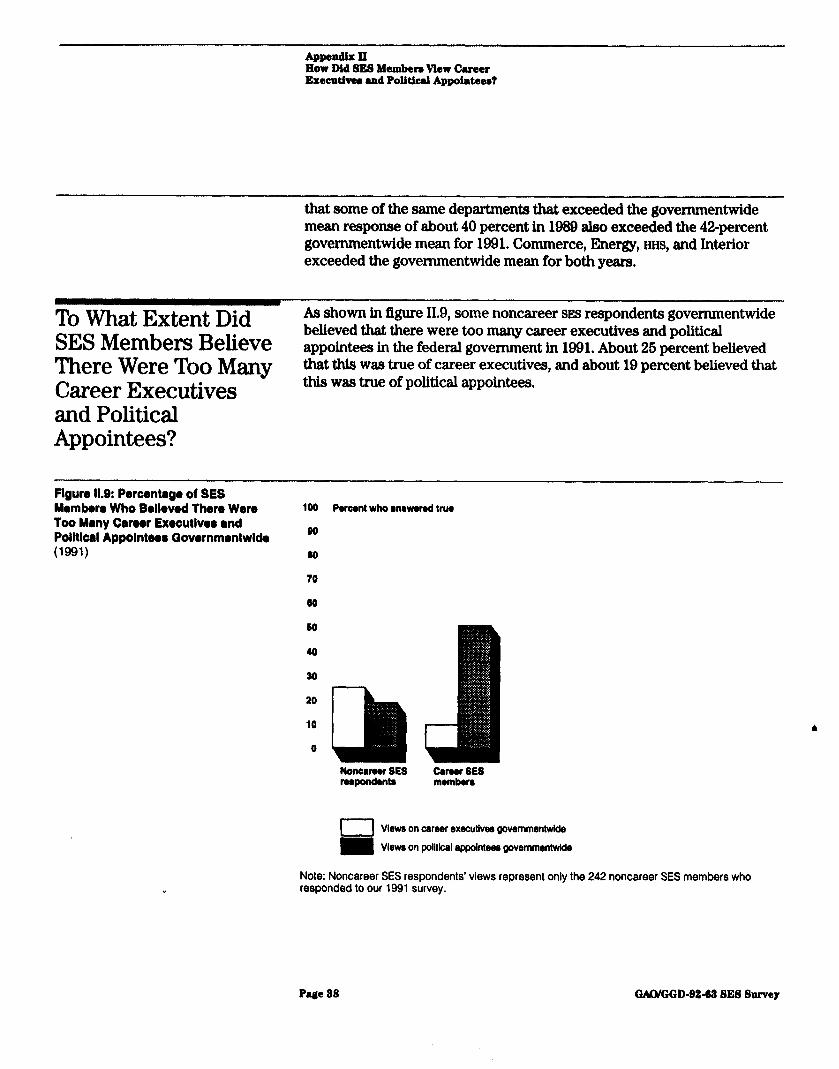
To What Extent Did As shown in figure 11.9, some noncareer SES respondents governmentwide
SES Members Believe believed that there were too many career executives and political appointees in the federal government in 1991. About 26 percent believed
There Were Too Many that this was true of career executives, and about 19 percent believed that
Career Executives this was true of political appointees.
and Political Appointees?
Figure 11.9: Percentago of SES Momkr8 Who Bollovod Than Were loo Many Caroor Bxocutlvor and Polltlcrl Appolntwa C3ovarnmontwlda (1991)
100 Percent who l nowered true
00
so
70
00
60
40
30
20
10
0
Noncrrwr SE8 Camor 8ES mpondonte mombarr
View8 on career executives governmentwide
Vlewa on politkal appointees governmentwide
Note: Noncareer SES respondents’ views represent only the 242 noncareer SES members who responded to our 1991 survey.
Page 88 WGGD-Be-62 SES Survey
In both surveys, more career SIB members indicated that they believed there were too many political appointees thsn those who indicated there were too many career executives. Career sxs members’ responses to this question in both surveys were almost identical. Governmentwide in 1989, about 61 percent of the career sxs members felt that there were too many political appointees while about 8 percent believed that this was true of career executives. Governmentwide in 1991,60.6 percent of career SES members believed that there were too many political appointees compared to about 10 percent who believed that there were too many career executives.
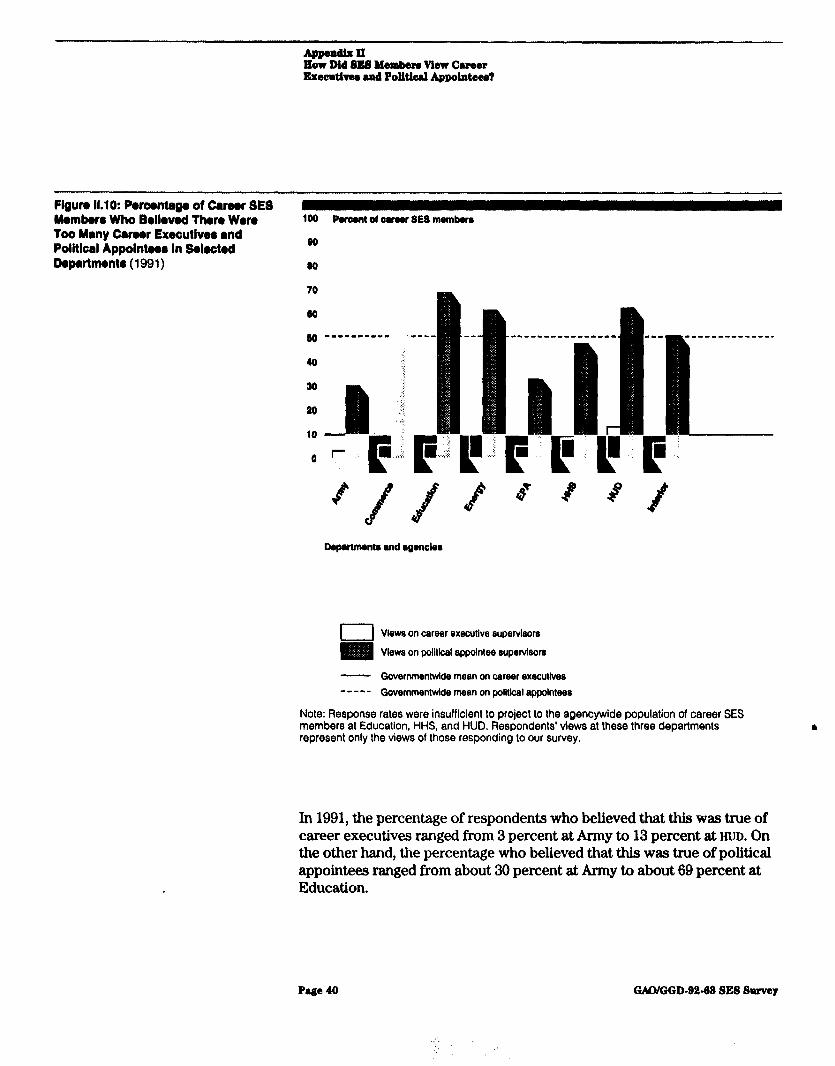
F’igure II.10 shows the extent that responding career SES members at selected departments in 1991 believed that there were too many career executives and political appointees in their departments.
Page 89 GAOKXJD-8242 SES Sprvay
Figun 11.10: Percentage of Camr SE8 Momkrr Who Bellowl Than Won 100 Pomont d oamr SES memberr Too Many Carow Executivea and Poiitlcrl Appolntnr In Selected 90
Dopartmanto (1991) so
Dapwtmrntr and l gencloa
Vlewa on career executive supervlr3ors
Vievm on polltlcel appointee eupervisor8
- Qovernmentwlde mean on career executives - - - - - Governmentwide mean on politIcsI appointees
Note: Response rates were insufficient to project to the agencywide population of career SES members at Education, HHS, and HUD. Respondents’ views at these three departments represent only the views of those responding to our survey.
In 1991, the percentage of respondents who believed that this was true of career executives ranged from 3 percent at Army to 13 percent at HUD. On the other hand, the percentage who believed that this was true of political appointees ranged from about 30 percent at Army to about 69 percent at Education.
Page40 C?M%GD-92-08SESSPrvsy
&P--n How Dtd 8E8 Member8 Mew Cwer Hxeoudvw and Political Appolateel?
As shown in figure II. 10, there were maJor difperencea in the perceptions career SEB members had of career executives and political appointees on this issue in 1991. In 1991, the difference in opinions about whether there were too many career executives and political appointees ranged from about 27 percent at Army to about 63 percent at Education. We consider such differences to be significant.
In 1989, at least half of the responding career SES members at seven of the eight departments and agencies believed that there were too many politkal appointees. EPA (about 32 percent) was the only orgsnktion where considerably fewer of the respondents felt this way about their political appointees. In 1991, at least half of the career SES members at five departments believed that there were too many political appointees. Less than hslf of the career SES members at Army (about 30 percent), EPA (about 33 percent), and HHS (about 47 percent) believed that this was true of political appointees in their departments.
Page 41 GMUQGD-B2-68 SE8 Suwey
AgpendixIII
How Did SES Members View the Leadership Behavior and Abilities of Career Executives and Political Appointees?
We asked sxs members to indicate the extent to which they agreed or md with 18 statements about the leadership behavior and abilities of their immediate supervisors. We analyzed their responses to determine if their perceptions about career executive and political appointee supervisors were different and, if so, to what extent these perceptions varied among career and noncareer SES members governmentwide and at selected departments and agencies. We compared the responses of (1) noncareer sxs members whose immediate supervisors were career executives, (2) noncareer SES members whose immediate supervisors were po&icaI appointees, (3) career SES members whose immediate supervisors were career executives, and (4) career SES members whose immediate supervisors were political appointees. To make these comparisons, we considered a difference major when the views of a respondent group regarding careerists and noncareerists differed by 9 percent or more. We did this to focus on the largest differences. It should be noted that we did not verify whether the perceptions of the career SES members and noncareer SES respondents accurately reflected situations that existed in their departments but accepted their responses as what they believed existed. (See app. V, question 9, for their responses to aII 18 statements.)
There were msjor differences in the opinions of noncareer 9~s respondents in 1991 about career executive and political appointee supervisors in 11 of the 18 supervisory characteristics in our survey. Noncareer SES respondents’ opinions were more positive toward their political appointee supervisors1
Career SES members governmentwide had major differences of opinion about career executive and politically appointed supervisors for 6 of 18 supervisory characteristics addressed in our survey. Their opinions were more positive toward career executive supervisors. Interestingly, five of these same characteristics were among the six characteristics in 1989 a upon which careerists had major differences of opinion about career executive and poIitics.Ily appointed supervisors.
‘In thie appendix, 88 with other parta of this report, we discus noncareer SES members’ perceptioni only aa a group perspective because there were tao few of these respondents for w to make agency-level comparisone.
Page 42 GAWGGD-92-68 SES Survey
How Did SES Mambau View the Leadanlrlp EebwIor aad Abilitiar of Came? Executives and PoWcal Appointeeat
Noncareer SES Respondents Had Major Differences of Opinion About Career Executive and Political Appointee Supervisors in 11 of 18 Categories
Responding noncareer SES members in 1991 indicated major differences of opinion about career executive and political appointee supervisors for most of the 18 supervisory characteristics addressed in our survey. Generally, the responses were more positive toward political appointee supervisors than toward career executive supervisors.
For 11 supervisory traits, noncareer SES respondents had major differences of opinion about the ability and behavior of career executive versus political appointee supervisors. Noncareer SES member responses indicated that they believed politically appointed supervisors were more likely thsn career executive supervisors to
l sat&@ employee needs and expectations, l show them a lot of trust and respect, l discuss the big picture of the subunit with them, l provide praise and recognition, l ensure that employees fully realize their potential, l share their considerable experience and training, l provide them with sound job-related advice, and l know how to use contacts to get things done.
On the other hand, this same group of respondents believed that career executive supervisors were more likely than politically appointed supervisors to
l make decisions in the respondent’s area of responsibility without consulting her or him,
l provide them with needed technical knowledge, and l have the clout needed to get the job done.
l
For the remaining seven leadership characteristics, there was not a mar difference in noncareer SES respondents’ opinions about immediate supervisors who were career executives versus those who were political appointees. Generally, these respondents agreed that both types of these supervisors (1) allowed them to become involved in formulating the policy agenda, (2) took the views of subordinates into account when making decisions, (3) delegated authority and responsibility, (4) kept employees informed about subunit activity, (6) demanded compliance with their decisions, and (6) were capable of getting needed resources. Regarding the seventh leadership characteristic, few noncareer SES respondents indicated that they felt subjugated by either their career executive or political appointee supervisors.
Page 42 GMWGD-92-62 SE8 Suwey
Appendlsxx Ilow Did SES Hembelu view die Lewp Bekvior urd Abllltiea of Career Ereeuthw and Political Appointaer?
Supervisory Traits Where Career SES Viewed Career Executives and Political Appointees S imilarly
.
.
.
.
.
.
.
.
.
.
. demanded compliance with his or her decisions, and
. were capable of getting the resources needed to get the job done.
For most of the supervisory traits addressed in our surveys, responding career SIB members had no aor differences in their views about career executive and political appointee supervisors. Their responses in 1991 indicated less than a Q-percent difference in opinions about these two types of supervisors for 12 of the 18 .supervisory traits addressed in our survey.
About the same percentage of career SES members with career executive supervisors as those with political appointee supervisors believed that their supervisors
showed them trust and respect, took the suggestions of subordinates into account when making decisions, delegated authority and responsibility, discussed the big picture of the subunit, provided praise and recognition, knew how to use contacts to get things done, allowed them to become involved in the formulation of the policy agenda, made them feel subjugated, made decisions in the respondent’s area without consulting him or her, delegated authority and responsibility to subordinates and allowed them to determ ine how to do their work,
Career SES Members Had SOIN Differences
opinion about their career executive and political appointee supervisors in 6 of the 18 supervisory characteristics addressed in ow survey, Career SES
of Opinion About members with career executive supervisors were more likely than those
Political Appointee with political appointee supervisors to agree that their immediate
and Career Executive supervisors
Supervisors l satisfied employee needs and expectations for growth and development, l ensured that employees fully realize their potential, l kept employees informed about what is going on in their subunit, l provided needed technical knowledge, l often provided sound job-related advice, and l often shared their considerable experience and training.
In 1989, career SES members had major differences of opinion about their career executive and political appointee supervisors for five of the six
Page 44 WWD-22-22 SES Survey
How Did SE8 Mereben Mew the Lmderahip Behavior and Abllith of Cheer Exeeudver and Political Appointoer?
characteristics just mentioned. The exception involved their perceptions about whether immediate supervisors shared their experience and tr&ing. The difference in 1989 was not significant (7.6 percent), while there wss a significant difference of 11.4 percent in 1991 respon~es.~
Career SES Members’ In addition to looking at career SES members’ opinions governmentwide,
Views Varied at we also looked at how their opinions varied about career executive and political appointee supervisors at departments selected for review. We
Selected Departments could not do a similar analysis for noncareer SES respondents’ perceptions because there were too few resporises.
F’igures III.1 through III.6 show that the different opinions career SES members had governmentwide tended to vary among SES members at selected departments and agencies. Lines representing the govemmentwide means csn be used to judge the extent to which the opinions of career SET members at a specific agency or department were consistent with governmentwide perceptions of career SES members.
Did Career SES Members Believe That Career Executive and Political Appointee Supervisors Meet Employee Development Needs?
Governmentwide in 1991 about 71 percent of the career SES members with career executive supervisors agreed that their immediate supervisors satisfy employee needs and expectations for growth and development. About Ss percent with political appointee supetiors agreed that their immediate supervisors do this. Figure III.1 shows that with the exception of Army, Commerce, and HHS in 1991, about the same percentage of career SES members with career executive supervisors and those with political appointee supervisors at each organization agreed that immediate supervisors meet employee needs and expectations for growth and development.
When comparing 1989 and 1991 reaponaea !‘rom career SES members, the difference must be greater than 8.7 percent for It ta be co~idered HaWkally s&n&ant and not due to sampling en-or.
Page IIS GAOIWD-DMD SE8 Survey
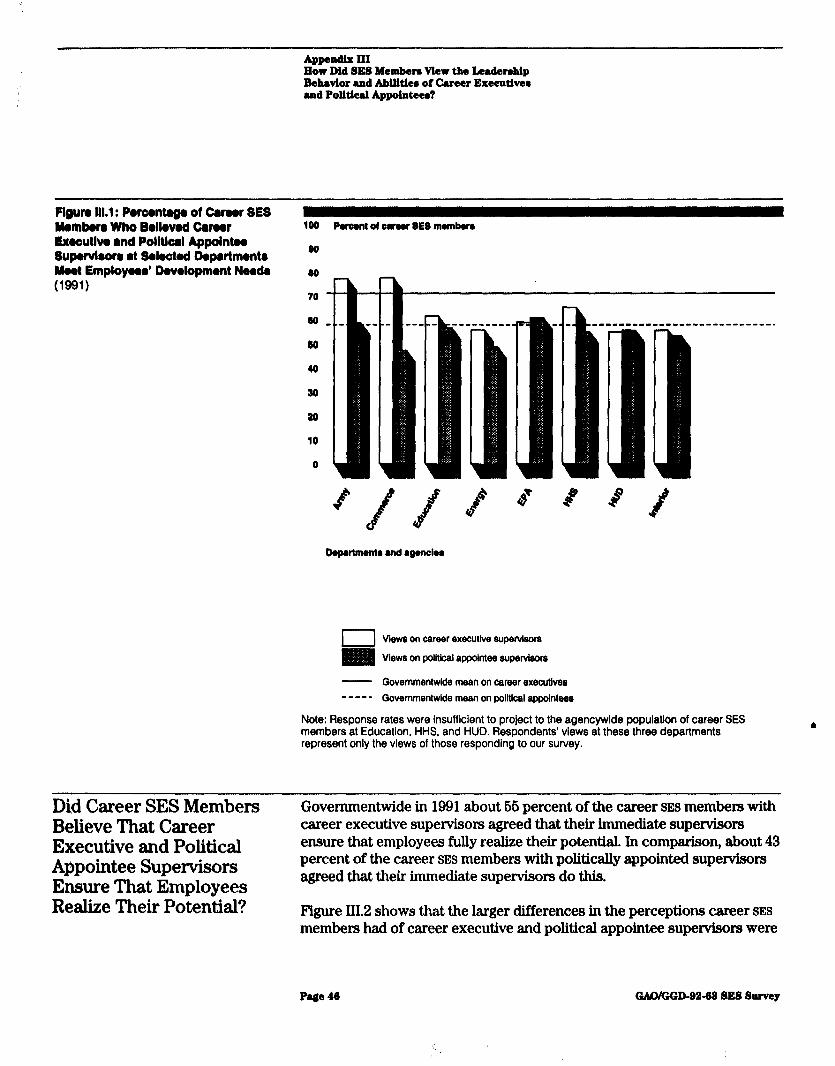
How Did SE&l Membexn View the Leadenhip Eehwlor and AbilItier of Career Execudver and PolitIcal Appoh~teea?
Agun III.1 : Poroontqo of Cwoer SE5 Membwr Who Bollovod Career Hxoautlva and Polltlcal Appoint00 Supwvlmon rt Shctod Dqwtmontr Moot Employeor’ Dovolopmont Noodr UQQl)
100 Peroenl ol eueer SE8 membue
90
0
70
00
60
40
20
20
10
0
hpulmontr end l gonclw
I Views on career executive supervi6ora
Views on politkal appointee supervleore
- GovernmentwIde mean on career executlvee - - - - - Qovernmentwlde mean on polltk~l appointwe
Note: Response rates were insufficient to project to the agencywide population of career SES members at Education, HHS, and HUD. Respondents’ views at these three departments represent only the views of those responding to our survey.
l
Did Career SES Members Believe That Career Executive and Political Al)pointee Supervisors Ensure That Employees Realize Their Potential?
Governmentwide in 1991 about 66 percent of the career SES members with career executive supervisors agreed that their immediate supervisors ensure that employees fully realize their potential. In comparison, about 43 percent of the career SES members with politically appointed supervisors agreed that their immediate supervisors do this.
F’igure III.2 shows that the larger differences in the perceptions career SES members had of career executive and political appointee supetirs were
Page 46 GMUGGD-82-42 SE8 Survey
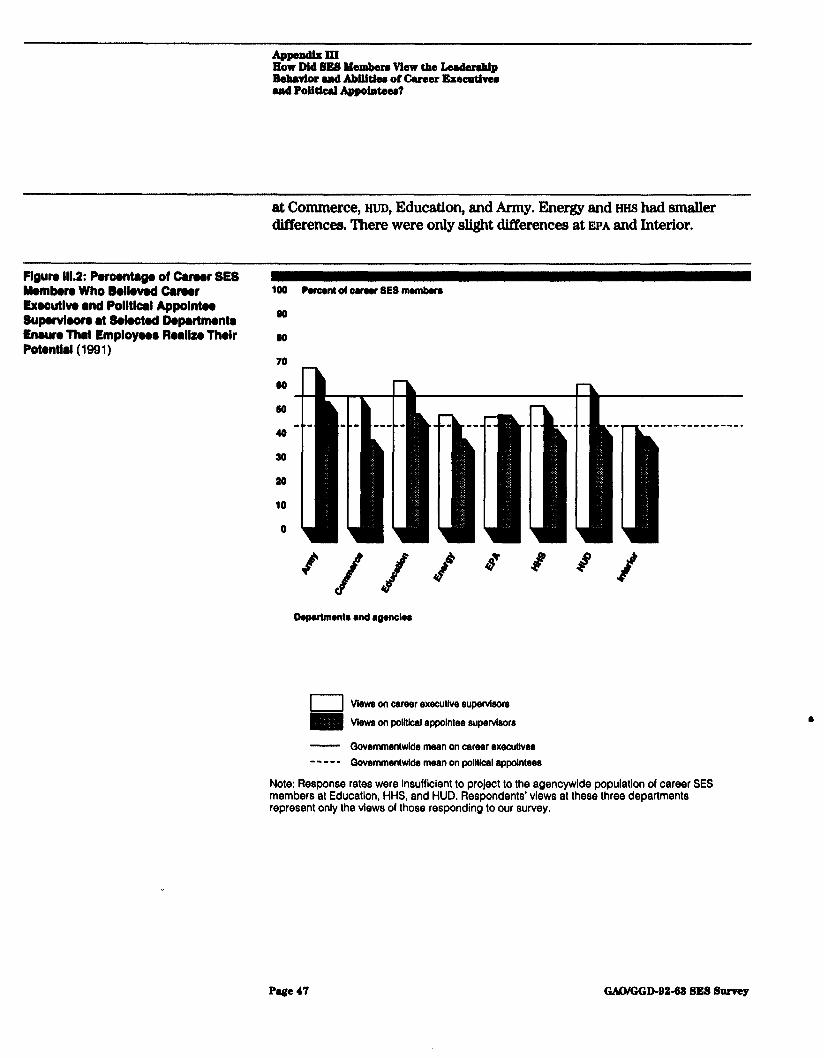
at Commerce, HUD, Education, and Army. Energy and HI-IS had smsller differences. There were only slight differences at EPA and Interior.
Rgun 111.2: Perwntago of Caroar SES Mmmborr Who Bellovod Caroor 100 Puoent of cuew 8ES mombuo Exwutlvo and Polltlcal Appointcn Supowbom at Solwtod Doprtmontr 00
Enaun Thmt Employ000 Ruliu Tholr 110 Potontlrl(1991)
70
bputmonto and l gonclrr
Views on career rxecuUve eupervisor8 Views on po(Mcal appointee supervisors
- Qovemmentwlde mean on career executives - - - - - Qovemmentwide mean on polItIcal appdntees
Note: Response rates were insufficient to project to the agencywide population of career SES members at Education, HHS, and HUD. Respondents’ views at these three departments represent only the views of those responding to our survey.
Page 47 GMM3GD42-62 SE8 Survey
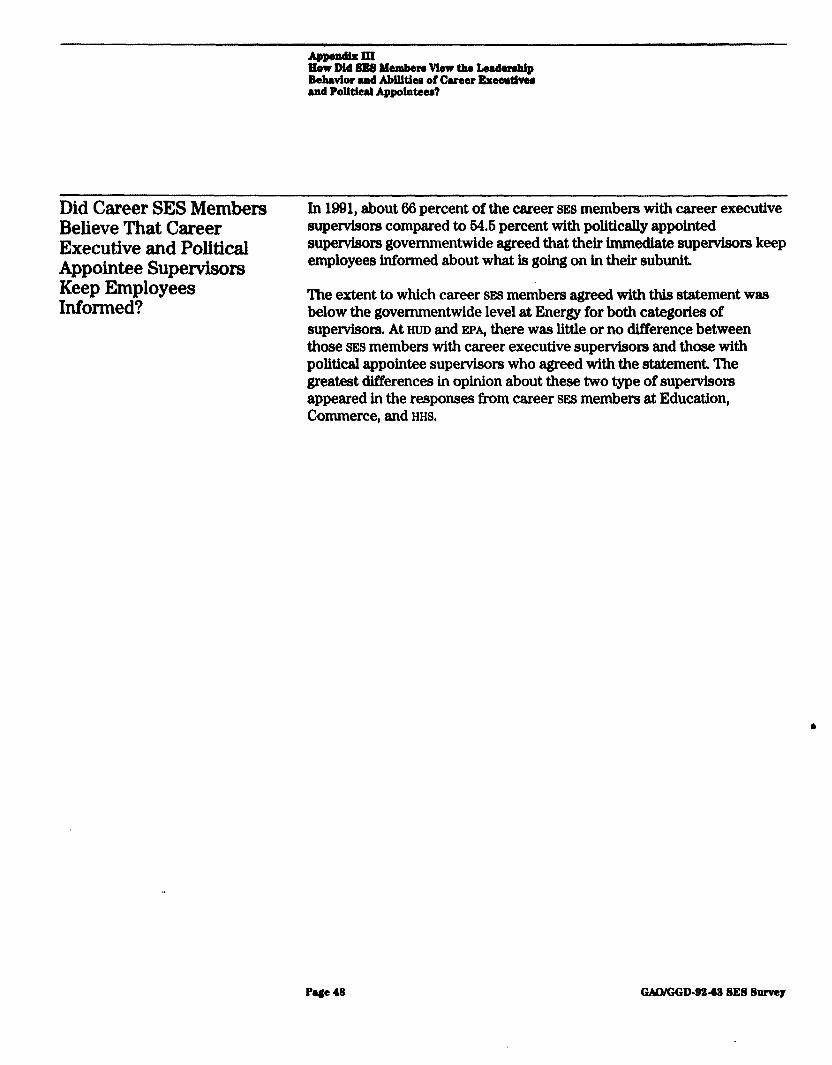
Did Career SES Members Believe That Career Executive and Political Appointee Supervisors Keep Employees Informed?
In 1991, about 66 percent of the career SES members with career executive supervisors compared to 64.6 percent with politically appointed supervisors governmentwide agreed that their immediate supervisors keep employees informed about what is going on in their subunit.
The extent to which career SES members agreed with this statement was below the governmentwide level at Energy for both categories of supervisors. At HUD and EPA, there was little or no difference between those SES members with career executive supervisors and those with political appointee supervisors who agreed with the statement. The greatest differences in opinion about these two type of supervisors appeared in the responses from career SES members at Education, Commerce, and HHS.
Pa@48 WGGD-92-68SESSurvey
How Did BE8 MwabeN Maw the Leadarehl~ Behwtor aad Abllitiea of Career Esecutlver uod Pollticul Appolntmr?
Ptgun IlId: Pwoontags ol Career 81158 usmbaro who Bollowd kr0.r 100 Puwntofounr8E8mombur Exowtivo and PolItIcal Appointos Supwloom at Sslwtsd Departments w Kwp Employns lnformod About 00 S4hunlt Actlvltlos (1991)
70 00 --s------w-m. 60 40 a0 10 10
0
Depwtmonta end rgencler
El Views on career executive supervlsors
Views on political appolntea supervisors
- GovernmentwIde mean on career executives - - - - - Qovernmentwlde mean on polltical appointees
Note: Response rates were insufficient to project to the agencywide population of career SES members at Education, HHS, and HUD. Respondents’ views at these three departments represent only the views of those responding to our survey.
Did Career SES Members Governmentwide in 1991 about 66 percent of the career SES members with Believe That Career Executive and Political Appointee Supewisors Share Their Exp”erience?
career executive supervison agreed that their immediate supervisors share their considerable experience and training with them . In comparison, 42.6 percent of career SES members with politically appointed supervisors agreed that this was true of their immediate supervisors.
Page49
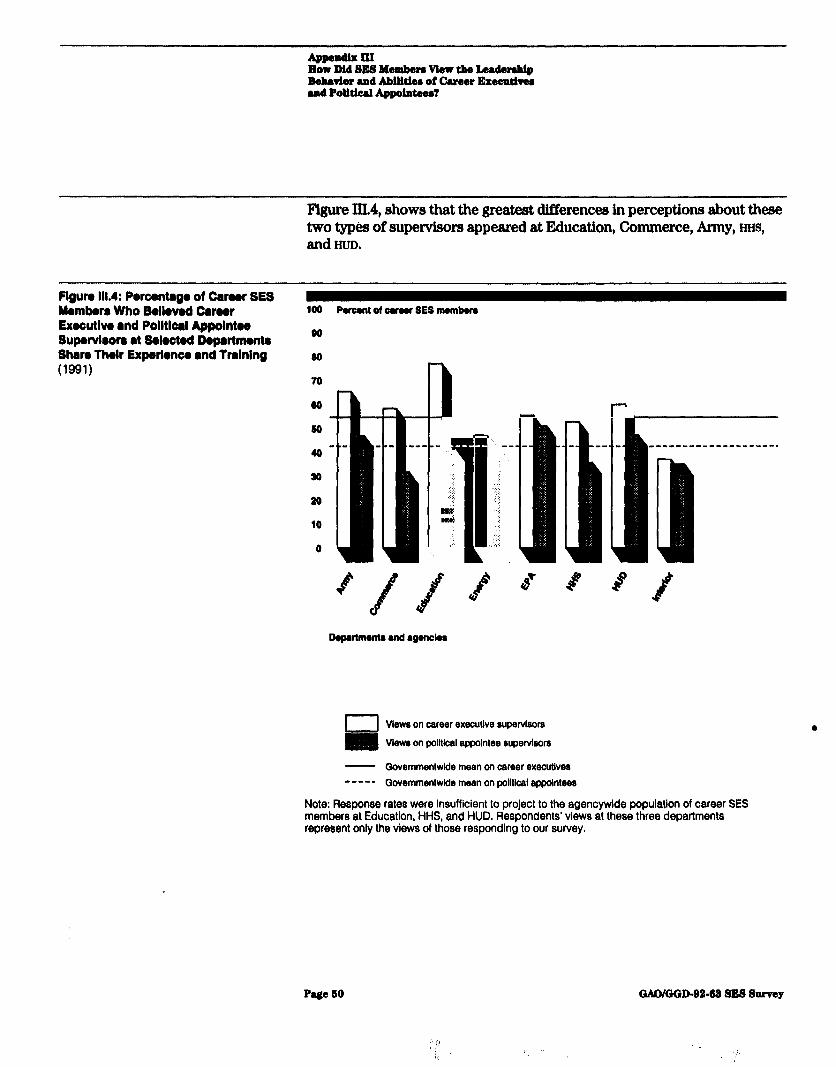
How Dtd SES Mentber8 vtew the LamdmmMp Bakvtor and Abllttiem of Career Exacw.iver and Polittcal Appointeer?
F’igure III.4, shows that the greatest differencea in perceptions about these two typbs of supervisors appeared at Education, Commerce, Army, HHS, and HUD.
Flgun 111.4: Porwntago of Carssr SES hmkrs Who Bellsvkl Camr Exwutlvs and Polltlwl Appolntw Supervisors at Ssloctsd Depsrtmsnts Sham Thslr Expsrlsnw and Tmlnlng (1991)
100 Peroont d oumr SE8 membera
00
00
Views on career executive supMvison
View8 on polltical apqolntee supenrlsors
- Governmentwide mean on career executive8 - - - - - Governmentwide maan on polltkal appointees
Note: Response rates were insufficient to project to the agencywide population of career SES members at Education, HHS, and HUD. Respondents’ views at these three departments represent only the views of those responding to our survey.
Page 50 GMWGGD-92-62 SE8 Survey
Did Career SES Members In 1001, about 43 percent of the career SES member governmentwide Believe That Career indicated that their immediate supervisors who were career executives Executive and Political provide needed technical knowledge. On the other hand, 29.6 percent of Appointee Supervisors career SJB members whose immediate supervtsors were political
Provide Needed Technical appointees agreed that this was so of their supervisors. This represents a e Knowledge?
difference of about 14 percent in these SES members’ opinions about career executive and political appointee supervisors.
F’igure III.6 shows how career SES members’ opinions about career executive and polMcal appointees varied at selected departments and agencies. The greatest differences in favor of career executive supervisors were found in the responses from career SES members at HUD, Commerce, Army, and Education. Career SES members’ opinions at Energy and HHS favored their political appointee supervisors.
Page51 GAD/-D-92-92SESSurvey
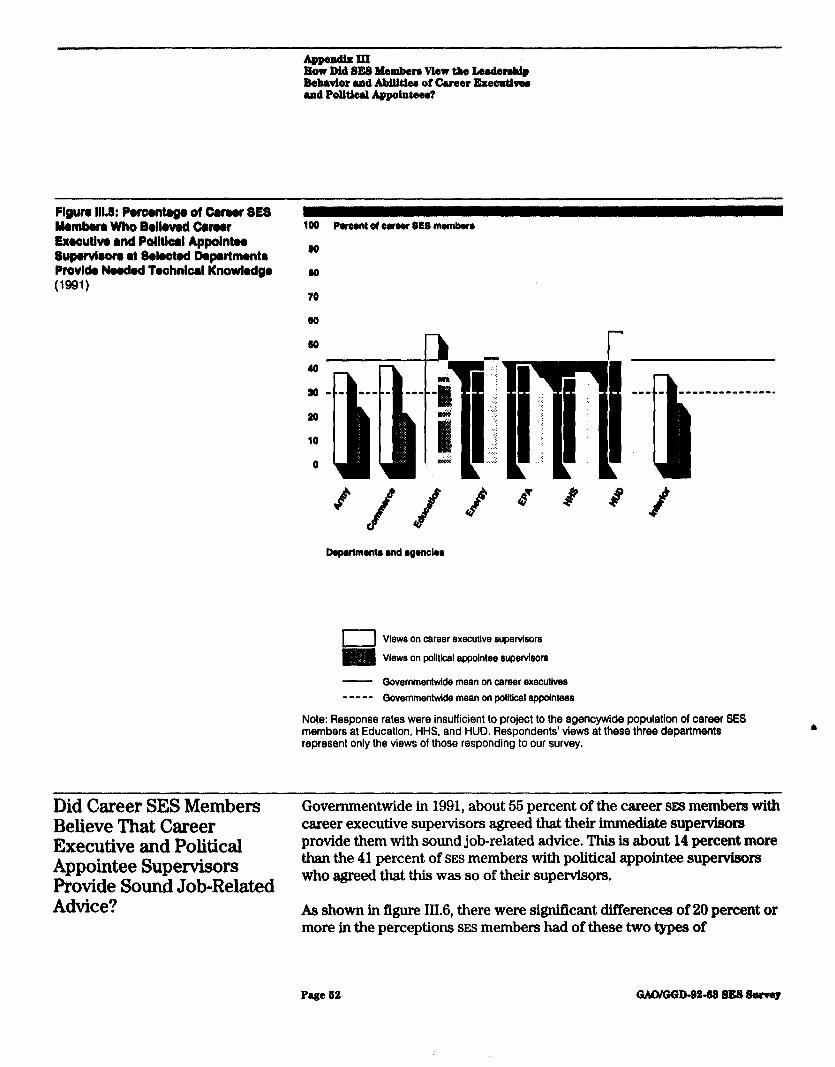
Plgun 111.5: fbwntsgo of Carsor SE8 Mambwr Who Bollevod Camr Exocutlvo and PolItIcal Appolntoo Suporvleon at Smleot~J Dopartmontr Provlda Nmedod Toohnlcal Knowlodge WQl)
100 Perowl of outer SES munbur
00
ti
70
Dqarlmontr and rgmnclrr
Views on cereer executive supenfl8or8
Views on political appointee supervieore
- Qovemmentwlde mean on career executlvee - - - - - Qovemmentwlde mean on political appolnteee
Note: Response rates were insufficient to project to the agencywide population of career SES members at Education, HHS, and HUD. Respondents’ views at these three departments represent only the views of those responding to our survey.
Did Career SES Members Governmentwide in 1991, about 65 percent of the career SES members with Believe That Career career executive supervisors agreed that their immediate supervisors Executive and Political provide them with sound job-related advice. This is about 14 percent more
Appointee Supervisors than the 41 percent of SES members with political appointee supervisors
Provide Sound Job-Related who agreed that this was so of their supervisors.
Advice? As shown in figure 111.6, there were significant differences of 20 percent or more in the perceptions SES members had of these two types of
Page 62 WGGD-9242 SES Sawey
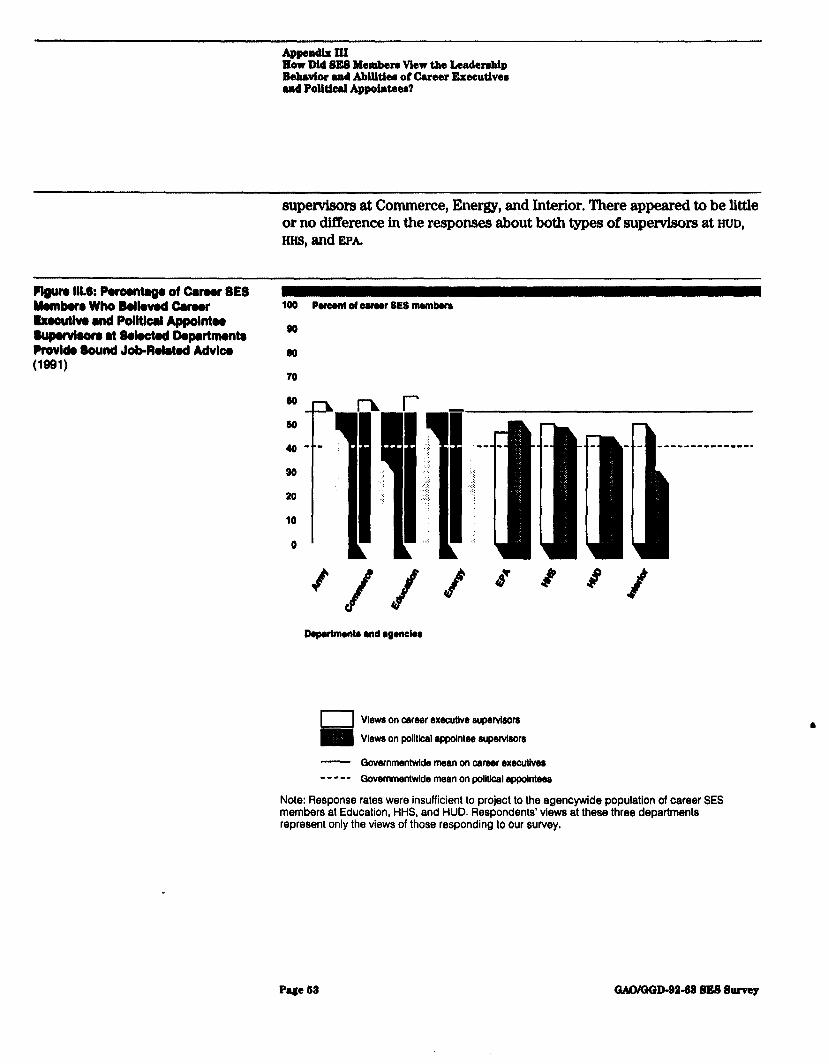
How Dtd SE8 Membero view the Leadenhip Bdwvtor and AbilItiecl of Career Exacudver and Polltical AppoIntear?
supervisors at Commerce, Energy, and Interior. There appeared to be little or no difference in the responses about both types of supervisors at HUD, HHS, and EPA.
Fl@m Ill.& Pwoonta~ of Camr SE8 Mambur who Belhvad carwr boutlvo and Polltld Appolntm Supuvlaora at Sdwtad Dopartmnto Provlda Sound Job-RdMod Advlw WQl)
100 Pofmnt d oarmr SE8 mambwm
O” so
70
00 Ill- -
60
4Q-- j -‘j
Nrl~
-- -----------mm..
: .i
30 : .:, :j .+ >::
.A! ..” :Q
20
i .:.1 ‘:
10
0 ., ..!
DoPutmrntr and l goncloo
El Vlew on career exscutlve supetvlsors Vlsws on political appolntss supervisors
- Qovemmentwlde mean on career exscutlver - - -- - Qovemmentwlde mean on polltk& spfxkitses
Note: Response rates were insufficient to project to the agencywide populatlon of career SES members at Education, I-W and HUD. Respondents’ views at these three departments represent only the views of those responding to our survey.
PqpM Gu1uoQD-BB.68SESSurvey
Appendix IV
Objectives, Scope, and Methodology
The Chalrman of the Subcommittee on Civil Service, House Committee on Post Office and Civil Service, asked us to examine the working relationships between career executives and political appointees. Our objectives were to (1) analyze the views career and noncareer SES members had of their work environment, including their opinions of the managerial and supervisory characteristics of career executives and political appointees, and (2) determine if csreer sxs members’ views about their work environment had changed since 1989. To accomplish these objectives, we administered and analyzed the results of two surveys that posed identical questions. We surveyed career and noncareer SES members at 19 major departments and agencies. According to OPM, ss of June 1989 these departments and agencies accounted for 6,996, or about 83 percent, of the total 7,212 SES members (0,727 career and 486 noncareer) in the federal government. The same departments and agencies accounted for 6,420, or about 84 percent, of the total 7,664 sxs members (6,969 career and 696 noncareer) as of December 1990. For this report, we refer to this universe as governmentwide.
In November 1989, we sent our questionnaire to a random sample of 1,340 SES members. This sample included both career and noncareer SES members as a single universe of SES members. In May 1991, we sent the same questionnaire to the total universe of 486 noncareer SES members and another random sample of 1,676 career sxs members to get more current information about their views on the work environment. We selected both samples to provide for Qbpercent confidence levels with 6 percent sampling error rates for responses governmentwide and for responses from SES members at eight selected departments and agencies-EPA and the departments of the Army, Commerce, Education, Energy, HHS, HUD, and the Interior. However, for three departments-Education, HHS, and HUD-the response rates were insufficient to allow us to project to the agencywide population of sxs c members. Thus, respondents’ views at these three departments represent only the views of those responding to our survey. Tables IV. 1, IV.2, and N.3 contain summaries of the universe sizes, questionnaires mailed, responses, and response rates.
Page64 GMUGGD-92-92SESSurvey
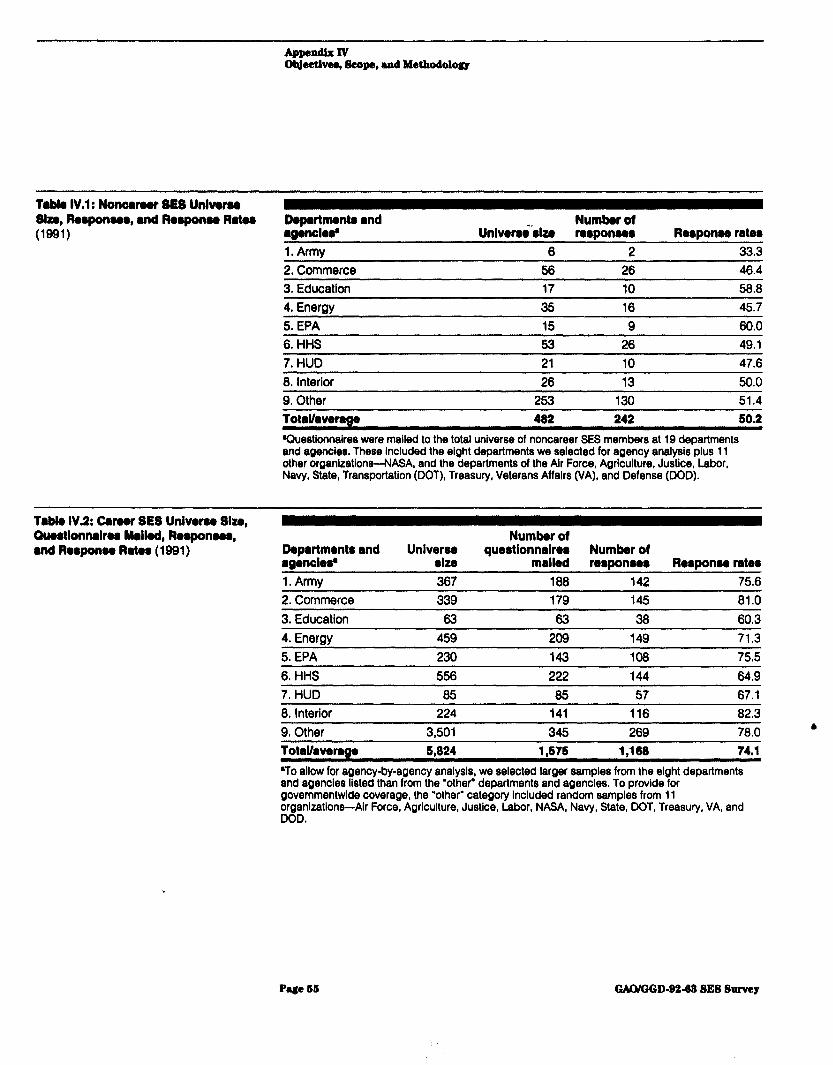
Table IV.1 : Nonearoor SES Unlveroo She, Rwponwr, and Roaponeo Rate. (lQg1)
Dopartmonto and l gonclo3 1. Army
Unlverriilu Numkr of nrponur Responaa rater
6 2 33.3 2. Commerce 56 26 46.4 3. Education 17 10 56.6 4, Energy 35 16 45.7 5. EPA 15 9 60.0 6. HHS 53~ 26 49.1 7. HUD 21 10 47.6 6. Interior 26 13 50.0 9. Other 253 130 51.4 Total/averaaa 482 242 so.2 Questionnaires were mailed to the total universe of noncareer SES members at 19 departments and agencies. These included the eight departments we selected for agency analysis plus 11 other organizations--NASA, and the departments of the Air Force, Agriculture, Justice, Labor, Navy. State, Transportation (DOT), Treasury, Veterans Affairs (VA), and Defense (DOD).
Tablo IV2 Careor SES Unlvwao 6120, Ow8tlonnalrea Mall& Roaponsoa, and Rwponw Rates (1991) Dopartmonts and
agenclos~ Universe
rlze
Number of questlonnalror Number of
mailed reaponus Rerponw rater 1, Army 367 166 142 75.6 2. Commerce 339 179 145 81.0
3. Education 63 63 36 60.3 4. Energy 459 209 149 71.3 5. EPA 230 143 106 75.5 6. HHS 556 222 144 64.9 7. HUD 65 65 57 67.1 6. Interior 224 141 116 82.3 9. Other 3,501 345 269 78.0 l
totaUaverag* 8,824 1,576 1,168 74.1 ‘To allow for agency-by-agency analysis, we selected larger samples from the eight departments and agencies listed than from the “other” departments and agencies. To provide for governmentwide coverage, the “other” category Included random samples from 11 organizations-Air Force, Agriculture, Justice, Labor, NASA, Navy, State, DOT, Treasury, VA, and DOD.
Page 6ls GAWGGD-9242 SE8 Survey
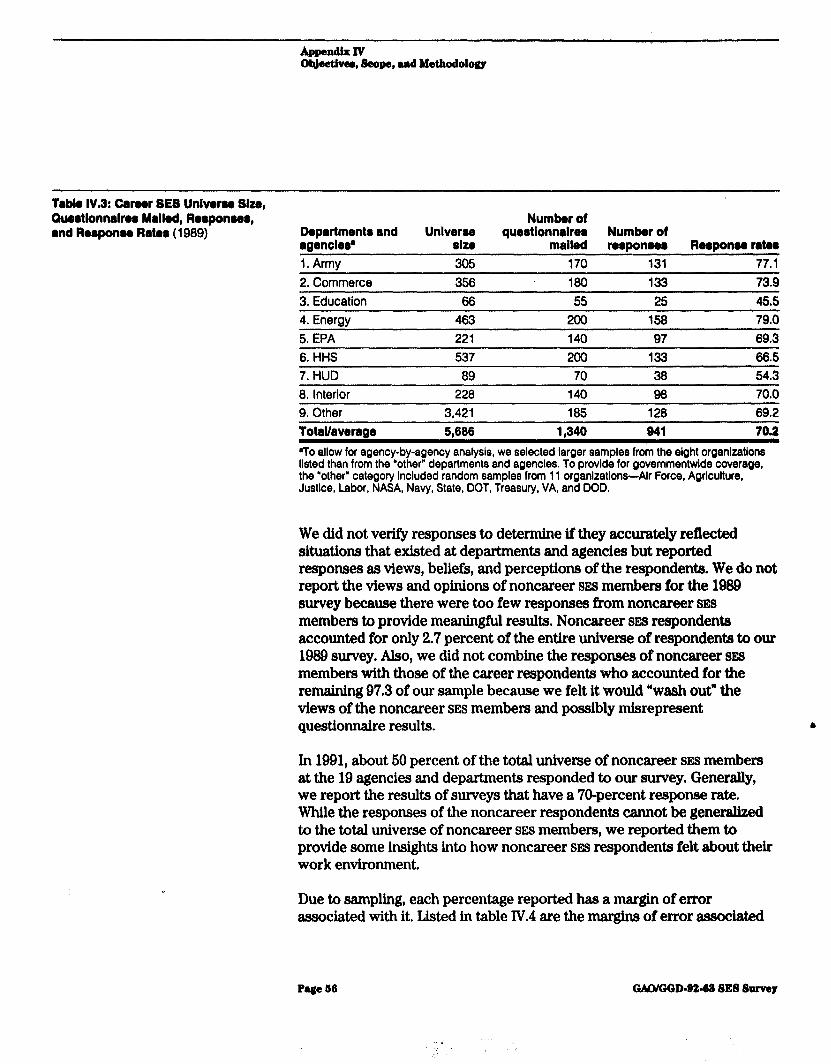
SrpehN Objsctivsr,Scope,andMsthodolol(p
Table IV.8: Career SE8 Unlveru She, Oue~tlonnJrer Malled, Roeponwr, and Rerponu Rotor (1989) Department8 and Universe
aaencle3 Slu,
Number of quertlonnalrer Number of
mailed rer~onwr RorPonw rater 1. Army 305 170 131 77.1 2. Commerce 356 180 133 73.9 3. Education 66 55 25 45.5 4. Energy 463 200 158 79.0 5. EPA 221 140 97 69.3 6. HHS 537 200 133 66.5 7. HUD 89 70 38 54.3 8. Interior 228 140 98 70.0 9. Other 3,421 185 128 69.2 Total/average 5,666 1,340 941 70.2 ‘To allow for agency-by-agency analysis, we selected larger samples from the eight organlzatlons listed than from the “other” departments and agencies. To provide for governmentwlde coverage, the “other” category included random samples from 11 organizatlons-Air Force, Agriculture, Justice, Labor, NASA, Navy, State, DOT, Treasury, VA, and DOD.
We did not verity responses to determine if they accurately reflected situations that existed at departments and agencies but reported responses as views, beliefs, and perceptions of the respondents. We do not report the views and opinions of noncareer SES members for the 1989 survey because there were too few responses from noncareer SE8 members to provide meaningful results. Noncareer SES respondents accounted for only 2.7 percent of the entire universe of respondents to our 1989 survey. Also, we did not combine the responses of noncareer SJU members with those of the career respondents who accounted for the remaining 97.3 of our sample because we felt it would ‘wash out” the views of the noncareer SES members and possibly misrepresent questionnaire results. l
In 1991, about 60 percent of the total universe of noncareer SES members at the 19 agencies and departments responded to our survey. Generally, we report the results of surveys that have a 70-percent response rate. While the responses of the noncareer respondents cannot be generalized to the total universe of noncareer SES members, we reported them to provide some insights into how noncareer SES respondents felt about their work environment.
Due to sampling, each percentage reported has a margin of error associated with it. Listed in table IV.4 are the margins of error associated
, , I t , . , ’
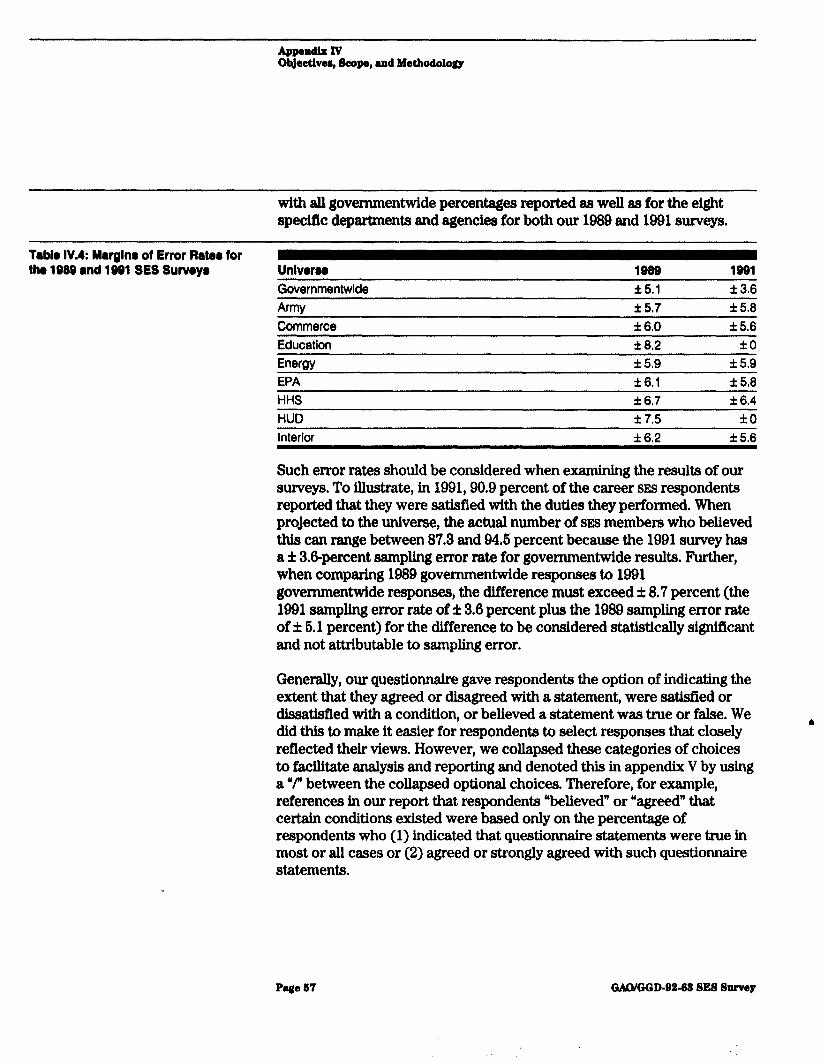
with all governmentwide percentages reported as well as for the eight specifk departments and agencies for both our 1982 and 1391 surveys.
Table IV.4: Marglnr of Error Rater for the 1966 and 1991 SES Survayr Unlveroo 1969 1661
Governmentwide f5.1 f 3.6 Army f 5.7 f 58 Commerce f 8.0 f 5.6 Education Energy EPA
f 8.2 f0 f 5.9 f 5,Q f6.1 f 5,8
HHS f 607 f 6.4 HUD Interior
f 7.5 f0 f6.2 5~5.6
Such error rates should be considered when examining the results of our surveys. To illustrate, in 1991,90.9 percent of the career SES respondents reported that they were satisfied with the duties they performed. When projected to the universe, the actual number of sxs members who believed this can range between 87.3 and 94.6 percent because the 1991 survey hss a f 3.6percent sampling error rate for governmentwide results. Further, when comparing 1989 governmentwide responses to 1991 governmentwide responses, the Merence must exceed f 8.7 percent (the 1301 sampling error rate off 3.6 percent plus the 1983 sampling error rate of f 6.1 percent) for the difference to be considered statistically significant and not attributable to sampling error.
Generally, our questionnaire gave respondents the option of indicating the extent that they agreed or disagreed with a statement, were satisfied or dissatisfied with a condition, or believed a statement was true or false. We did this to make it easier for respondents to select responses that closely reflected their views. However, we collapsed these categories of choices to facilitate analysis and reporting and denoted this in appendix V by using a “f between the collapsed optional choices. Therefore, for example, references in our report that respondents “believed” or “agreed” that certain conditions existed were based only on the percentage of respondents who (1) indicated that questionnaire statements were true in most or all cases or (2) agreed or strongly agreed with such questionnaire statements.
P@ge1)7 WGGD-B2-68SESSurvey
Appendix V
Responses to 1989 and 1991 Surveys of SES Members’ Views on the Federal Work Environment
sxs members responded to our November 1989 questionnaire during the period November 1989 to February 1990, and to our May 1091 questionnaire during the period May 1991 to August 1901. We reported their responses as views and perceptions and did not attempt to verify their views to determine if they reflected situations that existed at their departments. Xn reviewing the summa& ed results of these two surveys, it is important to understand that (1) the differences between percentages must exceed the sampling error rates associated with the percentages to be considered statistically significant and (2) we collapsed some of the response categories for better presentation of the results.
Signifkant Differences
The sampling error rates for career sxs members’ governmentwide responses to our two surveys are f 6.1 percent for the 1989 survey and f3.6 percent for the 1991 survey. For this reason, the difference between career SES members’ governmentwide responses in 1989 and those in 1991 must exceed f 8.7 percent to be considered significant and not due to sampling error.
We sent our 1901 survey to the entire universe of noncareer SES members, rather than a sample, at the 19 agencies and departments surveyed. Because we surveyed the entire universe, there is no sampling error rate associated with the responses from the 242 noncareer SES members who responded to our survey.
Collapsed Response Categories
Generally, we designed our questionnaire to give respondents the option of indicating the extent to which they agreed or disagreed with a statement, were satisfied or dissatisfied with a condition, or believed a statement was true or false. We did this to make it easier for respondents to select answers that closely reflected their views. However, we collapsed these categories of choices for clearer reporting and denoted them in this appendix by using a “/” between two collapsed optional choices. For example, some respondents in answering question 6 (a) elected to strongly agree, agree, neither agree nor disagree, disagree, or strongly disagree with a particular statement. We collapsed these five choices of response into three categories to facilitate analysis and discussion. The collapsed categories for this question are strongly agree/agree, neither, and strongly disagreddisagree.
Page58 GAOKGD-B2-52SESSnrvey
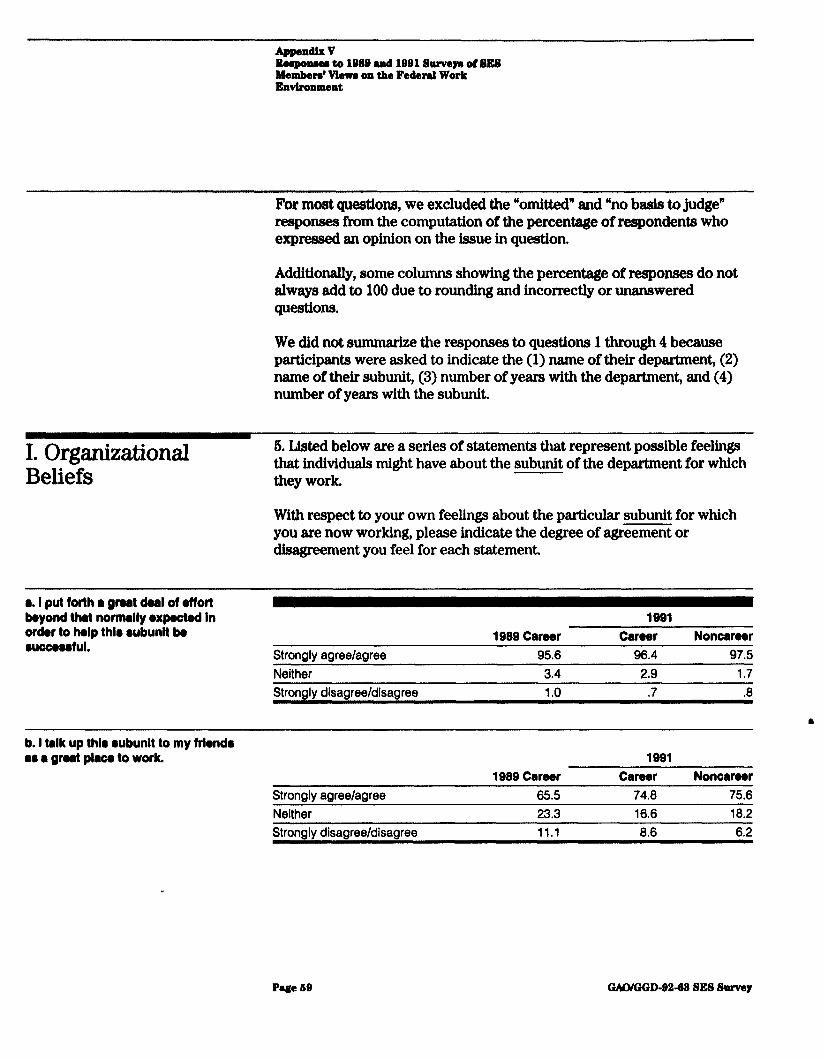
Ikmpuee to 1eSs and lBB1 snrveyr of SES Hembed Vlewe on the Federal Work Environment
For most questions, we excluded the “omitted” and “no basis to judge” responses from the computation of the percentage of respondents who expressed an opinion on the issue in question.
Additionally, some columns showing the percentage of responses do not always add to 100 due to rounding and incorrectly or unanswered questions.
We did not summarize the responses to questions 1 through 4 because participants were asked to indicate the (1) name of their department, (2) name of their subunit, (3) number of years with the department, and (4) number of years with the subunit.
I.Organizational Beliefs
6. Listed below are a series of statements that represent possible feelings that individuals might have about the subunit of the department for which they work.
With respect to your own feelings about the particular subunit for which you are now working, please indicate the degree of agreement or disagreement you feel for each statement.
a. I put forth I groat doal of offort beyond that normally l xpocted In or&r to help thlr rubunlt k WJeceutul. Strongly agree/agree
Neither
1989 Career 95.6
3.4
1991 Career
96.4 2.9
Noncareer 97.5
1.7 Strongly disagree/disagree 1.0 .7 .8
b
b. I talk up thlr l ubunlt to my Mend8 w I great place to work.
1989 Career 1991
Career Noncareer Strongly agree/agree 65.5 74.8 75.6 Neither 23.3 16.6 18.2 Strongly disagree/disagree 11.1 8.6 6.2
Page I@ GMWGD-@2-62 SES Survey
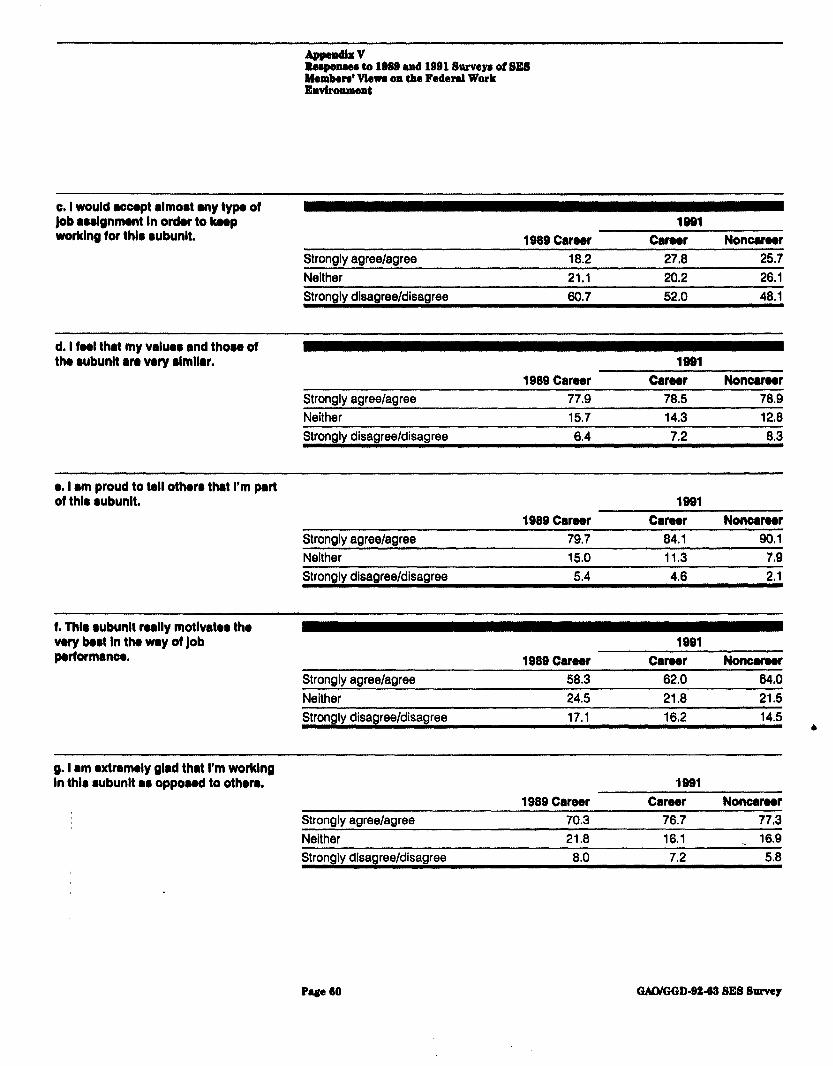
Reezioneee to LWB and 18Bl8umur of SES Merpksra’ Vlew on the Federal Work Envtronment
CI. I would rcrwpt almort l iy typo of Job anlgnment In ardor to knp worklng for thlr rubunlt.
Strongly agree/agree Neither
1989 Career 16.2 21.1
1991 Careor
27.8 20.2
Noncaroar 25.7 26.1
Strongly disagree/disagree 60.7 52.0 48.1
d. I fool that my vrluoo and thou of the rubunlt an very rlmllar. 1991
1989 Career Career Noncarcnr Strongly agree/agree 77.9 78.5 78.9 Neither 15.7 14.3 1208 Strongly disagree/disagree 6.4 7.2 8.3
l . I am proud to tell othore that I’m part of thlr l ubunlt.
1989 Caner 1991
Caroor Noncamr Strongly agree/agree 79.7 84.1 90.1 Neither 15,o 11.3 7.9 Strongly disagree/disagree 5.4 4.6 2.1
f. lhlr rubunlt really motlvator the wry bwt In thr way of Job performanoa 1989 Career
1991 Carwr Noncamr
Strongly agree/agree 58.3 62.0 64*0 Neither 24.5 21.8 21.5 Strongly disagree/disagree 17.1 16,2 14.5
b
Q. I rm extrrmoly glad that I’m working In thlo rubunlt ao oppoud to other& 1991
1989 Career Career Noncaroor Strongly agree/agree 70.3 76.7 77.3 Neither 21.8 1601 . 16.9 Strongly disagree/disagree 8.0 7.2 5.8
Page 60 WGGD-92-62 SE8 Survey
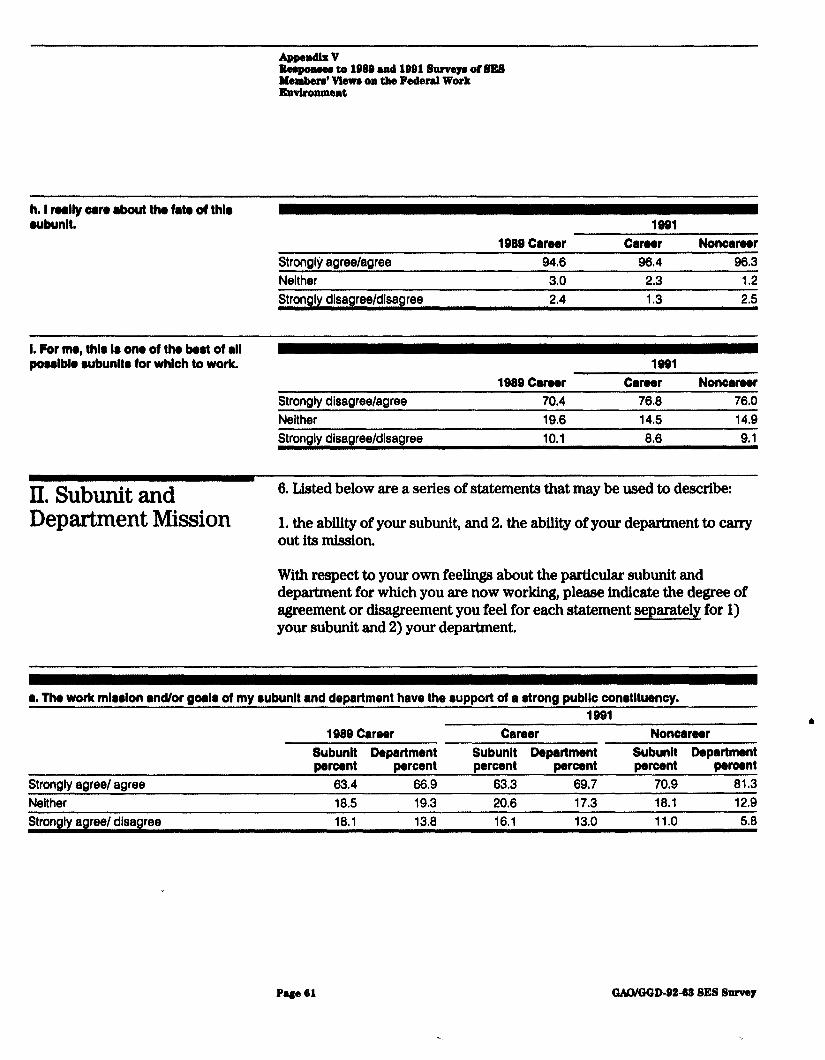
Reeponam to 1989 and lBB1 Surveya of SES Men&era’ VIewe on the Federal Work Environment
h. I really owe about the fate of thlo rubunlt,
StronglY asree/agree 1989 Career
94.6
1991 Career
96.4 Noncarwr
96.3 Neither 3,o 2.3 1.2 Strongly disagree/disagree 2.4 1.3 2.5
1. For me, thla la one of the bwt of all poulbk l ubunltr for which to work.
1989 Carwr 1991
Career Noncareer Strongly disagree/agree 70.4 76.8 76.0 Neither 19.6 14.5 14.9 Strongly disagree/disagree 10.1 8.6 9.1
II.Subunitand 6. L&ted below are a series of statements that may be used to describe:
Department Mission 1. the ability of your subunit, and 2. the ability of your department to carry out its mission.
With respect to your own feelings about the particular subunit and department for which you are now working, please indicate the degree of agreement or disagreement you feel for each statement separately for 1) your subunit and 2) your department.
1. The work mlwlon rndlor goal@ of my rubunlt and department have the rrupport of a strong public conBtltuency.
1989 Career Subunit Department wrcsnt oercent
1091 Career
Subunlt Department wrcent wrcent
Noncarwr Subunlt Department wrcent wrcent
Strongly agree/ agree 63.4 66.9 63.3 69,7 70.9 81.3 Neither 18.5 19.3 20.6 17.3 18.1 12.9 Strongly agree/ disagree 18.1 13.8 16.1 13.0 11.0 5.8
Page 81 CJAD/CND-B2-62 SE8 Suwey
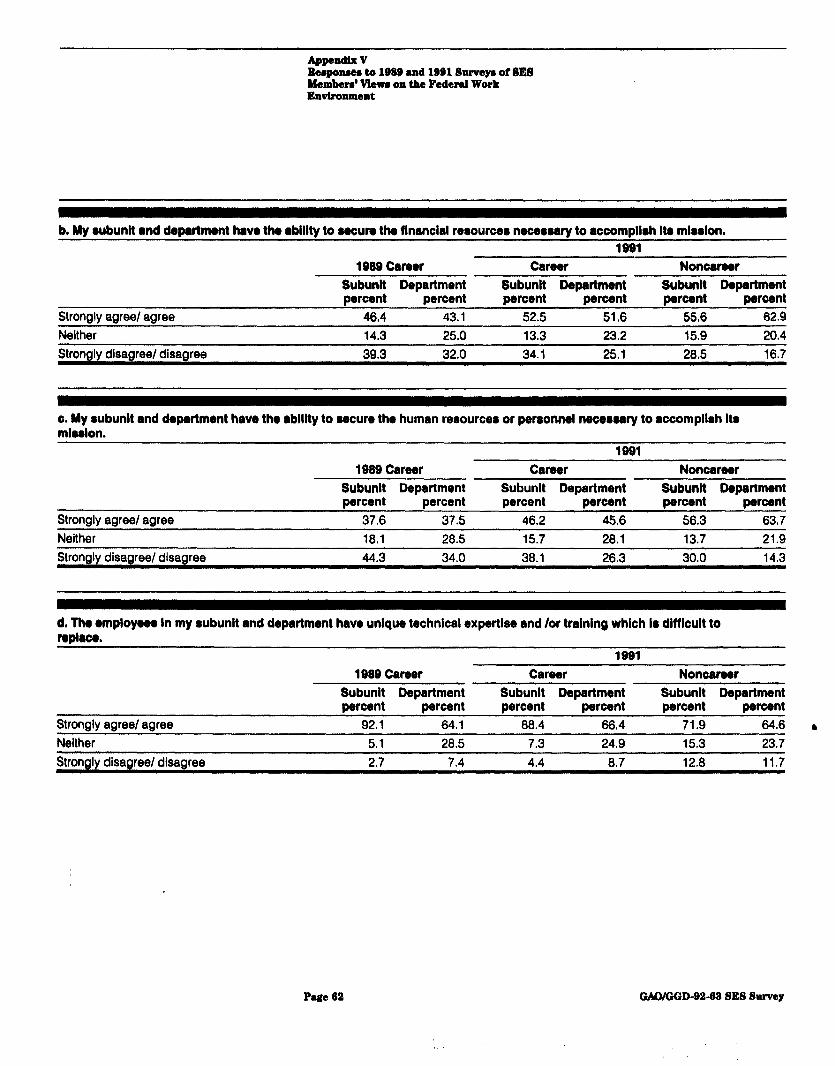
Bemponsea to 1BBB and lBS1 Surveyu of SE8 Mambere’ VIewe on tke Federal Work Envtronmant
b. My wbunlt and department havr the rblllty to wcure the flnanclel resources necwwrv to accompllrh Itr mlwlon. 1991
1989 Career Csrwr Noncarwr Subunlt Department Subunlt Department Subunlt Department percent percent percent percent percent percent
Strongly agree/ agree 4604 43.1 52.5 51.6 55.6 62.9 Neither 14.3 25.0 13.3 23.2 15.9 20.4 Stronalv disaaree/ disaaree 39.3 32.0 34.1 25.1 28.5 16.7
0. My l ubunlt and department have the rblllty to wcure the human resources or personnel necweary to occompllrh It8 mlwlon.
1991 1989 Cereer
Subunlt Department percent percent
Carwr Subunit Department percent percent
Noncarwr Subunlt Department percent wrcent
Strongly agree/ agree 37.6 37.5 46.2 45.6 56.3 63.7 Neither 18.1 28.5 15.7 28.1 13.7 21.9 Strongly disagree/ disagree 44.3 34.0 38.1 26.3 30.0 14.3
d. Tha employwa In my subunit and deportment have unlque technlcel expertise end /or training which Is dlfflcult to replace.
1991 1989 Career Cerwr Noncarwr
Subunit Department Subunlt Deportment Subunlt Deportment Percent Percent Percent percent wrcent oercent
Strongly agree/ agree 92.1 64.1 88.4 66.4 71.9 64.6 1, Neither 5.1 26.5 7.3 24.9 15.3 23.7
Strongly disagree/ disagree 2.7 7.4 4.4 8.7 12.8 11.7
Y
Page 02
,
WGGD-S2-62 SE8 Suwey
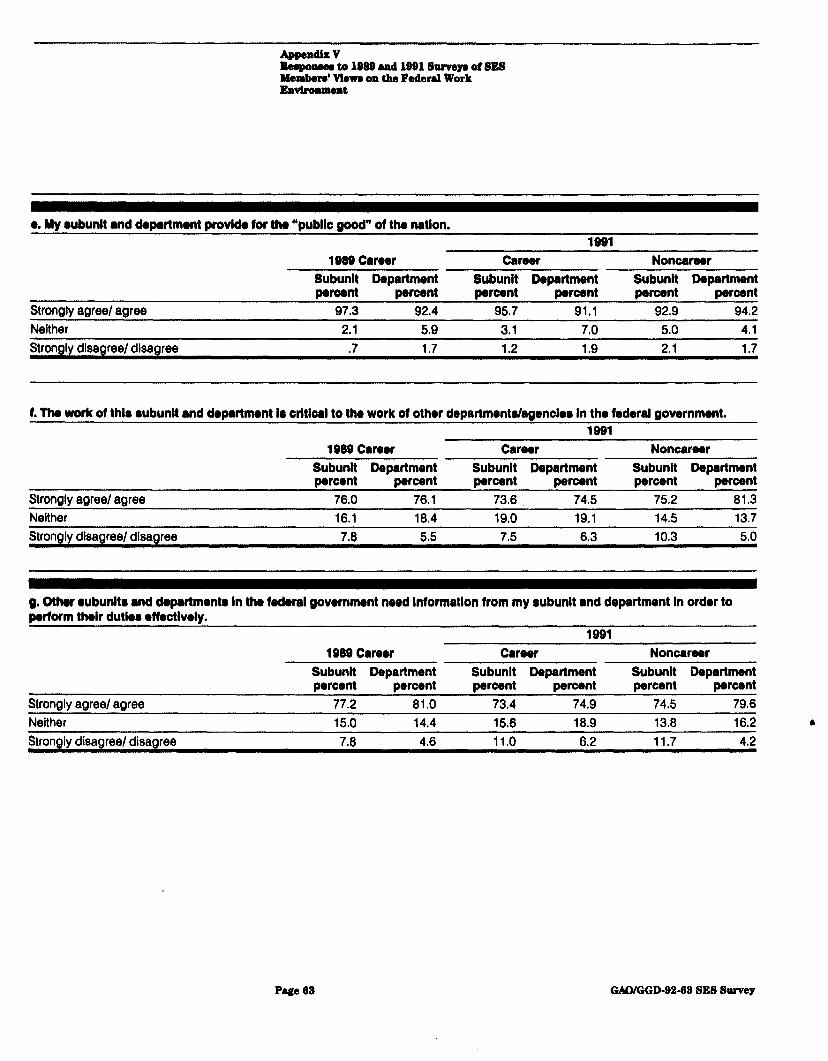
Beeporn to 1988 and 1991 Surveya of SES Memben’ View on tke Feds4 Work Envlronmeat
l . My rubunlt and depertmont provide for the “public good” of the n&Ion. 1991
1989 Carwr Crrwr Noncarwr Subunlt Deportment Subunit Department Subunlt Department prrwnt percent oercent oercent oercent wrcent
Strongly agree/ agree 97.3 92.4 95.7 91.1 92.9 94.2 Neither 2.1 5.9 3.1 7.0 5.0 4.1 Strongly disagree/ disagree .7 1.7 1.2 1.9 2.1 1.7
f. l’ho work of thle rubunlt and drpartment IO crltlcal to the work of other departments/agenclw In the federal government. 1991
1989 Coreor Careor Noncarwr Subunlt Department Subunit Department Subunlt Department percent percent percent percent percent perwnt
Strongly agree/ agree 76.0 76.1 73.6 74.5 75.2 81.3 Neither 16.1 18.4 19.0 19.1 14.5 13.7 Strongly disagree/ disagree 708 5.5 7.5 6.3 10.3 5.0
g. Other rubunltr and depertmentr In the fedoral government need Inform&Ion from my rubunlt and department In order to priform their dutlw l ffectlvol~.
1989 Corwr Corwr Noncarwr Subunlt Department Subunlt Department Subunlt Deportment percent percent percent percent percent percent
Strongly agree/ agree 77.2 81.0 73.4 74.9 74.5 79.6 Neither 15.0 14.4 15.6 18.9 13.8 16.2 Strongly disagree/ disagree 7.8 4.6 11.0 6.2 11.7 4,2
Page 68 GMMGGD-92-62 SE8 Su~ey
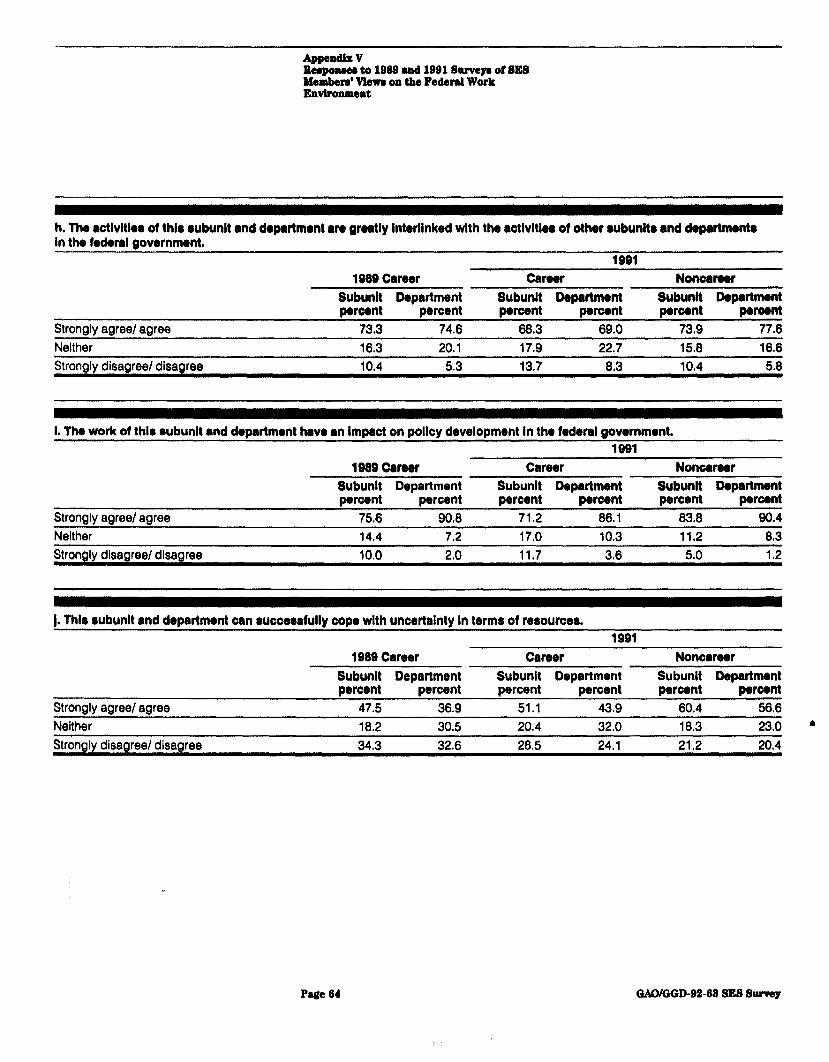
lteepomea to 1DSS and lB@l Surveya of 8ES Manben’ Vtewe on tlw Federal Work Envtronmant
h. The rctlvltier of thlr l ubunlt and dopertmont m greatly Interlinked wlth the actlvltler of other l ubunlto and department8 In the kderal government.
1991 1969 Career Career Nonwroor
Subunit Department Subunit Department perwnt percent perwnt perwnt
S$rt~ Department porwnt
Strongly agree/ agree 73.3 74.6 68.3 69.0 73.9 77.6 N&her 16.3 20.1 17.9 22.7 15.6 16.6 Strongly disagree/ disagree 10.4 5.3 13.7 603 10.4 5.6
I. TM work of thlo l ubunlt and dopartmmt havr an Impact on policy development In the federal government. 1991
1989 Cttrwr Career Noncareor Subunlt Department Subunlt Department Subunit Department percent percent percent percent percent perwnt
Strongly agree/ agree 7506 90.6 71.2 86.1 83.8 90.4 Neither 14.4 7.2 17.0 10.3 11.2 6.3 Strongly disagree/ disagree 10.0 2.0 11.7 3.6 5.0 1.2
1. Thlr rubunlt and department wn ruccerrfully cope with uncertainty In terms of resources. 1991
1989 Career Career Subunit Department Subunit Department percent percent percent percent
Strongly agree/ agree 47.5 36.9 51.1 43.9
Noncareer Subunlt Departmant perwnt perwnt
60.4 56.6 Neither 18.2 30.5 20.4 32.0 18.3 23.0 . Stronalv disaareel disaaree 34.3 32.6 28.5 24.1 21.2 20.4
Page 64 GAANGGD-92-68 SES Survey
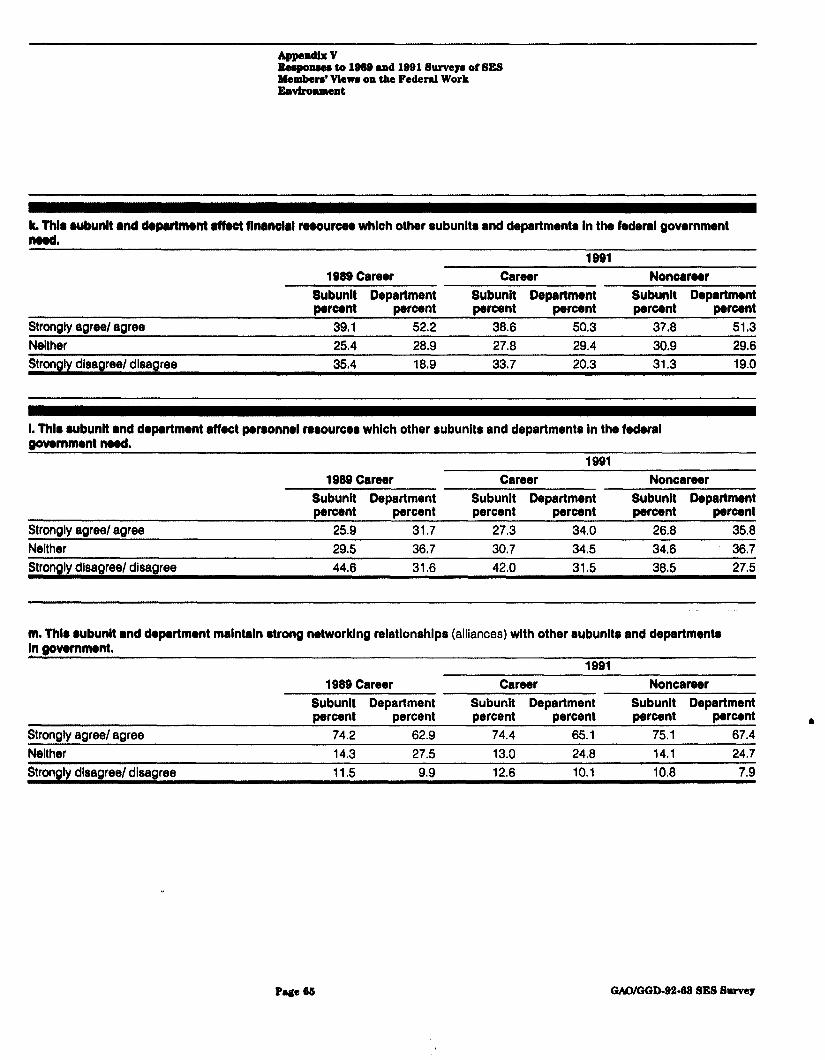
lkqoneea to 1989 and 1981 Surveya of 8ES Men&err Viewe on the Federal Work Envtronmant
k. l’hla aubunlt and dapartmant affact flnanolrl naourcoa which other aubunlta and departments In the federal government mod.
1991 1889 Career Career
Subunlt Department Subunit Department Nonwrear
Subunlt Department parwnt percent percent parwnt parwnt parwnt
Strongly aaree/ spree 39.1 52.2 36.6 50.3 37.6 51.3 Neither 25.4 26.9 27.6 29.4 30.9 29.6 Strongly disagree/ disagree 35.4 16.9 33.7 20.3 31.3 19.0
I. Thla aubunlt l d department affect paraonnal resources which other subunits and departments In the federal oovunment need.
1991 1989 Career Career Noncareer
Subunlt Department Subunlt Department Subunlt Department perwnt percent percent percent perwnt parwnt
Strongly agree/ agree 25.9 31.7 27.3 34.0 26.6 35.6 Neither 29.5 36.7 30.7 34.5 34.6 36.7 Stronalv disagree/ disaaree 44.6 31.6 42.0 31.5 36.5 27.5
m. lhla subunit and department malntaln strong networklng relatlonshlps (alliances) wlth other subunits and departmanta In povammant.
1991 1969 Career Career Noncaraar
Subunit Department Subunlt Department Subunit Department percent percent percent percent percent parwnt
Strongly agree/ agree 74.2 62.9 74.4 65.1 75.1 67.4 Neither 14.3 27.5 13.0 24.6 14.1 24.7 Stronalv dlsaareel dlsaaree 11.5 9.9 12.6 10.1 10.6 7.9
Page 81 GAf3/GGD.B242 SE8 Survey
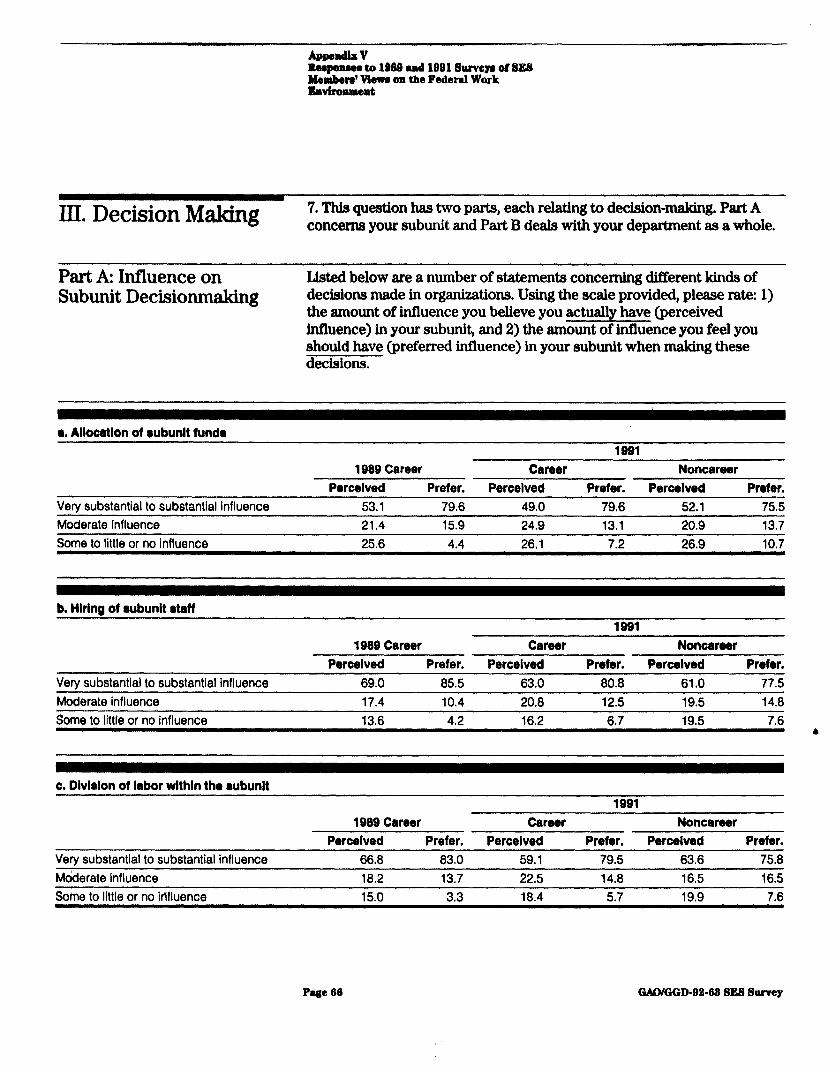
III. DecisionMaking 7. This question has two parts, each relating to decision-making, Part A concerns your subunit and Part B deals with your department as a whole.
Part A: Influence on Subunit Decisionmaking
Listed below are a number of statem+s concerning different kinds of decisions made in organizations. Using the scale provided, please rate: 1) the amount of influence you believe you actually have (perceived influence) in your subunit, and 2) the amount of influence you feel you should have (preferred influence) in your subunit when making these decisions.
a. Allocation of l ubunlt fund8
1989 Career Career Noncareer Perceived Prefer. Perceived Prefer. Perceived Prefer.
Very substantial to substantial influence 53.1 79.6 49.0 79.6 52.1 75.5 Moderate influence 21.4 15.9 24.9 13.1 20.9 13.7 Some to little or no influence 25.6 4.4 2691 7.2 26.9 10.7
b. Hlrlng of l ubunlt staff 1991
1989 Career Career Noncareer Perceived Prefer. Perceived Prefer. Perceived Prefer.
Very substantial to substantial influence 69.0 85.5 63.0 80.8 61.0 77.5 Moderate influence 17.4 10.4 20.8 12.5 19.5 14.8 Some to little or no influence 13.6 4.2 16.2 6.7 19.5 7.6
&
c. Dlvlrlon of labor wlthln the l ubunlt 1ssi
1989 Career Career Noncareer Perceived Prefer. Perceived Prefer. Perceived Prefer.
Vely substantial to substantial influence 66.8 83.0 59.1 79.5 63.6 75.8 f&Aerate influence 18.2 13.7 22.5 14.8 16.5 16.5 Some to little or no Mfluence 15.0 3.3 18.4 5.7 19.9 7.6
Page 66 GMMGD-92-68 SE8 Sn~ey
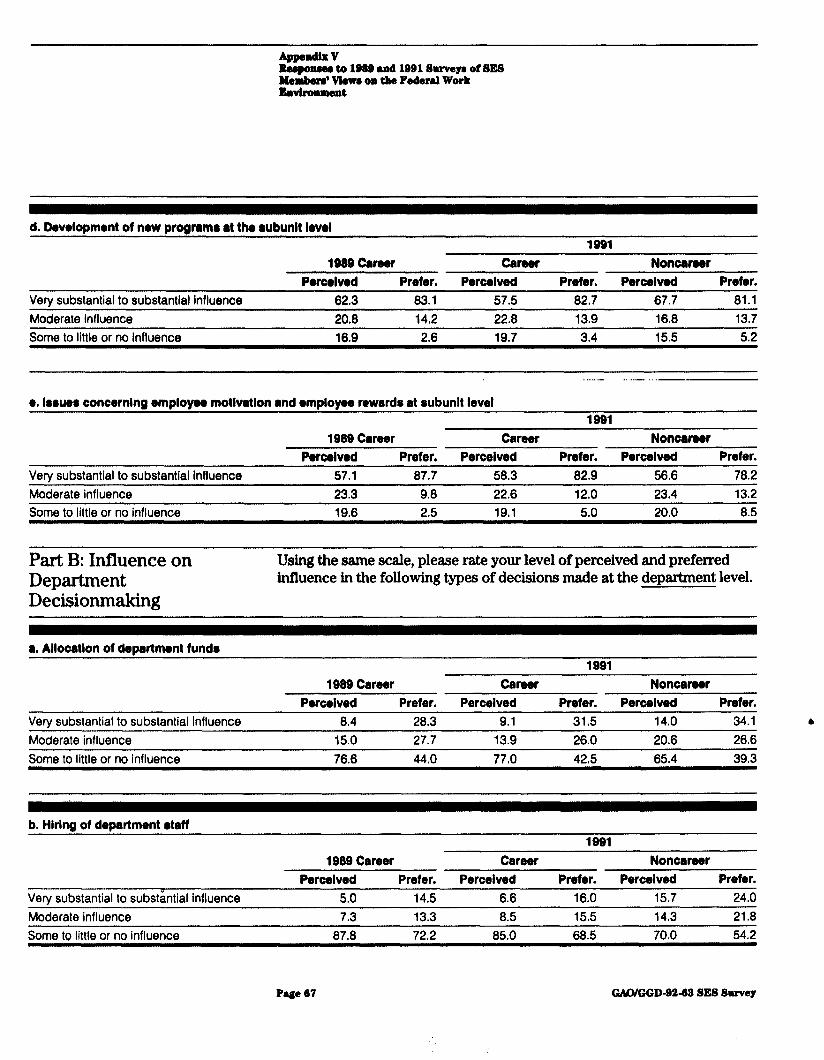
tkqonuu fo 1989 and 1891 Surveya of 8ES Members’ VIewe on the Federal Work Env&onment
d. Development of new Drogmmo rt the rubunlt Iovol 1991
1999 Career Career Noncareer Porcelvod Prefer. Percelved Prefer. Percelved Prefer.
Very substantial to substantial influence 62.3 83.1 57.5 82.7 67.7 81.1 Moderate influence 20.8 14.2 22.8 13.9 16.8 13.7 Some to little or no influence 16.9 2.6 19.7 3.4 15.5 5.2
e. leruer concerning employee motlvatlon and l mployeo reward8 at subunlt level 1991
1989 Career Career Noncereer Porcelved Prefer. Perceived Prefer. Perceived Prefer.
Vetv substantial to substantial influence 57.1 87.7 58.3 82.9 56.6 78.2 Moderate influence 23.3 9.8 22.6 12.0 23.4 13.2 Some to little or no influence 19.6 2.5 19.1 5.0 20.0 a.5
Part B: Influence on Department Decisionmaking
Using the same scale, please rate your level of perceived and preferred influence in the following types of decisions made at the department level.
8. Allocatlon of department funda
1989 Career Career 1991
Noncareer Percelved Prefer. Perceived Prefer. Perceived Prefer.
Very substantial to substantial Influence a.4 28.3 9.1 31.5 14.0 34.1 Moderate influence 15.0 27.7 13.9 26.0 20.6 26.6 Some to little or no influence 76.6 44.0 77.0 42.5 65.4 39.3
b. HIrIng of department l taff 1991
1989 Career Career Noncareer Perceived Prefer. Perceived Prefer. Perceived Prefer.
Very substantial to substantial influence 5.0 14.5 6.6 16.0 15.7 24.0 Moderate influence 7.3 13.3 a.5 15.5 14.3 21.8 Some to little or no influence 87.8 72.2 85.0 68.5 70.0 54.2
Page 67 GAWGGD-92-02 SE8 Survey
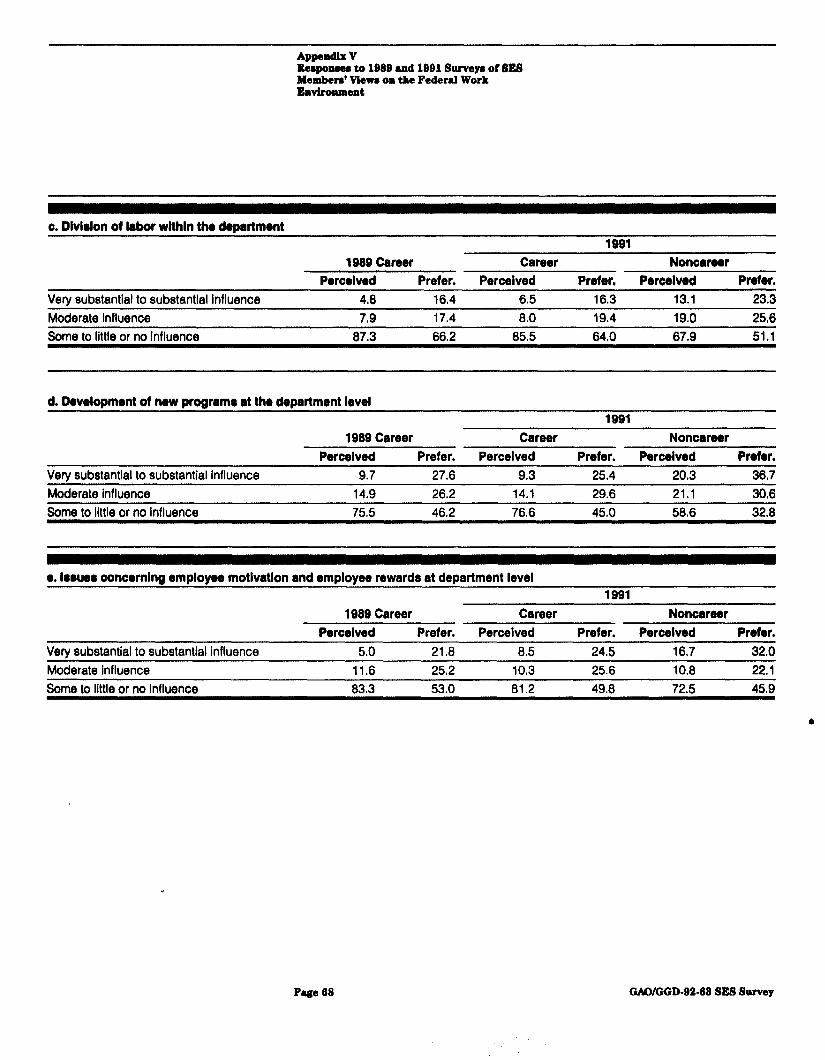
Eeqoneee to 1888 and lOB1 &uv~ya of SES Memben~ Vlewe on the Federal Work Envtrolunant
0. Dlvlrlon of labor wlthln the dopartmont
1989 Career Career 1991
Noncrreer Perceived Prefer. Perceived Prefer, Percelved Prefer.
Very substantial to substantial Influence 4.8 1694 6.5 16.3 13.1 23.3 Moderate Influence 7.9 17.4 6.0 19.4 19.0 25.6 Some to little or no Influence 87.3 66.2 85.5 64.0 67.9 51.1
d. Devolopmont of now program8 at thr department level 1991
1999 Career Career Noncareer Perceived Prefer. Perceived Prefer. Perceived Prefer.
Verv substantial to substantial influence 9.7 27.6 9.3 25.4 20.3 36.7 Moderate influence 14.9 Some to little or no Influence 75.5
26.2 14.1 29.6 21.1 30.6 46.2 76.6 45.0 58.6 32.8
l . Irouer concorning employee motlvatlon and employee rewarda at department level 1991
1989 Career Career Noncareer Perceived Prefer. Perceived Prefer. Perwlved Prefer.
Very substantial to substantlal influence 5.0 21.8 a.5 24.5 16.7 32.0 Moderate influence 11.6 25.2 10.3 25.6 10.6 22.1
Some to little or no Influence 83.3 53.0 81.2 49.8 72.5 45.9
Page 68 GMMWD-82.62 SE8 Survey
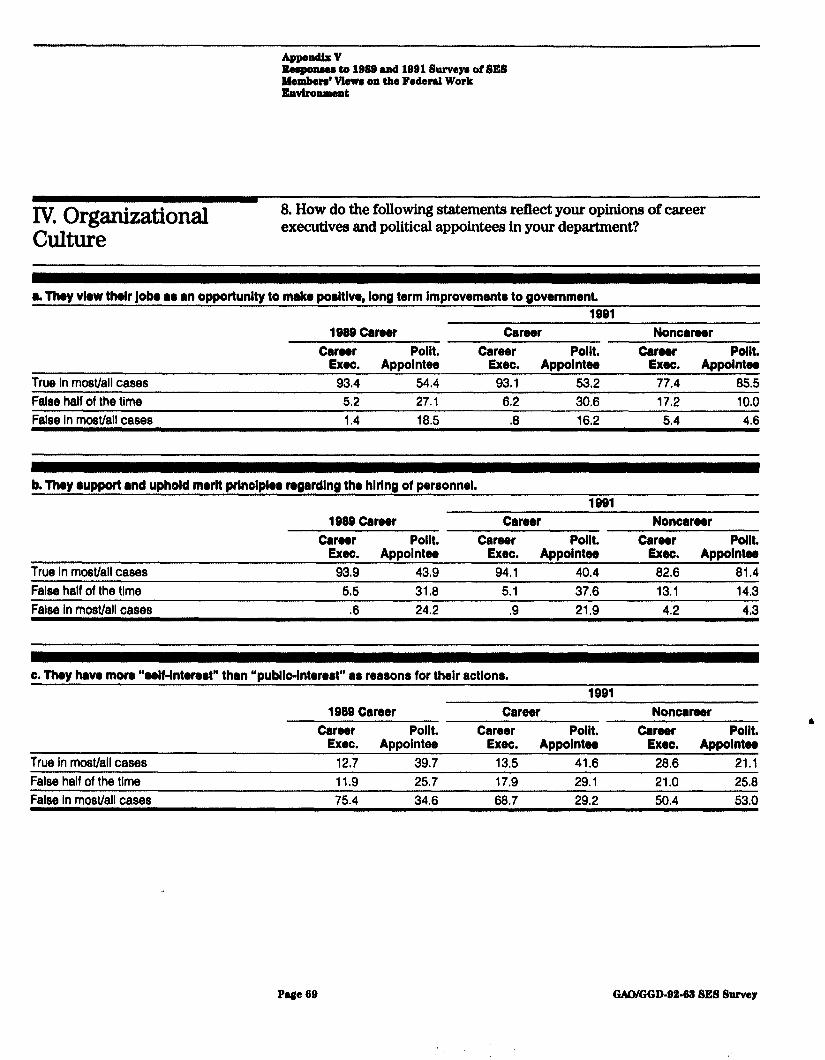
Iv. Organizational Culture
8. How do the following statements reflect your opinions of career executives and political appointees in your department?
a. ‘WY claw tholr lobr IO an oooortunltv to make wrltlve. lona term Imorovemants to sovemment. 1091
1989 Career Career Noncarwr Carwr Pollt. Career Pollt. Carwr Pollt.
Exoc. Appointee Exec. Appolntw Exec. Appolntw True In most/all cases 93.4 54.4 93.1 53.2 77.4 85.5 F&II89 half of the time 5.2 27.1 6.2 30.6 17.2 10,o False in most/all cases 1.4 18.6 .8 16.2 5.4 4.6
b. T’hav support and uPhold morlt PrlnolDloa narrdlnn the hlrlna of Derronnel. 1991
True In most/all cases
1989 Career Carwr Carwr Pollt. Career Pollt.
Exec. Appolntw Exec. Appolntw 93.9 43.9 94,l 40.4
Noncarwr Carwr Pollt.
Exec. Appolntw 82.6 81.4
False half of the time 5.5 31.8 5.1 37.6 13.1 14.3 Fal8e In most/all cases -6 24.2 .9 21.9 4.2 4.3
(1. l’hoy have mon “wlf-lntorwt” than 8‘publlo-lntorwt” a8 reasons for their actlons. 1991
1989 Caner Carwr Noncarwr Carwr Pollt. Career Pollt. Carwr Pollt.
Exec. Appointee Exec. Appolntw Execc. Appolntw True In most/all cases 12,7 39.7 13.5 41.6 28.6 21.1 False half of the time 11.9 25.7 17.9 29.1 21.0 25.8 False In most/all cases 75.4 34.6 68.7 29.2 50.4 53.0
PMC 89 GAQJGGD-82.22 SE8 Survey
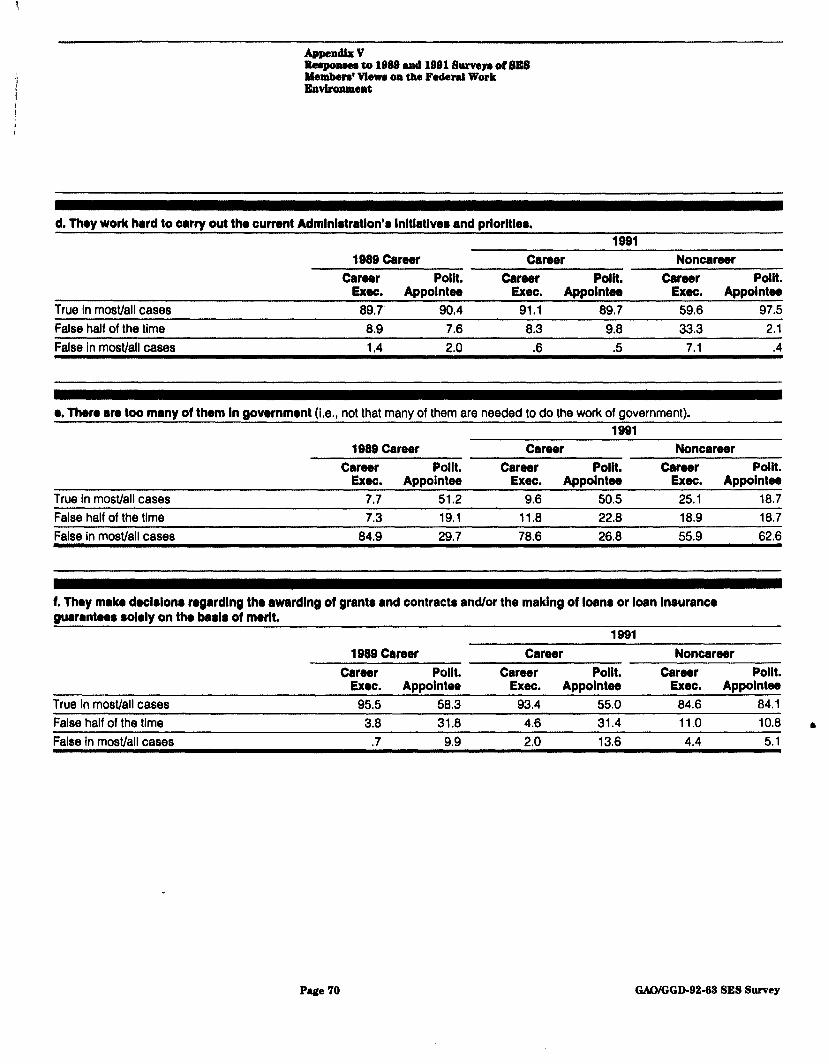
%aponaea to lBS8 and 1m surveym of SES Membera Wewa on the FedmaJ Work Envtronment
d. They work hard to oarry out the current Admlnlstratlon’a Inltlatlvea and prlorltlea. 1991
1989 Career Career Carwr Pollt. Carwr Pollt.
Exec. ADPolntw Exec. ADDOhtW
Noncarwr Career Pollt.
Execc. ADPOhtW
True In most/all cases 89.7’ 90.4 91.1 89.7 59.6 97.5 False half of the time 8.9 7.6 8.3 9.8 33.3 2.1 False in inO8thll cases 1.4 2.0 $6 .5 7.1 .4
a. There are too many of them In government (Le., not that many of them are needed to do the work of government). 1991
1989 Career Career Noncarwr Carwr Pollt. Career Pollt. Carwr Pollt.
Exw. ADDOhItW Exec. ADDOhltW Exec. ADDOintW
True in most/all cases 7.7 51.2 9.6 50.5 25.1 18.7 False half of the time 7.3 19.1 11.8 22.8 18.9 18.7 False in most/all cases 84.9 29.7 78.6 26.8 55.9 62.6
f. They make declslona regarding the awardlng of grants and contracts and/or the making of loans or loan Insurance guarantwa l olmly on the baala of merit.
1991 1989 Career Career Noncarwr
Carwr Pollt. Career Pollt. Career Pollt. Exec. Appolntee Exec. Appolntw Exec. Appolntw
True in most/all cases 95.5 58.3 93.4 55.0 84.6 84.1 False half of the time 3.8 31.8 4.6 31.4 11.0 10.8 1, False In most/all cases .7 9.9 2.0 13.6 4.4 5.1
Page 70 GAO/GGD-92-63 SES Survey
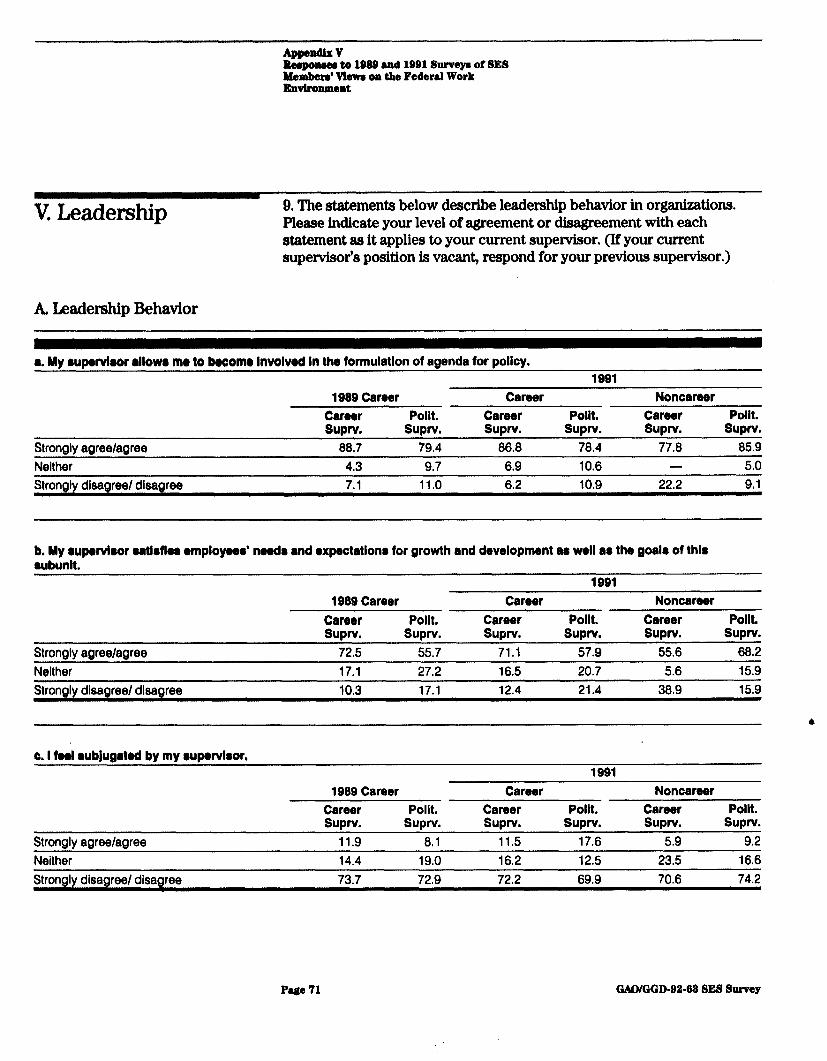
Empwsea to 1922 and lSB1 Survep of SES Idembcd Vhwa on the Federal Work Environment
K Leadership 9. The statements below describe leadership behavior in organizations. Please indicate your level of agreement or disagreement with each statement as it applies to your current supervisor. (If your current supervisor’s position is vacant, respond for your previous supervisor.)
k kadership Behavior
a. My aupervlaor allows mo to become Involved In the formulation of agenda for policy. 1991
1989 Career Career Noncarwr Career Pollt. Career Pollt. Carwr Pollt. suprv. suprv. suprv. suprv. suprv. suprv.
Strongly agree/agree 88.7 79.4 86.8 78.4 77.8 85.9 Neither 4.3 9.7 6.9 10.6 - 5.0 Strongly disagree/ disagree 7.1 11.0 6.2 10.9 22.2 9.1
b. My aupervlaor aatlaflea l mploywa’ needs and oxpectatlona for growth and development as well as the goals of thla aubunlt.
1991 1989 Career Career Noncarwr
Career Pollt. Career Pollt. Career Pollt. supw. supnf. suprv. suprv. suprv. supnr.
Strongly agree/agree 72.5 55.7 71.1 57,9 55.6 68.2 Neither 17.1 27.2 16.5 20.7 5.6 15.9 Strongly disagree/ disagree lo,3 17.1 12.4 21.4 38.9 15.9
c. I feel subjugated by my aupervlaor, 1991
1989 Career Career Noncarwr Career Pollt. Career Pollt. Career Pollt. suprv. suprv. suprv. suprv. suprv. suprv.
Strongly aaree/aaree 11.9 8.1 11.5 17.6 5.9 9.2 Neither 14.4 19.0 16.2 12.5 23.5 16.6 Strongly disagree/ disagree 73.7 72.9 72.2 69.9 70.6 74.2
Page 71 GAWGGD-92-68 SES Survey
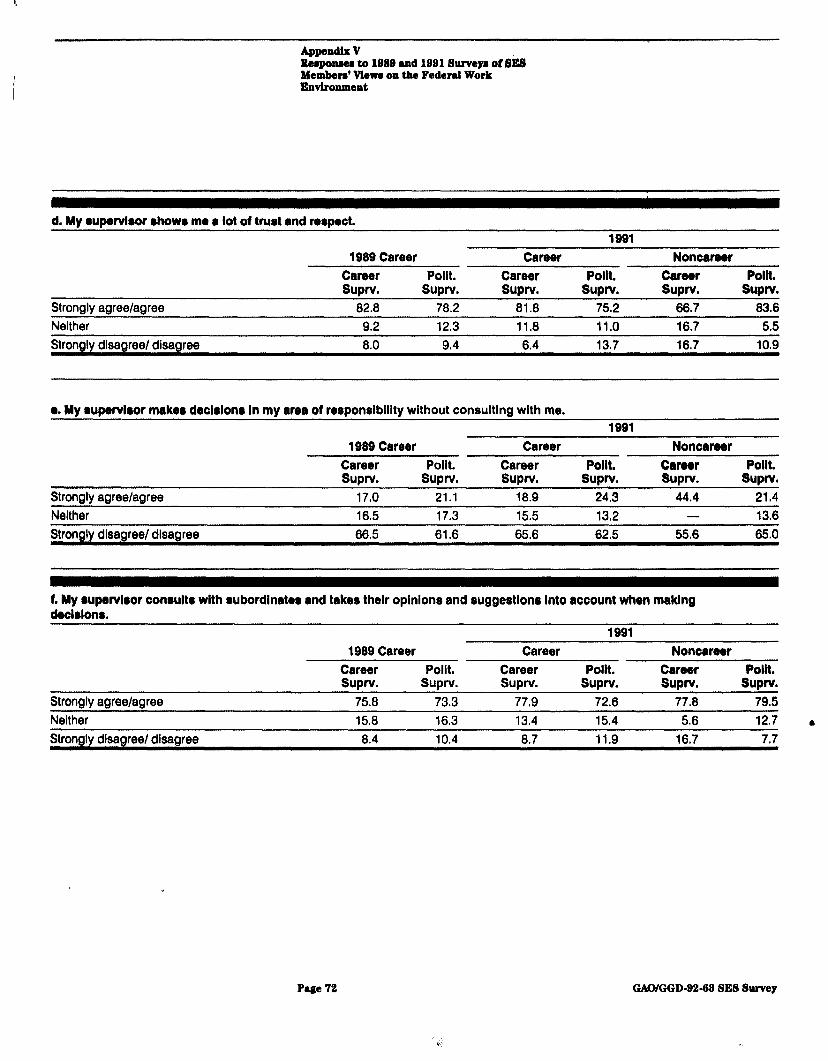
Appendix V Ilerpolwr to 1888 and 1981 Surveys of SES Memben’ Mewe on the Federal Work Envlronmcmt
d. MY l ~rvlsor 8howr mo a lot of trust and n8pect. 1991
1989 Career Career Noncareer Career SUPN.
Polit. SUPN.
Career SUPN.
~Polli ~- Career SUPN. &lpN.
Polit. suprv.
Strom& aaree/anree 82.8 78.2 81.8 75.2 66.7 83.6 Neither 9.2 12.3 11.8 11.0 16.7 5.5 Strongly disagree/ disagree 6.0 9.4 6.4 13.7 16.7 10.9
0. M Y suDeNl8or makes declsionr in my area of resPonslbllltY without consultIn with me. 1991
1989 Career Career Noncarser Career Polk. Career Pollt, Caraar Pollt. SUPN. SUPN. SUPN. SUPN. SUPN. SUPN.
Strongly agree/agree 17.0 21.1 16.9 24.3 44.4 21.4 Neither 16.5 17.3 15.5 13.2 - 13.6 Strongly disagree/ disagree 66.5 61.6 65.6 62.5 55.6 65.0
1. My aupstvlror consults with subordinate8 and takes thelr opinions and suggestions Into account when maklng dsclslonr.
1 Q91 1989 Career Career Noncareer
Career Pollt. Career Pollt. Career Pollt. SUPN. SUPN. SUPN. SUPN. SUPN. SUPN.
Strongly agree/agree 75.8 73.3 77-9 72.6 77.6 79.5 Neither 15.8 16.3 13.4 15.4 5.6 12.7 l
Strongly dlsagreel disagree 8.4 10.4 8.7 11.9 16.7 7.7
Page72 GAKMXD-92.82SESSurvey
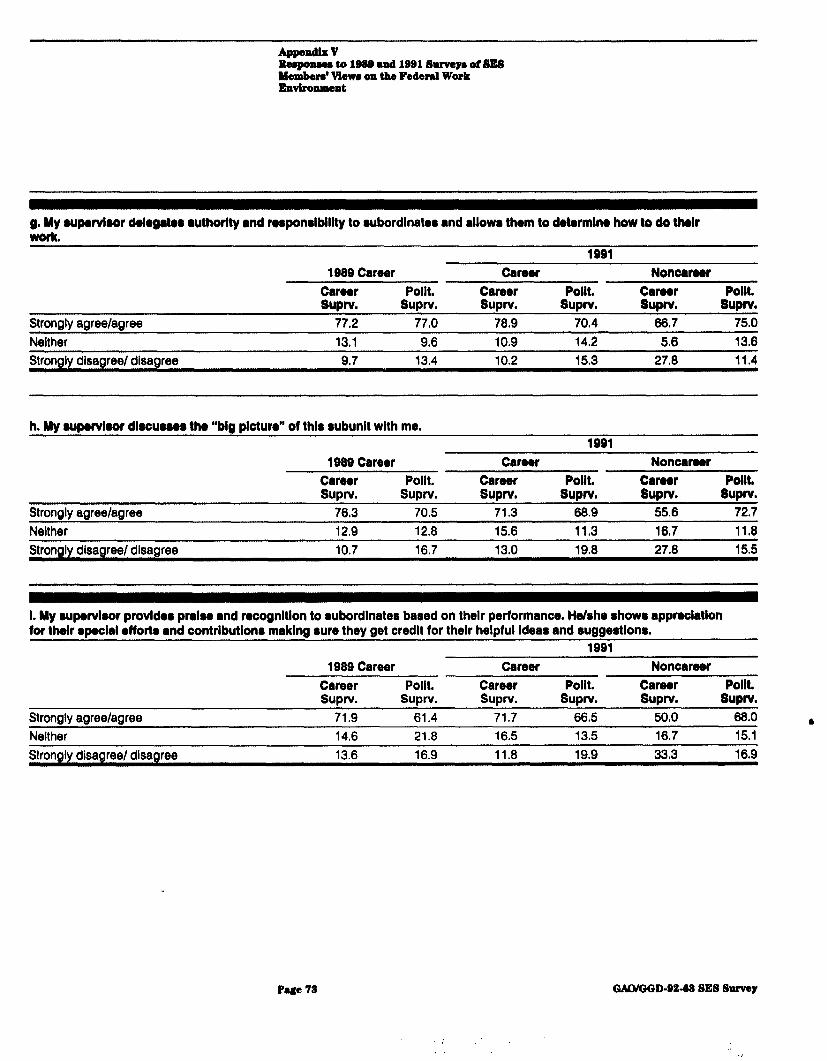
R4wpowatol@Ssnndl9BlsluveporsEs felemilwe on tke Federal Work
g. My auparvtaor delegataa l uthorlty and raaponalblllty to aubordlnatea and allows them to datarmlna how to do thalr WWIL
1991 1989 Career Carear Noncaraar
Caraar Pollt. Career Pollt. Caraer Pollt. SUPN. SUPN. &lpN. suprv. suprv. 8UpN.
Strongly agree/agree 77.2 77.0 76.9 70.4 66.7 75.0 Neither 13.1 9.6 10.9 14.2 5.6 13.6 Stronolv disaoree/ disaaree 9.7 13.4 10.2 15.3 27.6 11.4
h. MY aut#arvlaor dlacuaaaa tha “bla plctun” of thla subunit with me.
198Q Career Career Noncarear Caraar Pollt. Career Pollt. Caraar Pollt. SUPN. SUPN. 8UPN. 8UPN. 8UpN. suprv.
Strongly agree/agree 76,3 7005 71.3 66.9 55.6 72.7 Neither 12.9 12.8 15.6 11.3 16.7 11,8 Strongly disagree/ disagree 10.7 16.7 13.0 19.8 27.8 15.5
I. My ruparvlaor provldoa pralsa and racognltlon to aubordlnates based on thelr performance. He/she shows approclatlon for their l peclal l fforto l d contrlbutlona making aure they get credit for thelr helpful Ideas and ruggestlona.
1991
1 Q89 Career Career Noncrrear Career Pollt. Career Pollt. Career Pollt. SUPW. suprv. SUPN. suprv. supw. SUPN.
Stronolv aareelaoree 71.9 61.4 71.7 66,5 50.0 66.0 Neither 14.6 21.8 16.5 13.5 16.7 15.1 Strongly disagree/ disagree 13.6 16.9 11.8 19.9 33,3 16.9
l
Page 78 WWD-St-d2 SE8 Survey
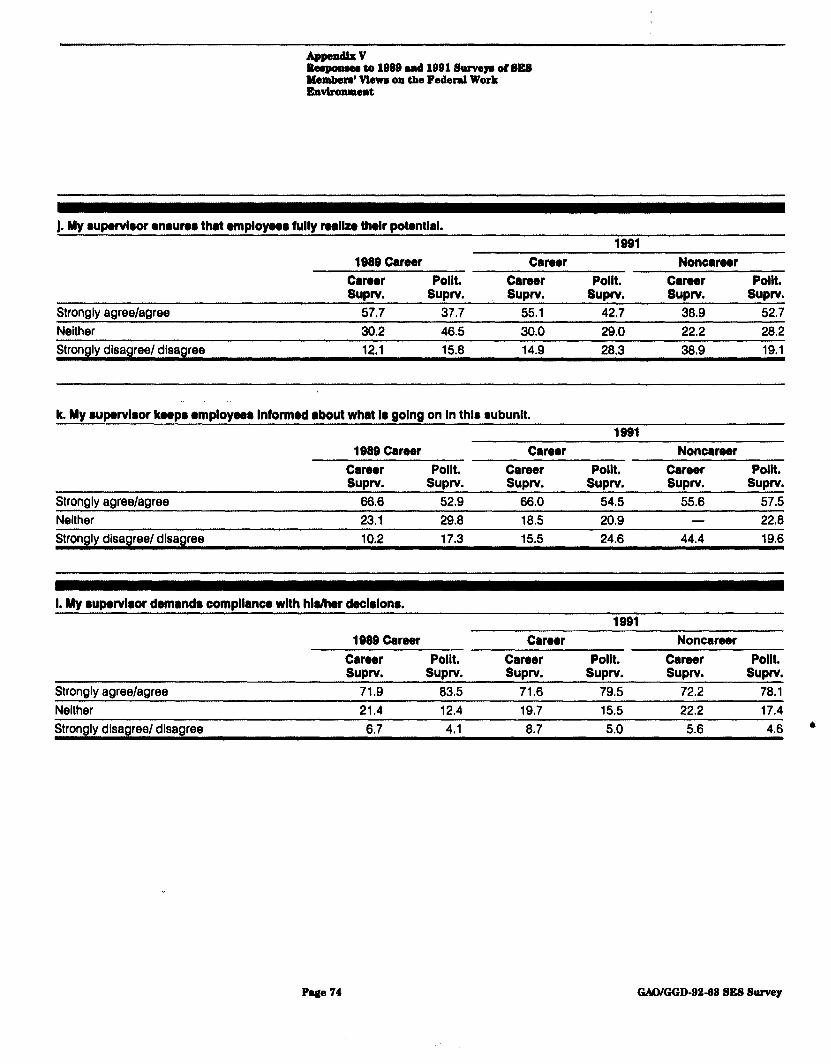
lkqKmme to 1888 and 1001 S9rvU~ of SEB Membam’ View on the Federal Work Environment
1. My l upervlaor l nauno that l mployaaa fully raallae thalr potential. 1991
1980 Career Career Noncarear Career Pollt. Career Pollt. Caraer Pollt. $lJpN. SUPN. 8UpN. 8UpN. SUPN. SUPN.
Strongly agree/agree 57.7 37.7 55.1 42.7 38.9 52.7 Neither 30.2 46.5 30.0 29.0 22.2 28.2 Stronolv disaareel disaaree 12.1 15.8 14.9 26.3 38.9 19.1
k. My l upervlaor keeps amployaaa Informed about what la aolna on In this subunit. 1991
1989 Career Career Noncarear Careor Pollt. Career Pollt. Career Pollt. z)UpN. supw. supw. SUPN. SUPN. SUPN.
Strongly agree/agree 66.6 52.9 66.0 54.5 55.6 57.5 Neither 23.1 29.8 18.5 20.9 - 22.6 Stronalv disaoreel disaoree 10.2 17.3 15.5 24.6 44.4 19.6
I. My auparvlaor domanda compllanca with hlaihar declalona.
1989 Career Career Noncareer Career SUPN.
Pollt. SUPN.
Career SUPN.
Pollt. supw.
Career SUPN.
Pollt. SUPN.
Stronalv aareelaaree 71.9 83.5 71.6 79.5 72.2 76.1 Neither 21.4 12.4 19.7 15.5 22.2 17.4 Strongly disagree/ disagree 6.7 4.1 8.7 5.0 5.6 4.6 ’
Page 74 GMMGD-92-68 SE8 Survey
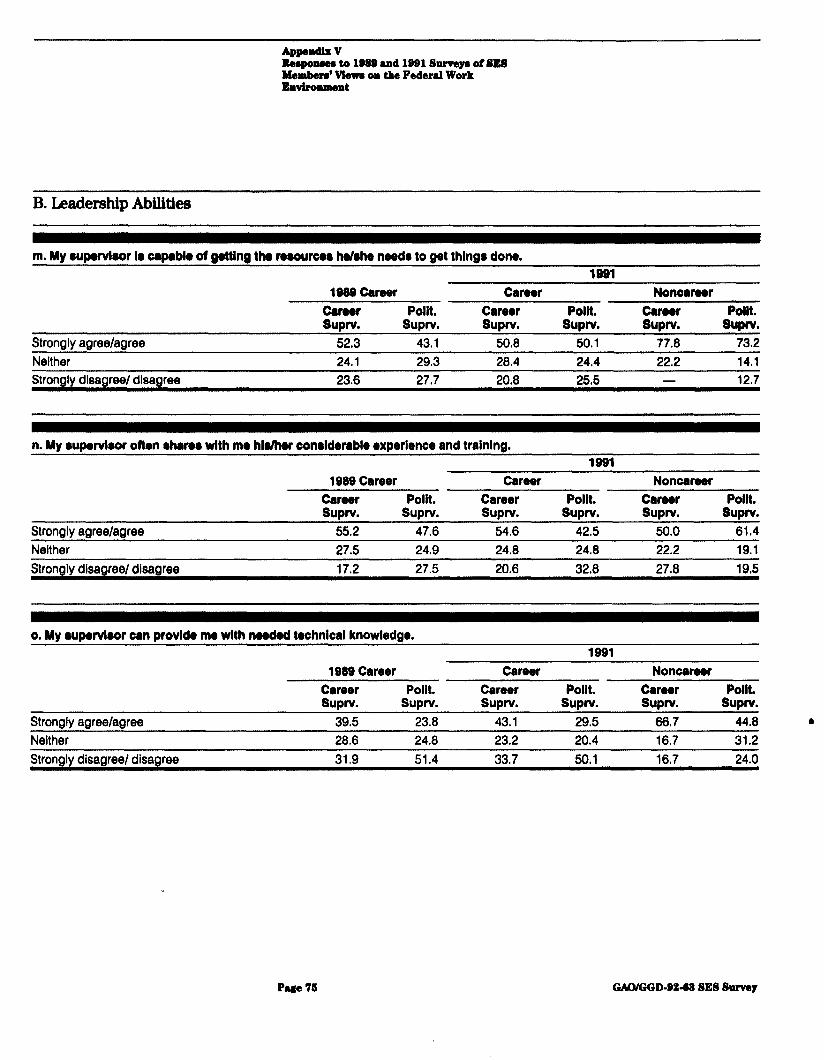
Raeponeee to 1988 and 1BSl Surveym of SES Mamlnre’ VIawe on the Faderal Work Envtronm4nt
B. Leadership Abilities
m. My oupervlaor la capable of gattlng tha roaourwa ha/she need8 to get things done. 1991
1989 Career Career Noncarwr C8raar Pollt. Career Pollt. Carwr Pollt. SUDN. SUDN. SUPW. SUDN. SUDN. SUPW.
Stronalv aaree/aaree 52.3 43.1 50.8 50.1 77.8 73.2 .,.w -
Neither 24.1 29.3 28.4 24.4 22.2 14.1 Strongly disagree/ disagree 23.6 27.7 20.8 25,5 - 12.7
n. My l upewlaor ofton l haroa with ma hlaIhar conalderable experience and training. 1991
1989 Career Career Noncareer Carwr Pollt. Career Pollt. Carwr Pollt. supw. SUPN. SUPN. SUPN. SUPN. supw.
Strongly agree/agree 55.2 47.6 54.6 42.5 50.0 61.4 Neither 27.5 24.9 24.8 24.8 22.2 19.1 Strongly disagree/ disagree 17.2 27.5 20.6 32.8 27.8 19,5
o. My oupe~bor can provlda ma wlth needed technical knowledge.
1989 Career Career Pollt. SUPW. SUDW.
1991 Career Noncarwr
Career Pollt. Carwr Pollt. SUDN. SUDW. SUDN. SUDW. - .
Strongly agree/agree 39.5 23.8 43.1 29.5 66.7 is.6 Neither 26.6 24.8 23.2 20.4 16.7 31.2
4
Stronolv disaareel disaaree 31.9 51.4 33.7 50,l 16.7 24.0
Page 71 GMMGGD-Be-62 SES Survey
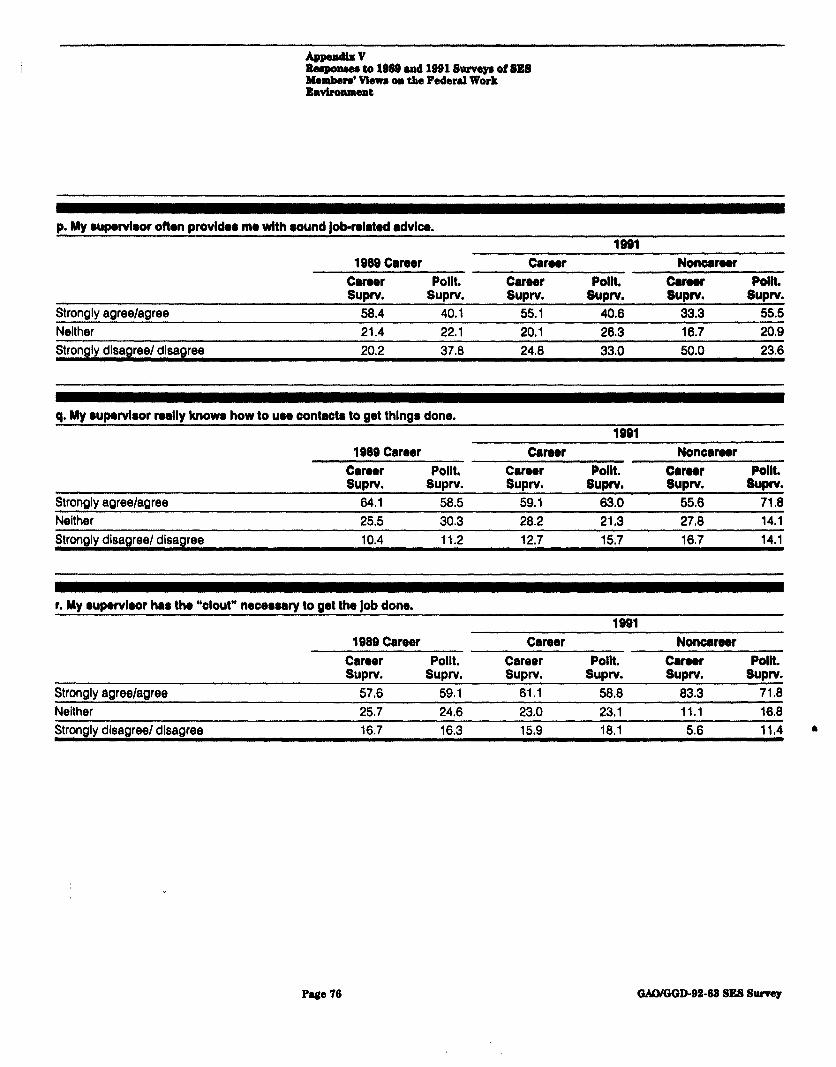
ltaspo~ to lQ8Q and 1001 Surveys ofSl!S Memben* Mewa on the Faderal Work Envtrolunent
p. My aupewloor oftan provldaa ma wlth wound job-rolatod advice. 1991
1989 Career Carwr Noncamr Career Pollt. Career Pollt. CUWr Pollt. SUPN. SUDN. SUPN. SUPN. SUPN. SUPN.
Strongly agree/agree 58.4 40.1 55.1 40.6 33.3 55.5 Neither 21.4 22.1 20.1 26.3 16.7 20.9 Strongly dlsagreel disagree 20.2 37.8 24.8 33.0 50.0 23.6
q. My l upervlaor really know. how to uw contacts to get thlngs done. 1991
1989 Career Career Noncaraar Carwr Pollt, Career Pollt. Caraar Pollt. SUPN. SUDW. SUPN. SUPW. SUDN. SUPW.
Strongly agree/agree 64.1 58.5 59.1 63.0 55.6 71.8 Neither 25.5 30.3 28.2 21.3 2708 14.1 Strongly disagree/ disagree 10.4 11.2 12.7 15.7 16.7 14.1
r. My l upervlaor has the “clout” nwaawry to get the job done.
1989 Career Career 1991
Noncarwr Career Pollt. Career Pollt. Carwr Polk SUPN. SUfJN. SUPN. supw. SUPN. supw.
Strowly aareelaaree 57.6 59.1 61.1 58.8 83.3 71.8 Neither 25.7 24.6 23.0 23.1 11.1 16.8 Stronalv disaareel disaaree 16.7 16.3 15.9 18.1 5.6 11.4 4
Plge 76 GAO/GOD-92-88 SE8 Survay
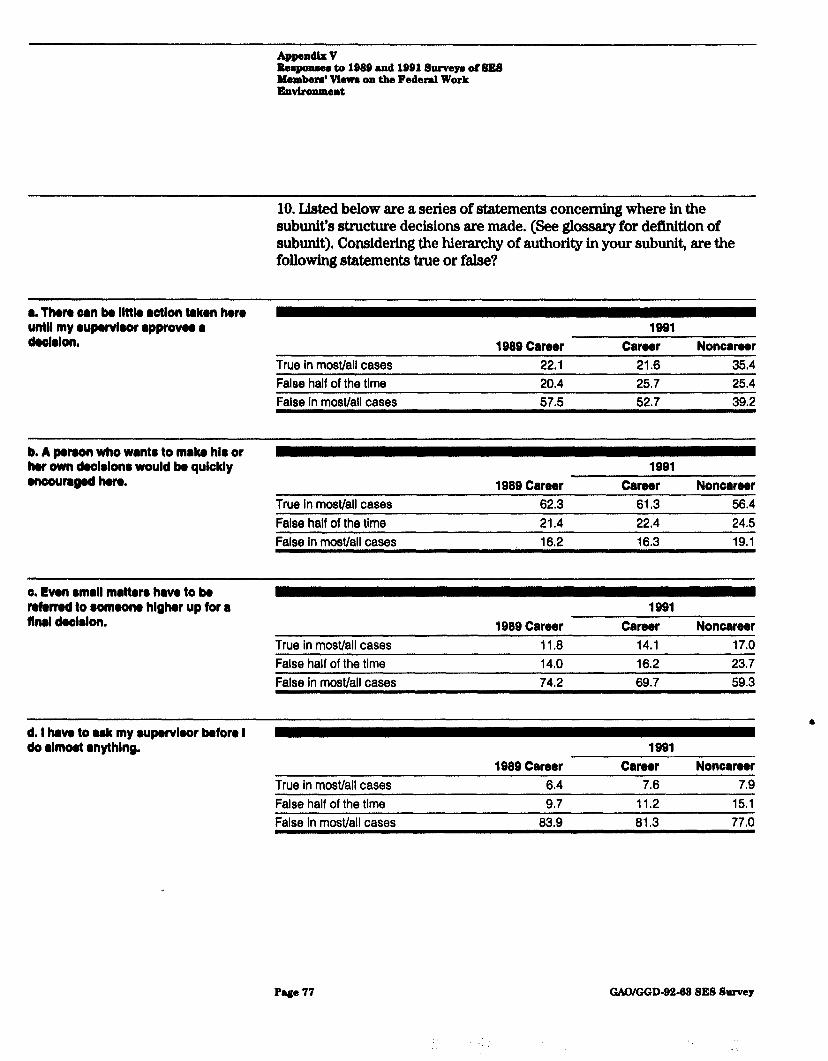
Baapnmtta to 1000 utd 1001 Surveya of SES lUembenr* View on the Fedcml Work Envtronmant
10. J&&d below are a series of statements concerning where in the subunit’s structure decisions are made. (See glossary for definition of subunit). Considering the hierarchy of authority in your subunit, are the following statements true or false?
a. Then can ba llttla action taken hare until my aupervlaor l pprovw a dealalon. 198s Career
1991 Carwr Noncsrwr
True in most/all cases 22.1 21.6 35.4 False half of the time 20.4 25.7 25.4 False In most/all cases 57.5 52.7 39.2
b. A paraon who wants to make hlr or har own declalona would ba aulcklv 1991 enwuragad hare.
. w 1989 Carwr Carwr Noncarwr
True In most/all cases 62.3 61.3 56.4 False half of the time 21.4 22.4 24.5 False in most/all cases 16.2 16.3 19.1
0. gvon amall mattan have to be rafawad to aomaona hltiher UD for a 19Ql flnaldaelalon. - ’ 1 Q89 Career Career Noncarwr
True in most/all cases 11.8 14.1 17.0 False half of the time 14.0 1682 23.7 False in most/all cases 74.2 69.7 59.3
d. I how to ask my aupewlaor beforo I do almoat anythlng.
True in most/all cases 1989 Carwr
6.4
1991 Career
7.6 Noncareer
7.9 False half of the time 9.7 11.2 15.1 False in most/all cases 83.9 81.3 77.0
P4gs 77 GAWGGD-02-68 SESSnrvey
4
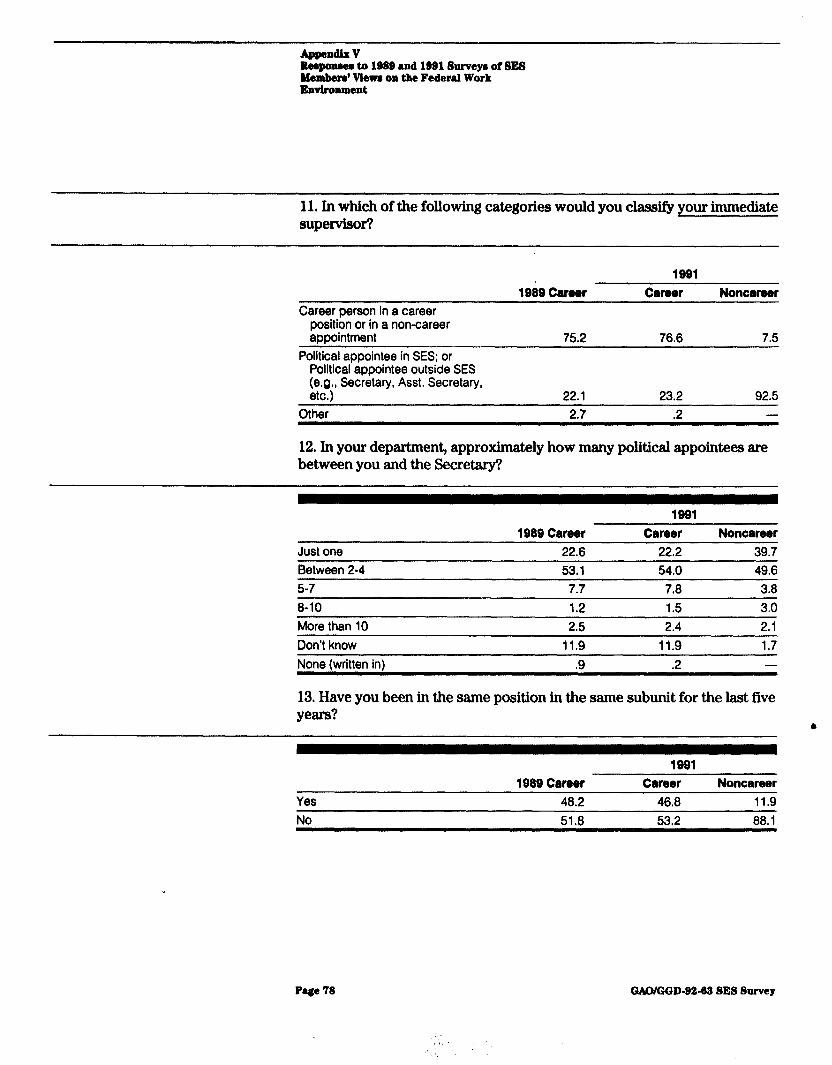
lteeponma to lS68 and 1991 Survey of SE8 Membeau’ Vlewe on the Federal Work EnvLronmsnt
11. In which of the following categories would you classify your immediate supervisor?
1989 Career 1991
Careor Noncareer Career person in a career
position or in a non-career appointment
Polltical appointee in SES; or Political appointee outside SES (e2j, Secretary, Asst. Secretary,
Other
75.2 76.6 7.5
22.1 23.2 92.5 2.7 .2 -
12. In your department, approximately how many political appointees are between you and the Secretary?
1991 1989 Career Career Noncareer
Just one 22.6 22.2 39.7 Between 2-4 53.1 54.0 49.6 5-7 7.7 7.8 3.8 8-10 1.2 1.5 3.0 More than 10 2.5 2.4 2.1 Don’t know 11.9 11.9 1.7 None (written in1 .9 .2 -
13. Have you been in the same position in the same subunit for the last five years?
1991 1989 Career Career Noncareer
Yes 48.2 46.8 11.9 No 51.6
Page 78 GMUGGD.B2-62 SE8 Survey
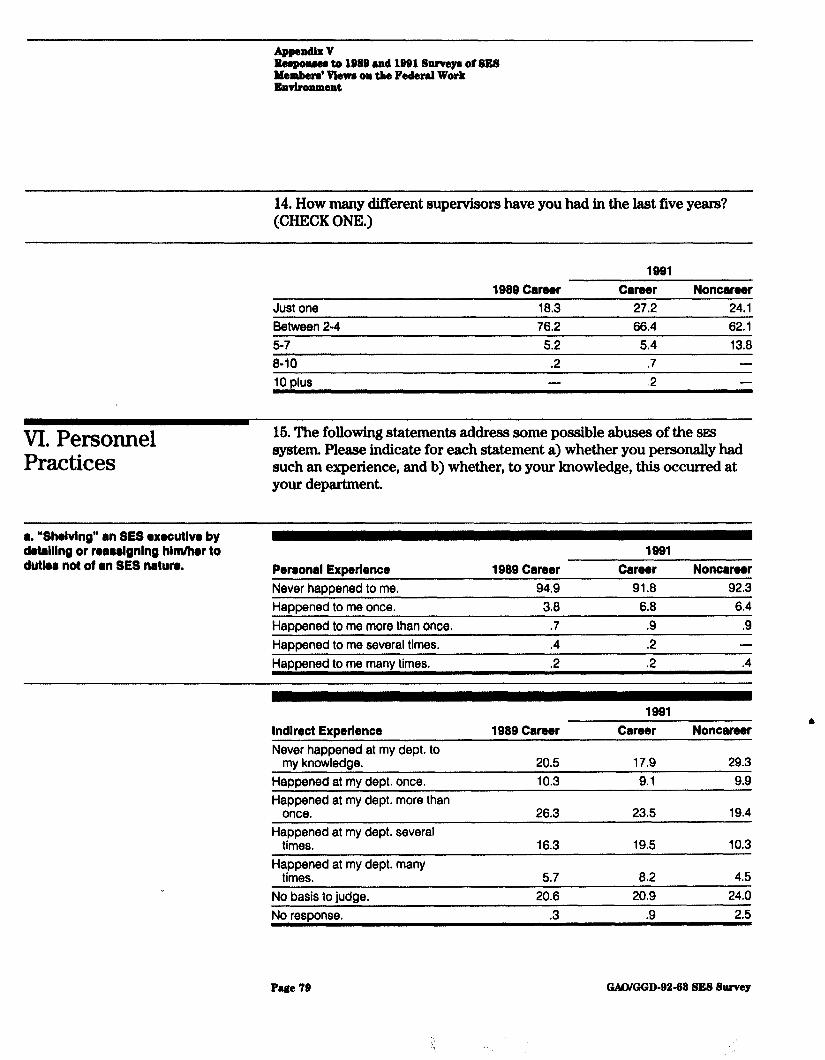
llerponrer to 1888 end l@Bl Surveya of SES Memberd Viawe on the Federal Work Environmeat
14. How many Merent supen&ors have you had in the last five years? (CHECK ONE.)
1991 1989 Career Career Noncareer
Just one 18.3 27.2 24.1 Between 2-4 76.2 66.4 62.1 5-7 5.2 5.4 13.8 8-10 .2 .7 - 10 plus - “2 -
VI. Personnel Practices
16. The following statements address some possible abuses of the SES system. Please indicate for each statement a) whether you personally had such an experience, and b) whether, to your knowledge, this occurred at your department.
a. “Shelving” an SES l xecutlvo by detalllng or reeulgnlng him/her to dutkr not of an SES nrturo. Perronal Experience 1989 Career
Never happened to me. 94.9 Happened to me once. 3.8 Happened to me more than once. .7 Happened to me several times. .4 Happened to me many times. .2
1991 Career
91.8 6.8
.9
.2
.2
Noncareer 92.3
6.4 .9
-
.4
lndlrect Experience Never happened at my dept. to
my knowledge. Happened at my dept. once. Happened at my dept. more than
once. Happened at my dept. several
times. Happened at my dept. many
times. No basis to judge. No response.
1989 Career
20.5 10.3
26.3
16.3
5.7 20.6
.3
1991 Career
17.9 9.1
23.5
19.5
8.2 20.9
.9
Noncareer
29.3 9.9
19.4
10.3
4.5 24.0
2.5
Page 79 GMYGGD-92-68 SE8 Survey
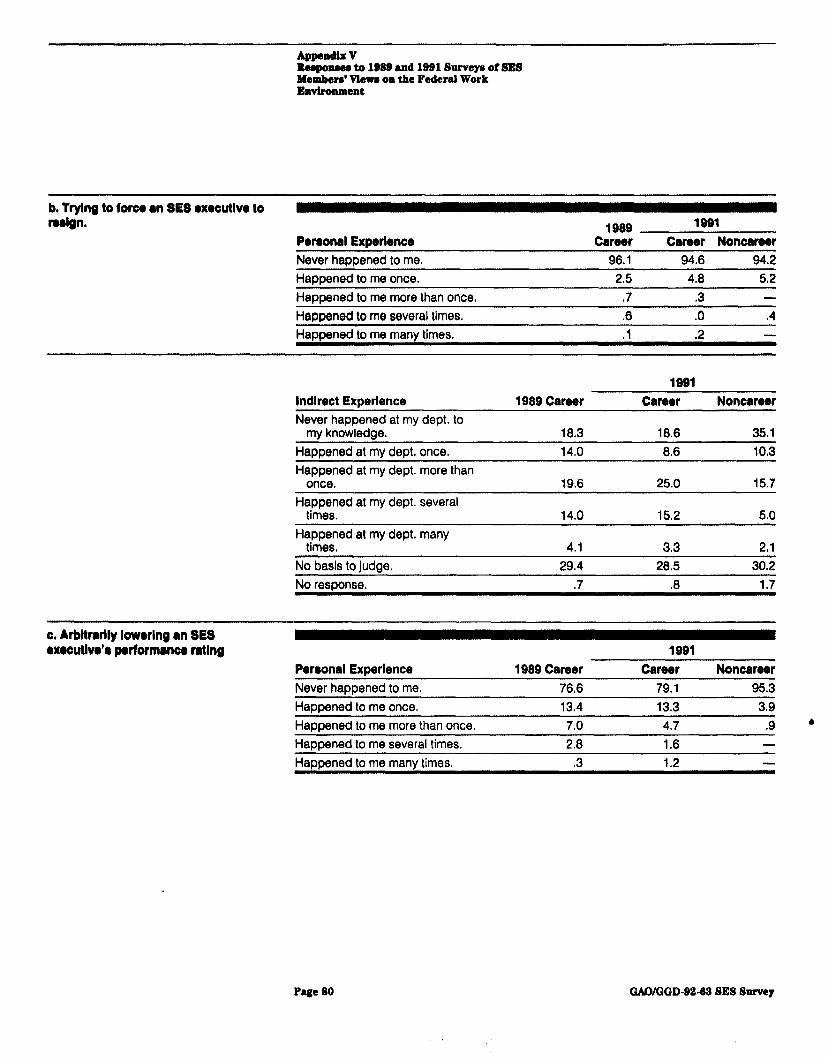
Beaponwu to 1982 and 1891 Surve~ya of 8125 Membered view oa the Federal Work Environment
b, Trying to force an SE8 l xocutlvo to reelgn.
Porronal Exporlence 1989
Career 1991
Career Noncareer Never hapoened to me. 96.1 94.6 94.2 Happened to me once. 2.5 4.8 5.2 Happened to me more than once. ,7 .3 -
Hagtxmed 10 me several times. .6 .O .4 Happened to me many times. .l *2 -
1991 Indirect Experience Never happened at my dept. to
my knowledge.
1989 Career
18.3
Career
18.8
Noncareer
35.1 Haooened at mv deot. once. 14.0 8.6 10.3 Happened at my dept. more than
once. Happened at my dept. several
times. Happened at my dept. many
times. No basis to judge.
19.6 25.0 15.7
14.0 15-2 5.0
4.1 3.3 2,l 29.4 28.5 30.2
No response. .7 .8 1.7
c. Arbltnrlly lowerlng l SES oxwftlvo’8 Pwformrnca ratlng
Penonal Experience 1989 Career Never haooened to me. 76.6
1991 Career
79.1
Noncareer 95.3
Hapoened to me once. 13.4 13.3 3.9 Happened to me more than once. 7.0 4.7 .9 4 Happened to me several times. 2.8 1.6 - Happened to me many times. .3 1.2 -
Page 80 GMYGGD-g2-68 SE8 Survey
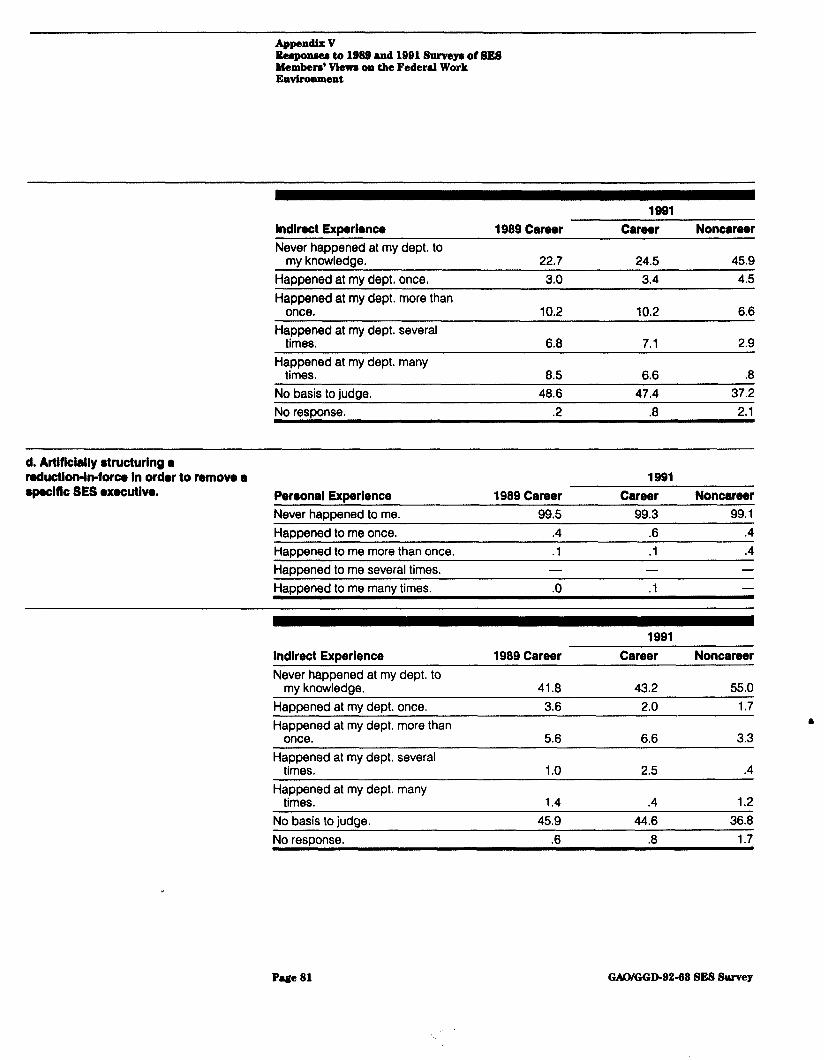
Appendix v Beqmua~ to 1888 and 1881 Surveyr of SES Membera’ viewe on the Federal Work Environment
Indlrect Experience 1989 Career 1991
Career Noncareer Never happened at my dept. to
mv knowledae. 22.7 24.5 45.9 Happened at my dept. once. Happened at my dept. more than
once.
3.0 3.4 4.5
10.2 10.2 6.6 Happened at my dept. several
No basis to iudae.
times. Happened at my dept. many
times. 46.6
6.8
47.4
7.1
37.2
2.9
8.5 6.6 .8
No resoonse. .2 .6 2.1
d. Artlflclally rtructurlng a reductlonhforce In ardor to remove a 8peclflC SES l xecutlvo. Personal Exwrlence 1989 Career
1991 Career Noncareer
Never happened to me. 99.5 99.3 99.1 Happened to me once. .4 .6 .4 Happened to me more than once. .1 .l .4 Haobened to me several times. - - -
Haooened to me manv times. .O .l -
lndlrect Experience 1989 Career 1991
Career Noncareer Never happened at my dept. to
my knowledge. Happened at my dept. once.
41.8 43.2 55.0 3.6 2.0 1.7
Happened at my dept. more than once. 5.6 6.6 3.3
Happened at my dept. several times. 1.0 2.5 .4
Happened at my dept. many times. 1.4 .4 1.2
No basis to judge. 45.9 44.6 36.8 No response. .6 .8 1.7
Page 81 GACVGGD-8248 SE8 Survey
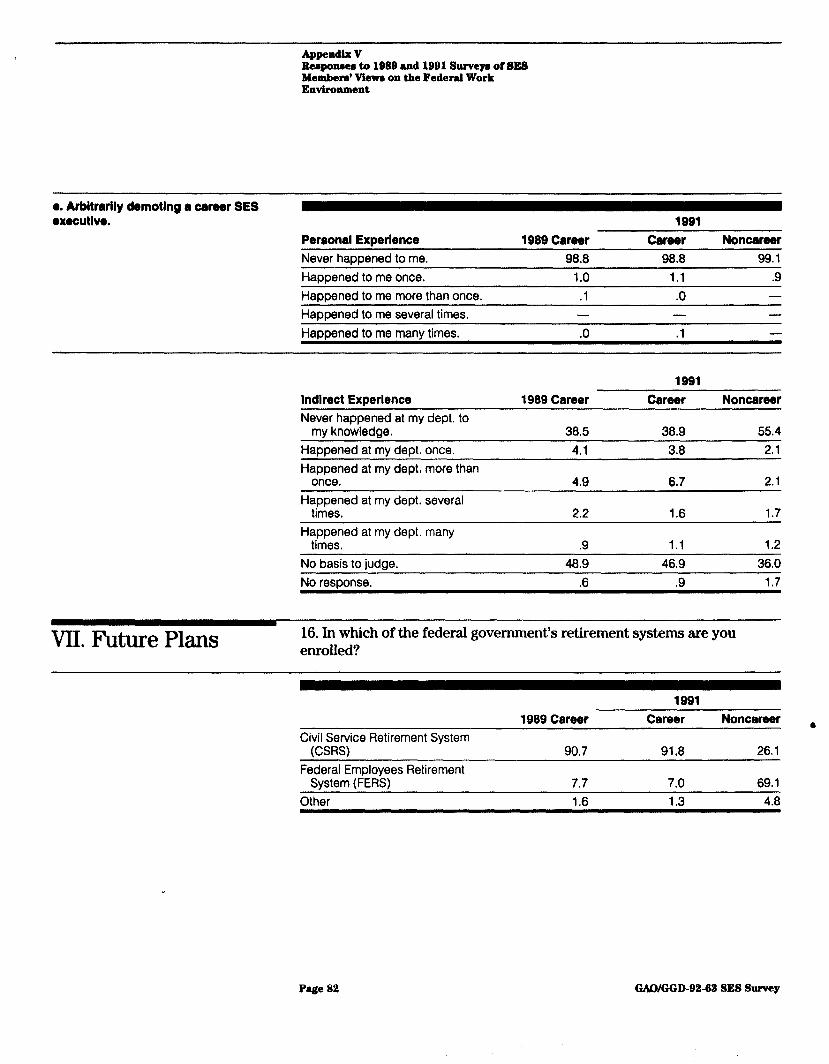
Eeoponeea to 1888 and 1BBl Surveya of SES Members’ Viewe on the Federal Work Environment
e. Arbitrarily demotlng a career SES l xeoutlvo.
Personal Experience 1989 Career Never happened to me. 98.8 Happened to me once. 1.0 Happened to me more than once. .l Happened to me several times. -
HaDoened to me manv times. .O
1991 Career Noncareer
98.8 99.1 1.1 .9
.O - - -
.l -
lndlrect Experience Never happened at my dept. to
my knowledge. Happened at my dept. once. Happened at my dept more than
once. Happened at my dept. several
times. Happened at my dept. many
times. No basis to judge. No response.
1989 Career
38.5 4.1
4.9
2.2
.9 48.9
.6
1991 Career
38.9 3.8
6.7
1.6
1.1 46.9
.9
Noncareer
55.4 2.1
2.1
1.7
1.2 36.0
1.7
VII, Future Plans 16, In which of the federal government’s retirement systems are you enrolled?
1991
Civil Service Retirement System (CSRS)
Federal Employees Retirement System (FEW)
Other
1989 Career Career Noncareer .
90.7 91.8 26.1
7.7 7.0 69.1 1.6 1.3 4.8
Page 82 GAO/CGD-82-M SE8 Survey
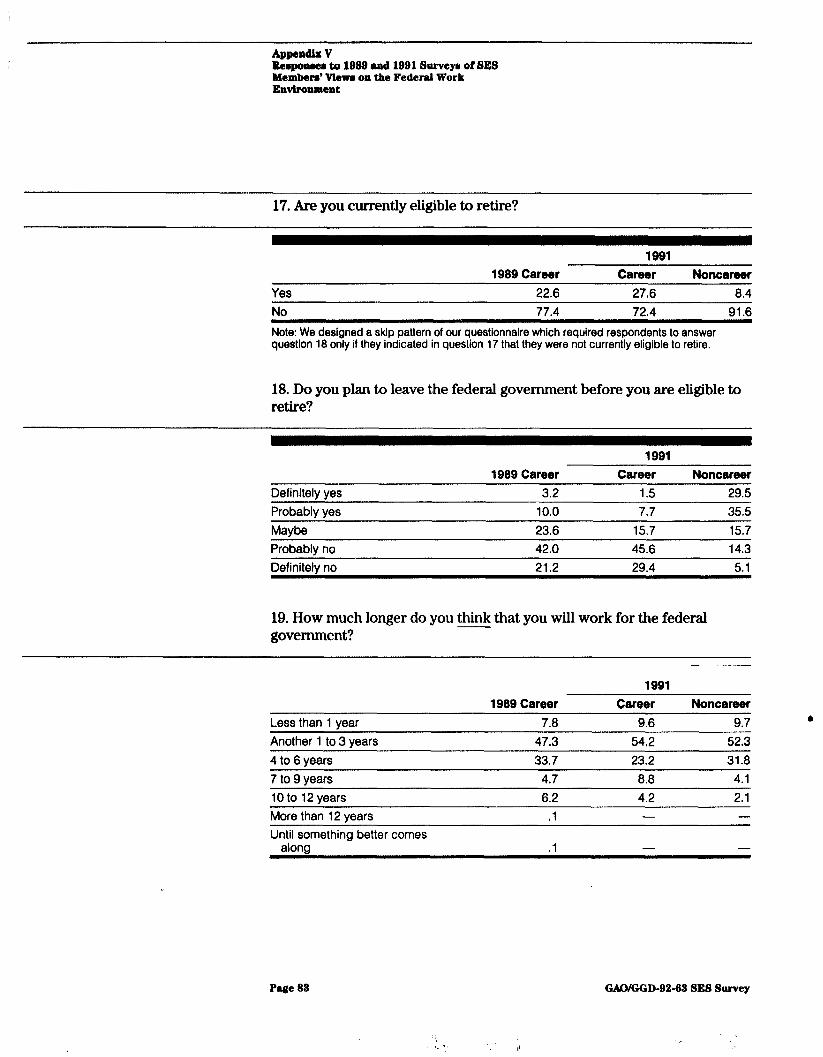
Reeponeer to 1888 and 1991 Surveya of 8E8 Men&en’ Mem on the Federal Work Envtronment
17. Are you currently eligible to retire?
1989 Career 1991
Career Noncareer Yes 22.6 27.6 8.4 No 77.4 72.4 91.6 Note: We designed a skip pattern of our questionnaire which required respondents to answer question 18 only if they indicated in question 17 that they were not currently eligible to retire.
18. Do you plan to leave the federal government before you are eligible to retire?
1991
Definitely yes Probably yes
1989 Career Career Noncareer 3.2 1.5 29.5
10.0 7.7 35.5 Mavbe 23.6 15.7 15.7 Probably no 42.0 45.6 14.3 Definitely no 21.2 29.4 5.1
19. How much longer do you think that you will work for the federal government?
- ._-
1991 1989 Career Career Noncareer
Less than 1 year 7.8 9.6 9.7 Another 1 to 3 years 47.3 5442 52.3 4 to 6 years 33.7 23.2 31.8 7 to 9 years 4.7 8.8 4.1 10 to 12 years 6.2 4.2 2.1 More than 12 years Until something better comes
alona
.l - -
.l - -
l
Page 88 GAO/GOD-92-68 SE8 Survey
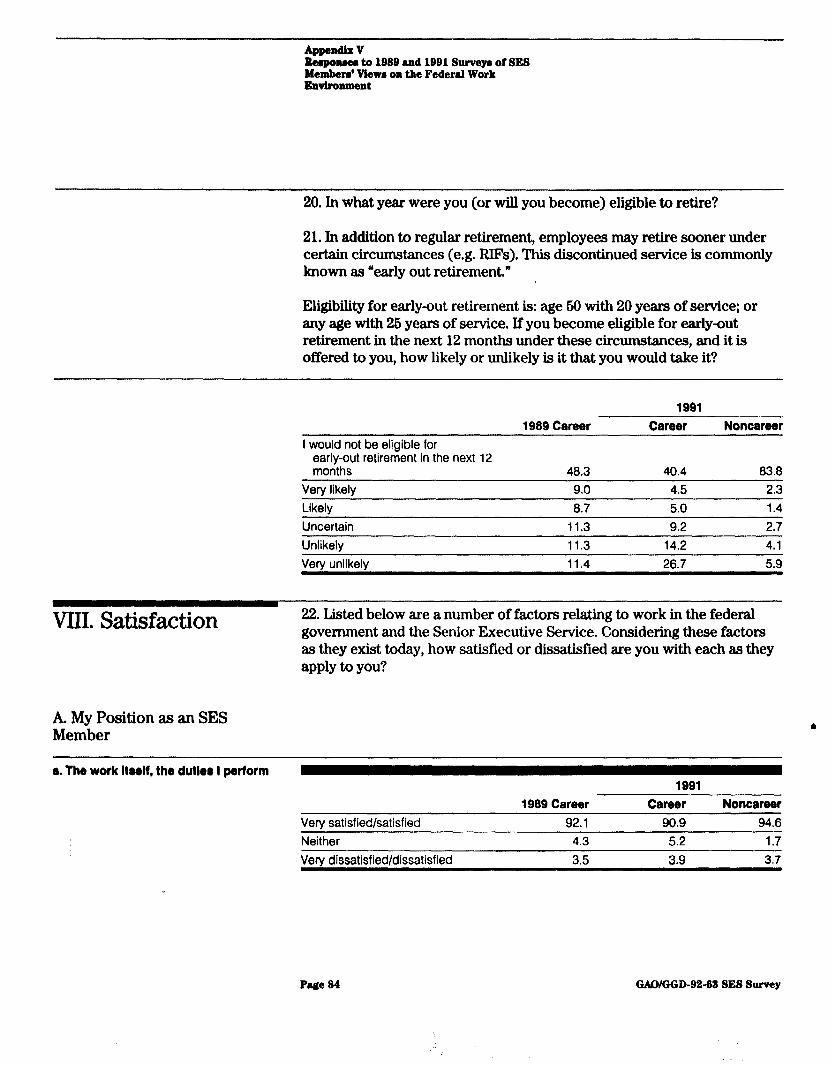
Reepoaeea to l@SS md lB91 Surveym of SES bhmberr’ Wewe on the Federal Work Eavlroament
20. In what year were you (or will you become) eligible to retire?
21. In addition to regular retirement, employees may retire sooner under certain circumstances (e.g. RIFs). This discontinued service is commonly known as “early out retirement.”
Eligibility for early-out retirement is: age 60 with 20 years of service; or any age with 26 years of service. If you become eligible for early-out retirement in the next 12 months under these circumstances, and it is offered to you, how likely or unlikely is it that you would take it?
1991 1989 Career Career Noncareer
I would not be eligible for early-out retirement in the next 12 months 40.3 40.4 83.8
Very likely 9.0 4.5 2.3 Likely 8.7 5.0 1.4 Uncertain 11.3 9.2 2.7 Unlikely 11.3 14.2 4.1 Very unlikely 11.4 26.7 5.9
VIII, Satisfaction 22. Listed below are a number of factors relating to work in the federal government and the Senior Executive Service. Considering these factors as they exist today, how satisfied or dissatisfied are you with each as they apply to you?
A. My Position as an SES Member
e. The work belt, the dutler I perform 1991
1999 Career Career Noncareer Very satisfied/satisfied 92.1 ti.9 94.6 Neither 4.3 5.2 1.7 Verv dissatisfied/dissatisfied 3.5 3.9 3.7
o/GGD-92-63 SE8 Survey
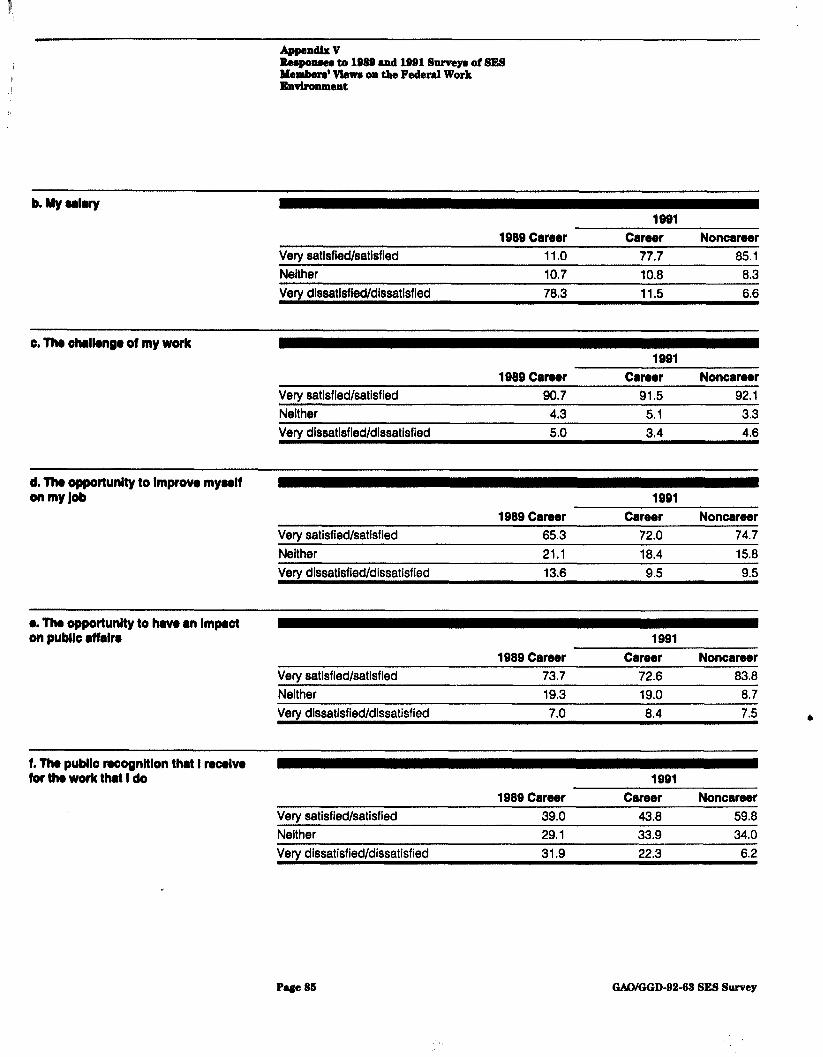
Reepoaeee to less urd iau surveyr of SE8 Membere’ Viewe on the Federal Work Eavlronmant
b. My Wary
Very satisfied/satisfied Neither Vew dissatisfied/dissatisfied
1989 Career 11.0 10.7 7803
1991 Career
77.7 10.8 11.5
Noncareer 85.1
8.3 6.6
ID. The dulknge of my work
Very satisfied/satisfied Neither Very dissatisfied/dissatisfied
1989 Career 90.7
4.3 5.0
1991 Career
91.5 5.1 3.4
Noncareer 92.1
3.3 4.6
d. Tha opportunity to lmprovo myself 0mW
Very satisfied/satisfied Neither Very dissatisfied/dissatisfied
1989 Career 65.3 21.1 13.6
1991 Career
72.0 18.4
9.5
Noncareer 74.7 15.6
9.5
0. The opportunity to have an Impact on publlo rfblrr
Very satisfied/satisfied Neither Very dissatisfied/dissatisfied
1989 Career 73.7 19.3
7.0
1991 Career
72.6 19.0 8.4
Noncareer 83.8
8.7 7.5
1. The publlo recognltlon that I ncelve for tha work that I do
Very satisfied/satisfied Neither Very dissatisfied/dissatisfied
1989 Career 39.0 29.1 31.9
1991 Career
43.8 33.9 22.3
Noncareer 59.8 34.0
6.2
Page 815 GAWGGD-9242 SE8 Survey
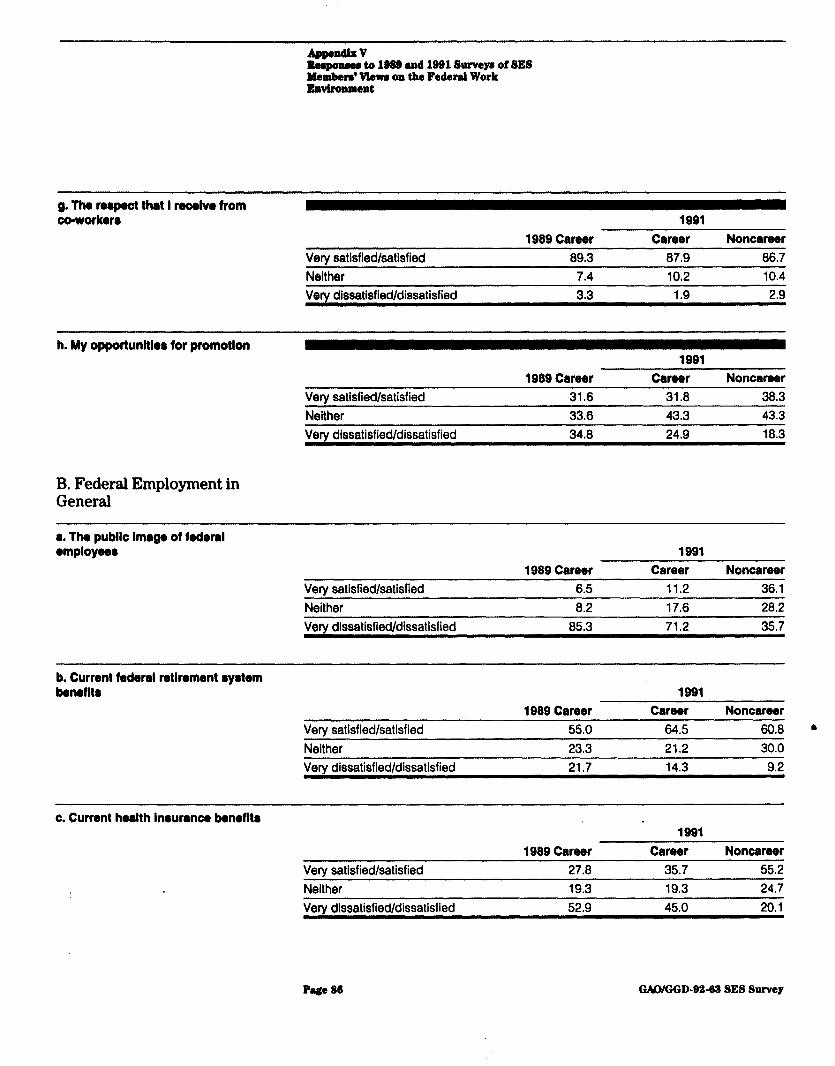
Stmpomu to 1869 and 1991 Survep of SES Membm’ Vtewa on the. Federal Work mvtronmemt
g. The rerpect that I reoelve from coworker0 1991
1989 Career Career Noncareer Very satisfied/satisfied 89.3 87.9 86.7 Neither 7.4 10.2 10.4 Very dissatisfied/dissatisfied 3.3 1.9 2.9
h. My opportunltlor for promotlon
1989 Caresr 1991
Career Noncareer
Verv satisfied/satisfied 31.6 31.8 38.3 Neither Very dissatisfied/dissatisfied
33.6 43,3 43.3 34.8 24,Q 18.3
B, Federal Employment in General
l . The publlc Image of federal l mployw8
1989 Career 1991
Career Noncareer Vent satisfied/satisfied 6.5 11.2 36.1 Neither 8.2 17.6 28.2 Very dissatisfied/dissatisfied 85.3 71.2 35.7
b, Current federal retlrement l yetem belIefIt
1989 Career 1991
Career Noncareer Very satisfied/satisfied 55.0 64.5 60.8 l
Neither 23.3 21.2 30.0 Very dissatisfied/dissatisfied 21.7 14.3 9.2
c. Current health Inrurance benofltr
1989 Career 1991
Career Noncareer Very satisfied/satisfied 27.8 35.7 55.2 Neither 19.3 19.3 24.7 Very dissatisfied/dissatisfied 52.9 45.0 20.1
Page 80 WGGD-92-92 SE8 Survey
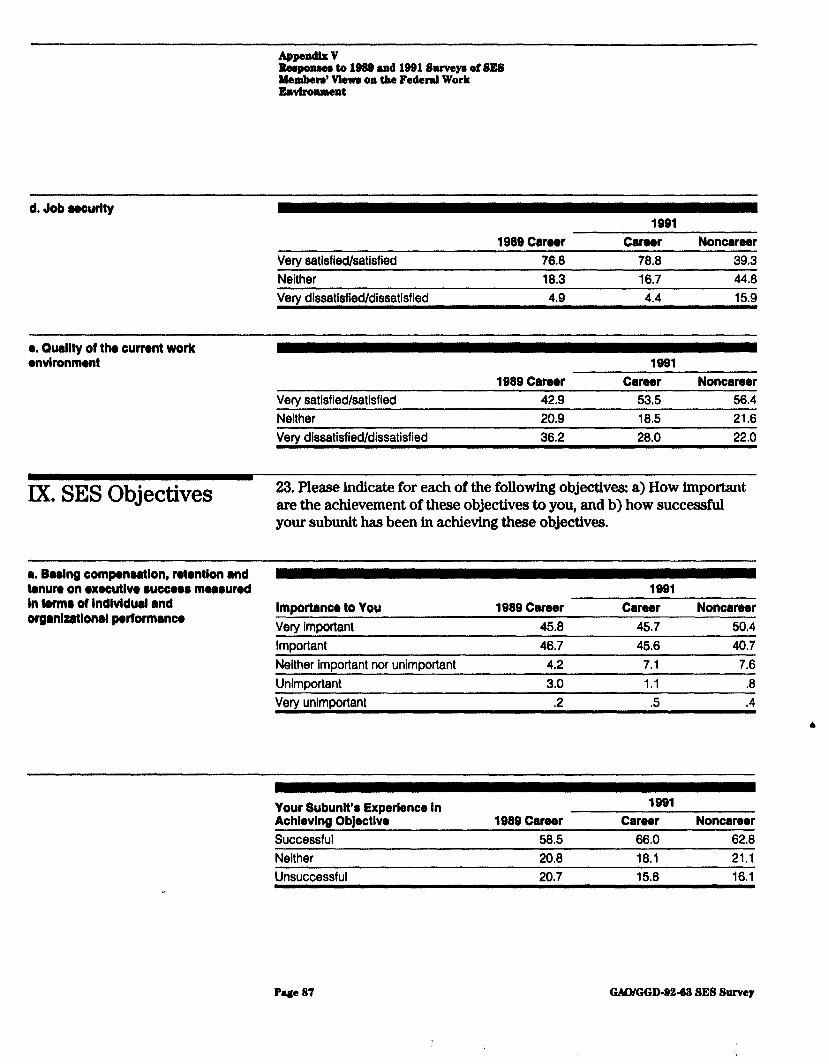
Steeponeee to IS88 and 1981 Surveym of SES Menbern’ Vlewe on the Federal Work Envtronmant
d. Job aewrlty
Verv satisfied/satisfied 1989 Carwr
76.6
1991 Career
78.0 Noncarwr
39.3 Neither 18.3 16.7 44.8 Very dissatisfied/dissatisfied 4.9 4.4 15.9
l . Ouallty 01 the current work environment 1991
Very satisfied/satisfied Neither
1989 Career Career Noncarwr 42.9 53.5 56.4 20.9 18.5 21.6
Very dissatisfied/dissatisfied 36.2 28.0 22.0
KSESObjectives 23. Please indicate for each of the following objectives: a) How important are the achievement of these objectives to you, and b) how successful your subunit has been in achieving these objectives.
a. Baaing compenwtlon, retentlon and tenure on l xecutlvo euccwe mwrund 1991 In terma of lndlvldual and orqanlz8tlonal performance
Impottanco to You 1989 Carwr Career Noncarwr Very important 45.8 45.7 50.4 Important 46.7 45.6 40.7 Neither important nor unimportant 4.2 7.1 7.6 Unimportant 3.0 1.1 .a Very unimportant .2 .5 A
Your Subunit’8 Experience In Achieving Objective Successful
1989 Career 58.5
~~-~ -~ 1991
Career Noncarwr 66.0 62.8
Neither 20.8 18.1 21.1 Unsuccessful 20.7 15.8 16.1
Page 87 GAOIGGD-8258 SE8 Survey
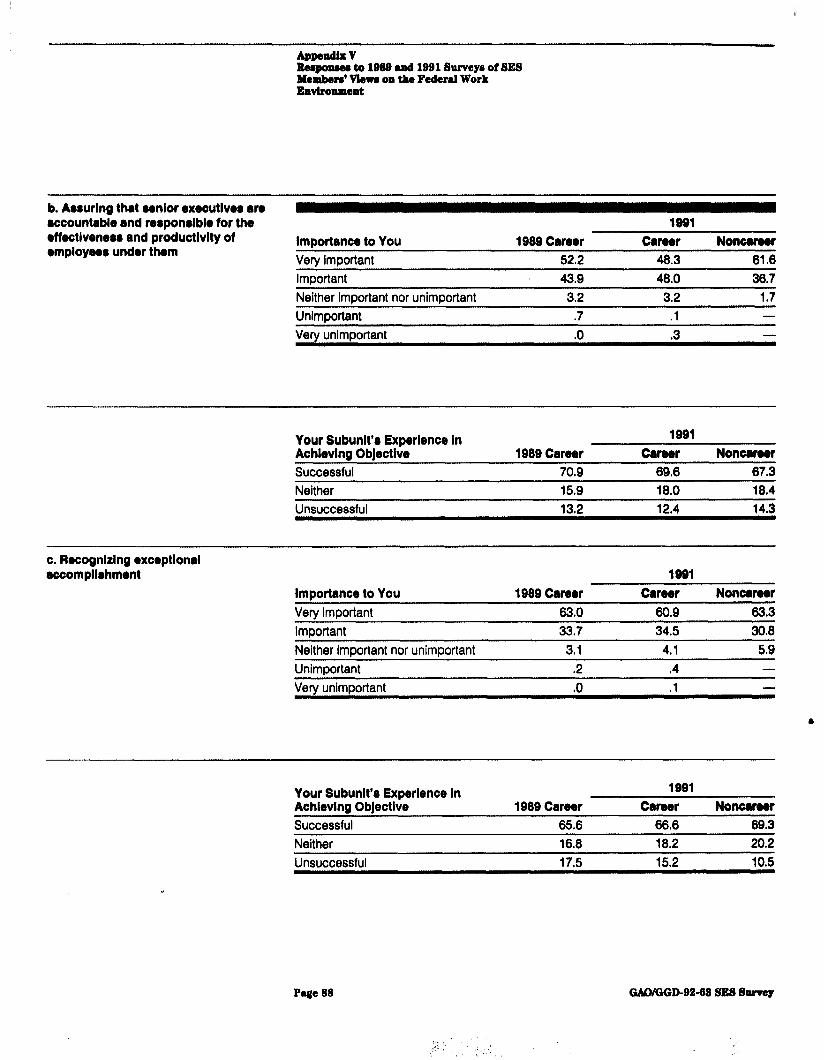
Reqtoneee to 1888 and 1991 fiurveyr of SES Meatben’ V&we on the Federal Work Envlrolunent
b. Aeeurlng that wnlor executlvem are accountable and reewnelble for the 1991 effectlvenerr and prbductlvlty of employwr under them
lmportancr to You 1989 Career Carw Noncareer Very important 52.2 46.3 61.6 Important 43.9 46.0 36.7 Neither important nor unimportant Unimportant
3.2 3.2 1.7 .7 .l -
Very unimportant .O ,3 -
Your Subunit’8 Experience In Achlevlng Objective Successful Neither
1989 Carwr 70.9 15.0
1991 Carwr
60.6 16.0
Noncareer 67.3 16.4
Unsuccessful 13.2 12.4 14,3
c. Recognizing exceptlonal accrompllrhment
Imoortance to You 1989 Career 1991
Carwr Noncarwr . Very important 63.0 60.9 63.3 lmoortant 33.7 34.5 30.6 Neither important nor unimportant 3.1 4.1 5.9 Unimportant .2 $4 Very unimportant ,O .l
Your Subunlt’r Experience In Achieving Objective Successful Neither Unsuccessful
1989 Career 65.6 16.6 17.5
1991 Career
66.6 16.2 15.2
Noncareer 69.3 20.2 10.5
Page 22 GANGGD-92-22 SE8 Survey
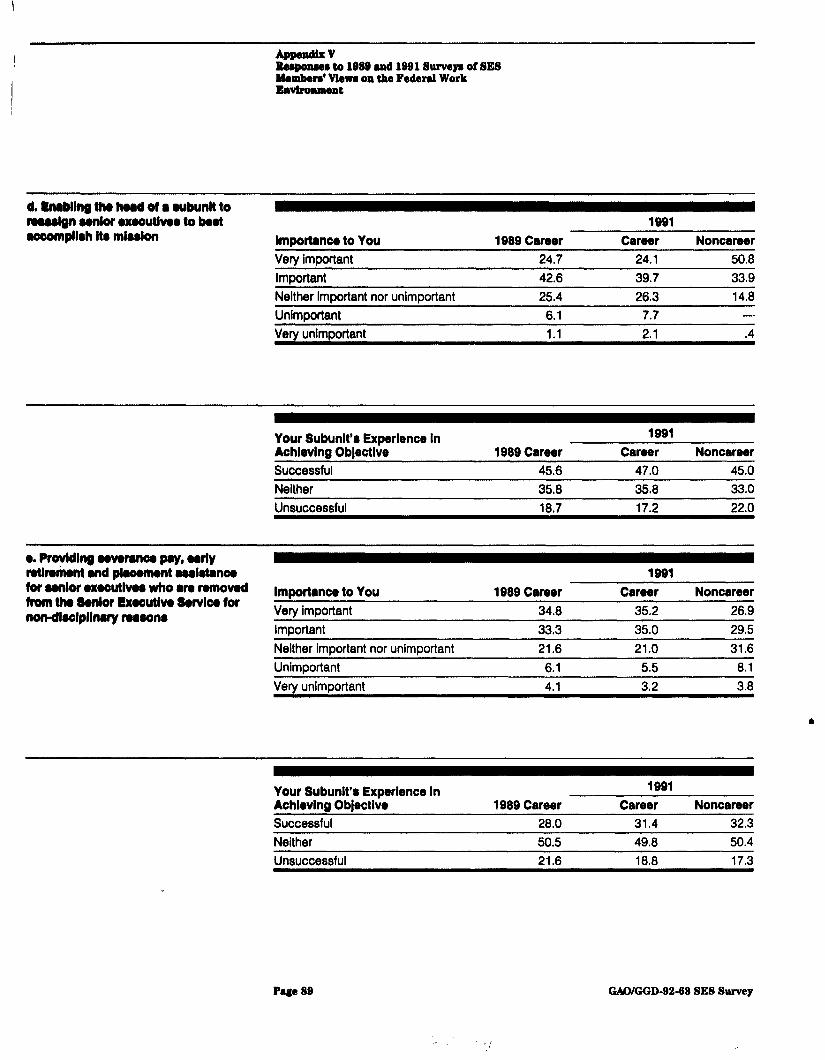
&W-v Itm~nmes to 1922 and lB8l Suweyr of SE8 Membere’ Vlewm on the Federal Work Envtronment
d tnrbllng the ho8d of I wbunlt to reaeelgn wnlor l xwutlvw to beet rcwromplleh lt8 mlwlon
1991 Importance to You 1989 Career Career Noncarwr Very important 24.7 24.1 50.6 Important 42.6 39.7 33.9 Neither important nor unimportant 25.4 26.3 14.6 Unlmaartant 6.1 7.7 -
Very unimportant 1.1 2.1 A
Your Subunlt’o Experience In Achieving Objective Successful Neither
1989 Career 45.6 3586
1991 Carwr
47.0 35.6
Noncareer 45.0 33.0
Unsuccessful 16.7 17.2 22.0
l . Pwvldln# wveranoa pay, wtiy retlmmmt end pbwment awletanw for oenlor l xwutlvw who an removed from the 8enlor Exwutlvo Servlce for nendleclpllnary rweono
Importance to You 1989 Career Very important 34.6 Important 33.3
1991 Career
35.2 35.0
Noncareer 26.9 29.5
Neither important nor unimportant 21.6 21.0 31.6 Unimportant 6.1 5.5 6.1 Very unimportant 4,l 3.2 3.6
l
Your Subunlt’s Experience In Achlevlng Objective Successful Neither
1989 Career 26.0 50.5
1991 Career
31.4 49.6
Noncareer 32.3 50.4
Unsuccessful 21.6 16.6 17.3
Page 89 GAO/GGD-92-02 SE8 Survey
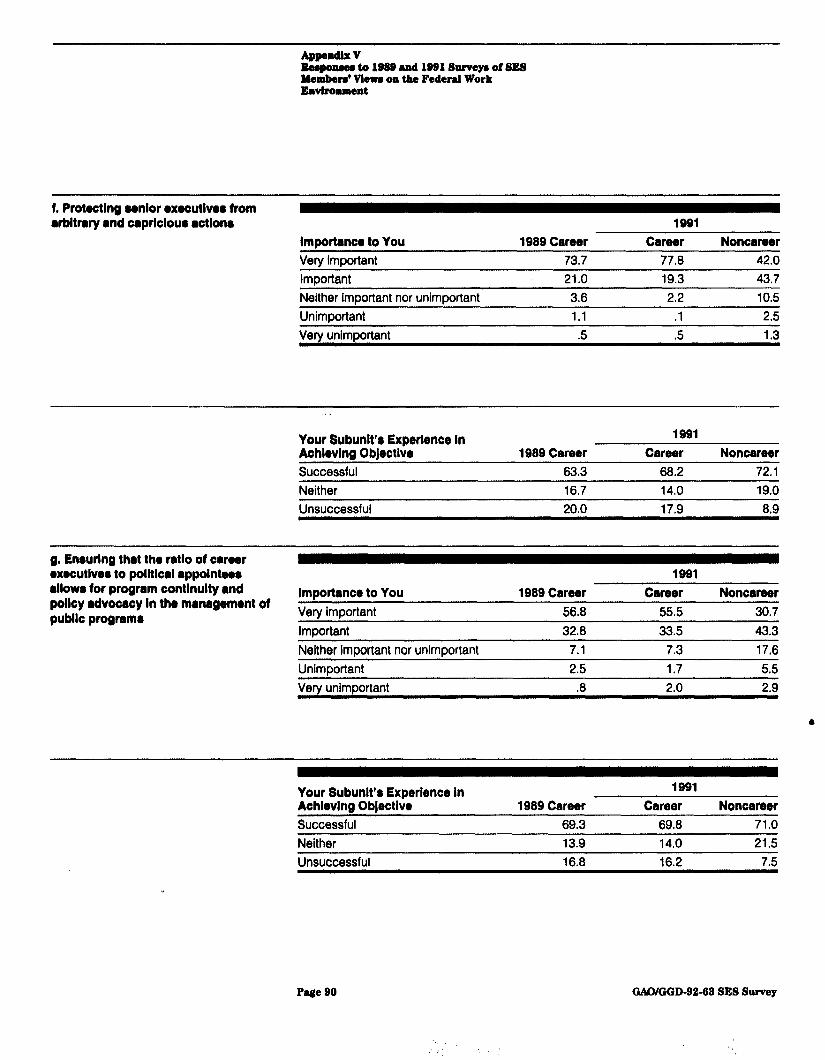
Reeponeee to 1880 and 1991 survep of SE8 Membed Vlewe on the Federal Work Envtronment
f. Protecting wnlor l xecutlveo from l rbltmry and caprlclour aetlono
Impotinco to You 1989 Carwr lB91
Career Noncarwr Vew ImDortant 73.7 77.6 42.0 Important 21.0 19.3 43.7 Neither important nor unimportant 3.6 2.2 10.5 Unimportant 1.1 .I 2.5 Very unimportant .5 .5 1.3
Your SubunIt’ Experience In Achlovlng Objective Successful
1989 Career 63.3
1991 Career
66.2 Noncarwr
72.1 Neither 16.7 14.0 19.0 Unsuccessful 20.0 17.9 6.9
Q, tinrurlng that the ratlo of carwr executlver to polItIcal appolntwr 1991 allowr for probram conkulty and policy advocacy In the management of oubllc oroaramr
Importance to You 1980 Carwr Career Noncarwr Very important 56.6 55.5 30.7 Important 32.6 33.5 43.3 Neither important nor unimportant 7.1 7.3 17.6 UnimDortant 2.5 1.7 5.5 Verv unimDortant .6 2.0 2.9
Your Subunlt’e Experience In Achlevlng Objective Successful
1989 Career 69.3
1991 Career
6906 Noncarwr
71.0 Neither 13.9 14.0 21.5 Unsuccessful 16.6 16.2 7.5
Page 90 GAWGGD-92-68 SE8 Survey
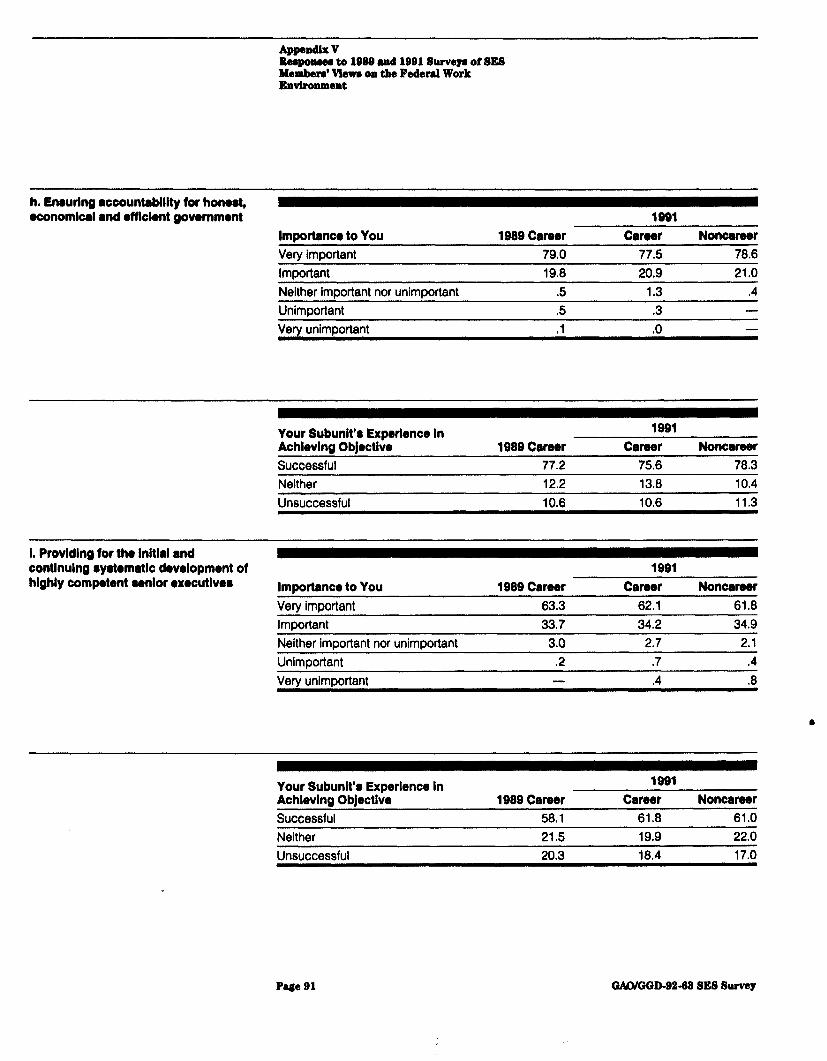
Beepowee to 1888 and 19918urveyr of SES Memben’ Vlewn on the Federal Work Environment
h. Enrurlng accountablllty for hone& economlcal and l ff Iclent government
Importance to You 1989 Carwr Very important 79.0
1991 Carwr
77.5 Noncarwr
76.6 Important 19.6 20.9 21.0 Neither important nor unimportant .5 1.3 .4 Unimportant .5 .3 -
Very unimportant .I .O -
Your Subunit’8 Experience In Achlevlng Objective Successful Neither Unsuccessful
1989 Carwr 77.2 12.2 10.6
1991 Career
75.6 13.6 10.6
Noncarwr 76.3 10.4 11.3
I. Provldlng for the lnltlal and contlnulng ryotematlc development of highly competent aenlor executive@
1991 Importance to You 1989 Career Career Noncarwr Very important 63.3 62.1 61.6 Important 33.7 34.2 34.9 Neither imDortant nor unimDortant 3.0 2.7 2.1 Unimportant .2 .7 .4 Very unimportant - .4 .6
l
- ~-~ Your Subunit’8 Experience In Achlevlng Objective Successful Neither Unsuccessful
1989 Carwr 56.1 21.5 20.3
1991 Career
61.6 19.9 16.4
Noncarwr 61.0 22.0 17.0
Page 91 GAWGGD-9252 SE8 Survey
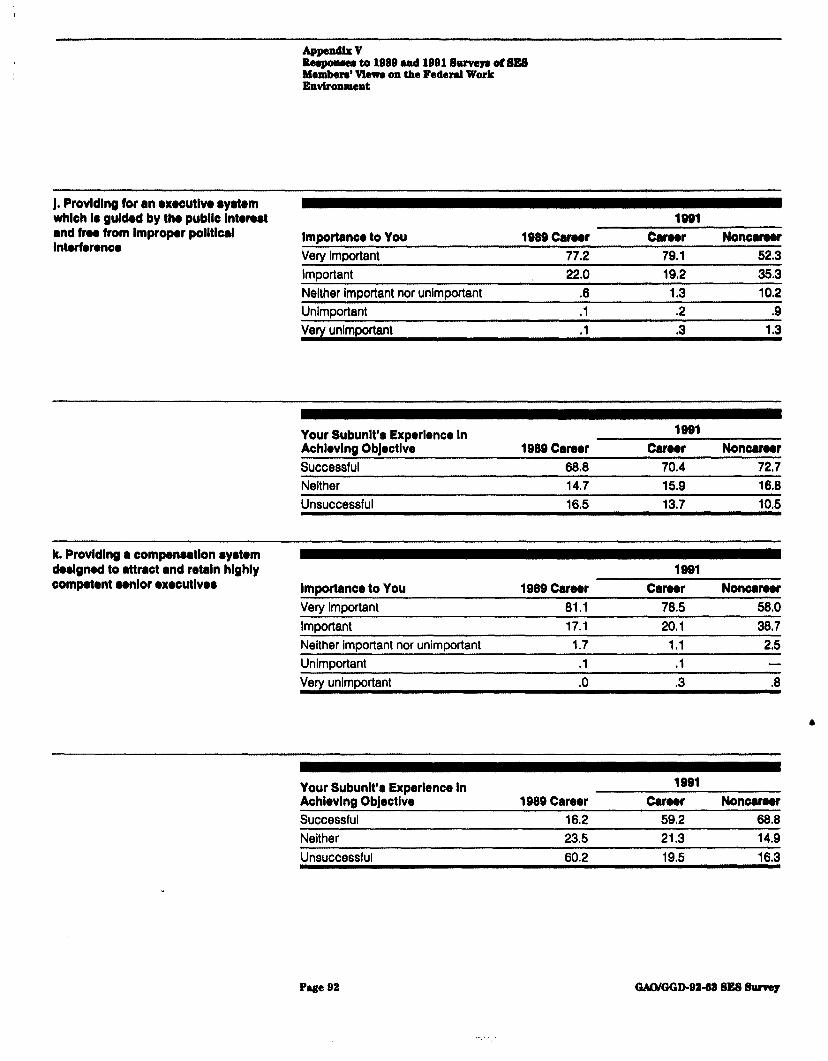
Beeponeee to 1889 and 1881 Surveym al #ES Membere’ Vtewe on the Feded Work Envtroaxeent
j. Provldlng for an exeoutlve ayatam which Ir gulded by the public Intenet and trw from Improper polltlcal Interteronce
Importance to You 1989 Career Very important 77.2 Important 22.0
1991 Carwr
70.1 19.2
Noncamr 52.3 35.3
Neither imoortant nor unimDortant .6 1.3 10.2 Unlmportant Verv unimaoftant
,l .2 .o .l .3 1.3
Your Subunlt’a Experience In Achlevlna Objective 1989 Career
1991 Carwr Nonearwr
Successful 66.6 70.4 72,7 Neither 14.7 15,o 16.6 Unsuccessful 16.5 13.7 10.5
k. Provldlng a compenwtlon l yatem derlgned to attract and retain highly oompetent wnlor executlvea Importance to You 1989 Carwr
1991 Career Noncareer
Very important 61.1 76.5 56.0 Important 17.1 20.1 36.7 Neither important nor unimportant 1.7 1.1 2.5 Unimportant .I .I -
Very unimportant .O .3 .6
e
Your Subunlt’a Experience In Achlevlng Objective Successful Neither Unsuccessful
1989 Career 16.2 23.5 60.2
1991 Carwr
59.2 21.3 19.5
Noncareer 66.6 14.9 16,3
Page 82 &W/GGD-8242 SE8 Survw~
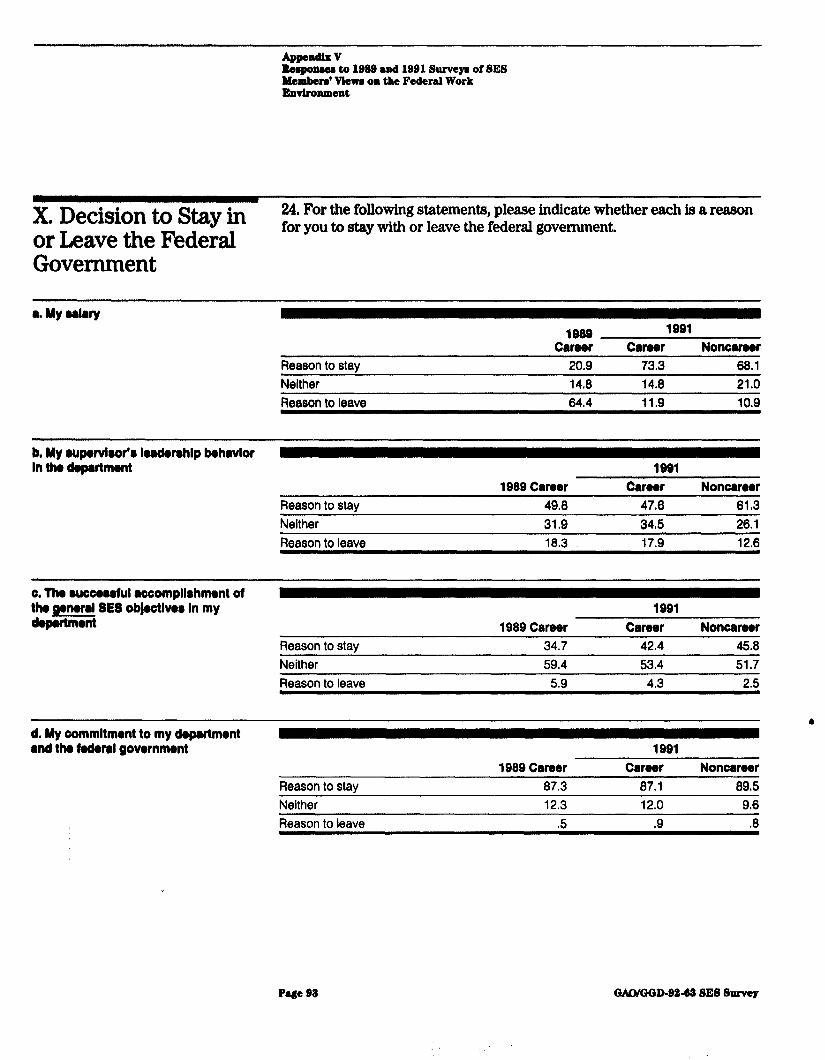
&qmem to 1989 and 1981 Surveya of SE8 bfembe~* Mawa on the Federal Work EnvtroIunent
X, Decision to Stay in 24. For the following statements, please indicate whether each is a reason
or Leave the Federal for you to stay with or leave the federal government.
Government
a. My wlrry 1989 1901
CarOOr CWWr Noncrrwr Reason to stay 20.9 73,3 68.1 Neither 14.8 14.0 21.0 Reason to leave 64.4 11.9 10.9
b. My u~porvloor’e Iwderrhlp behavior In the department
1 Q69 Career 1991
Carwr Noncarwr Reason to stay 49.8 47.6 61,3 Neither 31.9 34,5 26.1 Reason to leave 18.3 17.9 12.6
E). The euowwful l ccompllehment of the #emal SE8 obJectlvw In my dyw-nt 1989 Career
1991 Career Noncareer
Reason to stay 34.7 42.4 45.0 Neither 59.4 53.4 51.7 Reason to leave 5.9 4.3 2.5
d. My aommltmant to my depattmont and the fedenl govornmont
1989 Career 1991
Career Noncarwr Reason to stav 87.3 87.1 89.5 Neither Reason to leave
12.3 12.0 9.6 .5 .Q .8
Page B3 GACVWD-92-62 SE8 Survey
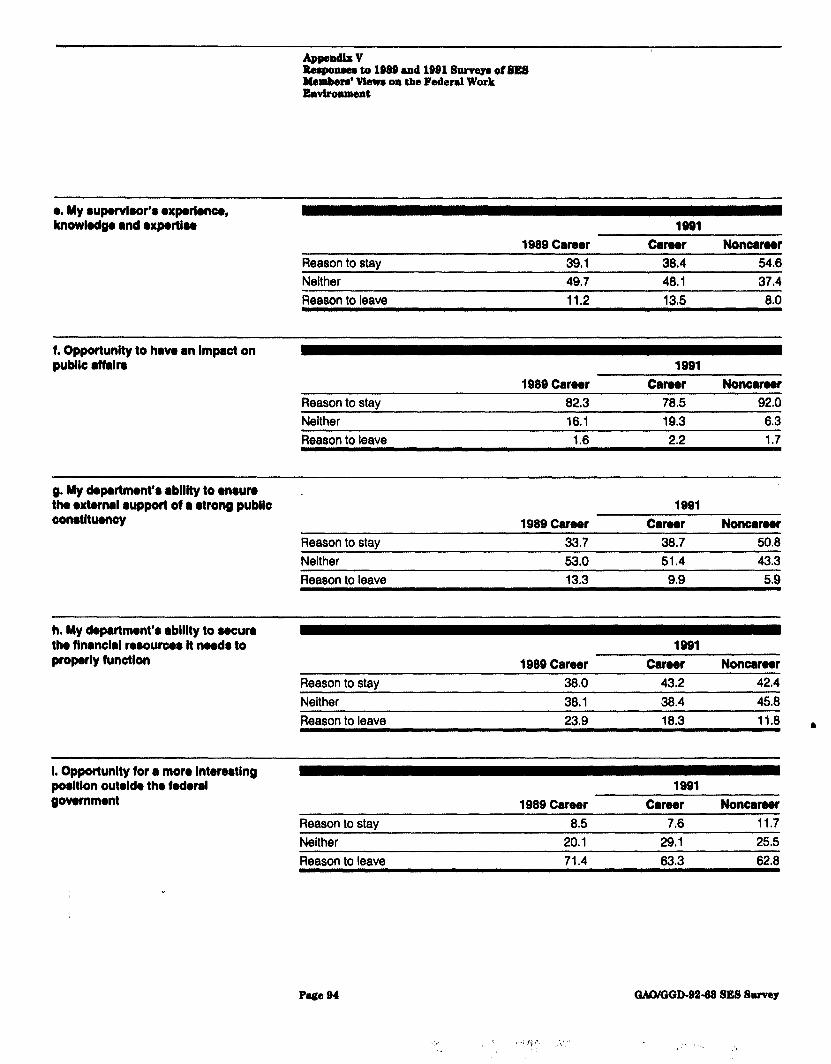
Sbaponeee to 1889 and 1981 Surveya of 8ES Membere’ Vlewe on tke Fsdarrl Work Environment
*. My 8upewIsoV8 l xporlenw, knowlodgo and l xportlw 1991
1989 Career Gamer Noncamr Reason to stay 39.1 38.4 54.6 Neither 49.7 48.1 37.4 Reason to leave 11.2 13.5 8.0
f. Opportunlty to have an Impact on public rffalro 1991
1989 Carwr Carwr Noncarwr Reason to stay 82.3 78.5 92.0 Neither 16.1 19.3 6.3 Reason to leave 1.6 2.2 1.7
g. My kpartment’e rblllty to on8un the l xtornal rupport of I #trong public conrtltuency
1991 1989 Carwr Carwr Noncarwr
Reason to stay 33.7 38.7 50.8 Neither 53.0 51.4 43.3 Reason to leave 13.3 9.9 5.9
h. My dopartmont’r ablllty to wcum tha flnanclal roaourcw It nwdr to properly function
1991 1989 Career Carwr Noncarwr
Reason to stay 38.0 43.2 42.4 Neither 38.1 38.4 45.0 Reason to leave 23.9 18.3 11.8 .
I. Opportunlty for a more Interwtlng pooltlon outrldo the fodoml govarnment
1991 1989 Career Carwr Noncarwr
Reason to stay 8.5 7.6 11.7 Neither 20.1 29.1 25.5 Reason to leave 71.4 63.3 62.8
Page 94 GANGGD-8242 SES Survey
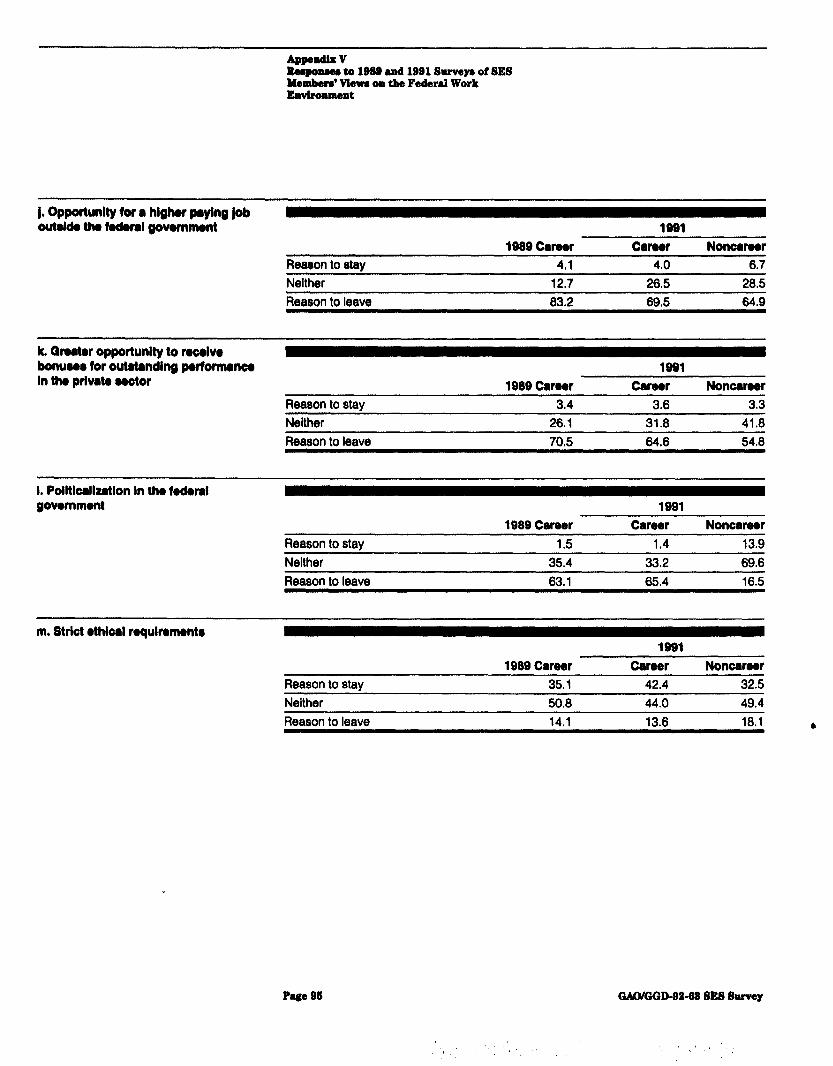
Rawmuee to l@SS and 1881 Surveys of SES Men&err Vtewe on the Federal Work Environment
j. Oppamnlty for a higher plying job outMe the fodoml govommont
Reason to stay 1989 Camr
4.1
1991 Carwr
4.0 Noncarwr
6.7 Neither 12.7 26.5 28.5 Reason to leave 83.2 69.5 64.9
k Qrwtor opportunlty to rwoivo bomwr for outatandlng porformmw 1991 Inthoprlvatowctor -- 1989 Career Carwr Noncarwr
Reason to stay 3.4 3.6 3.3 Neither 26.1 31.8 41.8 Reason to leave 70.5 64.6 54.8
I, Pdltlcallzatlon In the kdoml govommont
1989 Career 1991
Career Noncarwr Reason to stav 1.5 1.4 13.9 Neither 35.4 33.2 69.6 Reason to leave 63.1 65.4 16.5
m. Strict l thlorl rqulnmentr
1989 Carwr 1991
Career Noncarwr Reason to stav 35,l 42.4 32.5 Neither 50.8 44.0 49.4 Reason to leave 14.1 13.6 18.1
P-e 85 WGi3D42-02 SE8 Survey
I ., .’ ‘:
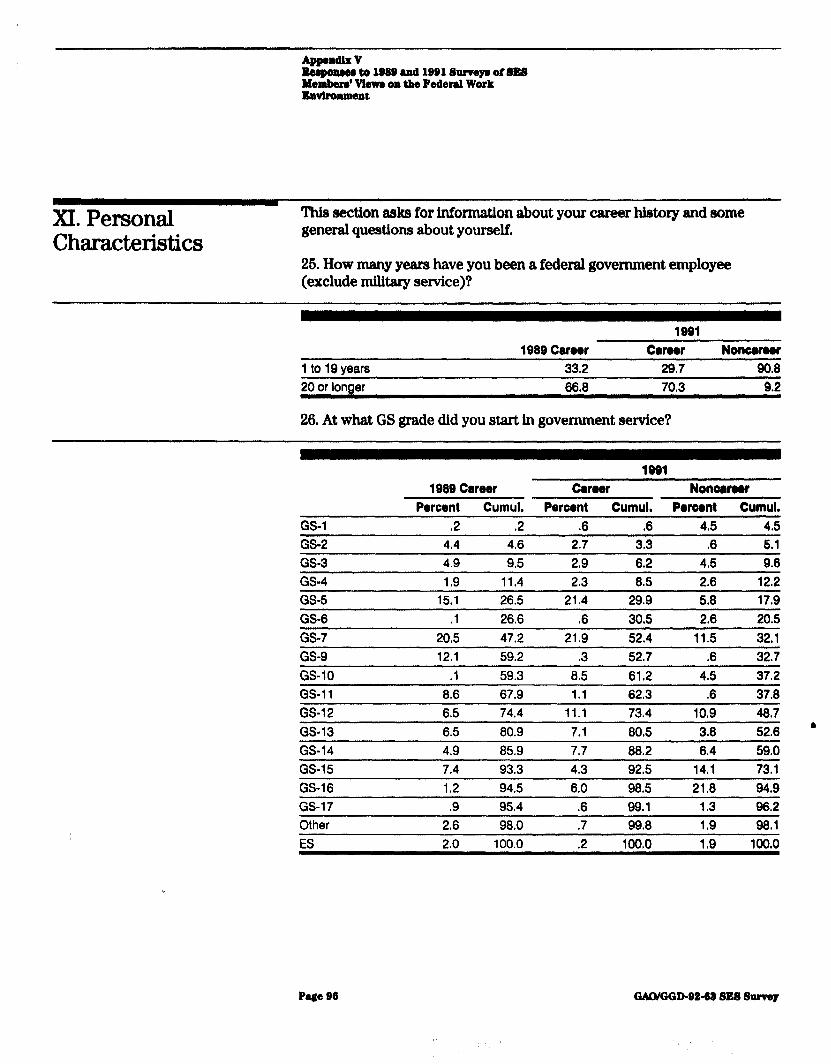
Ikrrpolusr to 1862 and 1991 Sumym of BE8 2kmberd Vtewm on the Federal Work Envhnmemt
XI. Personal Characteristics
ThJs section asks for information about your career history and some general questions about yourself.
26. How many years have you been a federal government employee (exclude military service)?
1991 1089 Career CM0.r
1tolQyears 33.2 29.7 20orlonger 66.8 70.3
26. At what GS grade did you start in government service?
Nonorrw 90.8
9.2
1001 1989 Carw Caroor Nonearw
Portent Cumul. Percent Cumul, Porwnt Cumul. GS-1 .2 .2 .6 .6 4.5 4.5 GS-2 4.4 4.6 2.7 3.3 .6 5.1 GS-3 4.9 9.5 2.9 6.2 4.5 9.6 GS-4 109 11.4 2.3 8.5 2.6 12.2 GS-5 15.1 26.5 21.4 29.9 5.6 17.9 OS-6 .l 26.6 06 30.5 2.6 20.5 GS-7 20.5 47.2 21.9 52.4 11.5 32.1 GS-9 12.1 59.2 .3 52.7 .6 32.7 GS-10 .I 59.3 6.5 61,2 4.5 37.2 GS-11 8.6 67.9 1.1 62.3 .6 37.8 GS-12 6.5 74.4 11.1 73.4 10.9 48.7 GS-13 6.5 80.9 7.1 80,5 3.6 52.6 ' GS-14 4.9 85.9 7.7 88.2 6.4 59.0 GS-15 7.4 93.3 4.3 92.5 14.1 73.1 GS-16 1.2 94.5 6.0 96.5 21.8 94.9 GS-17 .Q 95.4 .6 99,l 1.3 96.2 Other 2.6 98.0 .7 99.8 1.9 98.1 ES 2.0 100.0 .2 100.0 1.9 100.0
Pyle 96 aAD/OQD-9242 SE8 Swvq
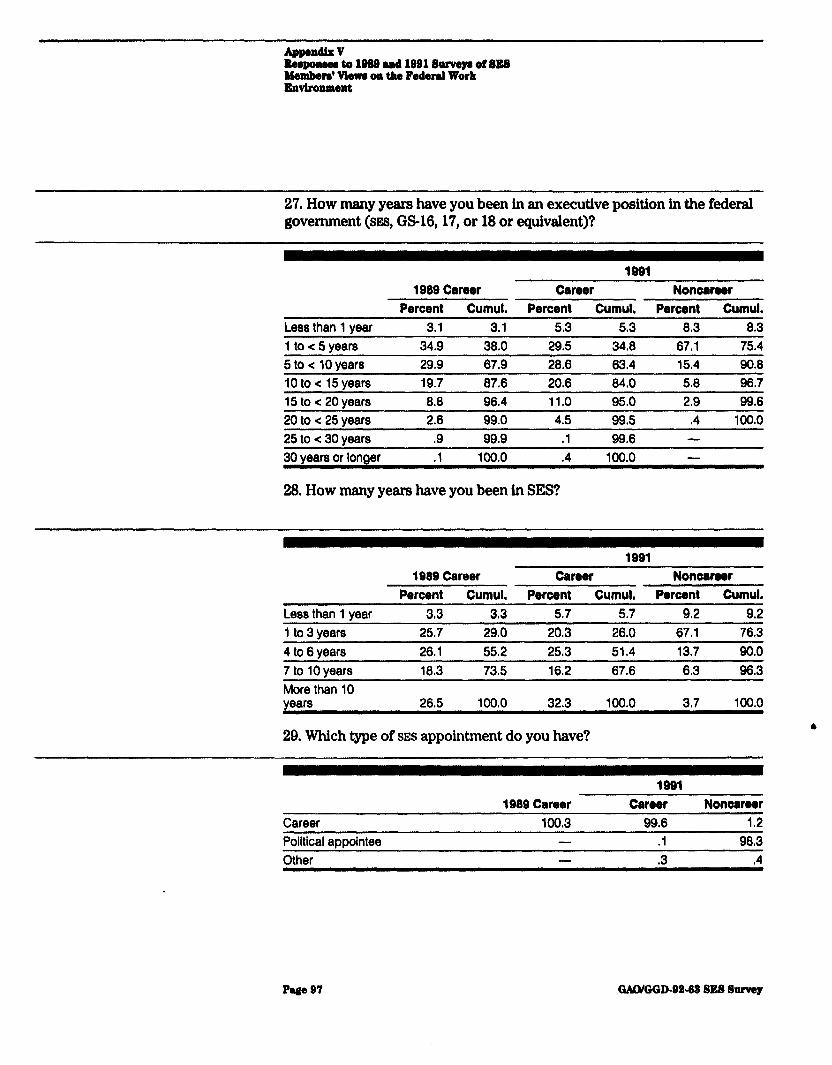
Reaponoea fo 1088 and lB@l Surveyis of BE8 Memberr’ Vten on the Federal Work Envtrolunent
27. How many years have you been in an executive position in the federal government (SES, GS-l&17, or 18 or equivalent)?
1989 Career Career 1991
Noncareer
Less than 1 year 1 to < 5 years
Percent Cumul. Percent Cumul. Percent Cumul. 3.1 3.1 5.3 5.3 6.3 8.3
34.9 38.0 29.5 34.8 67.1 75.4 5 to < 10 years 29.9 67.9 28.6 63.4 15.4 90.8 10 to < 15years 19.7 87.6 20.6 64.0 5.8 96.7 15 to < 20 years 8.8 96.4 11.0 95.0 2.9 99.6 20 to < 25 years 2.6 99.0 4.5 99.5 .4 100.0 25 to < 30 years .Q 99.9 .l 99.6 - 30 years or longer .l 100.0 .4 100.0 -
28. How many years have you been in SES?
1991 1989 Career Career Noncareer
Percent Cumul, Percent Cumul. Percent Cumul. Less than 1 year 3,3 3,3 5.7 5.7 9.2 9.2 1 to 3 years 4 to 6 years 7 to 10 years More than 10 years
25.7 29.0 20.3 26.0 6781 76.3 26.1 55.2 2503 51.4 13.7 90.0 18.3 73.5 16.2 67.6 6.3 96.3
26.5 100.0 32.3 100.0 3.7 100.0
29. Which type of SES appointment do you have?
1991
Career PolitIcal amointee
1989 Career Career Noncareer 100.3 99.6 1.2
- .l 98.3 Other .3 ,4
Y
Pue 97 QALXQOD-9252 SEl3 Survey
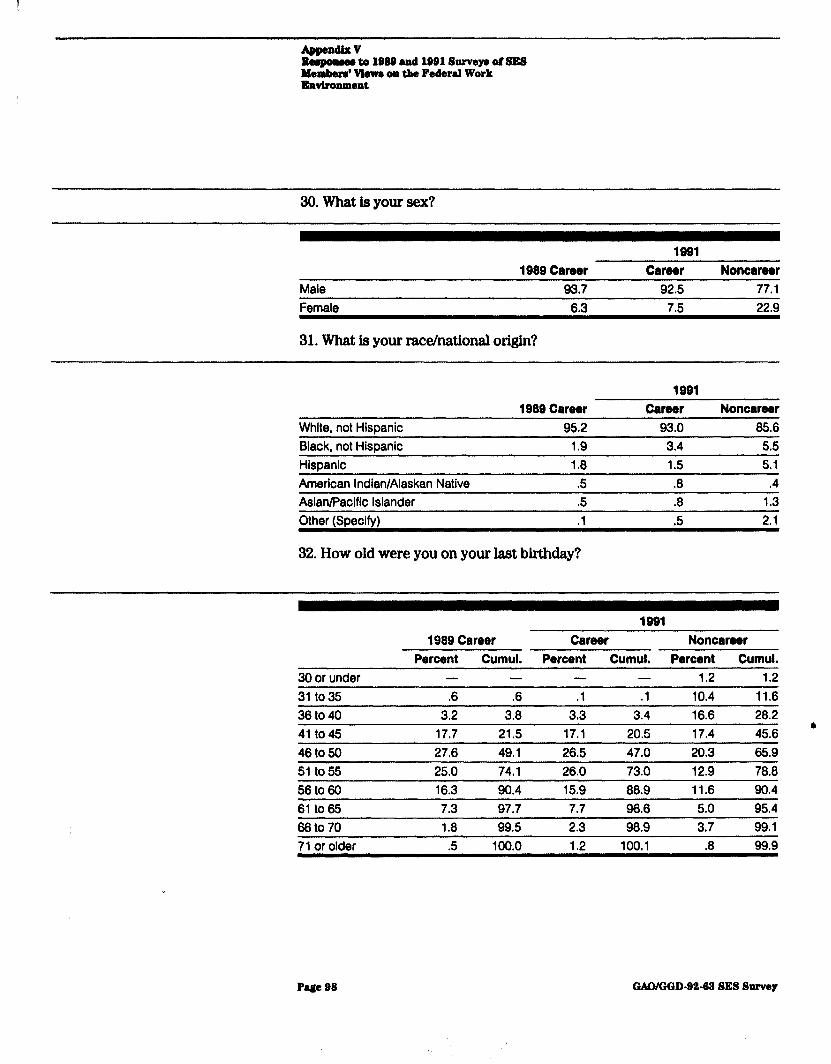
ltagmsm to 1989 and MB1 Surveyr of SES Atemben’ Vtem on the Federal Work Envllwunant
30. what is your sex?
1991 1989 hoer
Male 93.7 Female 6.3
31. What is your race/national origin?
Career Noncareer 92.5 77.1
7.5 22.9
1991
White, not Hispanic 1989 Career
95.2 Career
93.0 Noncareer
85.6 Black, not Hiwanic 1.9 3.4 5.5 Hispanlc 1.6 1.5 5.1 American Indian/Alaskan Native .5 .8 .4 AslanlPacific Islander .5 .8 1.3 Other (Specify) .l
32. How old were you on your last birthday?
.5 2.1
1991 1989 Career Career Noncareer
Percent Cumul. Percent Cumul. Percent Cumul. 30 or under - - - - 1.2 1.2 31 to35 .6 .6 .l .l 10.4 11.6 36 to 40 3.2 3.6 3.3 3.4 16.6 28.2
45.6 ' 41to45 17.7 21.5 17.1 20.5 17.4 46to50 27.6 49.1 26.5 47.0 20.3 65.9 51to-55 25.0 74.1 26.0 73.0 12.9 76.8 56to60 16.3 90.4 15.9 68.9 11.6 90.4 61 to65 7.3 97.7 7.7 96.6 5.0 95.4 66to70 1.8 99.5 2.3 96.9 3.7 99.1 71 orolder .5 100.0 1.2 100.1 .8 99.9
P4e St? GAO/GGD-92-63 SE8 Survey
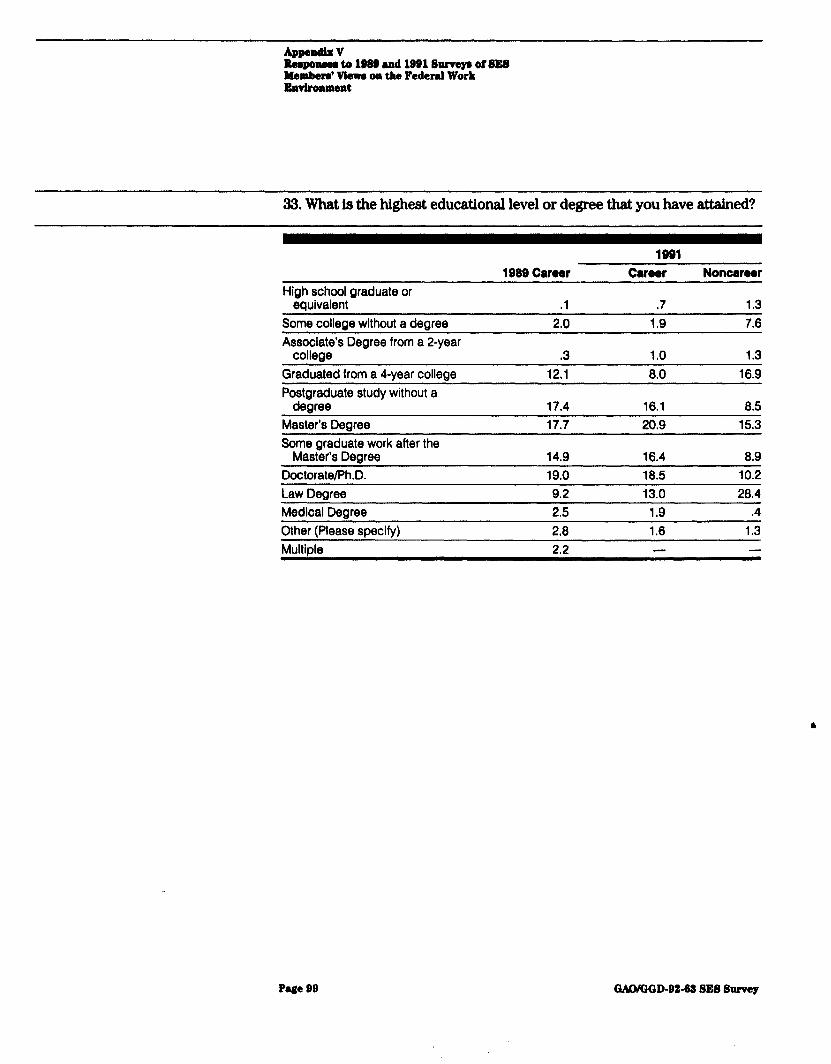
l&tow ta 1989 and 1891 Sprwyr of SES Membenr’ Vbwm on the Federal Work EnvlronInent
33. What is the highest educational level or degree that you have attained?
1991
High school graduate or equivalent
Some college without a decree
1989 Career Career Noncrreor
.l .7 1.3 2.0 1.9 7.6
Associate’s Degree from a a-year college
Graduated from a 4-year college Postgraduate study without a
degree Master’s Degree Some graduate work after the
Master’s Dearee
.3 1.0 1.3 12.1 8.0 16.9
17.4 16.1 6.5 17.7 20.9 15.3
14.9 16.4 8.9 Dcctorate/Ph.D. 19.0 18.5 10.2 Law Degree 9.2 13.0 28.4 Medlcal Degree 2.5 1.9 .4 Other (Please specify) 2.8 1.6 1.3 Multiple 2.2 -
Pa243 99 GAOKKID-92-62 SE8 Survey
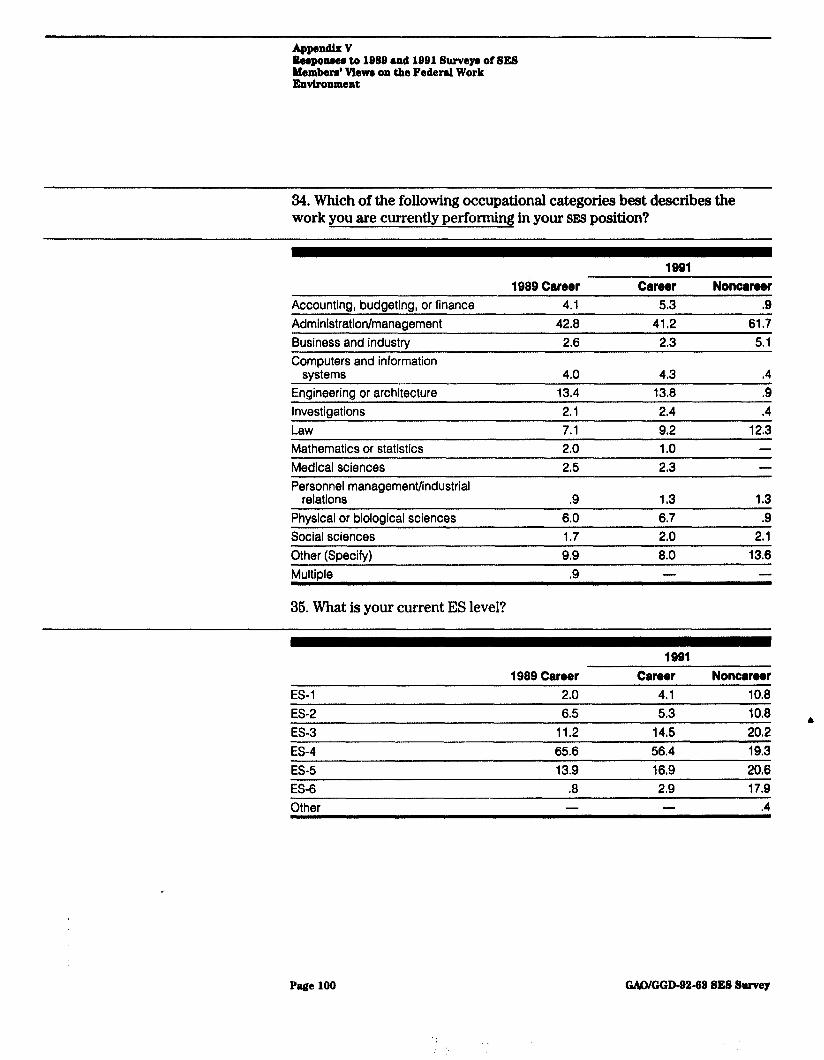
Bonponeer to 1989 md 1991 Surveyr of SE8 Men~bera’ Viern on the Federal Work EavtroBBtent
34. Which of the following occupational categories best describes the work you are currently performing in your SES position?
1969 Career 1991
Career Noncaraer Accounting, budgeting, or finance 4.1 5.3 .Q Administration/management 42.8 41.2 61.7 Business and industrv 2.6 2.3 5.1 Computers and information
systems Engineering or architecture Investigations
4.0 4.3 .4 13.4 13.8 .Q
2.1 2.4 ,4 Law 7.1 9.2 12.3 Mathematics or statistics 2.0 1.0 - Medical sciences 285 2.3 -
Personnel management/industrial relations
Physical or biological sciences Social sciences
.Q 1.3 1.3 6.0 6.7 $9 1.7 2.0 2.1
Other (Specify) 9.9 6.0 13.6 Multiple .Q -
36. What is your current ES level?
ES-1 1989 Career
2.0
1991 Career
4.1 Noncarear
10.8 ES-2 6.5 5.3 10.8 l
ES-3 11.2 14.5 20.2 ES-4 65.6 56.4 19.3 ES-5 13.9 16.9 20.6 ES-6 .8 2.9 17.9 Other - - .4
Pa2e 100 GMMGGD-92-22 SE8 Suwey
: ‘.
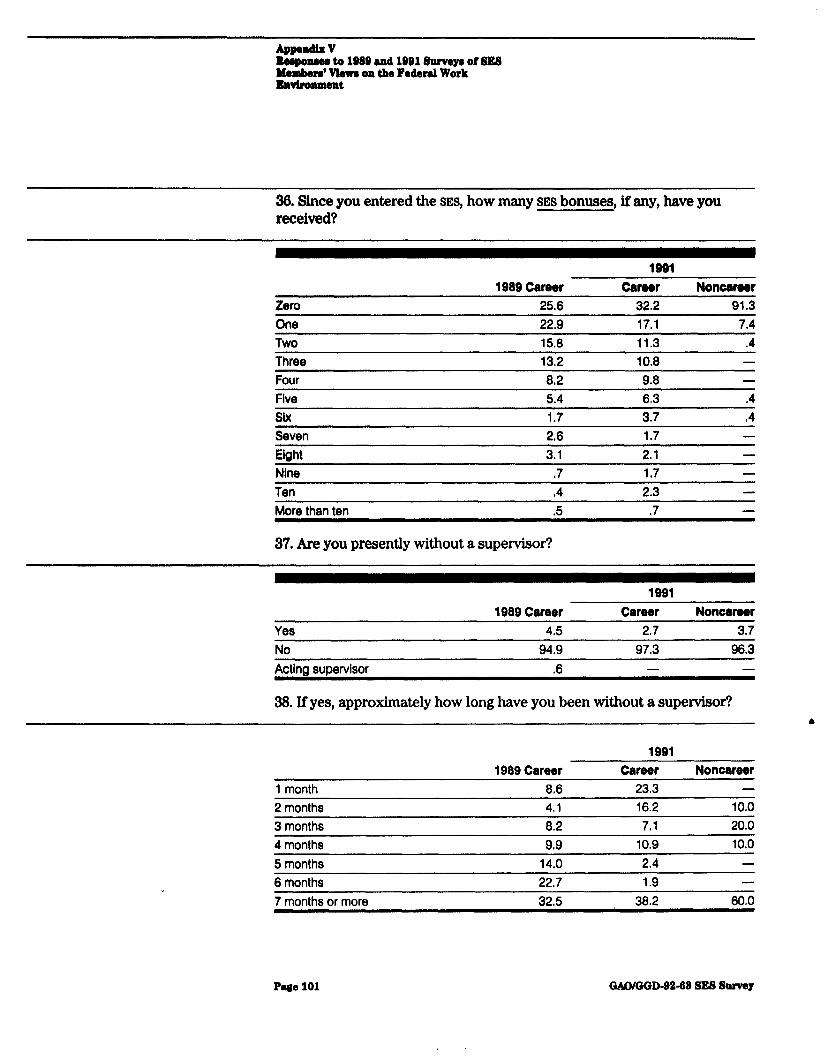
Beepomee to 1889 and lB81 Surveya of8ES lbatberd VIewe on tke Fsdeml Work Zwlronmaat
36. Since you entered the SES, how many SES bonuses, if any, have you received?
1991 1989 Career beer Noncaroor
25.6 32.2 91.3 One 22.9 17.1 7.4 Two 15.8 11.3 .4 Three 13.2 10.8 - Four 802 9.8 -
Five 5.4 6.3 .4 six 1.7 3.7 .4 Seven 206 1.7 -
Eiaht 3.1 2.1 -
Nine .7 1.7 Ten .4 2.3 -
More than ten $5
37. Are you presently without a supervisor?
.7 -
1989 Career 1091
Career Noncareer Yes 4.5 2.7 3.7 No 94.9 97.3 96.3 Acting supervisor .6 - -
33. If yes, approximately how long have you been without a supervisofl
1989 Career 1891
Career Noncarm 1 month 8.6 23.3 -
2 months 4.1 16.2 10.0 3 months 8.2 7.1 20.0 4 months 9,9 10.9 10.0 5 months 14.0 2.4 - 6 months 22.7 1.9 -
7 months or more 32.5 38.2 60.0
Page 101 GAO/GGD-fiZ-68 SE8 Survey
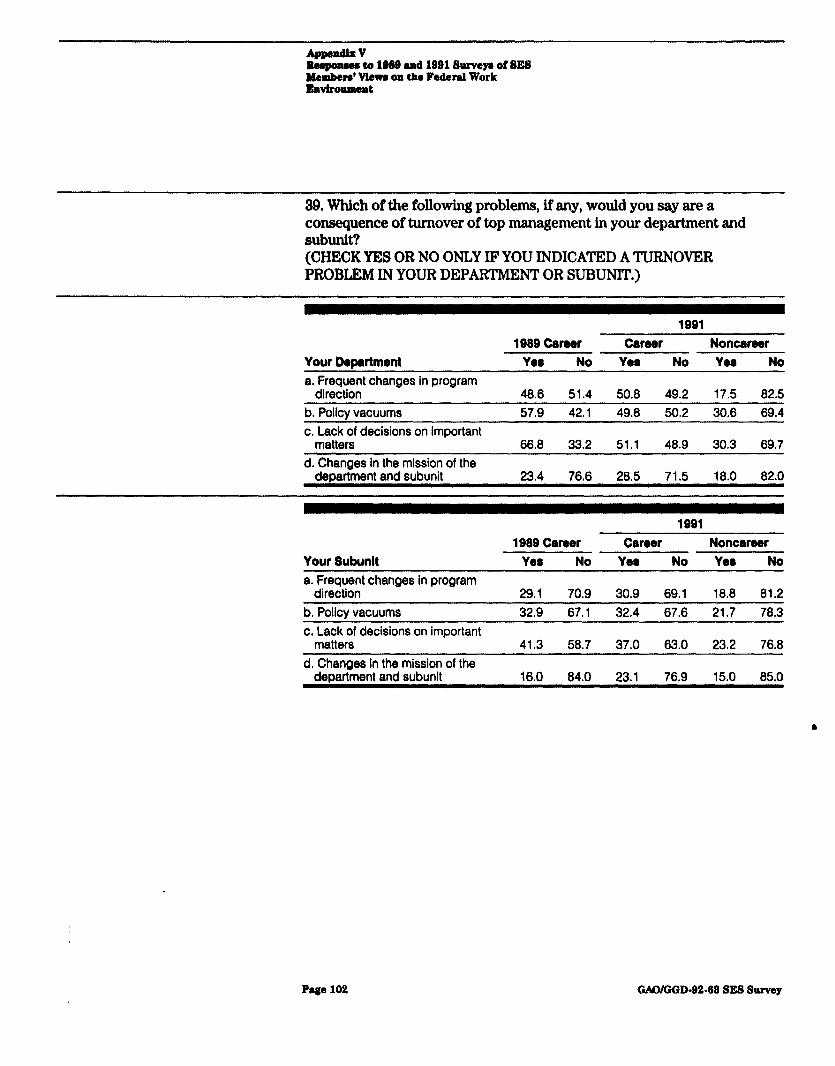
ltqmuem to 1068 and 1981 Bweya of SE8 ~~ibe~we on the Federal Work
30. Which of the following problems, if any, would you say are a consequence of turnover of top management in your department and subunit? (CHECK YES OR NO ONLY IF YOU INDICATED A TURNOVER PROBLEM IN YOUR DEPARTMENT OR SUBUNlT.)
1991
Your Dewtment 1 QM Career Career Noncareer
Yes No Ye8 No Ye8 No a. Frequent changes in program
direction 48.6 51.4 50.8 49.2 17.5 82.5 b. Policv vacuums 57.9 42.1 49.8 50.2 30.6 69.4 c. Lack of decisions on important
matters d. Changes in the mission of the
department and subunit
66.8 33.2 51.1 48.9 30.3 69.7
23.4 76.6 28.5 71.5 16.0 82.0
1991
Your Subunit a. Frequent changes in program
direction
1989 Career Career Noncareer Yes No Yea No Yea No
29.1 70.9 30.9 69.1 18.8 81.2 b. Policy vacuums c. Lack of decisions on important
matters
32.9 67.1 32.4 67.6 21.7 78.3
41.3 58.7 37.0 63.0 23.2 76.8 d. Changes In the mission of the
department and subunit 16.0 84.0 23.1 76.9 15.0 85.0
Page 102 GACMGGD-9242 SES Stuvw
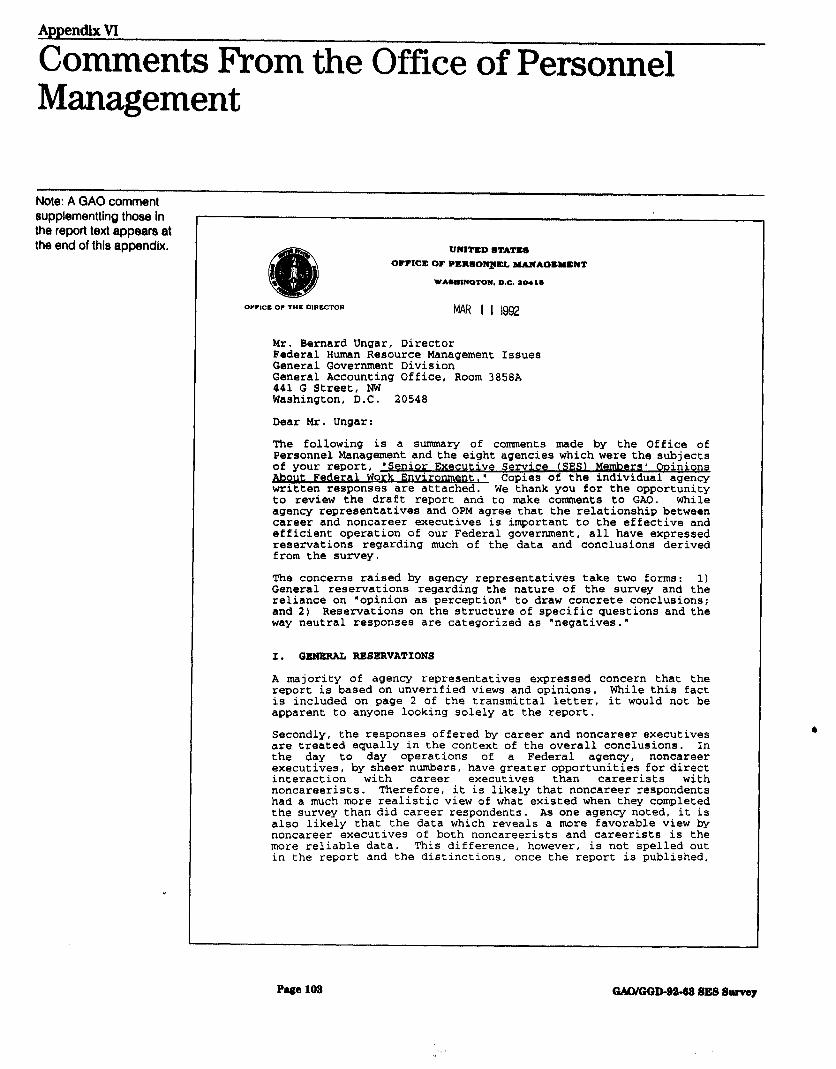
AppendixVI
Comments From the Office of Personnel Management
Note: A GAO comment supplementtlng those in the report text appears at the end of this appendix.
Y
UWlTED8TATICe OFFICI OF PEltllO~EL YAIIAOLMENT
WA8WlWOTON, D.C. 18116
OYrlCC 0, THE DIRECTOR MAR I I 1992
Mr. Bernard Ungar, Director Federal Human Resource Management Issues General Government Division General Accounting Office, Room 3858A 441 G Street, NW Washington, D.C. 20548
Dear Mr. Ungar:
The following is a summary of comments made by the Office of Personnel Management,and the eight agencies which were the subjects , " of your report, 'Senior Executive Service (SES) Members Ooznions &out Federal Work Environment.M Copies of the individual agency written responses are attached. We thank you for the opportunity to review the draft report and to make comments to GAO. While agency representatives and OPM agree that the relationship between career and noncareer executives is important to the effective and efficient operation of our Federal government, all have expressed reaervations regarding much of the data and conclusions derived from the survey.
The concerns raised by agency representatives take two forms: 1) General reservations regarding the nature of the survey and the reliance on "opinion as perception" to draw concrete conclusions; and 2) Reservations on the structure of specific questions and the way neutral responses are categorized as "negatives."
I. QBNBRAL RESERVATIONS
A majority of agency representatives expressed concern that the report is based on unverified views and opinions. While this fact is included on page 2 of the transmittal letter, it would not be apparent to anyone looking solely at the report.
Secondly, the responses offered by career and noncareer executives are treated equally in the context of the overall conclusions. In the day to day operations of a Federal agency, noncareer executives, tiw;;tar numbers, have greater opportunities,for direct interaction career executives than careerists with noncareerists. Therefore, it is likely that noncareer respondents had a much more realistic view of what existed when they completed the survey than did career respondents. As one agency noted, it is also likely that the data which reveals a more favorable view by noncareer executives of both noncareerists and careerists is the more reliable data. This difference, however, is not spelled out in the report and the distinctions, once the report is published,
Page 108
‘,
GAWGGD-fig-02 SE8 Sauve~
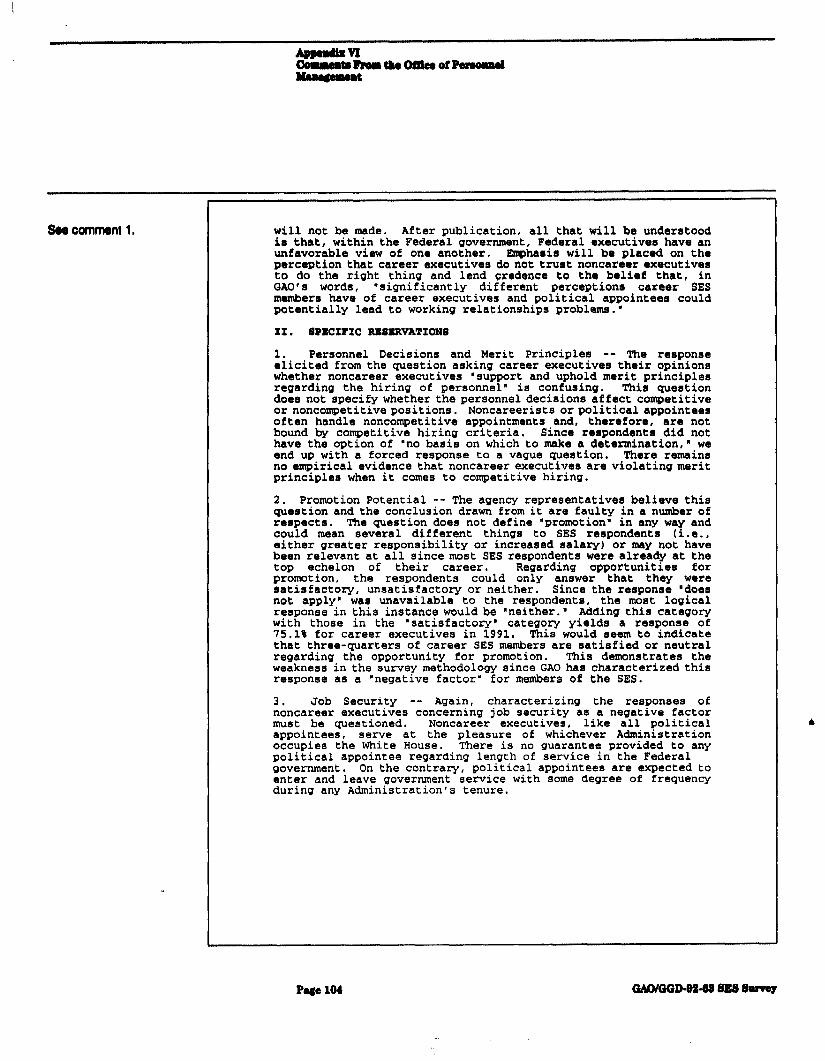
Soa cunmnt 1. will not be made. After publication, all that will be understood ie that, within the Federal government, Federal executives have an unfavorable view of one another. Emphasis will be placed on the perception that career executives do not trust noncareer executives to do the right thing and lend credence to the belief that, in GAO’s words, "significantly different perceptions career SES members have of career executives and political appointees could potentially lead to working relationships problems.*
II. SPIICI?IC RBSBRVATIONS
1. Personnel Decisions and Merit Principles -- The response elicited from the question asking career executives their opinions whether noncareer executives 'support and uphold merit principles regarding the hiring of personnel" is confusing. This question does not specify whether the personnel decisions affect competitive or noncompetitive positions. Noncareerists or political appointees often handle noncompetitive appointments and, therefore, are not bound by competitive hiring criteria. Since respondents did not have the option of "no basis on which to make a determination," we end up with a forced response to a vague question. There remains no empirical evidence that noncareer executives are violating merit principles when it comes to competitive hiring.
2. Promotion Potential -- The agency representatives believe this question and the conclusion drawn from it are faulty in a number of respects. The question does not define 'promotion in any way and could mean several different things to SES respondents (i.e., either greater responsibility or increased salary) or may not have been relevant at all since most SES respondents were already at the top echelon of their career. Regarding opportunities for promotion, the respondents could only answer that they were satisfactory, unsatisfactory or neither. Since the response 'does not apply" wa8 unavailable to the respondents, the most logical response in this instance would be "neither: Adding this category with those in the "satisfactory' category yields a response of 75.1% for career executives in 1991. This would seem to indicate that three-quarters of career SES members are satisfied or neutral regarding the opportunity for promotion. Thia demonstrates the weakness in the survey methodology since GAO has characterized this response as a "negative factor' for members of the SES.
3. Job Security -- Again, characterizing the responses of noncareer executives concerning job security as a negative factor must be questioned. Noncareer executives, like all political appointees, serve at the pleasure of whichever Administration occupies the White House. There is no guarantee provided to any political appointee regarding length of service in the Federal government. On the contrary, political appointees are expected to enter and leave government service with some degree of frequency during any Administration's tenure.
Page 104
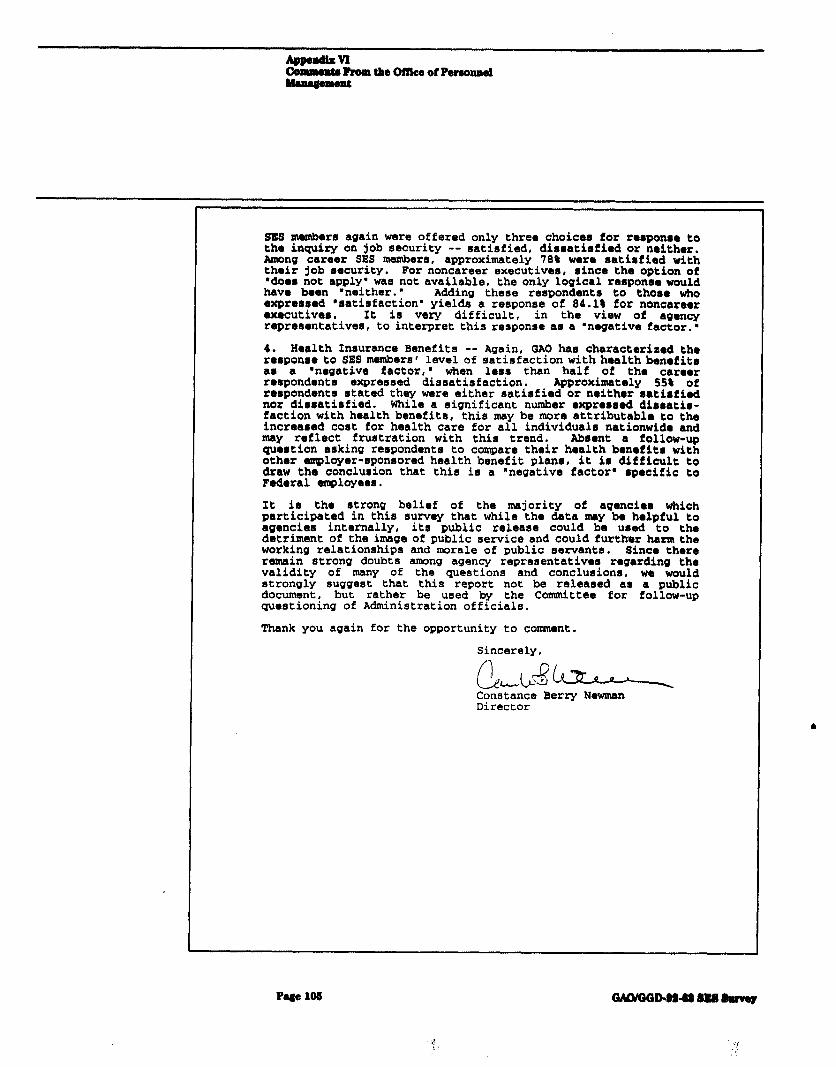
SE9 membmra again were offered only three choices for rerponrr to the inquiry on job security -- satisfied, disratirfied or neither. Among career SES membera, approximately 782 were satisfied with their job security. For noncareer executives, since the option of *does not apply’ was not available, the only logical responsa would have been ‘neither.’ Adding these respondents to theme who ucpreased nsatisfaction* yields a response of 84.13 for noncareer executivea. It is very difficult, in the view of agency representatives, to interpret this response a8 a 'negative factor:
4. Health Insurance Benefits -- Again, GAO has characterized the response to SES members' level of satisfaction with health benefit8 a8 a 'mgative factor,' when less than half of the career respondents expressed dissatisfaction. Approximately 558 of rorpondents stated they were either satisfied or neither rrtirfied nor dirratirfied. While a significant number expressed dirratir- faction with health benefits, this may be more attributable to the increased coat for health care for all individuals nationwide and may reflect frustration with this trend. Abr8nt a follow-up question asking respondents to compare their health benefit8 with other employer-sponeored health benefit plane, it i8 difficult to draw the conclurrion that this ir a ‘negative factor’ rpecific to Federal employeer.
It ir the strong belief of the majority of agencier which participated in this survey that while the data may be helpful to agencies internally, its public release could be u8ed to the detriment of the image of public service and could further harm the working relationships and morale of public servants. Since there remain strong doubts among agency representatives regarding th8 validity of many of the questions and conclusions, we would strongly suggest that this report not be released as a public document, but rather be used by the Committee for follow-up questioning of Administration officials.
Thank you again for the opportunity to comnent.
Sincerely,
Constance Berry Newman Director
Pege 106
Commente From the Ofllce ol Penonnel Wnagament
The following is a comment on the Office of Personnel Management’s March 11,1902, letter.
GAO Comment 1. OPM said that the responses offered by career and noncareer executives are treated equally in the context of the overall conclusions. OPM suggested that noncareer SES members have greater opportunities for direct interaction with career executives than career sxs members have to interact with political appointees. Therefore, OPM said it is likely that the noncareer SES respondents had a more realistic view of the work environment when they completed our questionnaire than did career sxs members. OPM, in citing the view of one agency, stated that data that reveal a more favorable view by noncareer executives of both careerists and noncareerists are the more reliable information. It said this difference is not pointed out in our report and that after the report is issued emphasis will be placed on the perception that career SES members do not trust political appointees to do the right thing, lending credence to our opinion that such different perceptions could potentially lead to working relationship problems.
We intentionally treated the responses of both career and noncareer SES members equally. We have no evidence, and OPM did not provide any, to support the assertions that noncareer sxs members had a more realistic view of the work environment when they completed the questionnaire or that their responses as a group are likely to be more reliable than career SES members. While it may be that noncareerists work with more careerists than careerists with noncareerists, this does not mean that career executives have less of a realistic view of their work environment. Indeed, they may have a broader perspective since career SES members generally have more experience in the SES than noncareerists. For l example, about 74 percent of the career SES members responding to our 1991 survey reported having been in the SES for over 3 years, as compared to about 24 percent of the noncareer SES respondents. Nevertheless, we treated responses by both groups equally. We have, however, deleted our statement that such perceptions may create working relations problems.
Page 106 WGGD-9242 SE8 Survey
Appendix VII
Major Contributors to This Report
General Government Division,
Richard Caradine, Assistant Director, Federal Human Resource
Washington, D.C. Management Issues
Norman Stubenhofer, Assistant Director, Federal Human Resource Management Issues
Helen D. Fauntleroy, Evaluator-in-Charge Jane Hoover, Evaluator Pat Wilson, Doctoral Fellow, George Mason University Stuart M. Kaufiuan, Social Science Analyst Ernestine Burt, Secretary
Page 107 GMMGD-92-22 SE8 Swvq

.
_- --.. _(-_“_l”.“-.“..l..- *~ .“I_. __.“.^*-.l.” ..,-.. -” ..___..” ,I _.- _..... - . ..^.. ” -. -. . . . . !F
----_.l..--_- .________ ____I____.._.__..._ _ ..___.... ..--.-. -...-.-. ..--~_____-- Ordering Information __--
The first copy of each GAO report and testimony is free. Additional copies are $2 each. Orders should be sent to the following address, accompanied by a check or money order made out to the Superintendent of Documents, when necessary. Orders for 100 or more copies to be mailed to a single address are discounted 26 percent.
U.S. General Accounting Office P.O. Box 6015 Gaithersburg, MD 20877
Orders may also be placed by calling (202)276-6241.
united States General Accounting Offke Wmhington, DC 20648
Official Business Pmalty for Private Use $300