Embed Size (px)
Citation preview
1 © GfK 2016 | GfK Smart Home Study
GfK Future of Smart Home Study Global Report: January 2016
January 2016
2 © GfK 2016 | GfK Smart Home Study
Contents
GfK Future of Smart Home Study
05
15
21
35
60
Introducing the study
Executive summary
Consumers and the smart home
Identifying the opportunity for smart home
Predicting the potential for smart home
73 Delivering smart home
3 © GfK 2016 | GfK Smart Home Study
Ranjiv Dale
Head of Technology, GfK UK
Foreword
The future of smart home
In the last 12 months we have seen a large number of announcements
around the smart home, showcasing a whole plethora of products and
offerings for the consumer. Analysts are predicting great things for smart
home as this is seen as a huge growth opportunity in the next few years.
It finally feels like the time that home automation and smart home
products and services will take off, as we see a host of organisations
looking to address the developing opportunity.
It was in this context that GfK decided to investigate the levels of interest
among consumers by running a global study on the smart home. The aim
was to really examine consumer reaction to smart home and try and
establish some understanding of the potential opportunity. To what extent
are consumers even aware of and interested in smart home? what
aspects really appeal? how do they expect it to work? are just some of the
questions we looked to address in this study. This report details some of
the reaction from consumers and examines if the opportunity lives up to
the hype.
4 © GfK 2016 | GfK Smart Home Study
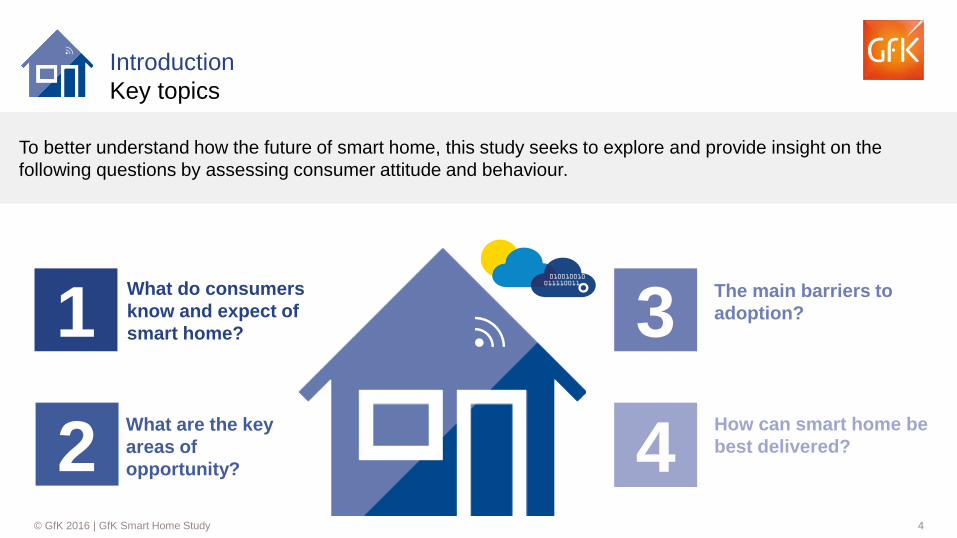
1 What do consumers
know and expect of
smart home?
2 What are the key
areas of
opportunity?
3 The main barriers to
adoption?
4 How can smart home be
best delivered?
010010010 011110011
Introduction
Key topics
To better understand how the future of smart home, this study seeks to explore and provide insight on the
following questions by assessing consumer attitude and behaviour.
5 © GfK 2016 | GfK Smart Home Study
Introduction
6 © GfK 2016 | GfK Smart Home Study
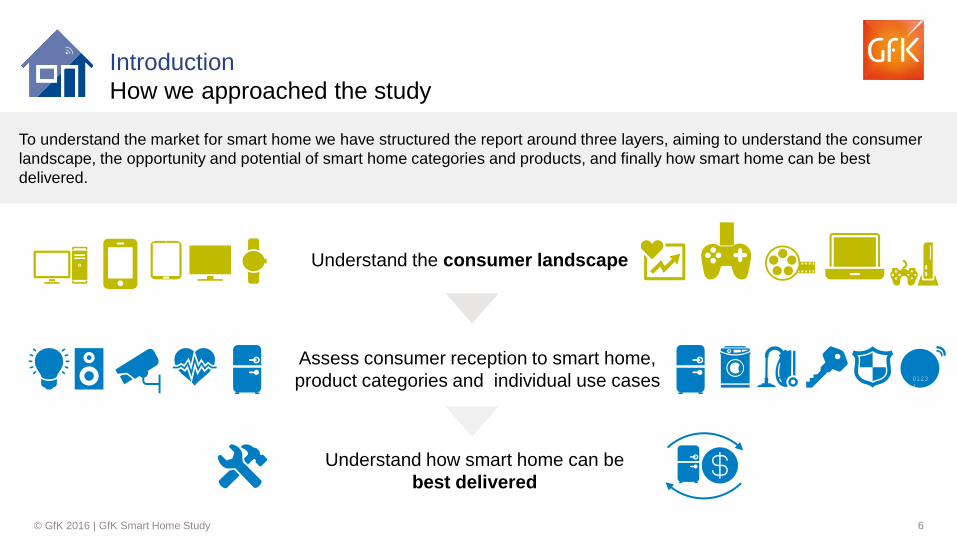
Understand the consumer landscape
Assess consumer reception to smart home,
product categories and individual use cases
Understand how smart home can be
best delivered
0123
4
Introduction
How we approached the study
To understand the market for smart home we have structured the report around three layers, aiming to understand the consumer
landscape, the opportunity and potential of smart home categories and products, and finally how smart home can be best
delivered.
7 © GfK 2016 | GfK Smart Home Study
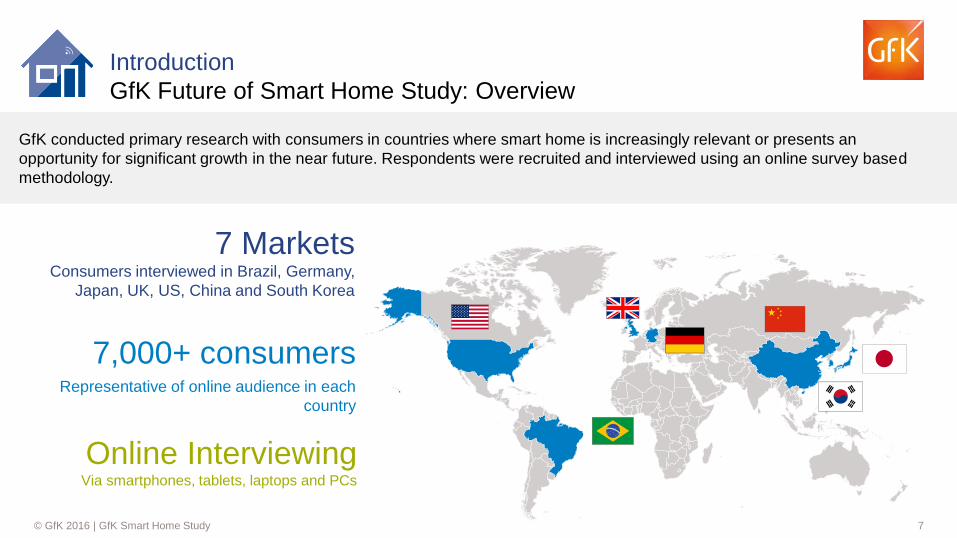
7,000+ consumers Representative of online audience in each
country
Online Interviewing Via smartphones, tablets, laptops and PCs
7 Markets Consumers interviewed in Brazil, Germany,
Japan, UK, US, China and South Korea
Introduction
GfK Future of Smart Home Study: Overview
GfK conducted primary research with consumers in countries where smart home is increasingly relevant or presents an
opportunity for significant growth in the near future. Respondents were recruited and interviewed using an online survey based
methodology.
8 © GfK 2016 | GfK Smart Home Study
Universe of
consumers
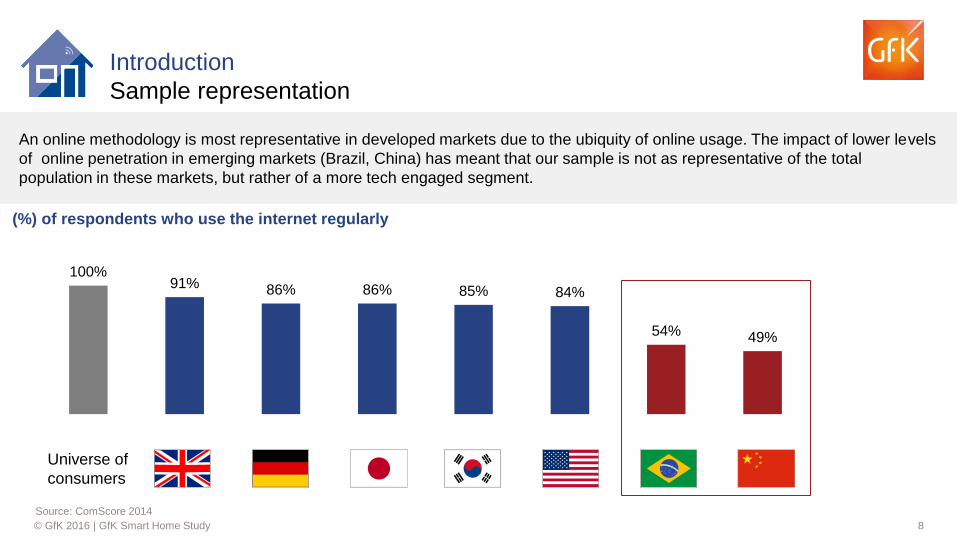
100% 91% 86% 86% 85% 84%
54% 49%
Universe UK DE JPN SK US BR CN
Introduction
Sample representation
Source: ComScore 2014
An online methodology is most representative in developed markets due to the ubiquity of online usage. The impact of lower levels
of online penetration in emerging markets (Brazil, China) has meant that our sample is not as representative of the total
population in these markets, but rather of a more tech engaged segment.
(%) of respondents who use the internet regularly
9 © GfK 2016 | GfK Smart Home Study
49% 50% 50% 51% 49% 52%
18%
19%
19%
19%
25%
16-24
25-34
35-44
45-54
55+
n=1031 n=1009 n=1017 n=1029 n=1005 n=1025 n=1033
16%
18%
18%
24%
24%
15%
17%
22%
18%
28%
19%
19%
19%
17%
26%
19%
18%
18%
18%
27%
27%
28%
25%
14%
6%
30%
32%
23%
10%
5%
49%
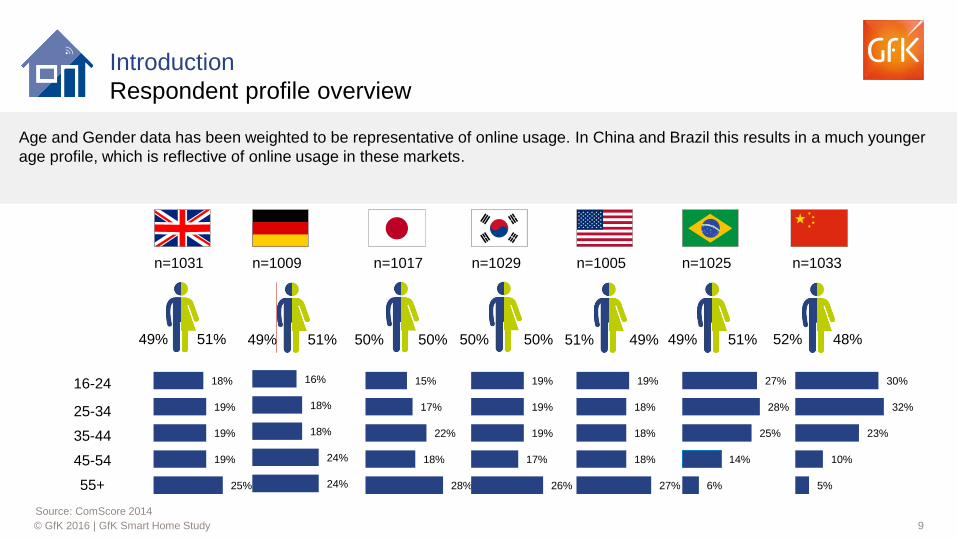
Introduction
Respondent profile overview
Source: ComScore 2014
Age and Gender data has been weighted to be representative of online usage. In China and Brazil this results in a much younger
age profile, which is reflective of online usage in these markets.
51% 51% 50% 50% 49% 51% 48%
10 © GfK 2016 | GfK Smart Home Study
n=1031 n=1009 n=1017 n=1029 n=1005 n=1025 n=1033
Own
home
57 31
11
Average household
income
(Converted to USD)
37 53
11
67 28
5
59 24
17
67 23
10
70 16
14
80
11
8
Rent Other
$52,310 $69,271 $48,470 $45,330 $27,580 $53,710 $58,070
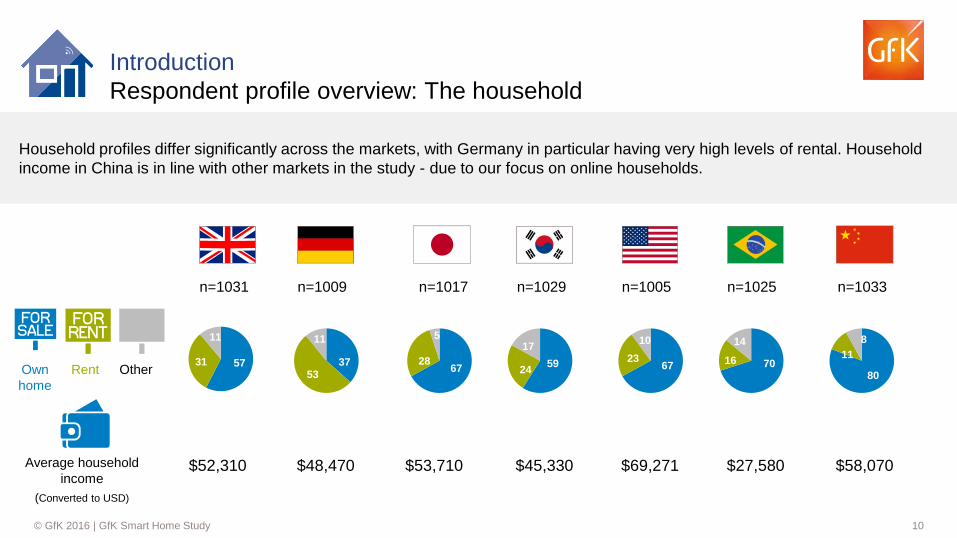
Introduction
Respondent profile overview: The household
Household profiles differ significantly across the markets, with Germany in particular having very high levels of rental. Household
income in China is in line with other markets in the study - due to our focus on online households.
11 © GfK 2016 | GfK Smart Home Study
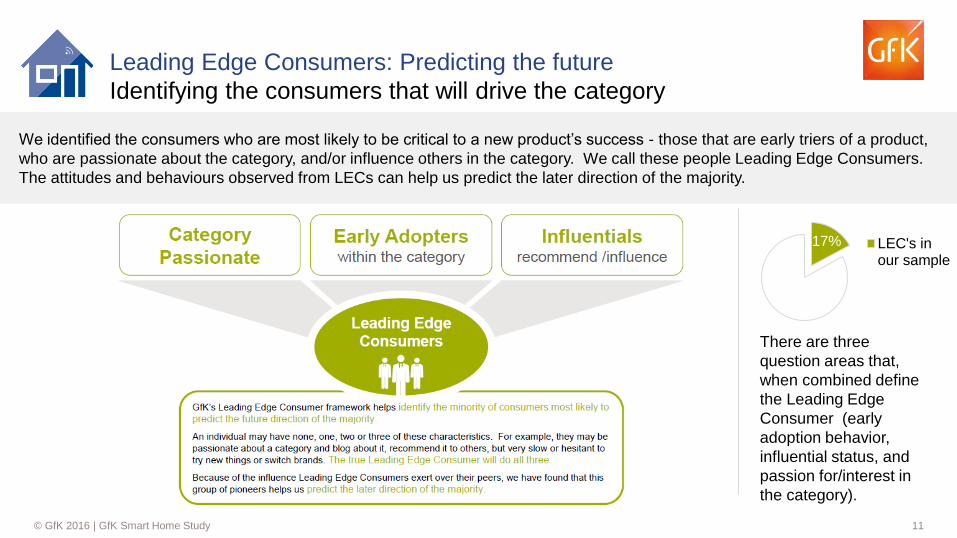
Leading Edge Consumers: Predicting the future
Identifying the consumers that will drive the category
We identified the consumers who are most likely to be critical to a new product’s success - those that are early triers of a product,
who are passionate about the category, and/or influence others in the category. We call these people Leading Edge Consumers.
The attitudes and behaviours observed from LECs can help us predict the later direction of the majority.
There are three
question areas that,
when combined define
the Leading Edge
Consumer (early
adoption behavior,
influential status, and
passion for/interest in
the category).
17% LEC's inour sample
12 © GfK 2016 | GfK Smart Home Study
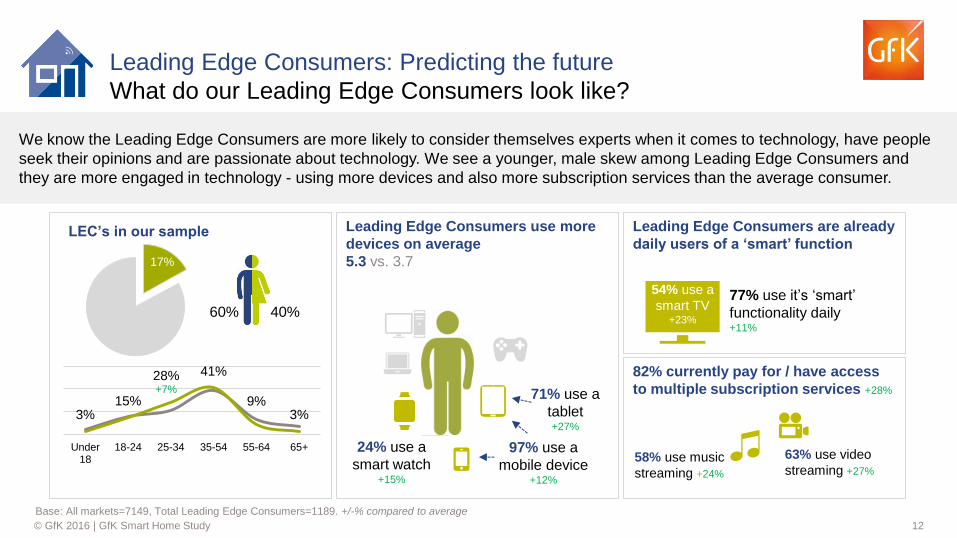
Leading Edge Consumers: Predicting the future
What do our Leading Edge Consumers look like?
Base: All markets=7149, Total Leading Edge Consumers=1189. +/-% compared to average
We know the Leading Edge Consumers are more likely to consider themselves experts when it comes to technology, have people
seek their opinions and are passionate about technology. We see a younger, male skew among Leading Edge Consumers and
they are more engaged in technology - using more devices and also more subscription services than the average consumer.
17%
LEC’s in our sample Leading Edge Consumers use more
devices on average
5.3 vs. 3.7
97% use a
mobile device +12%
71% use a
tablet +27%
24% use a
smart watch +15%
Leading Edge Consumers are already
daily users of a ‘smart’ function
77% use it’s ‘smart’
functionality daily +11%
54% use a
smart TV +23%
82% currently pay for / have access
to multiple subscription services +28%
63% use video
streaming +27%
58% use music
streaming +24%
3% 15%
28% +7%
41%
9% 3%
Under18
18-24 25-34 35-54 55-64 65+
60% 40%
13 © GfK 2016 | GfK Smart Home Study
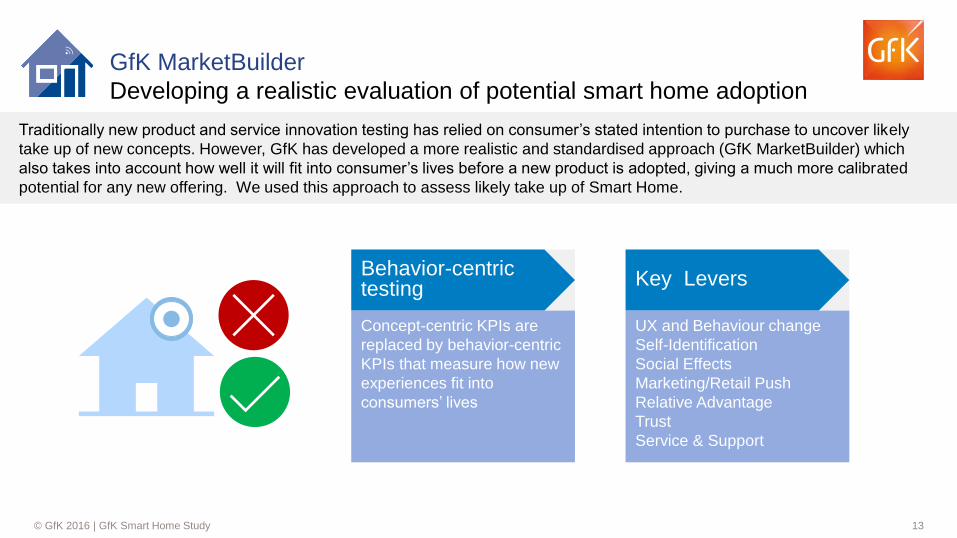
GfK MarketBuilder
Developing a realistic evaluation of potential smart home adoption
Traditionally new product and service innovation testing has relied on consumer’s stated intention to purchase to uncover likely
take up of new concepts. However, GfK has developed a more realistic and standardised approach (GfK MarketBuilder) which
also takes into account how well it will fit into consumer’s lives before a new product is adopted, giving a much more calibrated
potential for any new offering. We used this approach to assess likely take up of Smart Home.
Behavior-centric testing
Concept-centric KPIs are
replaced by behavior-centric
KPIs that measure how new
experiences fit into
consumers’ lives
Key Levers
UX and Behaviour change
Self-Identification
Social Effects
Marketing/Retail Push
Relative Advantage
Trust
Service & Support
14 © GfK 2016 | GfK Smart Home Study
Global Overview Detailed country reports Brazil, Germany,
Japan, UK, US, China, South Korea
Introduction
This report in context
This report is a global overview of the finding of the GfK smart home study. In addition, country deep dive reports are available that
provide a more detailed market evaluation from January 2016.
15 © GfK 2016 | GfK Smart Home Study
Executive Summary
16 © GfK 2016 | GfK Smart Home Study
Consumers and the smart home: Consumer awareness and expectations are high for smart home
When we examine the level of currency that ‘smart home’ as a term has, it is clear that consumer
expectations are high on what smart home will offer:
• Nearly two-thirds of consumers are familiar with the term and half of them expect smart home
technology to impact their lives in the next few years;
• The expectations are particularly high among Leading Edge Consumers (LECs), where more than ‘3
in 4’ expecting it to have an impact on their lives ahead of all other technology trends;
• While familiarity with the term is high, the depth of knowledge is relatively limited, with few claiming to
know a lot about the terms (except in US/China and Brazil where more than 20% claim to have a lot of
knowledge);
• To some extent, people have already adopted some smart home technology, with over a quarter
already owning at least one smart home device (level of adoption is considerably higher among LECs,
with more than half owning at least one smart home device);
• However, the fragmented nature of the market is seen in the fact that there is no single ‘hero’ product
that is driving the adoption of smart home devices, with a whole host of products having been adopted
to date.
17 © GfK 2016 | GfK Smart Home Study
Identifying the opportunity for smart home: Many consumers clearly understand smart home to be relevant and useful
Reaction to the concept as a whole and also specific categories and products within these show that
smart home is seen as potentially relevant to many consumers’ lives:
• The appeal and relevance of the smart home concept itself and across specific categories is relatively
high with smart security & control and energy & lighting emerging as the areas of most appeal;
• The levels of appeal and interest are considerably higher among LECs, Millennials and Gen X and
also those with High/Medium income levels, suggesting that these groups should be targeted for initial
development;
• However, while appeal is relatively high, there remains a significant proportion of consumers who are
lukewarm to smart home, suggesting they need to be fully convinced of the merits of adopting this
technology and how it could improve their lives;
• Overall, we see similar levels of interest and stated intention to purchase amongst the specific
products tested within each category area;
• Among Leading Edge Consumers, the stated intention to purchase specific products is considerably
higher and their interest centres on smart lighting and appliances in the main.
18 © GfK 2016 | GfK Smart Home Study
Predicting the potential for smart home: Current levels of understanding will only support incremental growth globally
While the majority of consumers state they intend to adopt a smart home device in the next 2 years,
validating this potential adoptions shows only 14% will be likely to do so:
• Using GfK’s MarketBuilder validation approach to the adoption of smart home technology reveals that
three key areas emerge that will prevent widescale adoption – trust, the user experience and
personal identification with smart home technology;
• Concerns around trust in the brands and how they will handle data privacy, learning how to use the
new technology as well as feeling it fits with them personally are the key barriers to taking on the
technology;
• The validated purchasers of smart home technology are evident in high levels in China and Brazil –
which is expected in these markets given the online population is younger and more tech engaged –
and is also seen to a high level in the US (16%);
• Likely adoption levels are considerably lower in the UK (6%) and Germany (6%) and Japan (3%) –
who need greater education of the benefits and how smart home will work for them;
• The main areas they will adopt centre on smart lighting, detectors and appliances;
• When consumers were asked directly on barrier’s to adopting smart home technology the key stated
concerns are cost, data privacy and knowledge emerge as issues that they need to be convince on.
19 © GfK 2016 | GfK Smart Home Study
Delivering smart home: A clear expectation and desire for simplicity and seamlessness
Consumers expect the smart home to be delivered and managed in a seamless and simple fashion with
an expectation that the disparate technologies will work together in the background:
• The majority of consumers expect devices to connect and communicate with each other and would be
willing to pay for a single application to control all the devices in the home;
• This expectation is amplified amongst those that already own a smart home device and also for
Leading Edge Consumers, suggesting this need will need to be delivered on if smart home adoption is
to take off;
• Interest in simplicity for the smart home is further reflected in the fact that many consumers would
prefer to have a single vendor supply all their smart home technology (43%);
• How consumers expect to control the smart home is reflective of current device ownership levels, with
Smartphones emerging as the key expectation;
• Installation, maintenance and payment options reflect the device dominated nature of the current
smart home market, with many preferring to self install and maintain devices and to pay for devices as
a ‘one-off’ payment (especially among LECs);
• In terms of the types of companies expected to offer smart home products, this reflects the diversity of
organisations that consumers trust, ranging from manufacturers, technology brands and retailers as
well as utilities in particular for smart energy & lighting.
20 © GfK 2016 | GfK Smart Home Study
Key implications for developing the smart home opportunity
In order for brands to realise the potential for smart home it is clear there a number of issues they will need to consider:
• Positively, it appears that a lot of the market hype and buzz around the category has already connected with
consumers but this will also have raised hopes on smart home delivery;
• Consumers have a clear desire for simplicity and expectations on how smart home technology will work in the
home – the current fragmentation and lack of coherency across the disparate devices will potentially only drive
incremental growth;
• Communicating how smart home technology will fit in with and enhance people’s lives is key as well as ensuring
that the user experience is engaging and intuitive in order to truly deliver mass market adoption;
• It will also be critical that concerns around the data collected (via smart home technology) are allayed – trust is
going to be a key issue that brands will need to reassure buyers on;
• Building value across the devices and usage in the home will also be central to communicating the potential of the
smart home – this means a number of organisations will have to work together and unlikely partnerships will form
to address consumer needs;
• Ultimately, brands will need to be clear on how making the home smarter will really benefit consumers and how
adopting the technology could transform their lives.
21 © GfK 2016 | GfK Smart Home Study
Consumers and the smart home
22 © GfK 2016 | GfK Smart Home Study
Consumers and the smart home
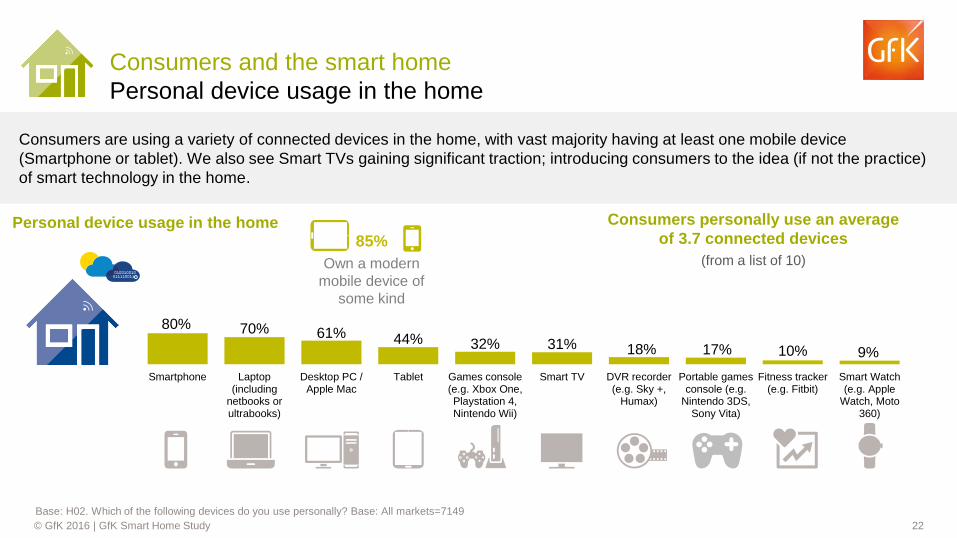
Personal device usage in the home
Base: H02. Which of the following devices do you use personally? Base: All markets=7149
Consumers are using a variety of connected devices in the home, with vast majority having at least one mobile device
(Smartphone or tablet). We also see Smart TVs gaining significant traction; introducing consumers to the idea (if not the practice)
of smart technology in the home.
80% 70% 61% 44% 32% 31% 18% 17% 10% 9%
Smartphone Laptop(including
netbooks orultrabooks)
Desktop PC /Apple Mac
Tablet Games console(e.g. Xbox One,Playstation 4,Nintendo Wii)
Smart TV DVR recorder(e.g. Sky +,
Humax)
Portable gamesconsole (e.g.
Nintendo 3DS,Sony Vita)
Fitness tracker(e.g. Fitbit)
Smart Watch(e.g. Apple
Watch, Moto360)
Consumers personally use an average
of 3.7 connected devices
(from a list of 10)
85%
Own a modern
mobile device of
some kind
010010010 011110011
Personal device usage in the home
23 © GfK 2016 | GfK Smart Home Study
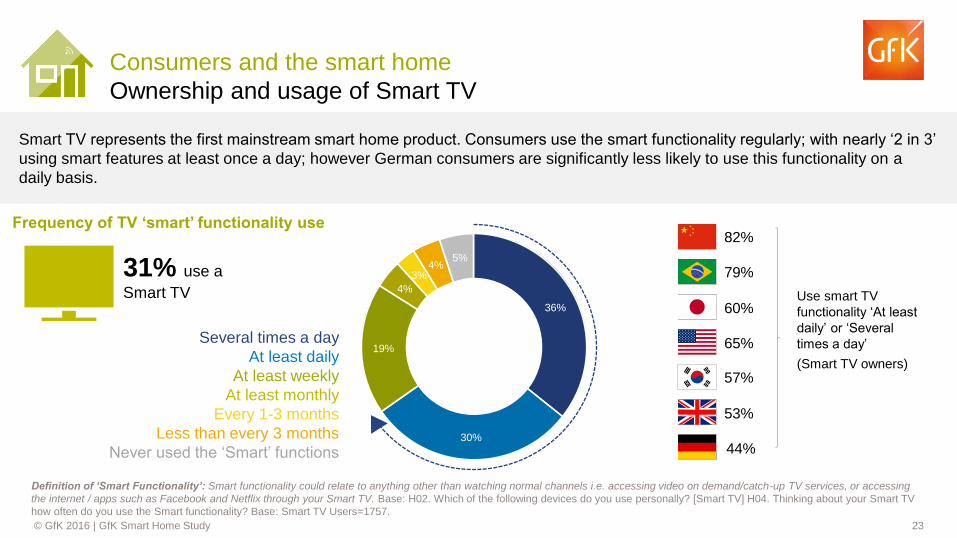
Definition of ‘Smart Functionality’: Smart functionality could relate to anything other than watching normal channels i.e. accessing video on demand/catch-up TV services, or accessing
the internet / apps such as Facebook and Netflix through your Smart TV. Base: H02. Which of the following devices do you use personally? [Smart TV] H04. Thinking about your Smart TV
how often do you use the Smart functionality? Base: Smart TV Users=1757.
Consumers and the smart home
Ownership and usage of Smart TV
Smart TV represents the first mainstream smart home product. Consumers use the smart functionality regularly; with nearly ‘2 in 3’
using smart features at least once a day; however German consumers are significantly less likely to use this functionality on a
daily basis.
Several times a day
At least daily
At least weekly
At least monthly
Every 1-3 months
Less than every 3 months
Never used the ‘Smart’ functions
31% use a
Smart TV
53%
44%
65%
60%
79%
82%
57%
Use smart TV
functionality ‘At least
daily’ or ‘Several
times a day’
(Smart TV owners)
36%
30%
19%
4%
3% 4%
5%
Frequency of TV ‘smart’ functionality use
24 © GfK 2016 | GfK Smart Home Study
Consumers and the smart home
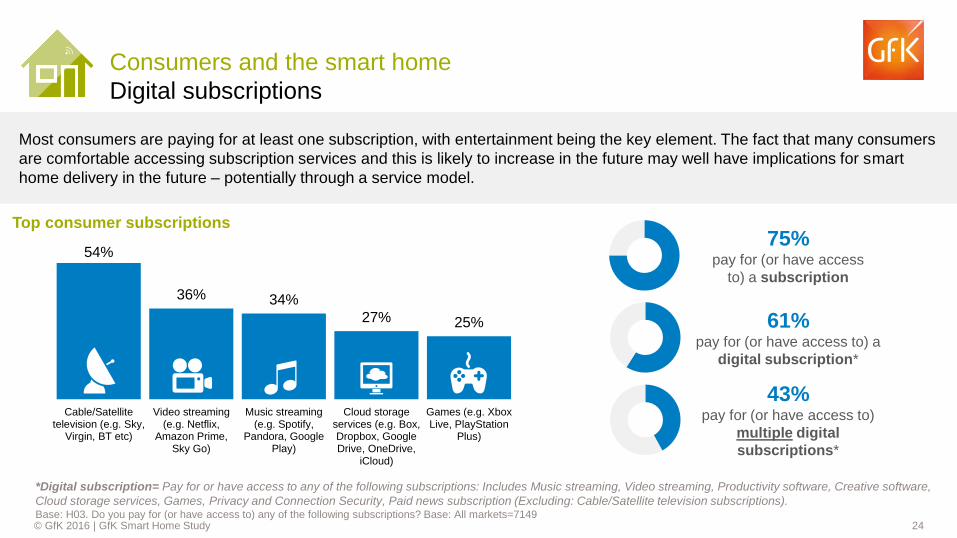
Digital subscriptions
*Digital subscription= Pay for or have access to any of the following subscriptions: Includes Music streaming, Video streaming, Productivity software, Creative software,
Cloud storage services, Games, Privacy and Connection Security, Paid news subscription (Excluding: Cable/Satellite television subscriptions). Base: H03. Do you pay for (or have access to) any of the following subscriptions? Base: All markets=7149
Most consumers are paying for at least one subscription, with entertainment being the key element. The fact that many consumers
are comfortable accessing subscription services and this is likely to increase in the future may well have implications for smart
home delivery in the future – potentially through a service model.
54%
36% 34%
27% 25%
Cable/Satellitetelevision (e.g. Sky,
Virgin, BT etc)
Video streaming(e.g. Netflix,
Amazon Prime,Sky Go)
Music streaming(e.g. Spotify,
Pandora, GooglePlay)
Cloud storageservices (e.g. Box,Dropbox, GoogleDrive, OneDrive,
iCloud)
Games (e.g. XboxLive, PlayStation
Plus)
43% pay for (or have access to)
multiple digital
subscriptions*
61% pay for (or have access to) a
digital subscription*
75% pay for (or have access
to) a subscription
Top consumer subscriptions
25 © GfK 2016 | GfK Smart Home Study
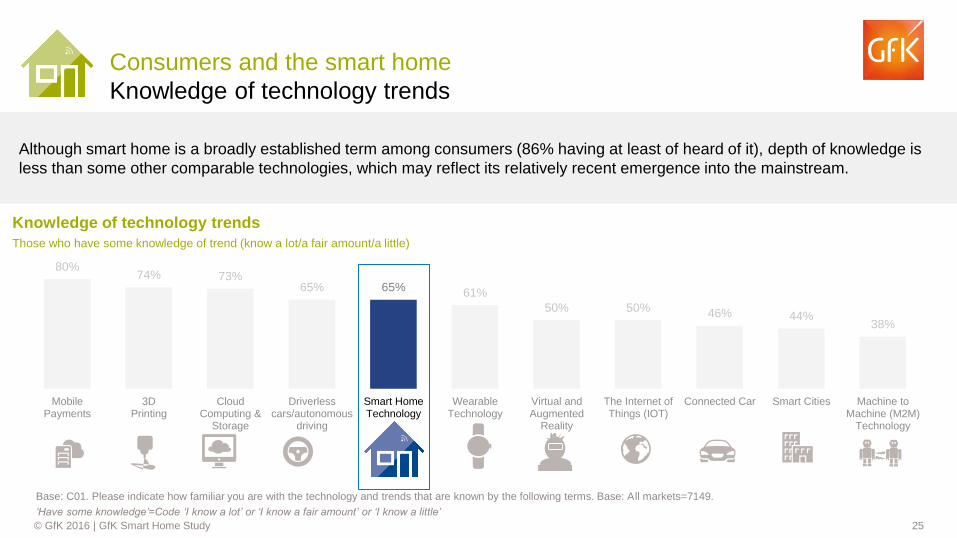
80% 74% 73%
65% 65% 61%
50% 50% 46% 44% 38%
MobilePayments
3DPrinting
CloudComputing &
Storage
Driverlesscars/autonomous
driving
Smart HomeTechnology
WearableTechnology
Virtual andAugmented
Reality
The Internet ofThings (IOT)
Connected Car Smart Cities Machine toMachine (M2M)
Technology
Consumers and the smart home
Knowledge of technology trends
Although smart home is a broadly established term among consumers (86% having at least of heard of it), depth of knowledge is
less than some other comparable technologies, which may reflect its relatively recent emergence into the mainstream.
Base: C01. Please indicate how familiar you are with the technology and trends that are known by the following terms. Base: All markets=7149.
‘Have some knowledge’=Code ‘I know a lot’ or ‘I know a fair amount’ or ‘I know a little’
Knowledge of technology trends
Those who have some knowledge of trend (know a lot/a fair amount/a little)
26 © GfK 2016 | GfK Smart Home Study
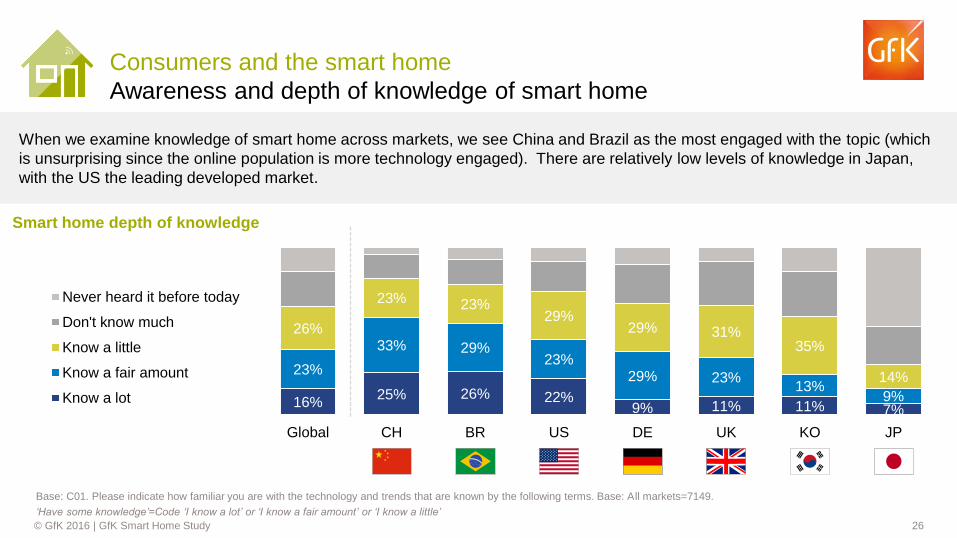
Consumers and the smart home
Awareness and depth of knowledge of smart home
When we examine knowledge of smart home across markets, we see China and Brazil as the most engaged with the topic (which
is unsurprising since the online population is more technology engaged). There are relatively low levels of knowledge in Japan,
with the US the leading developed market.
16% 25% 26% 22%
9% 11% 11% 7%
23%
33% 29% 23%
29% 23% 13%
9%
26%
23% 23% 29%
29% 31% 35%
14%
Global CH BR US DE UK KO JP
Never heard it before today
Don't know much
Know a little
Know a fair amount
Know a lot
Base: C01. Please indicate how familiar you are with the technology and trends that are known by the following terms. Base: All markets=7149.
‘Have some knowledge’=Code ‘I know a lot’ or ‘I know a fair amount’ or ‘I know a little’
Smart home depth of knowledge
27 © GfK 2016 | GfK Smart Home Study
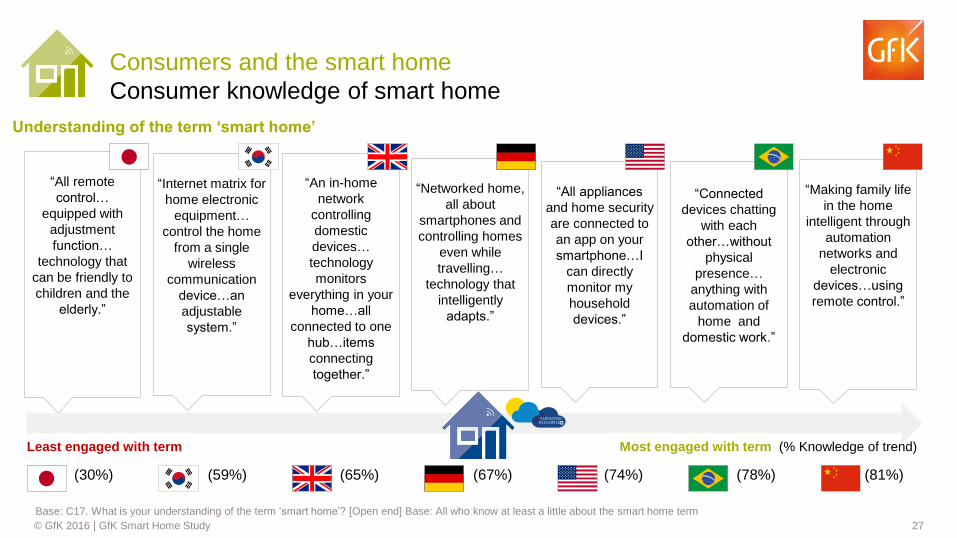
“All remote
control…
equipped with
adjustment
function…
technology that
can be friendly to
children and the
elderly.”
Consumers and the smart home
Consumer knowledge of smart home
Base: C17. What is your understanding of the term ‘smart home’? [Open end] Base: All who know at least a little about the smart home term
Most engaged with term (% Knowledge of trend) Least engaged with term
(74%) (65%) (67%) (78%) (81%) (30%) (59%)
“Internet matrix for
home electronic
equipment…
control the home
from a single
wireless
communication
device…an
adjustable
system.”
“An in-home
network
controlling
domestic
devices…
technology
monitors
everything in your
home…all
connected to one
hub…items
connecting
together.”
“Networked home,
all about
smartphones and
controlling homes
even while
travelling…
technology that
intelligently
adapts.”
“All appliances
and home security
are connected to
an app on your
smartphone…I
can directly
monitor my
household
devices.”
“Connected
devices chatting
with each
other…without
physical
presence…
anything with
automation of
home and
domestic work.”
“Making family life
in the home
intelligent through
automation
networks and
electronic
devices…using
remote control.”
010010010 011110011
Understanding of the term ‘smart home’
28 © GfK 2016 | GfK Smart Home Study
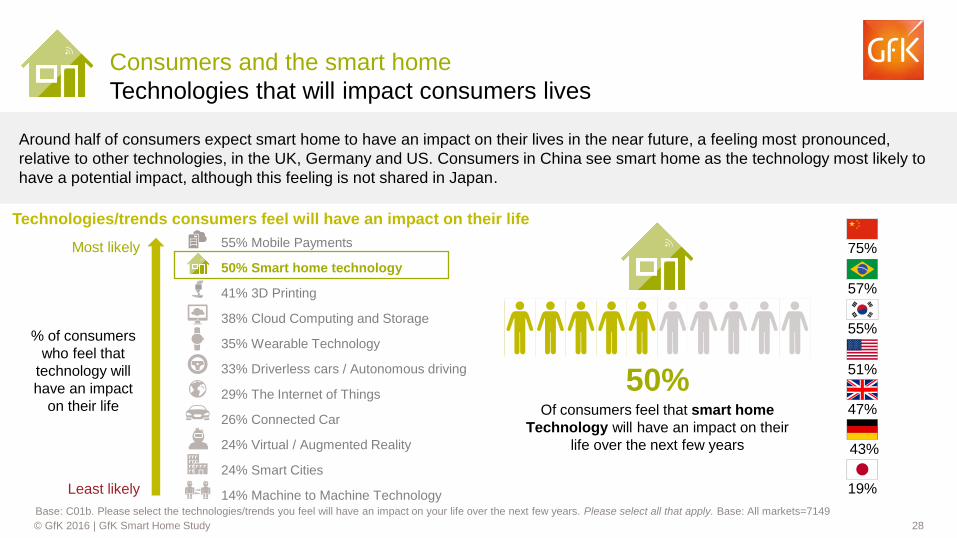
Of consumers feel that smart home
Technology will have an impact on their
life over the next few years
Consumers and the smart home
Technologies that will impact consumers lives
Base: C01b. Please select the technologies/trends you feel will have an impact on your life over the next few years. Please select all that apply. Base: All markets=7149
Around half of consumers expect smart home to have an impact on their lives in the near future, a feeling most pronounced,
relative to other technologies, in the UK, Germany and US. Consumers in China see smart home as the technology most likely to
have a potential impact, although this feeling is not shared in Japan.
55% Mobile Payments
50% Smart home technology
41% 3D Printing
38% Cloud Computing and Storage
35% Wearable Technology
33% Driverless cars / Autonomous driving
29% The Internet of Things
26% Connected Car
24% Virtual / Augmented Reality
24% Smart Cities
14% Machine to Machine Technology
50% 47%
43%
51%
19%
57%
75% Most likely
Least likely
55% % of consumers
who feel that
technology will
have an impact
on their life
Technologies/trends consumers feel will have an impact on their life
29 © GfK 2016 | GfK Smart Home Study
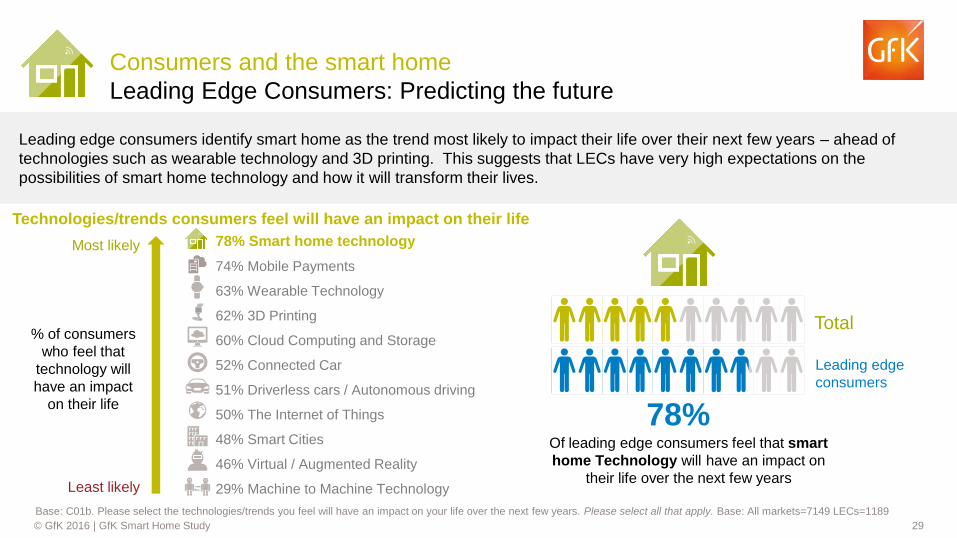
78% Smart home technology
74% Mobile Payments
63% Wearable Technology
62% 3D Printing
60% Cloud Computing and Storage
52% Connected Car
51% Driverless cars / Autonomous driving
50% The Internet of Things
48% Smart Cities
46% Virtual / Augmented Reality
29% Machine to Machine Technology
Of leading edge consumers feel that smart
home Technology will have an impact on
their life over the next few years
Consumers and the smart home
Leading Edge Consumers: Predicting the future
Base: C01b. Please select the technologies/trends you feel will have an impact on your life over the next few years. Please select all that apply. Base: All markets=7149 LECs=1189
78%
Most likely
Least likely
% of consumers
who feel that
technology will
have an impact
on their life
Total
Leading edge
consumers
Leading edge consumers identify smart home as the trend most likely to impact their life over their next few years – ahead of
technologies such as wearable technology and 3D printing. This suggests that LECs have very high expectations on the
possibilities of smart home technology and how it will transform their lives.
Technologies/trends consumers feel will have an impact on their life
30 © GfK 2016 | GfK Smart Home Study
1 device owned
2-3 devices owned
Over 3 devices owned
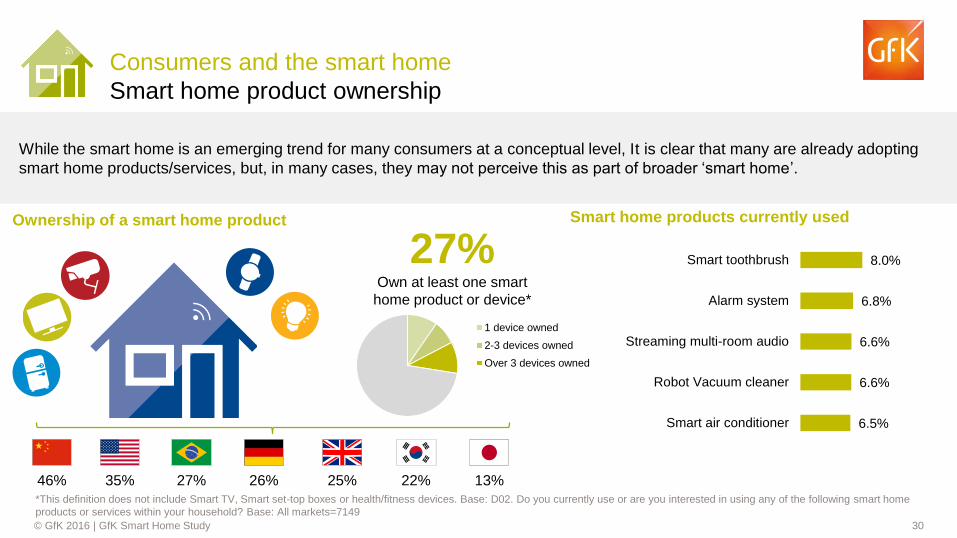
27% Own at least one smart
home product or device*
25% 26% 35% 22% 27% 13% 46%
Smart home products currently used
Consumers and the smart home
Smart home product ownership
*This definition does not include Smart TV, Smart set-top boxes or health/fitness devices. Base: D02. Do you currently use or are you interested in using any of the following smart home
products or services within your household? Base: All markets=7149
While the smart home is an emerging trend for many consumers at a conceptual level, It is clear that many are already adopting
smart home products/services, but, in many cases, they may not perceive this as part of broader ‘smart home’.
Ownership of a smart home product
6.5%
6.6%
6.6%
6.8%
8.0%
Smart air conditioner
Robot Vacuum cleaner
Streaming multi-room audio
Alarm system
Smart toothbrush
31 © GfK 2016 | GfK Smart Home Study
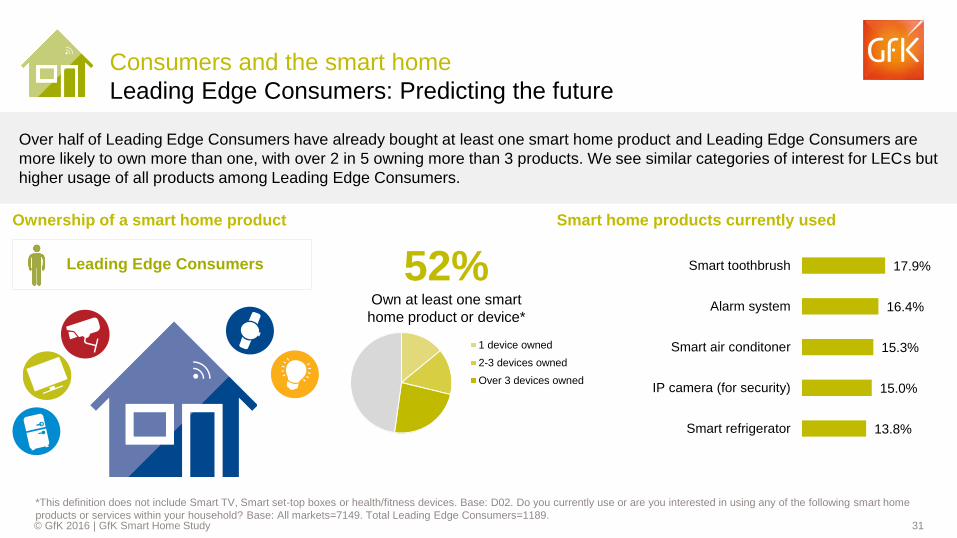
52% Own at least one smart
home product or device*
Smart home products currently used
Consumers and the smart home
Leading Edge Consumers: Predicting the future
*This definition does not include Smart TV, Smart set-top boxes or health/fitness devices. Base: D02. Do you currently use or are you interested in using any of the following smart home
products or services within your household? Base: All markets=7149. Total Leading Edge Consumers=1189.
Over half of Leading Edge Consumers have already bought at least one smart home product and Leading Edge Consumers are
more likely to own more than one, with over 2 in 5 owning more than 3 products. We see similar categories of interest for LECs but
higher usage of all products among Leading Edge Consumers.
Ownership of a smart home product
1 device owned
2-3 devices owned
Over 3 devices owned
Leading Edge Consumers
13.8%
15.0%
15.3%
16.4%
17.9%
Smart refrigerator
IP camera (for security)
Smart air conditoner
Alarm system
Smart toothbrush
32 © GfK 2016 | GfK Smart Home Study
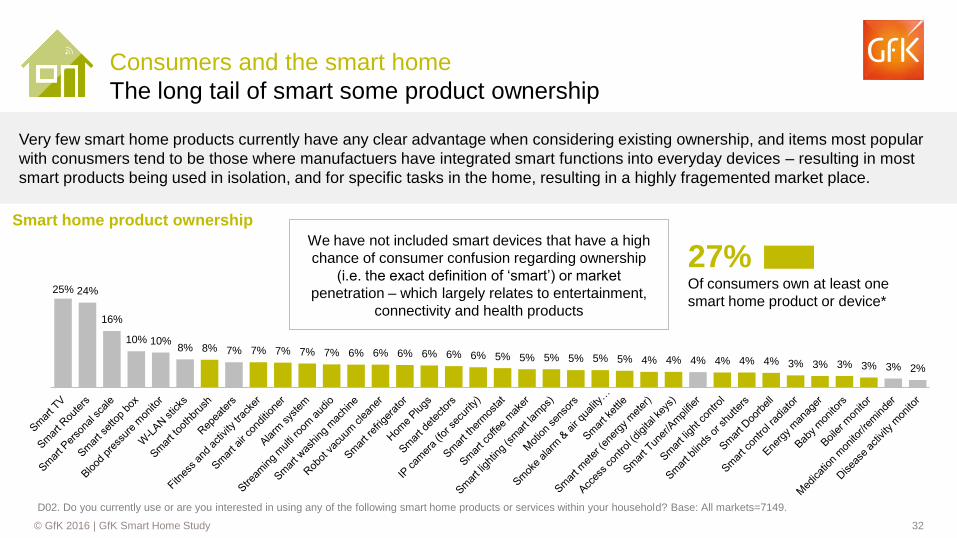
27% Of consumers own at least one
smart home product or device*
Consumers and the smart home
The long tail of smart some product ownership
We have not included smart devices that have a high
chance of consumer confusion regarding ownership
(i.e. the exact definition of ‘smart’) or market
penetration – which largely relates to entertainment,
connectivity and health products
Very few smart home products currently have any clear advantage when considering existing ownership, and items most popular
with conusmers tend to be those where manufactuers have integrated smart functions into everyday devices – resulting in most
smart products being used in isolation, and for specific tasks in the home, resulting in a highly fragemented market place.
Smart home product ownership
25% 24%
16%
10% 10% 8% 8% 7% 7% 7% 7% 7% 6% 6% 6% 6% 6% 6% 5% 5% 5% 5% 5% 5% 4% 4% 4% 4% 4% 4% 3% 3% 3% 3% 3% 2%
D02. Do you currently use or are you interested in using any of the following smart home products or services within your household? Base: All markets=7149.
33 © GfK 2016 | GfK Smart Home Study
37%
34%
41%
37%
37%
36%
29%
30%
32%
32%
22%
24%
22%
27%
22%
3%
10%
4%
3%
5%
2%
4%
3%
2%
4%
Extremely satisfied Very satisfied Satisfied Somewhat dissatisfied Dissatisfied
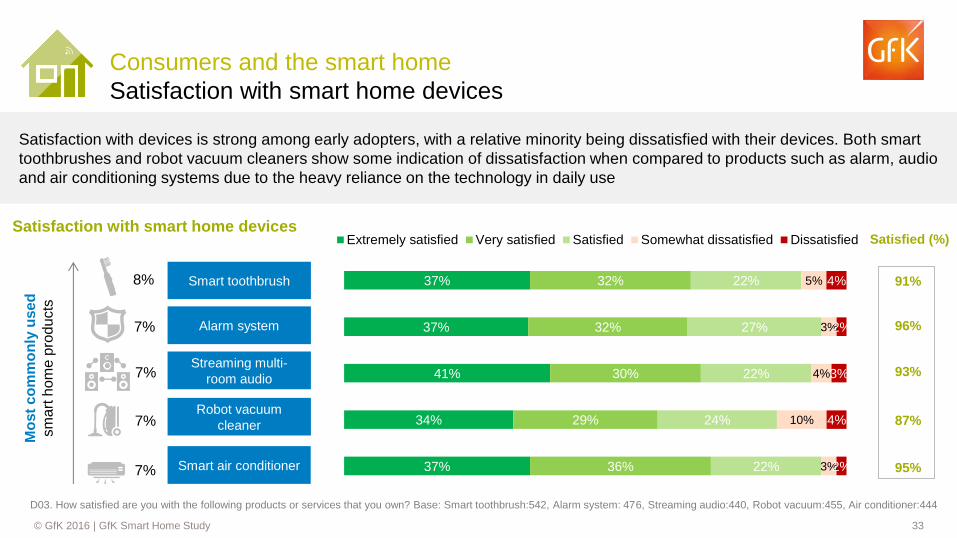
Satisfaction with devices is strong among early adopters, with a relative minority being dissatisfied with their devices. Both smart
toothbrushes and robot vacuum cleaners show some indication of dissatisfaction when compared to products such as alarm, audio
and air conditioning systems due to the heavy reliance on the technology in daily use
Consumers and the smart home
Satisfaction with smart home devices
Smart toothbrush
Alarm system
Streaming multi-
room audio
Robot vacuum
cleaner
Smart air conditioner
Mo
st
co
mm
on
ly u
se
d
sm
art
hom
e p
rod
ucts
Satisfaction with smart home devices Satisfied (%)
91%
96%
93%
87%
95%
8%
7%
7%
7%
7%
D03. How satisfied are you with the following products or services that you own? Base: Smart toothbrush:542, Alarm system: 476, Streaming audio:440, Robot vacuum:455, Air conditioner:444
34 © GfK 2016 | GfK Smart Home Study
Consumers and the smart home
Expectations from smart home
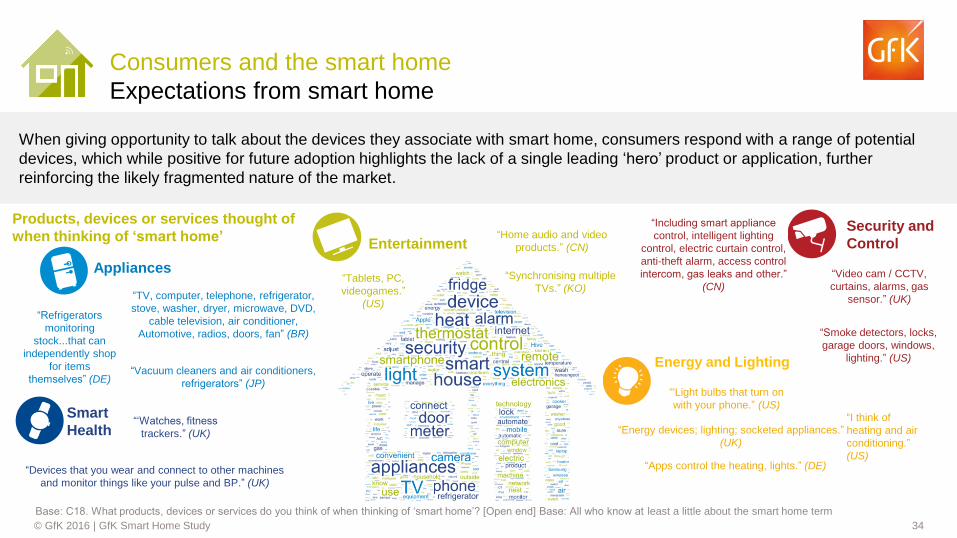
Base: C18. What products, devices or services do you think of when thinking of ‘smart home’? [Open end] Base: All who know at least a little about the smart home term
When giving opportunity to talk about the devices they associate with smart home, consumers respond with a range of potential
devices, which while positive for future adoption highlights the lack of a single leading ‘hero’ product or application, further
reinforcing the likely fragmented nature of the market.
Energy and Lighting
Security and
Control Entertainment
Smart
Health
Appliances
“Home audio and video
products.” (CN)
“Devices that you wear and connect to other machines
and monitor things like your pulse and BP.” (UK)
“Refrigerators
monitoring
stock...that can
independently shop
for items
themselves” (DE)
“Smoke detectors, locks,
garage doors, windows,
lighting.” (US)
“I think of
heating and air
conditioning.”
(US)
“Energy devices; lighting; socketed appliances.”
(UK)
“'Light bulbs that turn on
with your phone.” (US)
“Vacuum cleaners and air conditioners,
refrigerators” (JP)
“Video cam / CCTV,
curtains, alarms, gas
sensor.” (UK)
“‘Watches, fitness
trackers.” (UK)
“Synchronising multiple
TVs.” (KO)
“Including smart appliance
control, intelligent lighting
control, electric curtain control,
anti-theft alarm, access control
intercom, gas leaks and other.”
(CN) “Tablets, PC,
videogames.”
(US)
“Apps control the heating, lights.” (DE)
“TV, computer, telephone, refrigerator,
stove, washer, dryer, microwave, DVD,
cable television, air conditioner,
Automotive, radios, doors, fan” (BR)
Products, devices or services thought of
when thinking of ‘smart home’
35 © GfK 2016 | GfK Smart Home Study
Identifying the opportunity for smart home
36 © GfK 2016 | GfK Smart Home Study
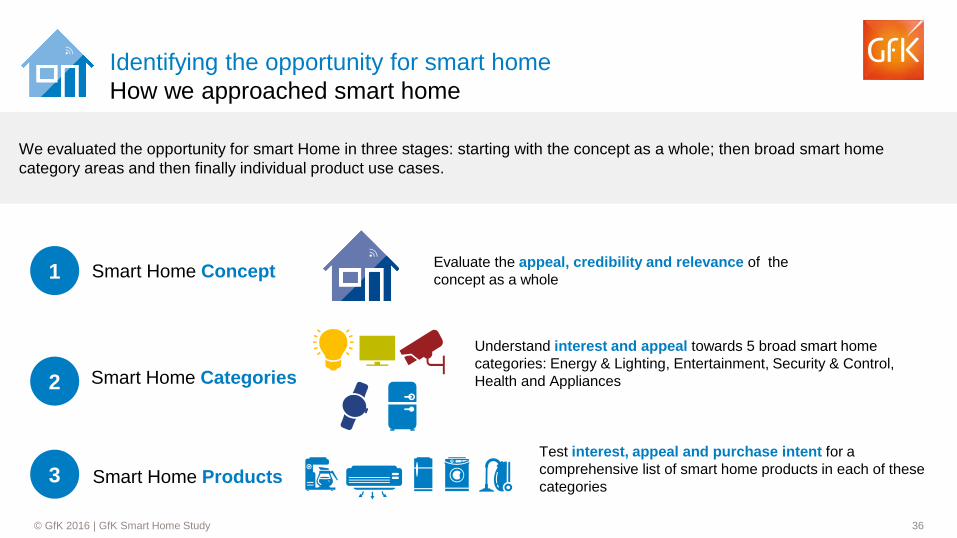
We evaluated the opportunity for smart Home in three stages: starting with the concept as a whole; then broad smart home
category areas and then finally individual product use cases.
Smart Home Concept
Smart Home Categories
Smart Home Products
Evaluate the appeal, credibility and relevance of the
concept as a whole
Understand interest and appeal towards 5 broad smart home
categories: Energy & Lighting, Entertainment, Security & Control,
Health and Appliances
Test interest, appeal and purchase intent for a
comprehensive list of smart home products in each of these
categories
1
2
3
Identifying the opportunity for smart home
How we approached smart home
37 © GfK 2016 | GfK Smart Home Study
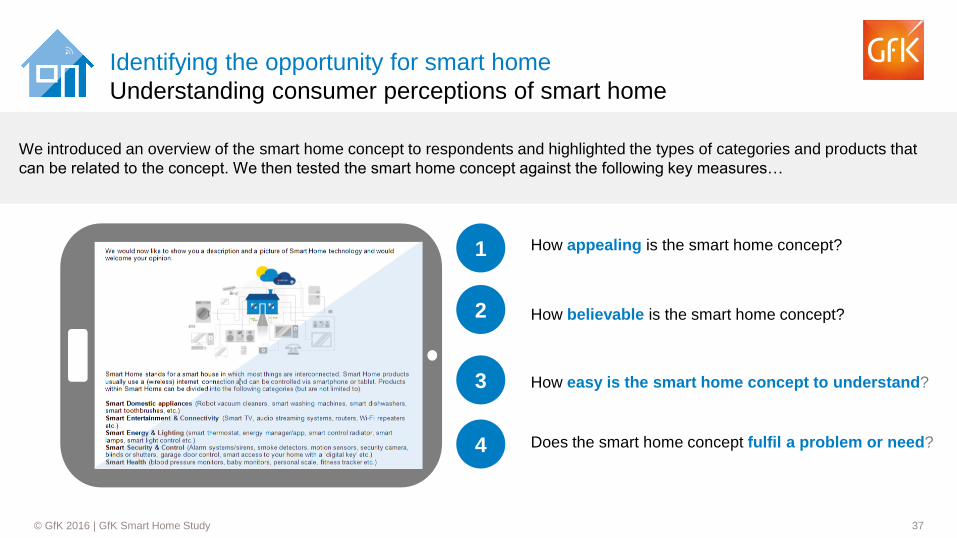
We introduced an overview of the smart home concept to respondents and highlighted the types of categories and products that
can be related to the concept. We then tested the smart home concept against the following key measures…
How appealing is the smart home concept?
How believable is the smart home concept?
How easy is the smart home concept to understand?
Does the smart home concept fulfil a problem or need?
Identifying the opportunity for smart home
Understanding consumer perceptions of smart home
1
2
3
4
38 © GfK 2016 | GfK Smart Home Study
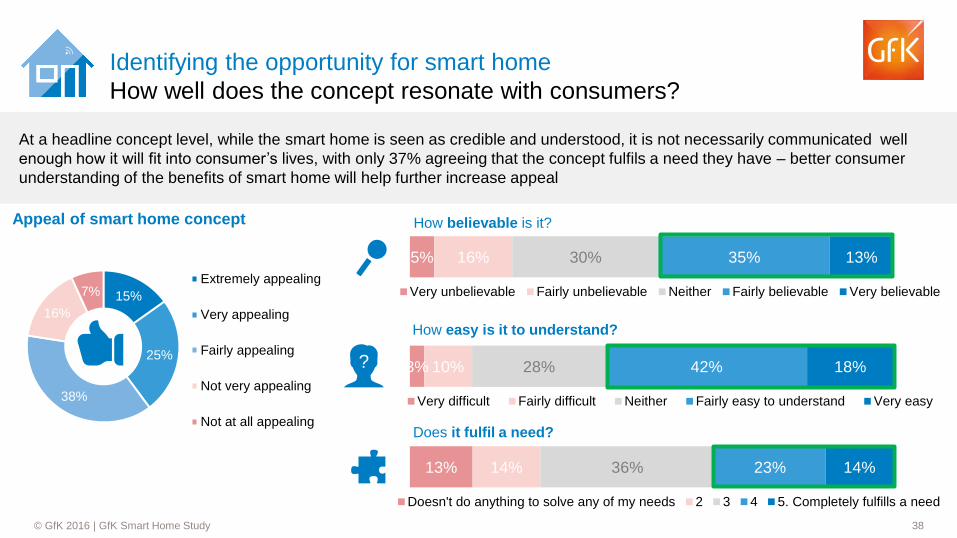
15%
25%
38%
16%
7% Extremely appealing
Very appealing
Fairly appealing
Not very appealing
Not at all appealing
At a headline concept level, while the smart home is seen as credible and understood, it is not necessarily communicated well
enough how it will fit into consumer’s lives, with only 37% agreeing that the concept fulfils a need they have – better consumer
understanding of the benefits of smart home will help further increase appeal
Identifying the opportunity for smart home
How well does the concept resonate with consumers?
5% 16% 30% 35% 13%
Very unbelievable Fairly unbelievable Neither Fairly believable Very believable
How believable is it?
3% 10% 28% 42% 18%
Very difficult Fairly difficult Neither Fairly easy to understand Very easy
13% 14% 36% 23% 14%
Doesn't do anything to solve any of my needs 2 3 4 5. Completely fulfills a need
Does it fulfil a need?
How easy is it to understand?
Appeal of smart home concept
?
39 © GfK 2016 | GfK Smart Home Study
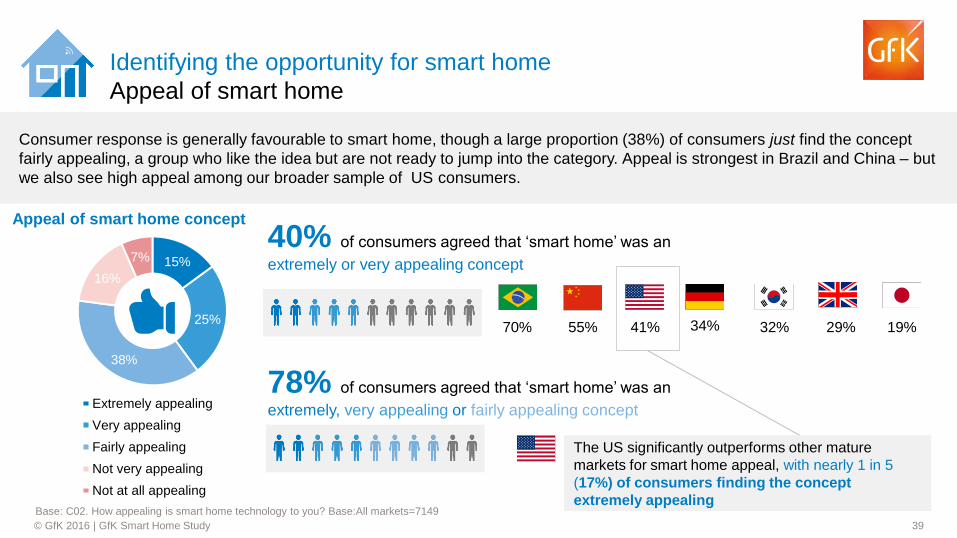
15%
25%
38%
16%
7%
Extremely appealing
Very appealing
Fairly appealing
Not very appealing
Not at all appealing
Consumer response is generally favourable to smart home, though a large proportion (38%) of consumers just find the concept
fairly appealing, a group who like the idea but are not ready to jump into the category. Appeal is strongest in Brazil and China – but
we also see high appeal among our broader sample of US consumers.
Identifying the opportunity for smart home
Appeal of smart home
Base: C02. How appealing is smart home technology to you? Base:All markets=7149
40% of consumers agreed that ‘smart home’ was an
extremely or very appealing concept
41% 34% 32% 29% 70% 19% 55%
78% of consumers agreed that ‘smart home’ was an
extremely, very appealing or fairly appealing concept
The US significantly outperforms other mature
markets for smart home appeal, with nearly 1 in 5
(17%) of consumers finding the concept
extremely appealing
Appeal of smart home concept
40 © GfK 2016 | GfK Smart Home Study
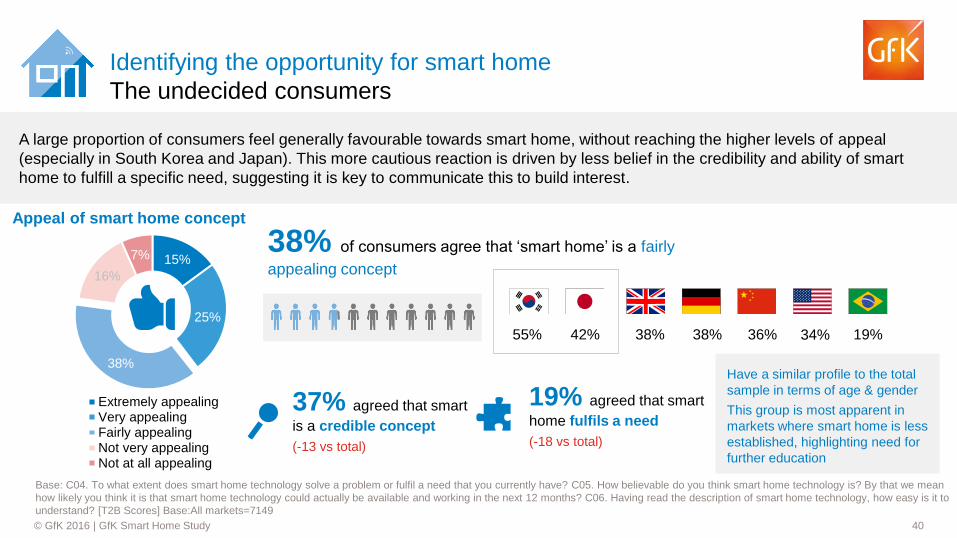
15%
25%
38%
16%
7%
Extremely appealingVery appealingFairly appealingNot very appealingNot at all appealing
Identifying the opportunity for smart home
The undecided consumers
Base: C04. To what extent does smart home technology solve a problem or fulfil a need that you currently have? C05. How believable do you think smart home technology is? By that we mean
how likely you think it is that smart home technology could actually be available and working in the next 12 months? C06. Having read the description of smart home technology, how easy is it to
understand? [T2B Scores] Base:All markets=7149
A large proportion of consumers feel generally favourable towards smart home, without reaching the higher levels of appeal
(especially in South Korea and Japan). This more cautious reaction is driven by less belief in the credibility and ability of smart
home to fulfill a specific need, suggesting it is key to communicate this to build interest.
38% of consumers agree that ‘smart home’ is a fairly
appealing concept
34% 38% 55% 38% 19% 42% 36%
19% agreed that smart
home fulfils a need
(-18 vs total)
Have a similar profile to the total
sample in terms of age & gender
This group is most apparent in
markets where smart home is less
established, highlighting need for
further education
Appeal of smart home concept
37% agreed that smart
is a credible concept
(-13 vs total)
41 © GfK 2016 | GfK Smart Home Study
19%
28% 36%
12% 5% Extremely appealing
Very appealing
Fairly appealing
Not very appealing
Not at all appealing
14%
27%
36%
16%
6% Extremely appealing
Very appealing
Fairly appealing
Not very appealing
Not at all appealing
8%
18%
40%
23%
11% Extremely appealing
Very appealing
Fairly appealing
Not very appealing
Not at all appealing
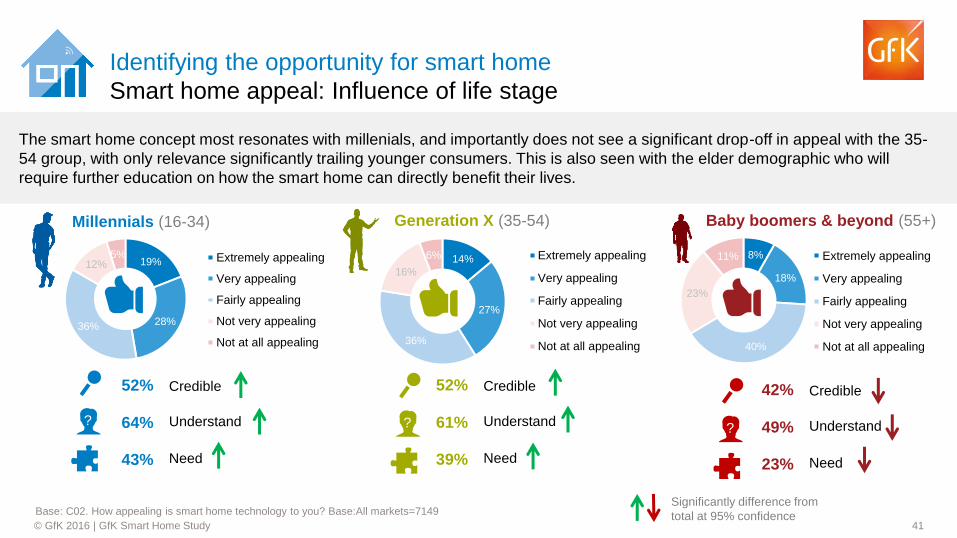
The smart home concept most resonates with millenials, and importantly does not see a significant drop-off in appeal with the 35-
54 group, with only relevance significantly trailing younger consumers. This is also seen with the elder demographic who will
require further education on how the smart home can directly benefit their lives.
Identifying the opportunity for smart home
Smart home appeal: Influence of life stage
Millennials (16-34) Generation X (35-54) Baby boomers & beyond (55+)
Credible 52%
64% Understand
Need 43%
Base: C02. How appealing is smart home technology to you? Base:All markets=7149
Credible 52%
61% Understand
Need 39%
Credible 42%
49% Understand
Need 23%
? ?
Significantly difference from
total at 95% confidence
?
42 © GfK 2016 | GfK Smart Home Study
23%
29% 31%
12% 5% Extremely appealing
Very appealing
Fairly appealing
Not very appealing
Not at all appealing
15%
28%
36%
14%
7% Extremely appealing
Very appealing
Fairly appealing
Not very appealing
Not at all appealing
9%
20%
43%
20%
8% Extremely appealing
Very appealing
Fairly appealing
Not very appealing
Not at all appealing
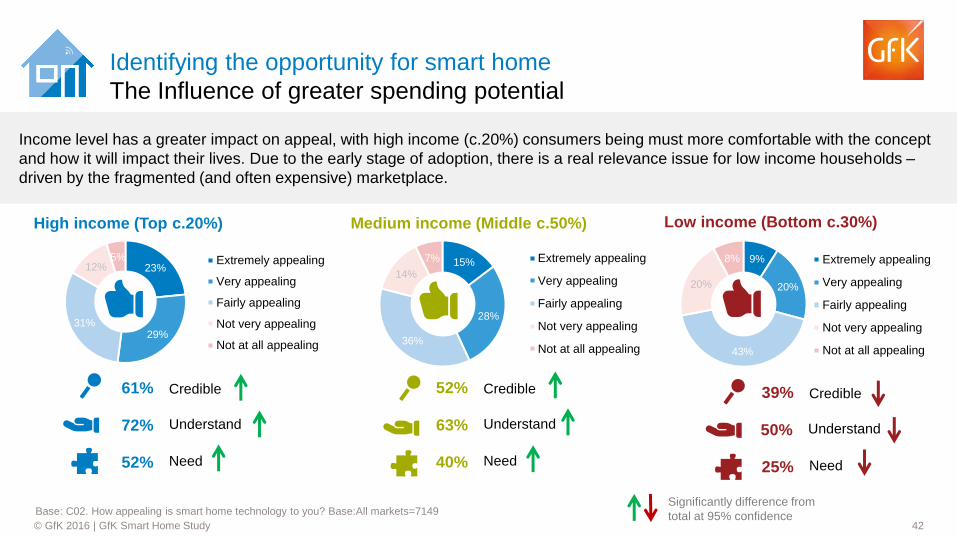
Income level has a greater impact on appeal, with high income (c.20%) consumers being must more comfortable with the concept
and how it will impact their lives. Due to the early stage of adoption, there is a real relevance issue for low income households –
driven by the fragmented (and often expensive) marketplace.
Identifying the opportunity for smart home
The Influence of greater spending potential
High income (Top c.20%)
Credible 61%
72% Understand
Need 52%
Base: C02. How appealing is smart home technology to you? Base:All markets=7149
Credible 52%
63% Understand
Need 40%
Credible 39%
50% Understand
Need 25%
Medium income (Middle c.50%) Low income (Bottom c.30%)
Significantly difference from
total at 95% confidence
43 © GfK 2016 | GfK Smart Home Study
15%
25%
37%
16%
7% Extremely appealing
Very appealing
Fairly appealing
Not very appealing
Not at all appealing
37%
37%
18%
5% 3% Extremely appealing
Very appealing
Fairly appealing
Not very appealing
Not at all appealing
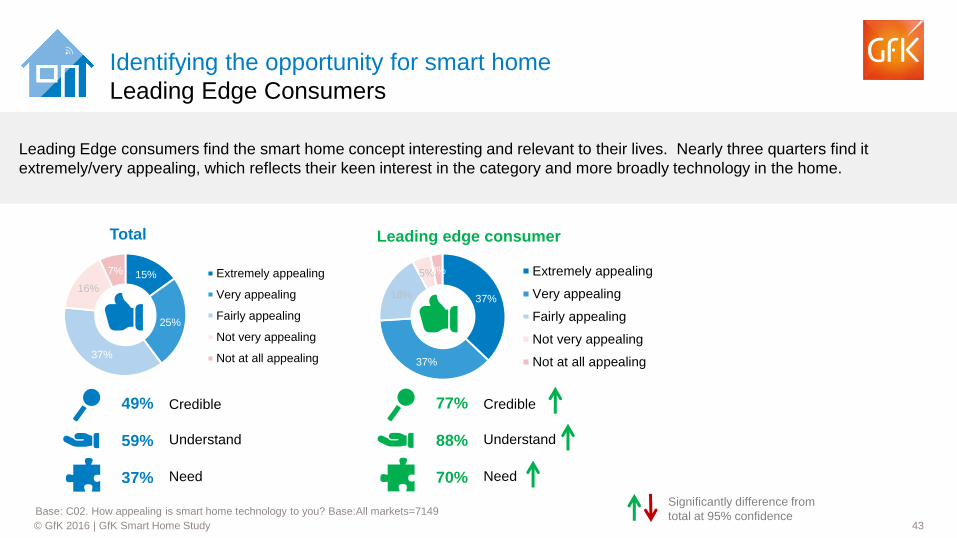
Leading Edge consumers find the smart home concept interesting and relevant to their lives. Nearly three quarters find it
extremely/very appealing, which reflects their keen interest in the category and more broadly technology in the home.
Identifying the opportunity for smart home
Leading Edge Consumers
Total
Credible 49%
59% Understand
Need 37%
Base: C02. How appealing is smart home technology to you? Base:All markets=7149
Credible 77%
88% Understand
Need 70%
Leading edge consumer
Significantly difference from
total at 95% confidence
44 © GfK 2016 | GfK Smart Home Study
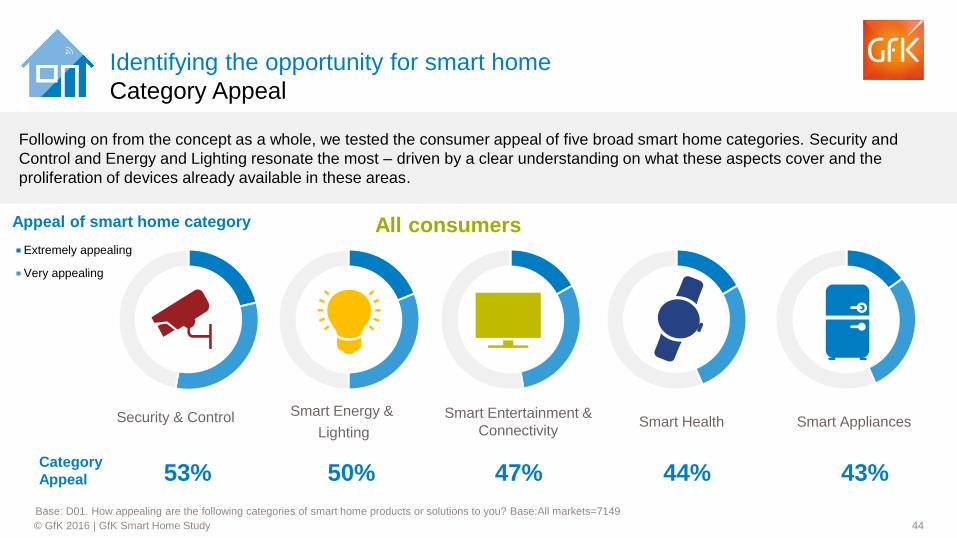
Extremely appealing
Very appealing
43% 53%
Security & Control
Identifying the opportunity for smart home
Category Appeal
Base: D01. How appealing are the following categories of smart home products or solutions to you? Base:All markets=7149
Following on from the concept as a whole, we tested the consumer appeal of five broad smart home categories. Security and
Control and Energy and Lighting resonate the most – driven by a clear understanding on what these aspects cover and the
proliferation of devices already available in these areas.
Smart Appliances
44%
Smart Health
47%
Smart Entertainment &
Connectivity
50%
Smart Energy &
Lighting
Category
Appeal
Appeal of smart home category All consumers
45 © GfK 2016 | GfK Smart Home Study
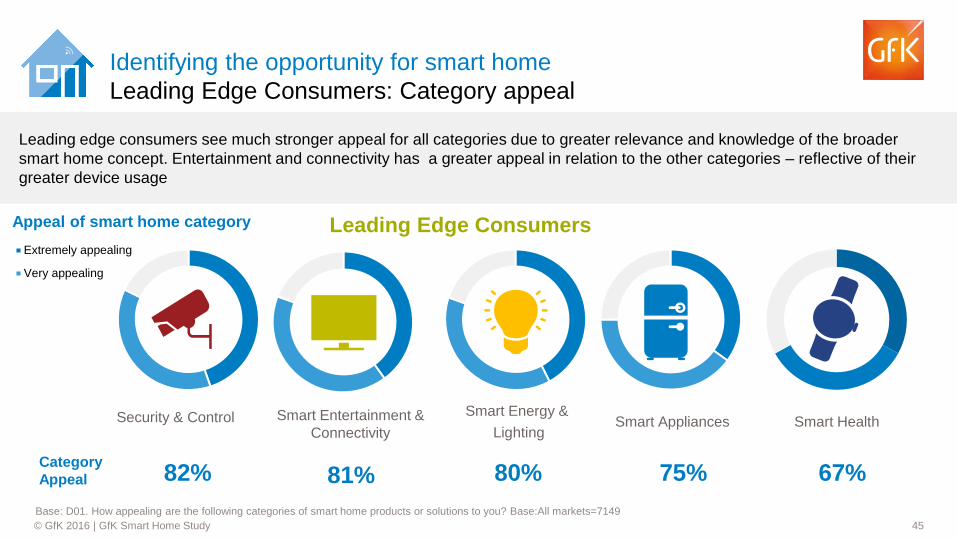
Extremely appealing
Very appealing
75% 82%
Security & Control
Identifying the opportunity for smart home
Leading Edge Consumers: Category appeal
Base: D01. How appealing are the following categories of smart home products or solutions to you? Base:All markets=7149
Leading edge consumers see much stronger appeal for all categories due to greater relevance and knowledge of the broader
smart home concept. Entertainment and connectivity has a greater appeal in relation to the other categories – reflective of their
greater device usage
Smart Appliances
67%
Smart Health
81%
Smart Entertainment &
Connectivity
80%
Smart Energy &
Lighting
Appeal of smart home category
Category
Appeal
Leading Edge Consumers
46 © GfK 2016 | GfK Smart Home Study
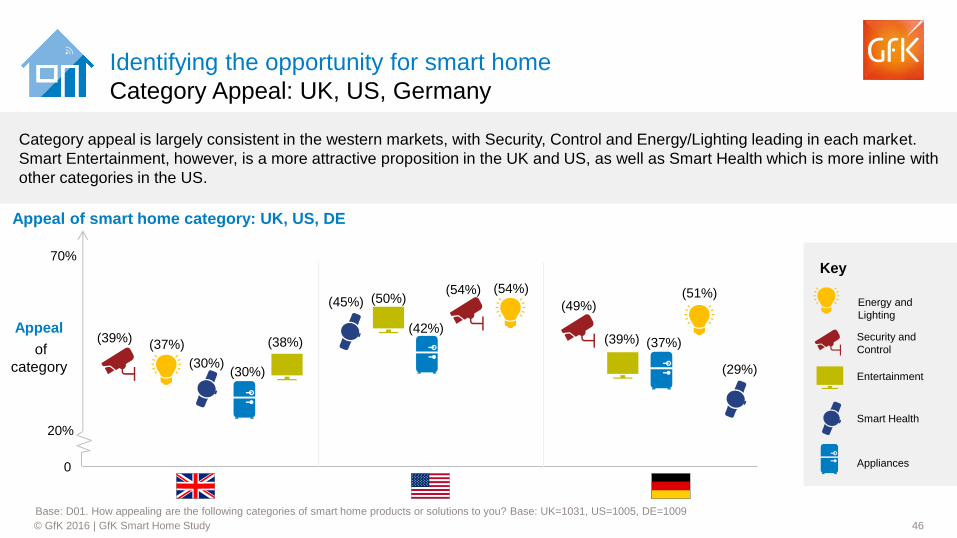
Category appeal is largely consistent in the western markets, with Security, Control and Energy/Lighting leading in each market.
Smart Entertainment, however, is a more attractive proposition in the UK and US, as well as Smart Health which is more inline with
other categories in the US.
Appeal
of
category (30%)
(38%) (37%) (39%)
(30%)
(45%) (54%)
(50%)
(42%)
(51%)
(37%)
(29%)
(39%)
(49%)
(54%)
20%
0
70%
Identifying the opportunity for smart home
Category Appeal: UK, US, Germany
Energy and
Lighting
Security and
Control
Entertainment
Smart Health
Appliances
Key
Appeal of smart home category: UK, US, DE
Base: D01. How appealing are the following categories of smart home products or solutions to you? Base: UK=1031, US=1005, DE=1009
47 © GfK 2016 | GfK Smart Home Study
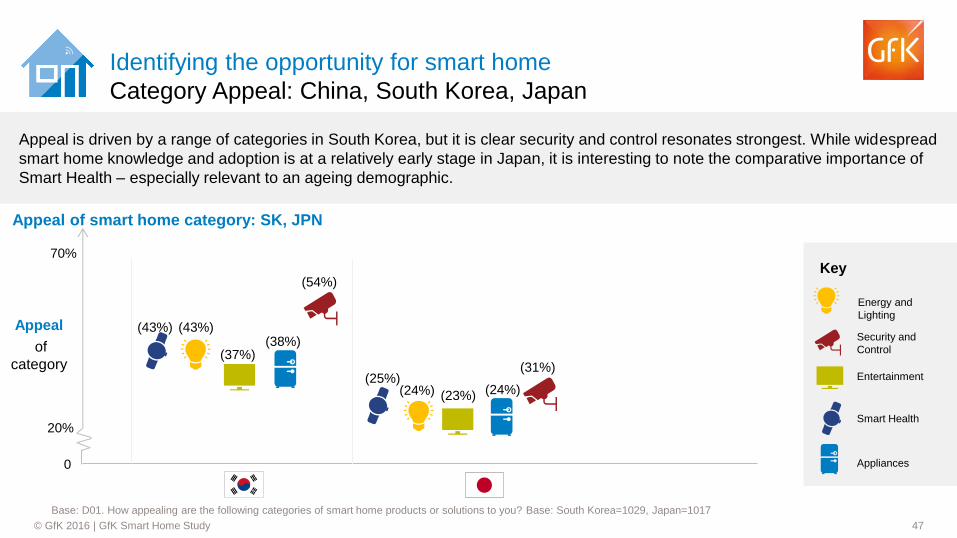
Appeal is driven by a range of categories in South Korea, but it is clear security and control resonates strongest. While widespread
smart home knowledge and adoption is at a relatively early stage in Japan, it is interesting to note the comparative importance of
Smart Health – especially relevant to an ageing demographic.
(43%)
(37%) (38%)
(31%)
(23%) (24%) (24%)
(54%)
(43%)
(25%)
Appeal
of
category
20%
0
70%
Identifying the opportunity for smart home
Category Appeal: China, South Korea, Japan
Appeal of smart home category: SK, JPN
Energy and
Lighting
Security and
Control
Entertainment
Smart Health
Appliances
Key
Base: D01. How appealing are the following categories of smart home products or solutions to you? Base: South Korea=1029, Japan=1017
48 © GfK 2016 | GfK Smart Home Study
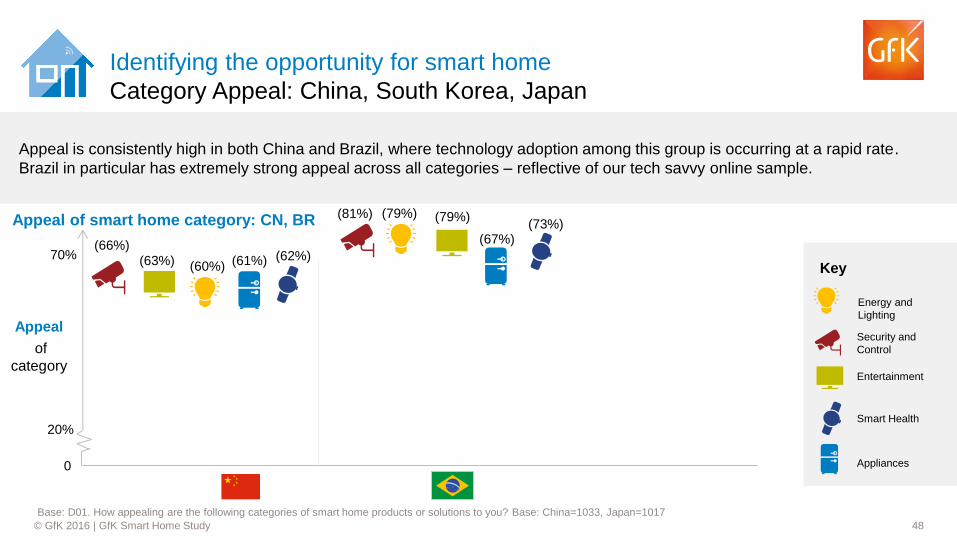
Appeal is consistently high in both China and Brazil, where technology adoption among this group is occurring at a rapid rate.
Brazil in particular has extremely strong appeal across all categories – reflective of our tech savvy online sample.
(63%) (60%)
(66%) (61%)
(81%) (79%)
(67%)
(79%) (73%)
(62%)
Appeal
of
category
20%
0
70%
Identifying the opportunity for smart home
Category Appeal: China, South Korea, Japan
Appeal of smart home category: CN, BR
Energy and
Lighting
Security and
Control
Entertainment
Smart Health
Appliances
Key
Base: D01. How appealing are the following categories of smart home products or solutions to you? Base: China=1033, Japan=1017
49 © GfK 2016 | GfK Smart Home Study
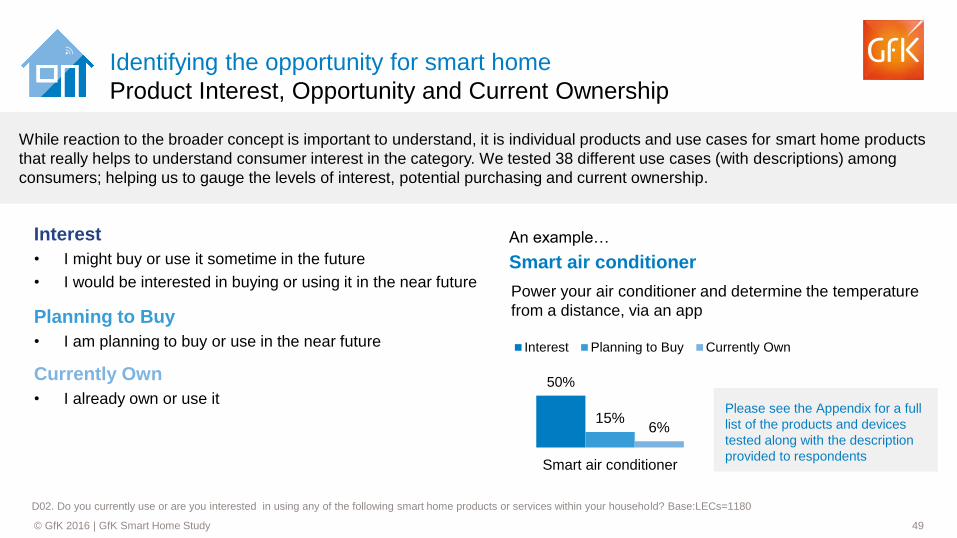
While reaction to the broader concept is important to understand, it is individual products and use cases for smart home products
that really helps to understand consumer interest in the category. We tested 38 different use cases (with descriptions) among
consumers; helping us to gauge the levels of interest, potential purchasing and current ownership.
Interest
• I might buy or use it sometime in the future
• I would be interested in buying or using it in the near future
Planning to Buy
• I am planning to buy or use in the near future
Currently Own
• I already own or use it
An example…
Smart air conditioner
Power your air conditioner and determine the temperature
from a distance, via an app
50%
15% 6%
Smart air conditioner
Interest Planning to Buy Currently Own
Identifying the opportunity for smart home
Product Interest, Opportunity and Current Ownership
Please see the Appendix for a full
list of the products and devices
tested along with the description
provided to respondents
D02. Do you currently use or are you interested in using any of the following smart home products or services within your household? Base:LECs=1180
50 © GfK 2016 | GfK Smart Home Study
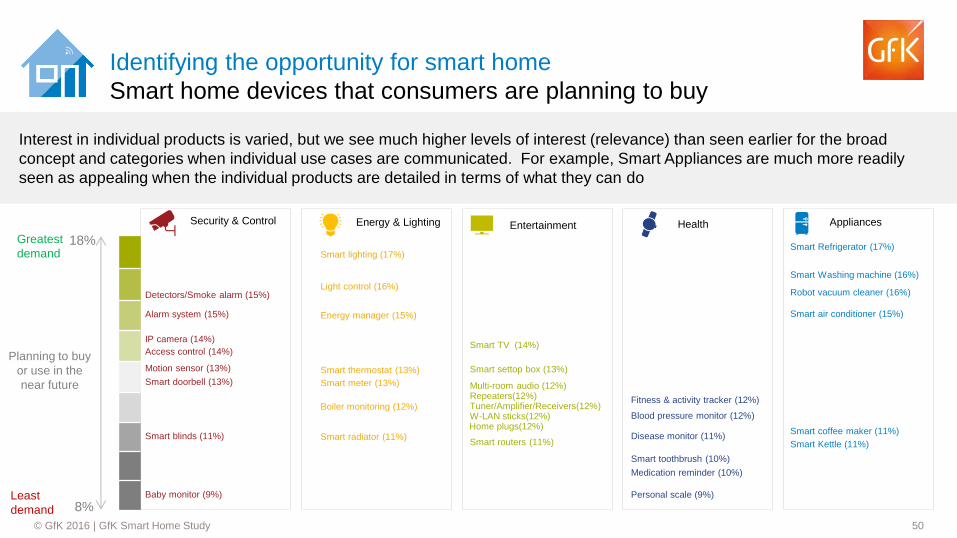
Interest in individual products is varied, but we see much higher levels of interest (relevance) than seen earlier for the broad
concept and categories when individual use cases are communicated. For example, Smart Appliances are much more readily
seen as appealing when the individual products are detailed in terms of what they can do
Security & Control Energy & Lighting Entertainment Health Appliances
Smart TV (14%)
Smart Washing machine (16%)
Smart routers (11%)
Smart Refrigerator (17%) Smart lighting (17%)
Smart air conditioner (15%)
Robot vacuum cleaner (16%)
Energy manager (15%)
Smart thermostat (13%) Motion sensor (13%)
IP camera (14%)
Smart radiator (11%)
Access control (14%)
Multi-room audio (12%) Smart doorbell (13%)
Personal scale (9%)
Smart coffee maker (11%)
Smart Kettle (11%)
Smart toothbrush (10%)
Fitness & activity tracker (12%)
Smart blinds (11%)
Boiler monitoring (12%)
Disease monitor (11%)
Medication reminder (10%)
Baby monitor (9%)
Planning to buy
or use in the
near future
Detectors/Smoke alarm (15%)
Alarm system (15%)
Identifying the opportunity for smart home
Smart home devices that consumers are planning to buy
Smart settop box (13%)
Tuner/Amplifier/Receivers(12%) W-LAN sticks(12%)
Light control (16%)
Smart meter (13%)
Blood pressure monitor (12%) Home plugs(12%)
Repeaters(12%)
18%
8%
Greatest
demand
Least
demand
51 © GfK 2016 | GfK Smart Home Study
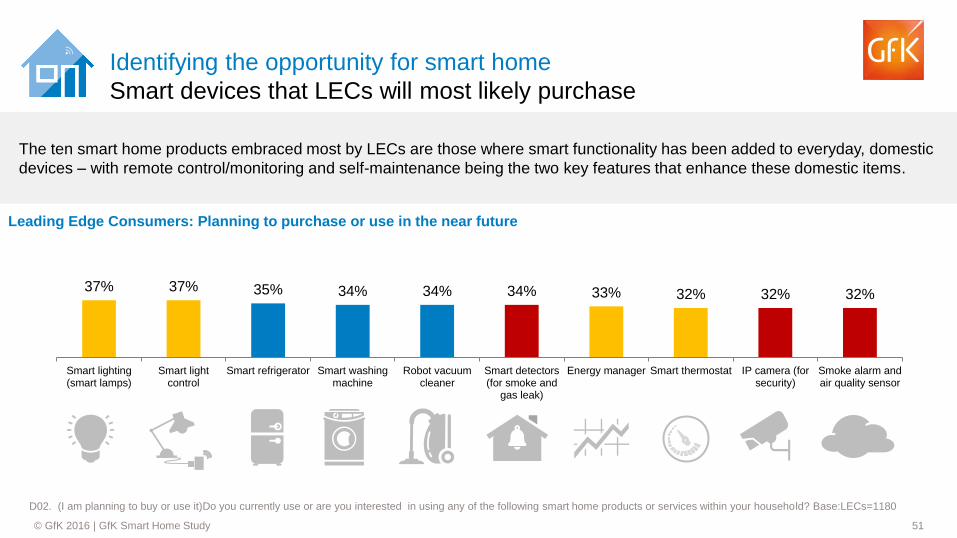
37% 37% 35% 34% 34% 34% 33% 32% 32% 32%
Smart lighting(smart lamps)
Smart lightcontrol
Smart refrigerator Smart washingmachine
Robot vacuumcleaner
Smart detectors(for smoke and
gas leak)
Energy manager Smart thermostat IP camera (forsecurity)
Smoke alarm andair quality sensor
The ten smart home products embraced most by LECs are those where smart functionality has been added to everyday, domestic
devices – with remote control/monitoring and self-maintenance being the two key features that enhance these domestic items.
Identifying the opportunity for smart home
Smart devices that LECs will most likely purchase
D02. (I am planning to buy or use it)Do you currently use or are you interested in using any of the following smart home products or services within your household? Base:LECs=1180
Leading Edge Consumers: Planning to purchase or use in the near future
52 © GfK 2016 | GfK Smart Home Study
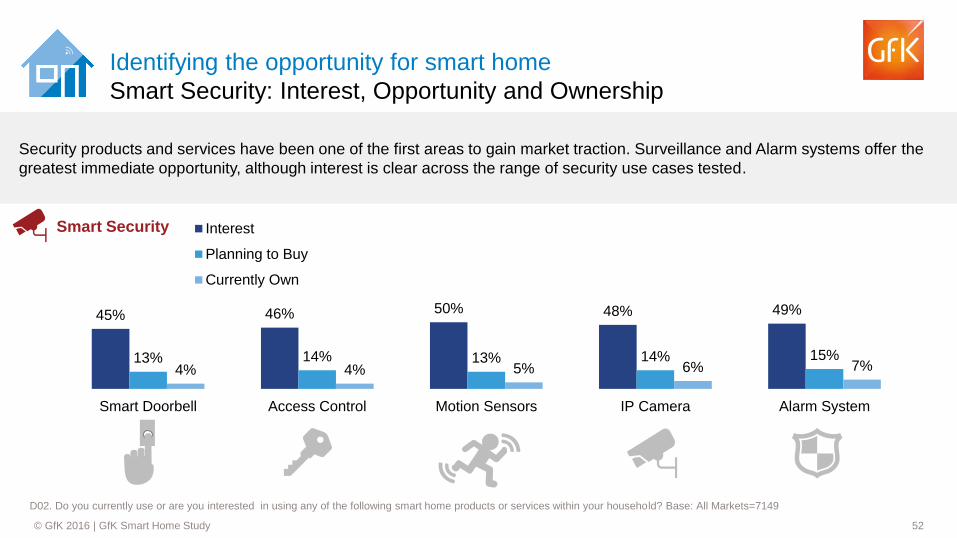
Security products and services have been one of the first areas to gain market traction. Surveillance and Alarm systems offer the
greatest immediate opportunity, although interest is clear across the range of security use cases tested.
45% 46% 50% 48% 49%
13% 14% 13% 14% 15% 4% 4% 5% 6% 7%
Smart Doorbell Access Control Motion Sensors IP Camera Alarm System
Interest
Planning to Buy
Currently Own
Smart Security
Identifying the opportunity for smart home
Smart Security: Interest, Opportunity and Ownership
D02. Do you currently use or are you interested in using any of the following smart home products or services within your household? Base: All Markets=7149
53 © GfK 2016 | GfK Smart Home Study
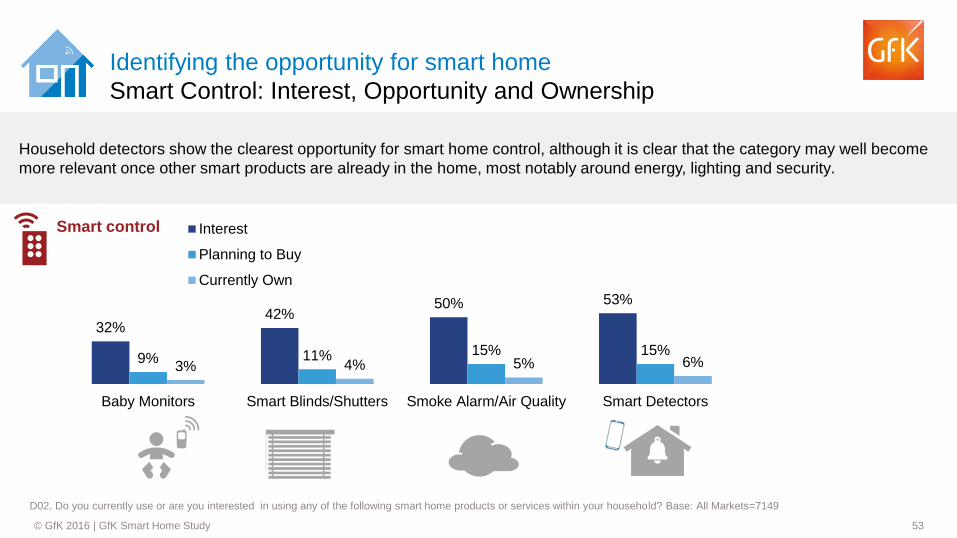
Household detectors show the clearest opportunity for smart home control, although it is clear that the category may well become
more relevant once other smart products are already in the home, most notably around energy, lighting and security.
32% 42%
50% 53%
9% 11% 15% 15% 3% 4% 5% 6%
Baby Monitors Smart Blinds/Shutters Smoke Alarm/Air Quality Smart Detectors
Interest
Planning to Buy
Currently Own
Identifying the opportunity for smart home
Smart Control: Interest, Opportunity and Ownership
Smart control
D02. Do you currently use or are you interested in using any of the following smart home products or services within your household? Base: All Markets=7149
54 © GfK 2016 | GfK Smart Home Study
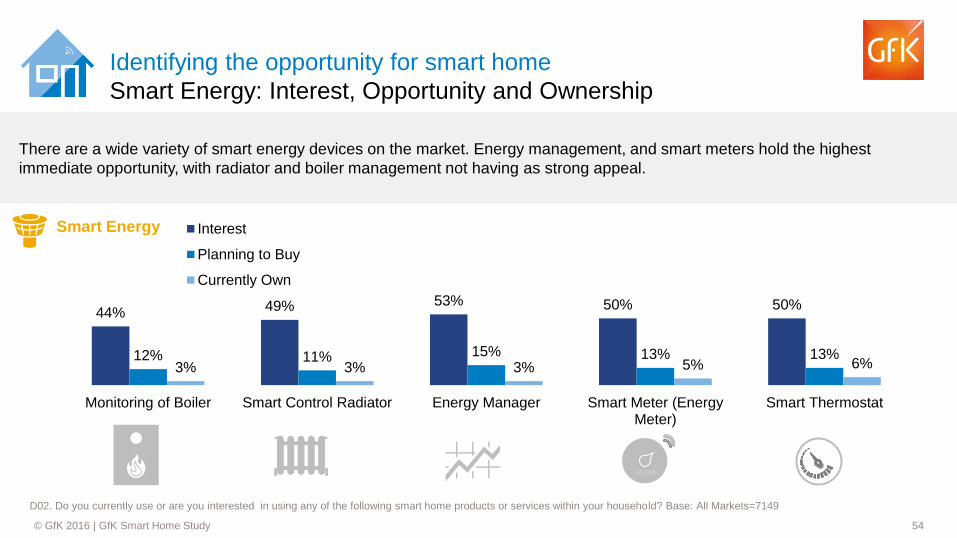
There are a wide variety of smart energy devices on the market. Energy management, and smart meters hold the highest
immediate opportunity, with radiator and boiler management not having as strong appeal.
44% 49% 53% 50% 50%
12% 11% 15% 13% 13% 3% 3% 3% 5% 6%
Monitoring of Boiler Smart Control Radiator Energy Manager Smart Meter (EnergyMeter)
Smart Thermostat
Interest
Planning to Buy
Currently Own
01234
Identifying the opportunity for smart home
Smart Energy: Interest, Opportunity and Ownership
Smart Energy
D02. Do you currently use or are you interested in using any of the following smart home products or services within your household? Base: All Markets=7149
55 © GfK 2016 | GfK Smart Home Study
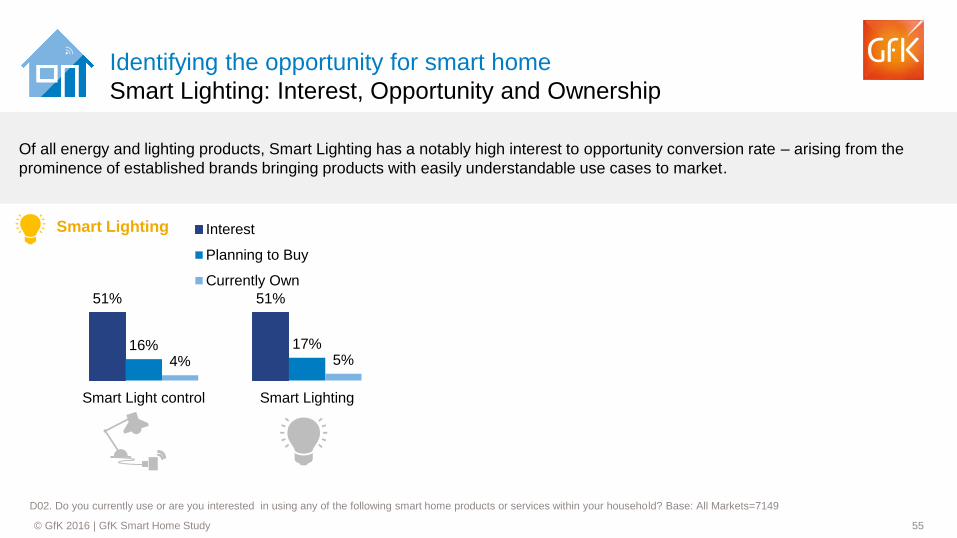
Of all energy and lighting products, Smart Lighting has a notably high interest to opportunity conversion rate – arising from the
prominence of established brands bringing products with easily understandable use cases to market.
51% 51%
16% 17%
4% 5%
Smart Light control Smart Lighting
Interest
Planning to Buy
Currently Own
Identifying the opportunity for smart home
Smart Lighting: Interest, Opportunity and Ownership
Smart Lighting
D02. Do you currently use or are you interested in using any of the following smart home products or services within your household? Base: All Markets=7149
56 © GfK 2016 | GfK Smart Home Study
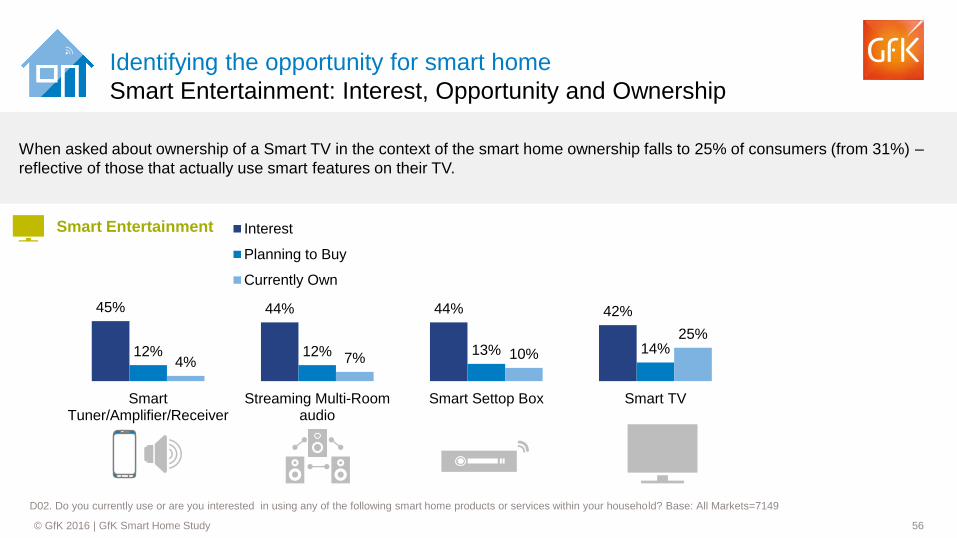
When asked about ownership of a Smart TV in the context of the smart home ownership falls to 25% of consumers (from 31%) –
reflective of those that actually use smart features on their TV.
45% 44% 44% 42%
12% 12% 13% 14% 4% 7% 10%
25%
SmartTuner/Amplifier/Receiver
Streaming Multi-Roomaudio
Smart Settop Box Smart TV
Interest
Planning to Buy
Currently Own
Identifying the opportunity for smart home
Smart Entertainment: Interest, Opportunity and Ownership
Smart Entertainment
D02. Do you currently use or are you interested in using any of the following smart home products or services within your household? Base: All Markets=7149
57 © GfK 2016 | GfK Smart Home Study
Identifying the opportunity for smart home
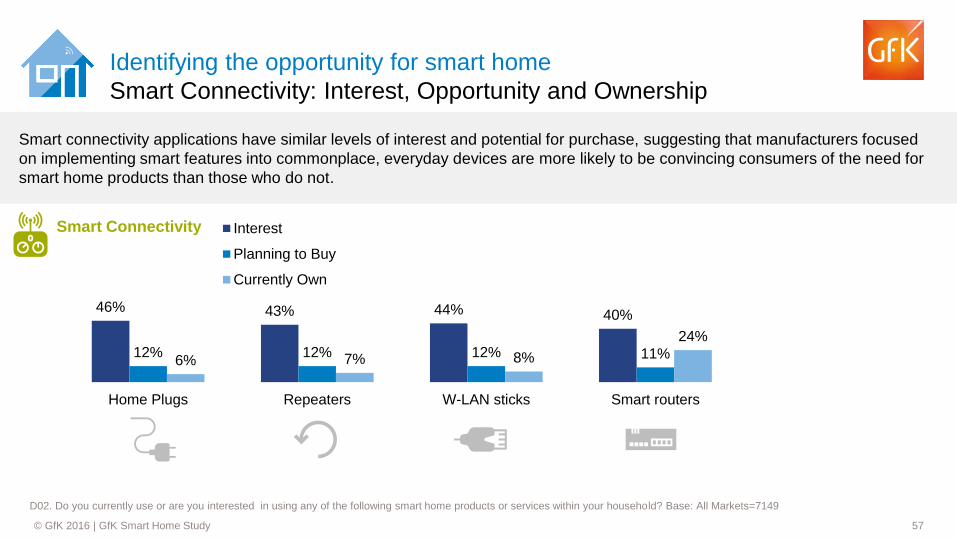
Smart Connectivity: Interest, Opportunity and Ownership
Smart connectivity applications have similar levels of interest and potential for purchase, suggesting that manufacturers focused
on implementing smart features into commonplace, everyday devices are more likely to be convincing consumers of the need for
smart home products than those who do not.
46% 43% 44% 40%
12% 12% 12% 11% 6% 7% 8%
24%
Home Plugs Repeaters W-LAN sticks Smart routers
Interest
Planning to Buy
Currently Own
Smart Connectivity
D02. Do you currently use or are you interested in using any of the following smart home products or services within your household? Base: All Markets=7149
58 © GfK 2016 | GfK Smart Home Study
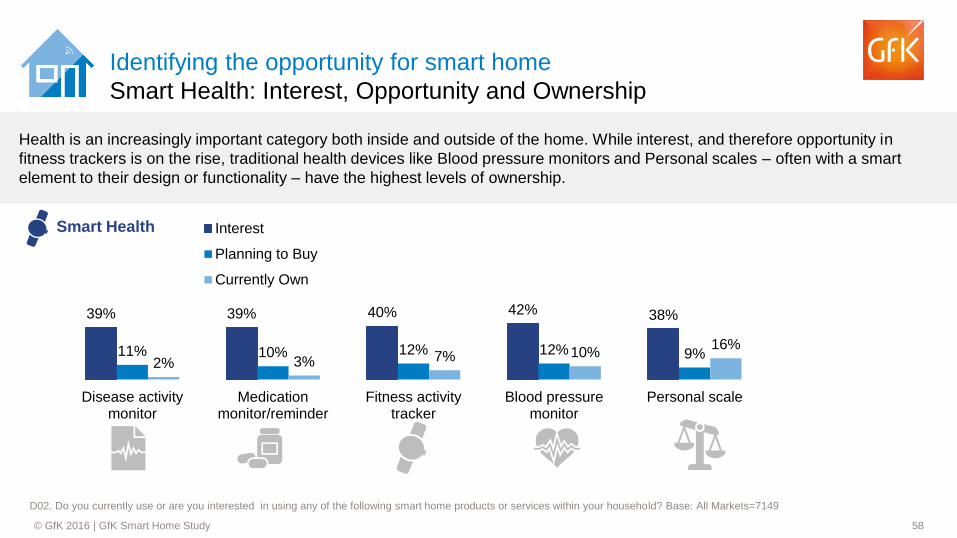
Health is an increasingly important category both inside and outside of the home. While interest, and therefore opportunity in
fitness trackers is on the rise, traditional health devices like Blood pressure monitors and Personal scales – often with a smart
element to their design or functionality – have the highest levels of ownership.
39% 39% 40% 42% 38%
11% 10% 12% 12% 9% 2% 3% 7% 10%
16%
Disease activitymonitor
Medicationmonitor/reminder
Fitness activitytracker
Blood pressuremonitor
Personal scale
Interest
Planning to Buy
Currently Own
Identifying the opportunity for smart home
Smart Health: Interest, Opportunity and Ownership
Smart Health
D02. Do you currently use or are you interested in using any of the following smart home products or services within your household? Base: All Markets=7149
59 © GfK 2016 | GfK Smart Home Study
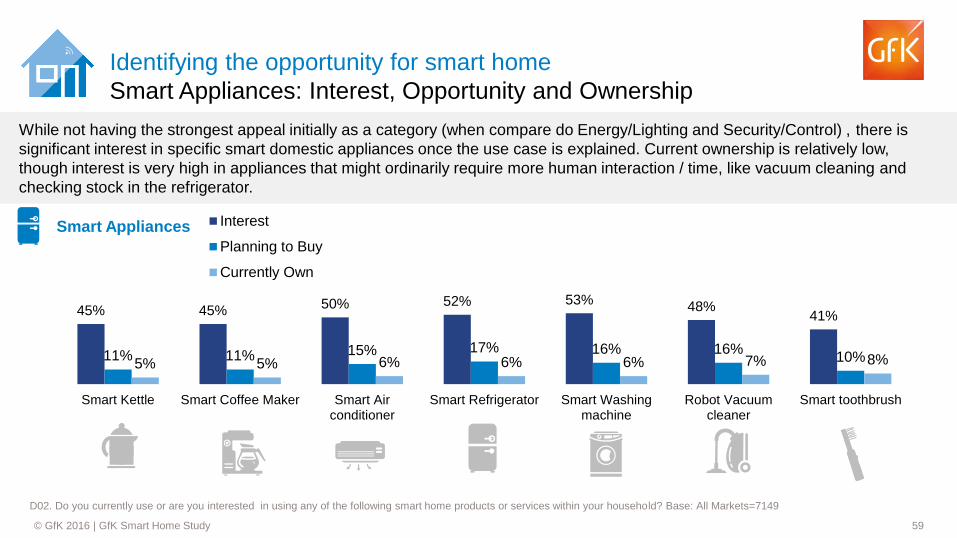
While not having the strongest appeal initially as a category (when compare do Energy/Lighting and Security/Control) , there is
significant interest in specific smart domestic appliances once the use case is explained. Current ownership is relatively low,
though interest is very high in appliances that might ordinarily require more human interaction / time, like vacuum cleaning and
checking stock in the refrigerator.
45% 45% 50% 52% 53%
48% 41%
11% 11% 15% 17% 16% 16% 10% 5% 5% 6% 6% 6% 7% 8%
Smart Kettle Smart Coffee Maker Smart Airconditioner
Smart Refrigerator Smart Washingmachine
Robot Vacuumcleaner
Smart toothbrush
Interest
Planning to Buy
Currently Own
Smart Appliances
Identifying the opportunity for smart home
Smart Appliances: Interest, Opportunity and Ownership
D02. Do you currently use or are you interested in using any of the following smart home products or services within your household? Base: All Markets=7149
60 © GfK 2016 | GfK Smart Home Study
Predicting the potential for smart home
61 © GfK 2016 | GfK Smart Home Study
42%
36%
22%
Yes (Current User)
Yes (Non-current user)
No
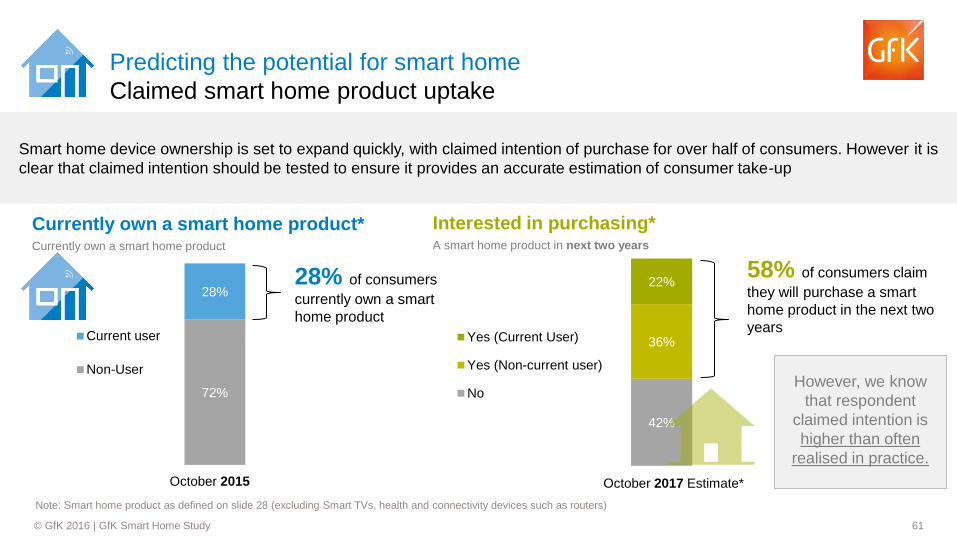
Predicting the potential for smart home
Claimed smart home product uptake
Smart home device ownership is set to expand quickly, with claimed intention of purchase for over half of consumers. However it is
clear that claimed intention should be tested to ensure it provides an accurate estimation of consumer take-up
Note: Smart home product as defined on slide 28 (excluding Smart TVs, health and connectivity devices such as routers)
72%
28%
Current user
Non-User
October 2015 October 2017 Estimate*
Interested in purchasing* A smart home product in next two years
58% of consumers claim
they will purchase a smart
home product in the next two
years
However, we know
that respondent
claimed intention is
higher than often
realised in practice.
28% of consumers
currently own a smart
home product
Currently own a smart home product* Currently own a smart home product
62 © GfK 2016 | GfK Smart Home Study
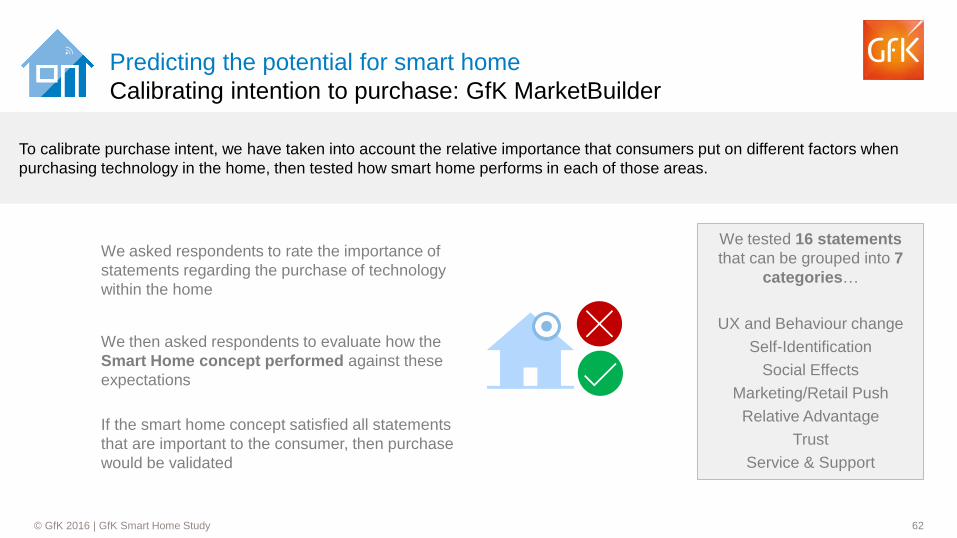
Predicting the potential for smart home
Calibrating intention to purchase: GfK MarketBuilder
To calibrate purchase intent, we have taken into account the relative importance that consumers put on different factors when
purchasing technology in the home, then tested how smart home performs in each of those areas.
We asked respondents to rate the importance of
statements regarding the purchase of technology
within the home
We then asked respondents to evaluate how the
Smart Home concept performed against these
expectations
If the smart home concept satisfied all statements
that are important to the consumer, then purchase
would be validated
We tested 16 statements
that can be grouped into 7
categories…
UX and Behaviour change
Self-Identification
Social Effects
Marketing/Retail Push
Relative Advantage
Trust
Service & Support
63 © GfK 2016 | GfK Smart Home Study
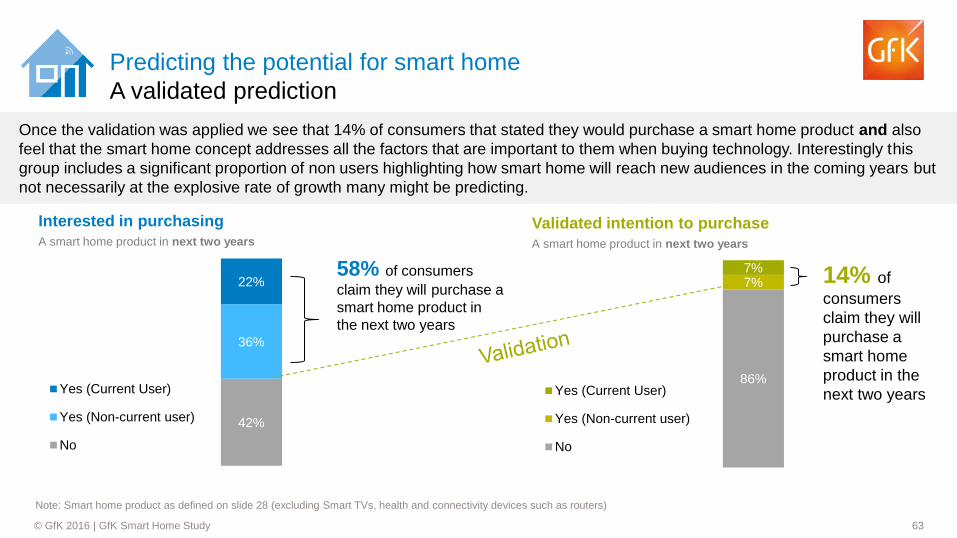
Predicting the potential for smart home
A validated prediction
Once the validation was applied we see that 14% of consumers that stated they would purchase a smart home product and also
feel that the smart home concept addresses all the factors that are important to them when buying technology. Interestingly this
group includes a significant proportion of non users highlighting how smart home will reach new audiences in the coming years but
not necessarily at the explosive rate of growth many might be predicting.
42%
36%
22%
Yes (Current User)
Yes (Non-current user)
No
58% of consumers
claim they will purchase a
smart home product in
the next two years
Interested in purchasing
A smart home product in next two years
Validated intention to purchase
A smart home product in next two years
14% of
consumers
claim they will
purchase a
smart home
product in the
next two years 86%
7% 7%
Yes (Current User)
Yes (Non-current user)
No
Note: Smart home product as defined on slide 28 (excluding Smart TVs, health and connectivity devices such as routers)
64 © GfK 2016 | GfK Smart Home Study
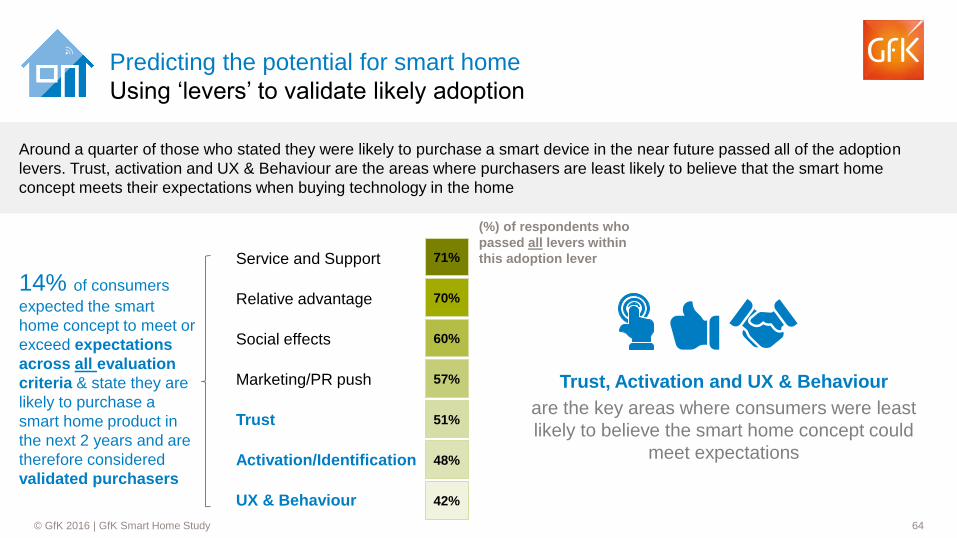
Predicting the potential for smart home
Using ‘levers’ to validate likely adoption
Around a quarter of those who stated they were likely to purchase a smart device in the near future passed all of the adoption
levers. Trust, activation and UX & Behaviour are the areas where purchasers are least likely to believe that the smart home
concept meets their expectations when buying technology in the home
UX & Behaviour
Trust
Relative advantage
Service and Support
Social effects
Marketing/PR push
Activation/Identification
42%
48%
51%
57%
60%
70%
71%
(%) of respondents who
passed all levers within
this adoption lever
Trust, Activation and UX & Behaviour
are the key areas where consumers were least
likely to believe the smart home concept could
meet expectations
14% of consumers
expected the smart
home concept to meet or
exceed expectations
across all evaluation
criteria & state they are
likely to purchase a
smart home product in
the next 2 years and are
therefore considered
validated purchasers
65 © GfK 2016 | GfK Smart Home Study
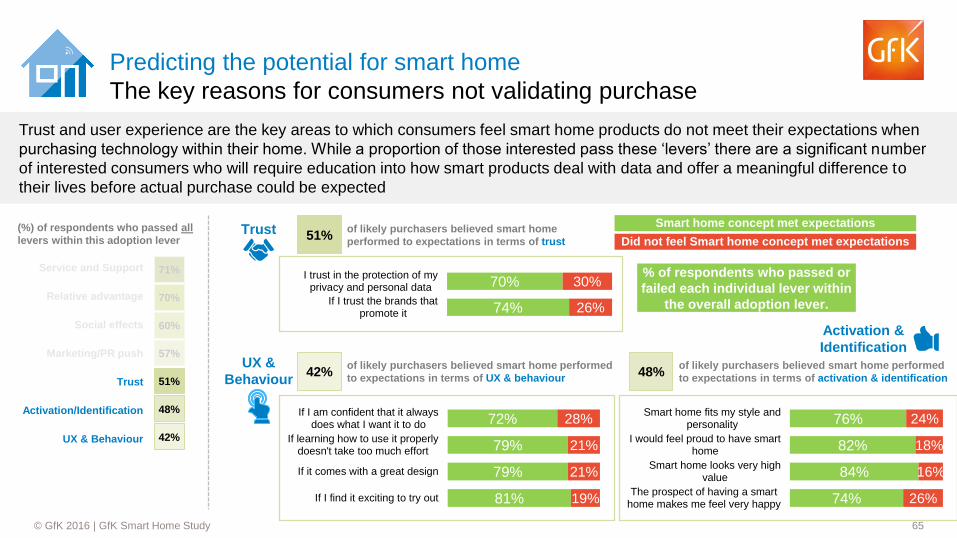
Trust and user experience are the key areas to which consumers feel smart home products do not meet their expectations when
purchasing technology within their home. While a proportion of those interested pass these ‘levers’ there are a significant number
of interested consumers who will require education into how smart products deal with data and offer a meaningful difference to
their lives before actual purchase could be expected
Predicting the potential for smart home
The key reasons for consumers not validating purchase
UX & Behaviour
Trust
Relative advantage
Service and Support
Social effects
Marketing/PR push
Activation/Identification
42%
48%
51%
57%
60%
70%
71%
(%) of respondents who passed all
levers within this adoption lever Trust
74%
70%
26%
30%
If I trust the brands thatpromote it
I trust in the protection of myprivacy and personal data
51% of likely purchasers believed smart home
performed to expectations in terms of trust
% of respondents who passed or
failed each individual lever within
the overall adoption lever.
Did not feel Smart home concept met expectations
Smart home concept met expectations
UX &
Behaviour 42%
of likely purchasers believed smart home performed
to expectations in terms of UX & behaviour
81%
79%
79%
72%
19%
21%
21%
28%
If I find it exciting to try out
If it comes with a great design
If learning how to use it properlydoesn't take too much effort
If I am confident that it alwaysdoes what I want it to do
48% of likely purchasers believed smart home performed
to expectations in terms of activation & identification
74%
84%
82%
76%
26%
16%
18%
24%
The prospect of having a smarthome makes me feel very happy
Smart home looks very highvalue
I would feel proud to have smarthome
Smart home fits my style andpersonality
Activation &
Identification
66 © GfK 2016 | GfK Smart Home Study
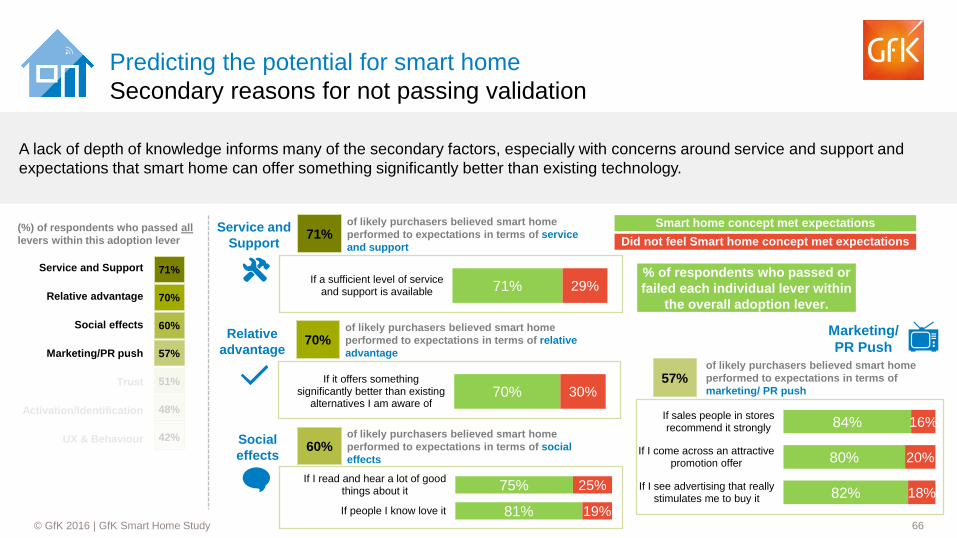
A lack of depth of knowledge informs many of the secondary factors, especially with concerns around service and support and
expectations that smart home can offer something significantly better than existing technology.
Predicting the potential for smart home
Secondary reasons for not passing validation
UX & Behaviour
Trust
Relative advantage
Service and Support
Social effects
Marketing/PR push
Activation/Identification
42%
48%
51%
57%
60%
70%
71%
(%) of respondents who passed all
levers within this adoption lever
Relative
advantage
70% 30% If it offers something
significantly better than existingalternatives I am aware of
70% of likely purchasers believed smart home
performed to expectations in terms of relative
advantage
Did not feel Smart home concept met expectations
Smart home concept met expectations Service and
Support
71% 29% If a sufficient level of service
and support is available
71% of likely purchasers believed smart home
performed to expectations in terms of service
and support
81%
75%
19%
25%
If people I know love it
If I read and hear a lot of goodthings about it
Social
effects 60%
of likely purchasers believed smart home
performed to expectations in terms of social
effects
57% of likely purchasers believed smart home
performed to expectations in terms of
marketing/ PR push
82%
80%
84%
18%
20%
16%
If I see advertising that reallystimulates me to buy it
If I come across an attractivepromotion offer
If sales people in storesrecommend it strongly
Marketing/
PR Push
% of respondents who passed or
failed each individual lever within
the overall adoption lever.
67 © GfK 2016 | GfK Smart Home Study
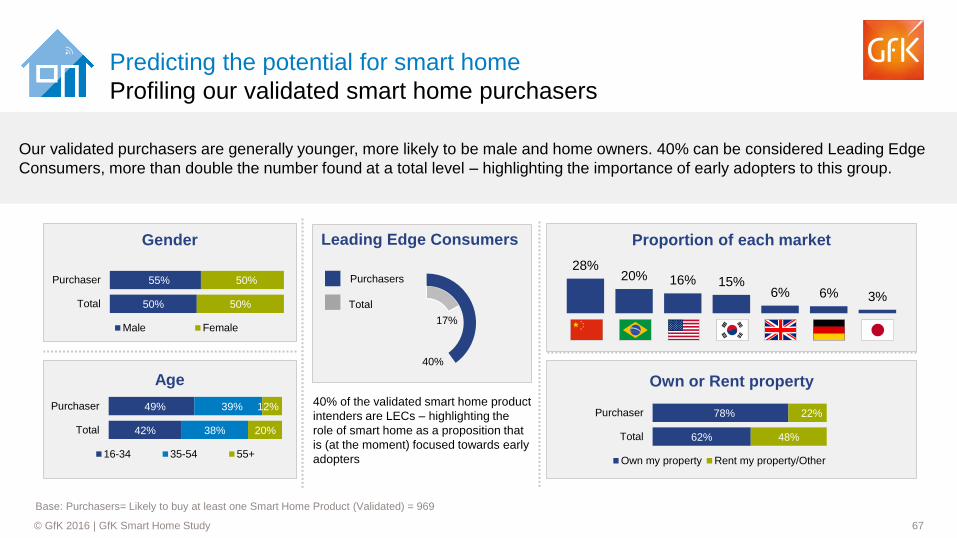
28% 20% 16% 15%
6% 6% 3%
CH BR US SK UK DE JP
Predicting the potential for smart home
Profiling our validated smart home purchasers
Base: Purchasers= Likely to buy at least one Smart Home Product (Validated) = 969
Our validated purchasers are generally younger, more likely to be male and home owners. 40% can be considered Leading Edge
Consumers, more than double the number found at a total level – highlighting the importance of early adopters to this group.
Proportion of each market
Age Own or Rent property
49%
42%
39%
38%
12%
20%
Purchaser
Total
16-34 35-54 55+
Leading Edge Consumers
17%
40%
Purchasers
Total
55%
50%
50%
50%
Purchaser
Total
Male Female
Gender
40% of the validated smart home product
intenders are LECs – highlighting the
role of smart home as a proposition that
is (at the moment) focused towards early
adopters
78%
62%
22%
48%
Purchaser
Total
Own my property Rent my property/Other
68 © GfK 2016 | GfK Smart Home Study
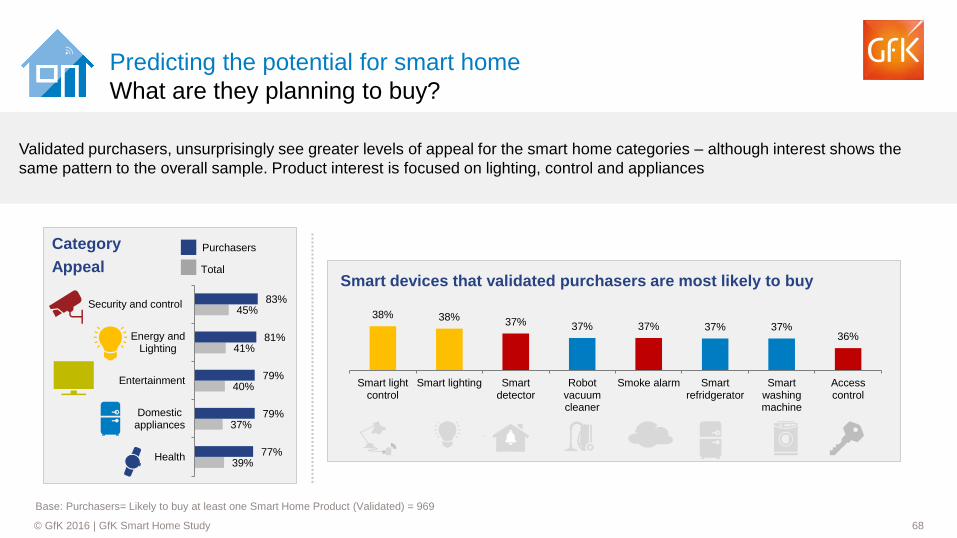
Validated purchasers, unsurprisingly see greater levels of appeal for the smart home categories – although interest shows the
same pattern to the overall sample. Product interest is focused on lighting, control and appliances
Predicting the potential for smart home
What are they planning to buy?
39%
37%
40%
41%
45%
77%
79%
79%
81%
83%
Health
Domesticappliances
Entertainment
Energy andLighting
Security and control
Category
Appeal
38% 38% 37% 37% 37% 37% 37% 36%
Smart lightcontrol
Smart lighting Smartdetector
Robotvacuumcleaner
Smoke alarm Smartrefridgerator
Smartwashingmachine
Accesscontrol
Smart devices that validated purchasers are most likely to buy
Purchasers
Total
Base: Purchasers= Likely to buy at least one Smart Home Product (Validated) = 969
69 © GfK 2016 | GfK Smart Home Study
Cost to
purchase
Concerns about
personal privacy
Knowledge of
products
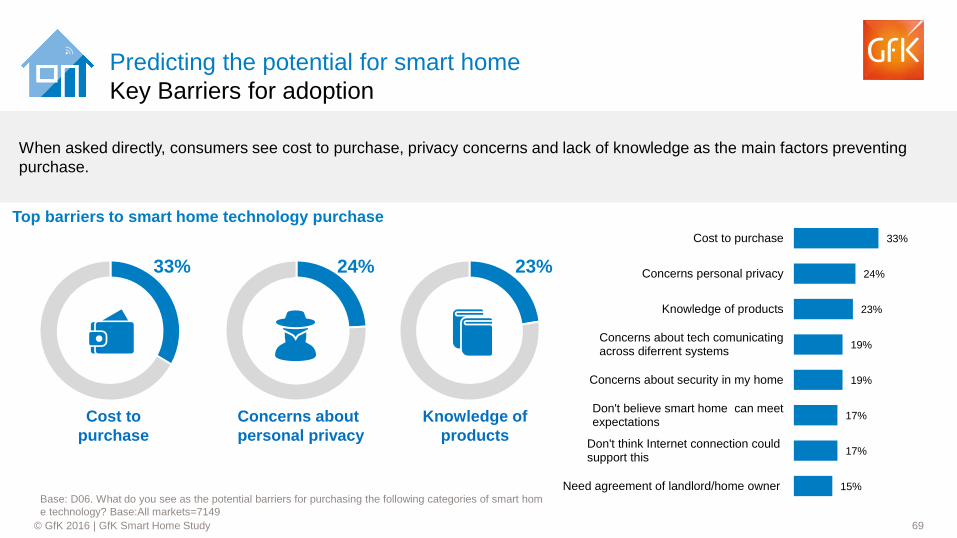
33% 24% 23%
Predicting the potential for smart home
Key Barriers for adoption
Base: D06. What do you see as the potential barriers for purchasing the following categories of smart hom
e technology? Base:All markets=7149
When asked directly, consumers see cost to purchase, privacy concerns and lack of knowledge as the main factors preventing
purchase.
Top barriers to smart home technology purchase
15%
17%
17%
19%
19%
23%
24%
33%
Need agreement of landlord/home owner
Don't think Internet connection couldsupport this
Don't believe smart home can meetexpectations
Concerns about security in my home
Concerns about tech comunicatingacross diferrent systems
Knowledge of products
Concerns personal privacy
Cost to purchase
70 © GfK 2016 | GfK Smart Home Study
Predicting the potential for smart home
Key barriers to adoption by category
Base: D06. What do you see as the potential barriers for purchasing the following categories of smart home technology? Base:All markets=7149
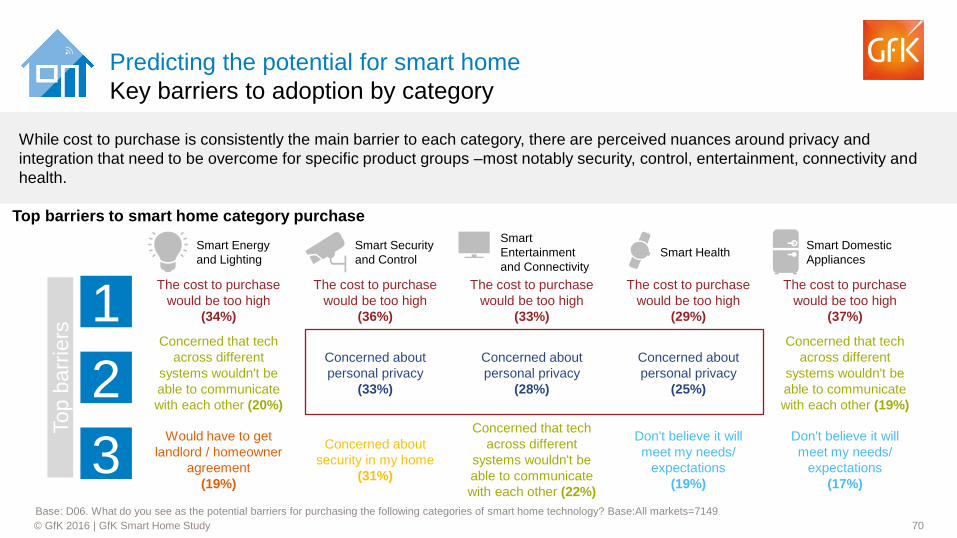
While cost to purchase is consistently the main barrier to each category, there are perceived nuances around privacy and
integration that need to be overcome for specific product groups –most notably security, control, entertainment, connectivity and
health.
Smart Energy
and Lighting
Smart Security
and Control
Smart
Entertainment
and Connectivity
Smart Health Smart Domestic
Appliances
1
2
3
The cost to purchase
would be too high
(34%)
The cost to purchase
would be too high
(36%)
The cost to purchase
would be too high
(33%)
The cost to purchase
would be too high
(29%)
The cost to purchase
would be too high
(37%)
Concerned that tech
across different
systems wouldn't be
able to communicate
with each other (19%)
Don't believe it will
meet my needs/
expectations (17%)
Concerned about
personal privacy (28%)
Concerned that tech
across different
systems wouldn't be
able to communicate
with each other (22%)
Concerned that tech
across different
systems wouldn't be
able to communicate
with each other (20%)
Would have to get
landlord / homeowner
agreement (19%)
Concerned about
personal privacy (33%)
Concerned about
security in my home (31%)
Concerned about
personal privacy (25%)
Don't believe it will
meet my needs/
expectations (19%)
Top b
arr
iers
Top barriers to smart home category purchase
71 © GfK 2016 | GfK Smart Home Study
Predicting the potential for smart home
Personal privacy as a barrier
Base: D06. What do you see as the potential barriers for purchasing the following categories of smart home technology? Base: All markets=7149, UK=1031, Germany=1009, US=1005,
Korea=1029, China=1033, Japan=1017
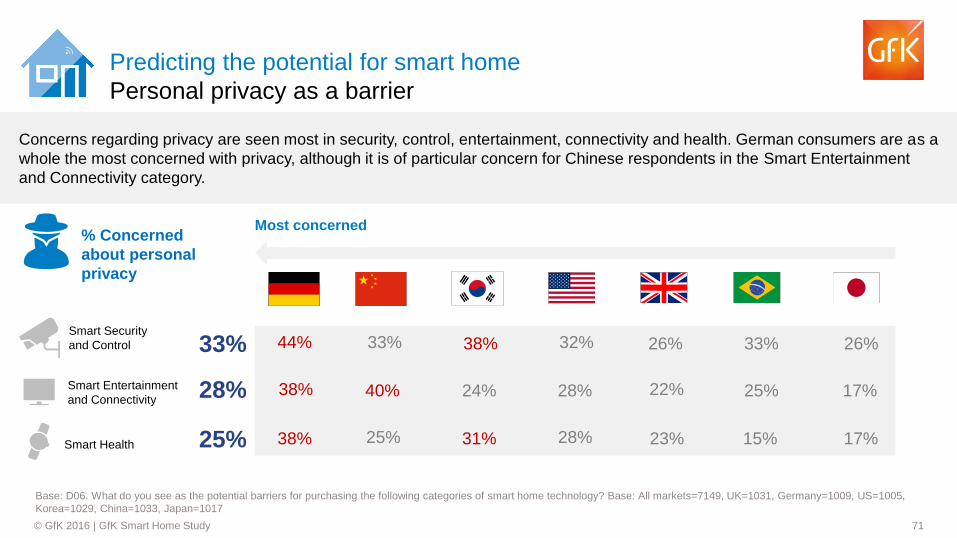
Concerns regarding privacy are seen most in security, control, entertainment, connectivity and health. German consumers are as a
whole the most concerned with privacy, although it is of particular concern for Chinese respondents in the Smart Entertainment
and Connectivity category.
Smart Security
and Control
Smart Entertainment
and Connectivity
Smart Health
33%
28%
25%
33% 33% 38% 26%
40% 24% 25% 22%
38% 23% 17% 31%
% Concerned
about personal
privacy
38% 28%
44% 32% 26%
17%
25% 28% 15%
Most concerned
72 © GfK 2016 | GfK Smart Home Study
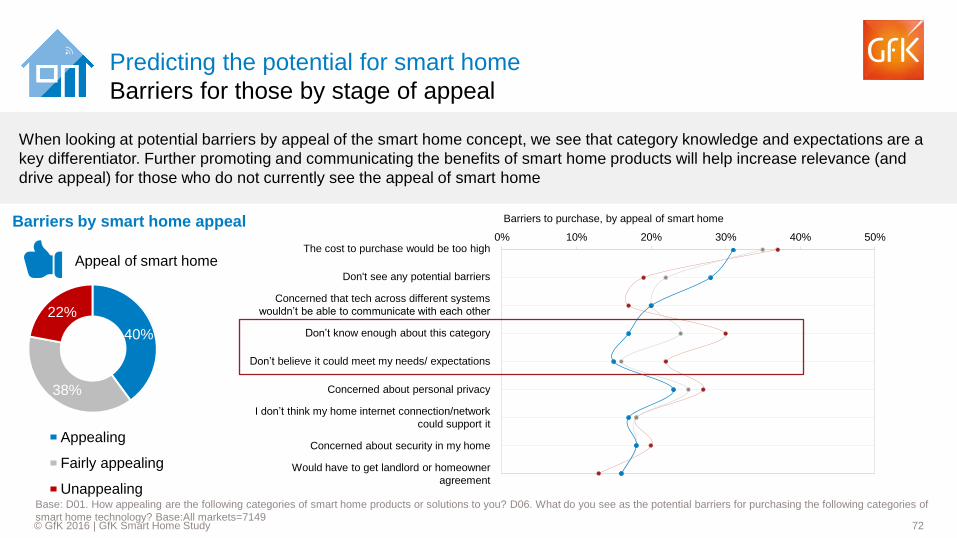
40%
38%
22%
Appealing
Fairly appealing
Unappealing
Predicting the potential for smart home
Barriers for those by stage of appeal
Base: D01. How appealing are the following categories of smart home products or solutions to you? D06. What do you see as the potential barriers for purchasing the following categories of
smart home technology? Base:All markets=7149
When looking at potential barriers by appeal of the smart home concept, we see that category knowledge and expectations are a
key differentiator. Further promoting and communicating the benefits of smart home products will help increase relevance (and
drive appeal) for those who do not currently see the appeal of smart home
0% 10% 20% 30% 40% 50%The cost to purchase would be too high
Don't see any potential barriers
Concerned that tech across different systems
wouldn’t be able to communicate with each other
Don’t know enough about this category
Don’t believe it could meet my needs/ expectations
Concerned about personal privacy
I don’t think my home internet connection/network
could support it
Concerned about security in my home
Would have to get landlord or homeowner
agreement
Barriers to purchase, by appeal of smart home
Appeal of smart home
Barriers by smart home appeal
73 © GfK 2016 | GfK Smart Home Study
Delivering smart home
74 © GfK 2016 | GfK Smart Home Study
9%
21% Agree strongly
Agree slightly
33%
34%
Agree strongly
Agree slightly
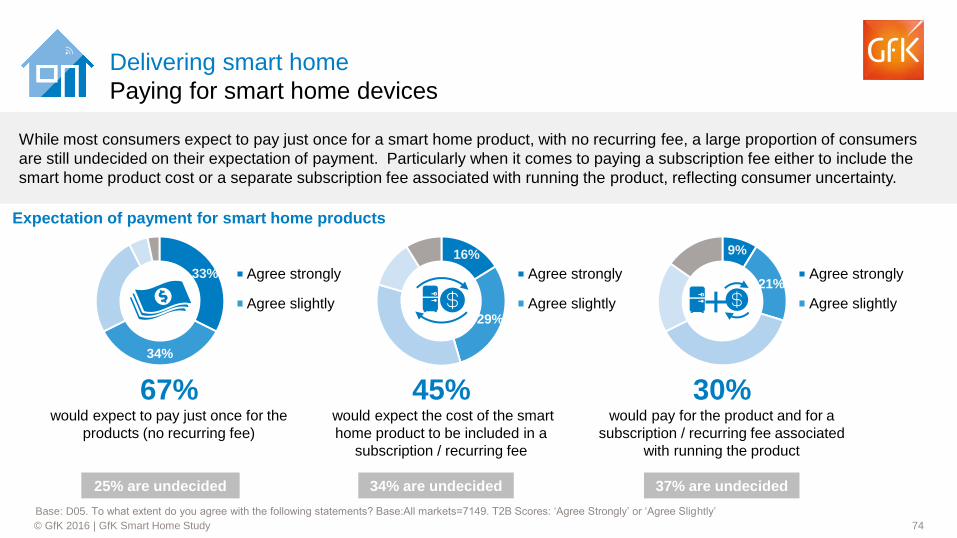
Delivering smart home
Paying for smart home devices
Base: D05. To what extent do you agree with the following statements? Base:All markets=7149. T2B Scores: ‘Agree Strongly’ or ‘Agree Slightly’
While most consumers expect to pay just once for a smart home product, with no recurring fee, a large proportion of consumers
are still undecided on their expectation of payment. Particularly when it comes to paying a subscription fee either to include the
smart home product cost or a separate subscription fee associated with running the product, reflecting consumer uncertainty.
67% would expect to pay just once for the
products (no recurring fee)
30% would pay for the product and for a
subscription / recurring fee associated
with running the product
25% are undecided 37% are undecided
+
45% would expect the cost of the smart
home product to be included in a
subscription / recurring fee
34% are undecided
16%
29%
Agree strongly
Agree slightly
Expectation of payment for smart home products
75 © GfK 2016 | GfK Smart Home Study
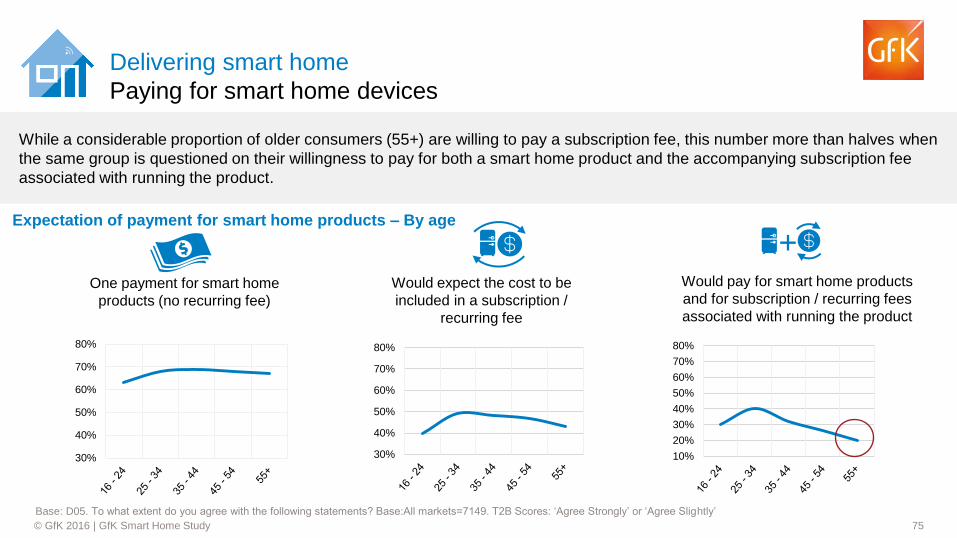
Delivering smart home
Paying for smart home devices
Base: D05. To what extent do you agree with the following statements? Base:All markets=7149. T2B Scores: ‘Agree Strongly’ or ‘Agree Slightly’
While a considerable proportion of older consumers (55+) are willing to pay a subscription fee, this number more than halves when
the same group is questioned on their willingness to pay for both a smart home product and the accompanying subscription fee
associated with running the product.
10%
20%
30%
40%
50%
60%
70%
80%
30%
40%
50%
60%
70%
80%
30%
40%
50%
60%
70%
80%
One payment for smart home
products (no recurring fee)
Would expect the cost to be
included in a subscription /
recurring fee
Would pay for smart home products
and for subscription / recurring fees
associated with running the product
Expectation of payment for smart home products – By age
+
76 © GfK 2016 | GfK Smart Home Study
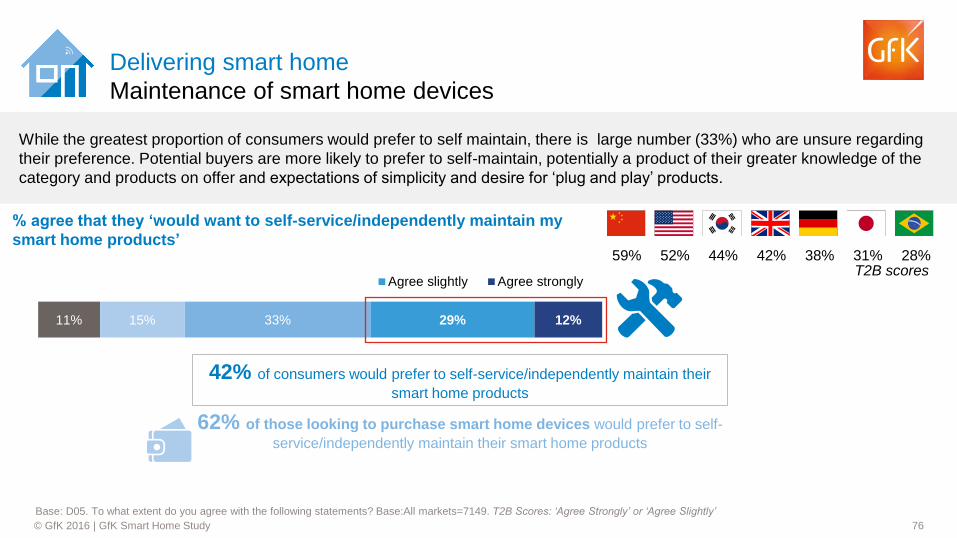
11% 15% 33% 29% 12%
Agree slightly Agree strongly
Delivering smart home
Maintenance of smart home devices
Base: D05. To what extent do you agree with the following statements? Base:All markets=7149. T2B Scores: ‘Agree Strongly’ or ‘Agree Slightly’
While the greatest proportion of consumers would prefer to self maintain, there is large number (33%) who are unsure regarding
their preference. Potential buyers are more likely to prefer to self-maintain, potentially a product of their greater knowledge of the
category and products on offer and expectations of simplicity and desire for ‘plug and play’ products.
42% of consumers would prefer to self-service/independently maintain their
smart home products
62% of those looking to purchase smart home devices would prefer to self-
service/independently maintain their smart home products
42% 44% 59% 38% 31% 28% 52% T2B scores
% agree that they ‘would want to self-service/independently maintain my
smart home products’
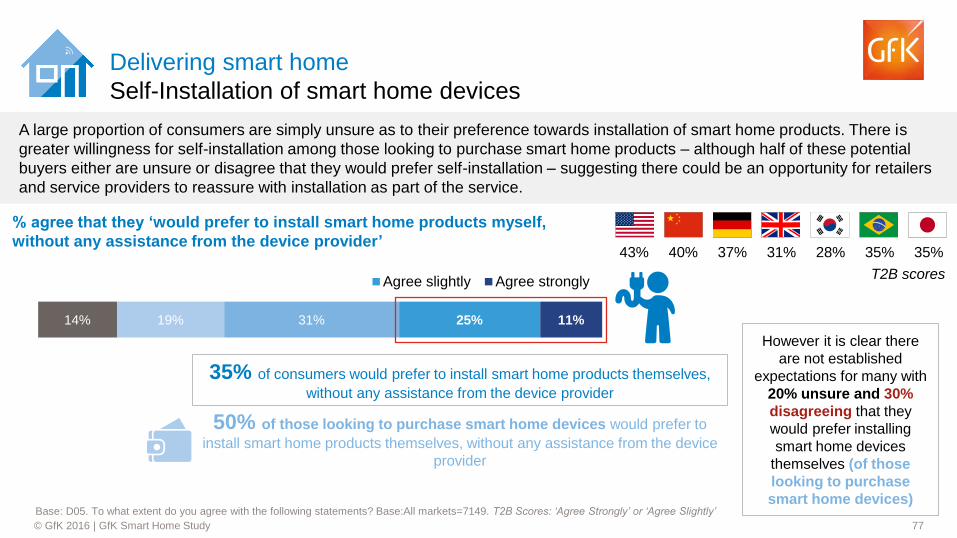
77 © GfK 2016 | GfK Smart Home Study
14% 19% 31% 25% 11%
Agree slightly Agree strongly
Delivering smart home
Self-Installation of smart home devices
Base: D05. To what extent do you agree with the following statements? Base:All markets=7149. T2B Scores: ‘Agree Strongly’ or ‘Agree Slightly’
A large proportion of consumers are simply unsure as to their preference towards installation of smart home products. There is
greater willingness for self-installation among those looking to purchase smart home products – although half of these potential
buyers either are unsure or disagree that they would prefer self-installation – suggesting there could be an opportunity for retailers
and service providers to reassure with installation as part of the service.
35% of consumers would prefer to install smart home products themselves,
without any assistance from the device provider
50% of those looking to purchase smart home devices would prefer to
install smart home products themselves, without any assistance from the device
provider
However it is clear there
are not established
expectations for many with
20% unsure and 30%
disagreeing that they
would prefer installing
smart home devices
themselves (of those
looking to purchase
smart home devices)
31% 37% 43% 28% 35% 35% 40%
T2B scores
% agree that they ‘would prefer to install smart home products myself,
without any assistance from the device provider’
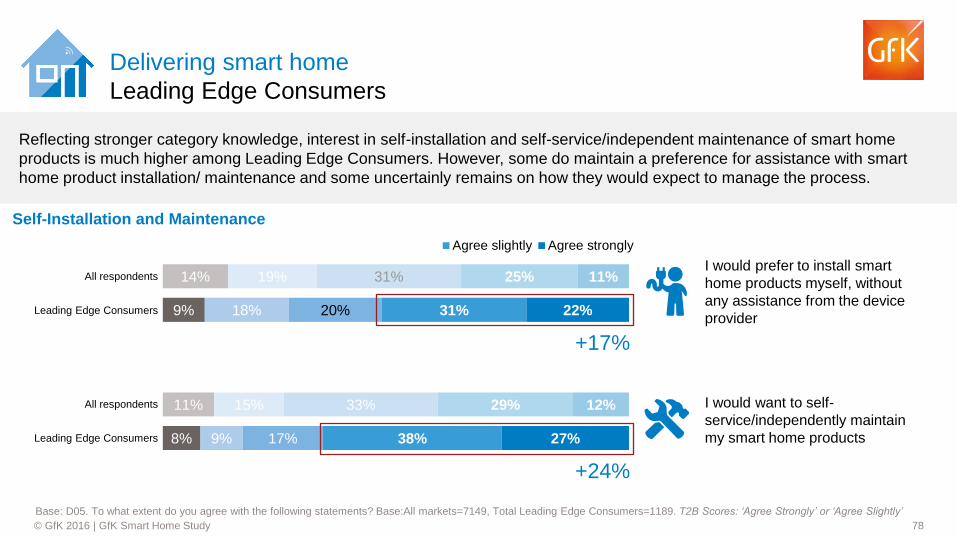
78 © GfK 2016 | GfK Smart Home Study
8%
11%
9%
15%
17%
33%
38%
29%
27%
12%
Delivering smart home
Leading Edge Consumers
Base: D05. To what extent do you agree with the following statements? Base:All markets=7149, Total Leading Edge Consumers=1189. T2B Scores: ‘Agree Strongly’ or ‘Agree Slightly’
Reflecting stronger category knowledge, interest in self-installation and self-service/independent maintenance of smart home
products is much higher among Leading Edge Consumers. However, some do maintain a preference for assistance with smart
home product installation/ maintenance and some uncertainly remains on how they would expect to manage the process.
I would prefer to install smart
home products myself, without
any assistance from the device
provider 9%
14%
18%
19%
20%
31%
31%
25%
22%
11%
Agree slightly Agree strongly
I would want to self-
service/independently maintain
my smart home products
All respondents
Leading Edge Consumers
All respondents
Leading Edge Consumers
+17%
+24%
Self-Installation and Maintenance
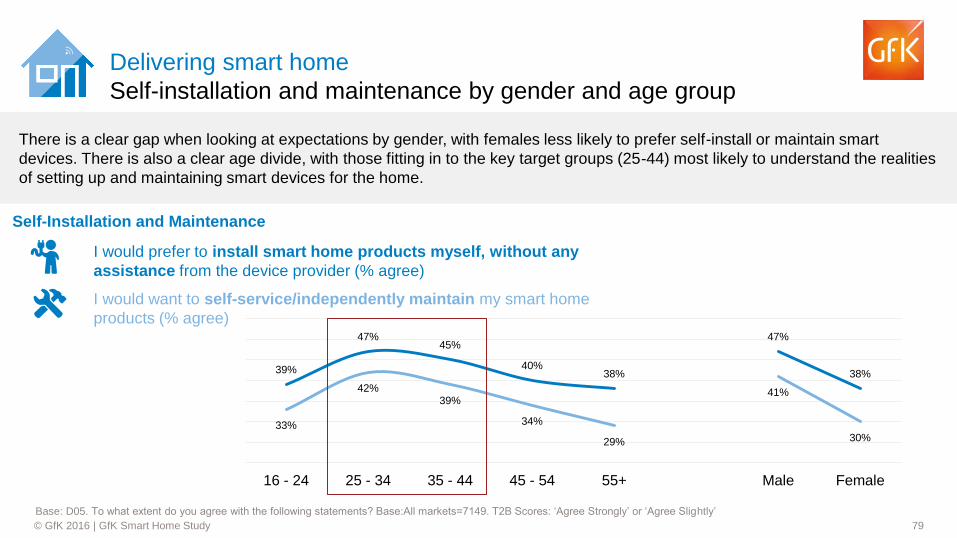
79 © GfK 2016 | GfK Smart Home Study
Delivering smart home
Self-installation and maintenance by gender and age group
Base: D05. To what extent do you agree with the following statements? Base:All markets=7149. T2B Scores: ‘Agree Strongly’ or ‘Agree Slightly’
There is a clear gap when looking at expectations by gender, with females less likely to prefer self-install or maintain smart
devices. There is also a clear age divide, with those fitting in to the key target groups (25-44) most likely to understand the realities
of setting up and maintaining smart devices for the home.
I would prefer to install smart home products myself, without any
assistance from the device provider (% agree)
I would want to self-service/independently maintain my smart home
products (% agree)
39%
47% 45%
40% 38%
47%
38%
33%
42% 39%
34%
29%
41%
30%
16 - 24 25 - 34 35 - 44 45 - 54 55+ Male Female
Self-Installation and Maintenance
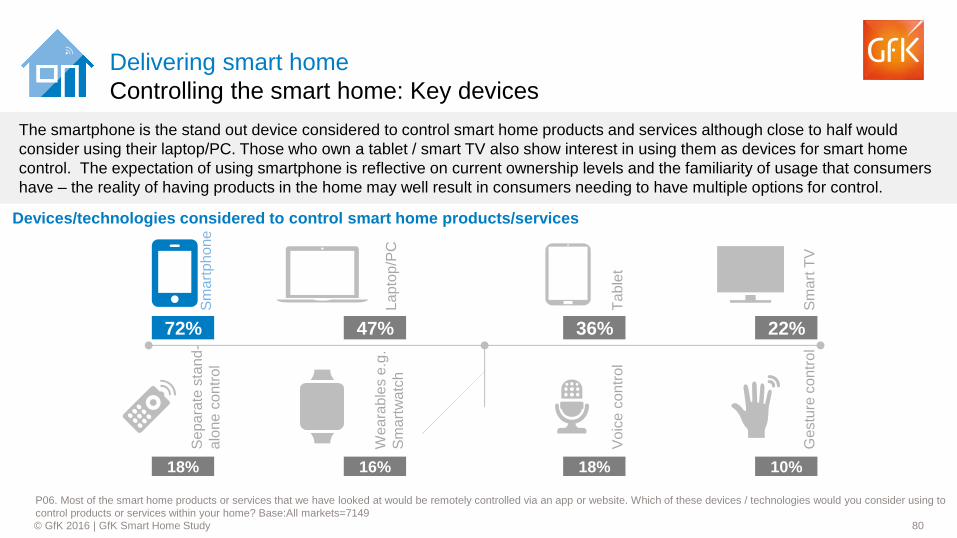
80 © GfK 2016 | GfK Smart Home Study
Delivering smart home
Controlling the smart home: Key devices
P06. Most of the smart home products or services that we have looked at would be remotely controlled via an app or website. Which of these devices / technologies would you consider using to
control products or services within your home? Base:All markets=7149
The smartphone is the stand out device considered to control smart home products and services although close to half would
consider using their laptop/PC. Those who own a tablet / smart TV also show interest in using them as devices for smart home
control. The expectation of using smartphone is reflective on current ownership levels and the familiarity of usage that consumers
have – the reality of having products in the home may well result in consumers needing to have multiple options for control.
47% 36% 22%
18% 16% 18% 10%
72%
Sm
art
pho
ne
Lap
top
/PC
Ta
ble
t
Sm
art
TV
Se
pa
rate
sta
nd
-
alo
ne
co
ntr
ol
We
ara
ble
s e
.g.
Sm
art
wa
tch
Vo
ice
co
ntr
ol
Ge
stu
re c
ontr
ol
Devices/technologies considered to control smart home products/services
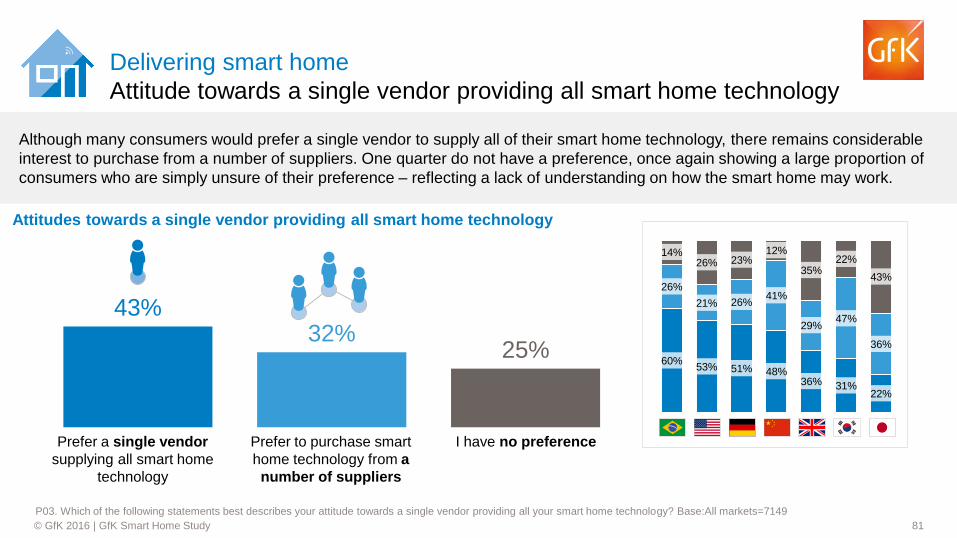
81 © GfK 2016 | GfK Smart Home Study
43% 32%
25%
Delivering smart home
Attitude towards a single vendor providing all smart home technology
P03. Which of the following statements best describes your attitude towards a single vendor providing all your smart home technology? Base:All markets=7149
Although many consumers would prefer a single vendor to supply all of their smart home technology, there remains considerable
interest to purchase from a number of suppliers. One quarter do not have a preference, once again showing a large proportion of
consumers who are simply unsure of their preference – reflecting a lack of understanding on how the smart home may work.
Prefer a single vendor
supplying all smart home
technology
Prefer to purchase smart
home technology from a
number of suppliers
I have no preference
60% 53% 51% 48%
36% 31% 22%
26%
21% 26% 41%
29% 47%
36%
14% 26% 23%
12%
35% 22%
43%
Attitudes towards a single vendor providing all smart home technology
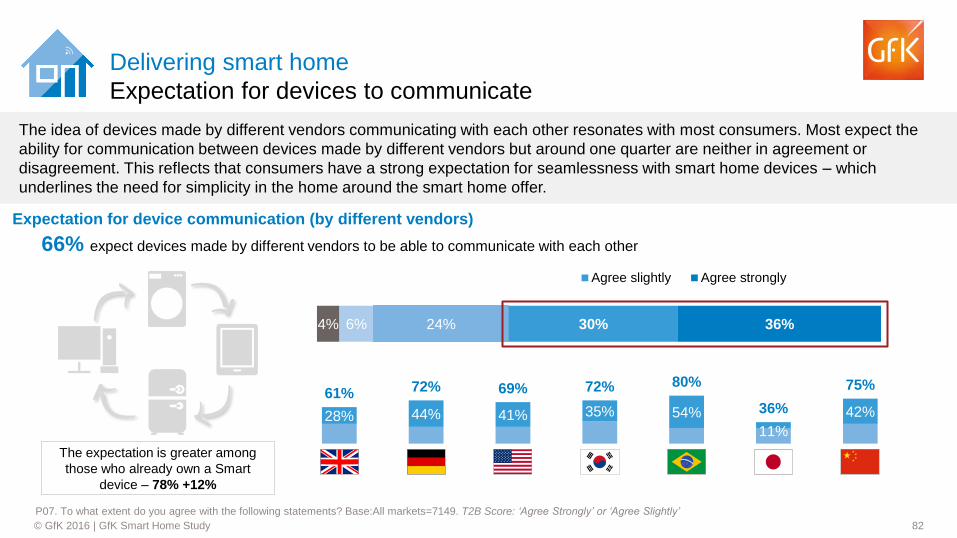
82 © GfK 2016 | GfK Smart Home Study
4% 6% 24% 30% 36%
Agree slightly Agree strongly
28% 44% 41% 35% 54%
11%
42%
61% 72% 69% 72% 80%
36%
75%
Delivering smart home
Expectation for devices to communicate
P07. To what extent do you agree with the following statements? Base:All markets=7149. T2B Score: ‘Agree Strongly’ or ‘Agree Slightly’
The idea of devices made by different vendors communicating with each other resonates with most consumers. Most expect the
ability for communication between devices made by different vendors but around one quarter are neither in agreement or
disagreement. This reflects that consumers have a strong expectation for seamlessness with smart home devices – which
underlines the need for simplicity in the home around the smart home offer.
66% expect devices made by different vendors to be able to communicate with each other
The expectation is greater among
those who already own a Smart
device – 78% +12%
Expectation for device communication (by different vendors)
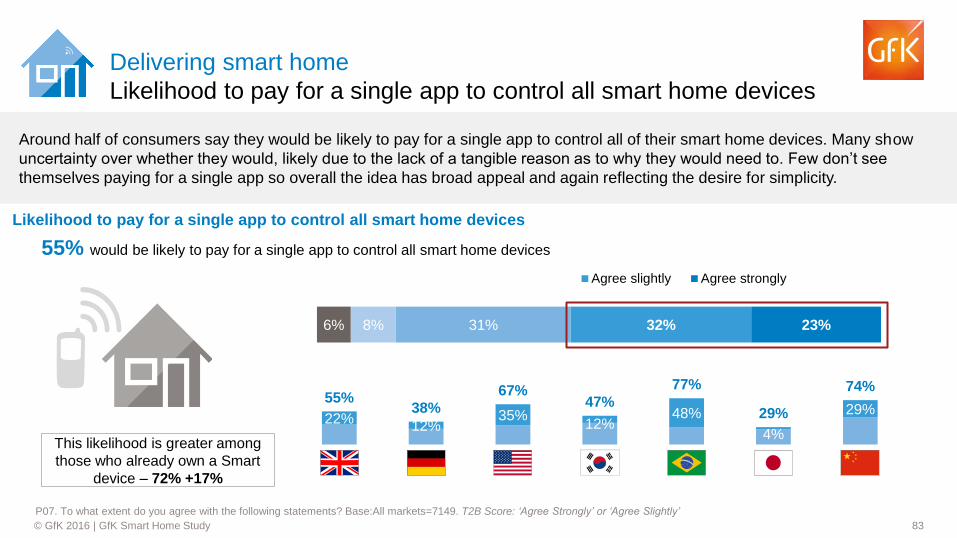
83 © GfK 2016 | GfK Smart Home Study
6% 8% 31% 32% 23%
Agree slightly Agree strongly
22% 12%
35% 12%
48%
4%
29% 55%
38%
67% 47%
77%
29%
74%
Likelihood to pay for a single app to control all smart home devices
Delivering smart home
Likelihood to pay for a single app to control all smart home devices
P07. To what extent do you agree with the following statements? Base:All markets=7149. T2B Score: ‘Agree Strongly’ or ‘Agree Slightly’
Around half of consumers say they would be likely to pay for a single app to control all of their smart home devices. Many show
uncertainty over whether they would, likely due to the lack of a tangible reason as to why they would need to. Few don’t see
themselves paying for a single app so overall the idea has broad appeal and again reflecting the desire for simplicity.
55% would be likely to pay for a single app to control all smart home devices
This likelihood is greater among
those who already own a Smart
device – 72% +17%
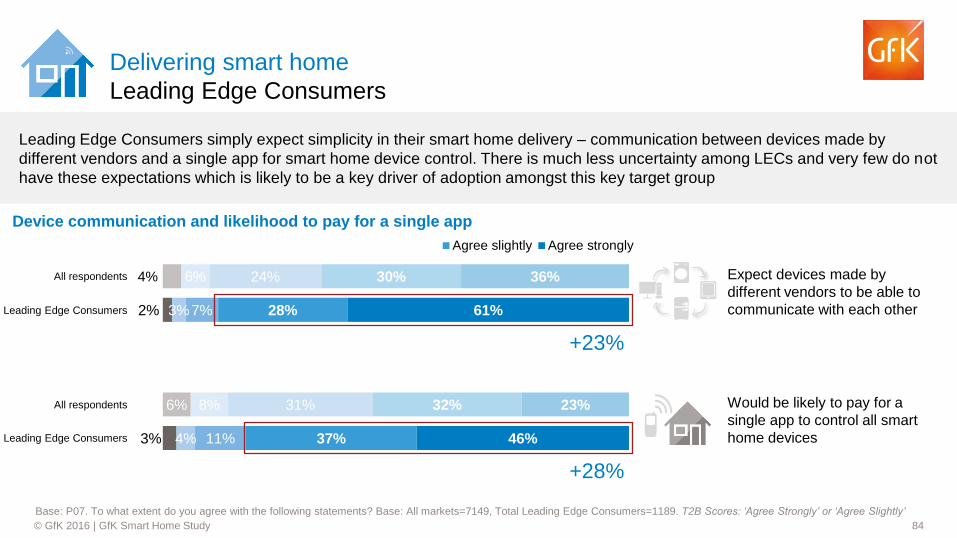
84 © GfK 2016 | GfK Smart Home Study
3%
6%
4%
8%
11%
31%
37%
32%
46%
23%
2%
4%
3%
6%
7%
24%
28%
30%
61%
36%
Agree slightly Agree strongly
Delivering smart home
Leading Edge Consumers
Base: P07. To what extent do you agree with the following statements? Base: All markets=7149, Total Leading Edge Consumers=1189. T2B Scores: ‘Agree Strongly’ or ‘Agree Slightly’
Leading Edge Consumers simply expect simplicity in their smart home delivery – communication between devices made by
different vendors and a single app for smart home device control. There is much less uncertainty among LECs and very few do not
have these expectations which is likely to be a key driver of adoption amongst this key target group
Expect devices made by
different vendors to be able to
communicate with each other
Would be likely to pay for a
single app to control all smart
home devices
All respondents
Leading Edge Consumers
All respondents
Leading Edge Consumers
+23%
+28%
Device communication and likelihood to pay for a single app
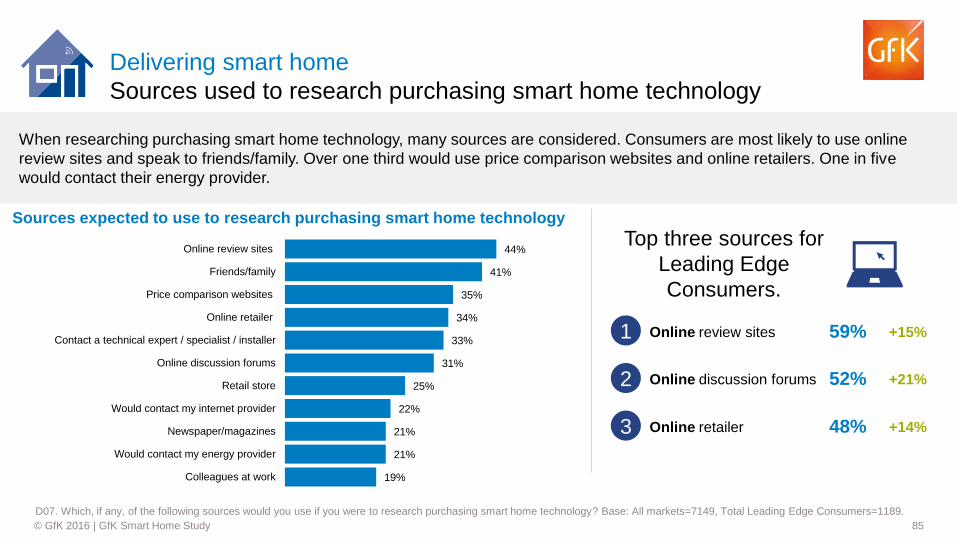
85 © GfK 2016 | GfK Smart Home Study
Delivering smart home
Sources used to research purchasing smart home technology
D07. Which, if any, of the following sources would you use if you were to research purchasing smart home technology? Base: All markets=7149, Total Leading Edge Consumers=1189.
When researching purchasing smart home technology, many sources are considered. Consumers are most likely to use online
review sites and speak to friends/family. Over one third would use price comparison websites and online retailers. One in five
would contact their energy provider.
44%
41%
35%
34%
33%
31%
25%
22%
21%
21%
19%
Online review sites
Friends/family
Price comparison websites
Online retailer
Contact a technical expert / specialist / installer
Online discussion forums
Retail store
Would contact my internet provider
Newspaper/magazines
Would contact my energy provider
Colleagues at work
Online review sites 59% +15%
Online discussion forums 52% +21%
Online retailer 48% +14%
1
2
3
Top three sources for
Leading Edge
Consumers.
Sources expected to use to research purchasing smart home technology
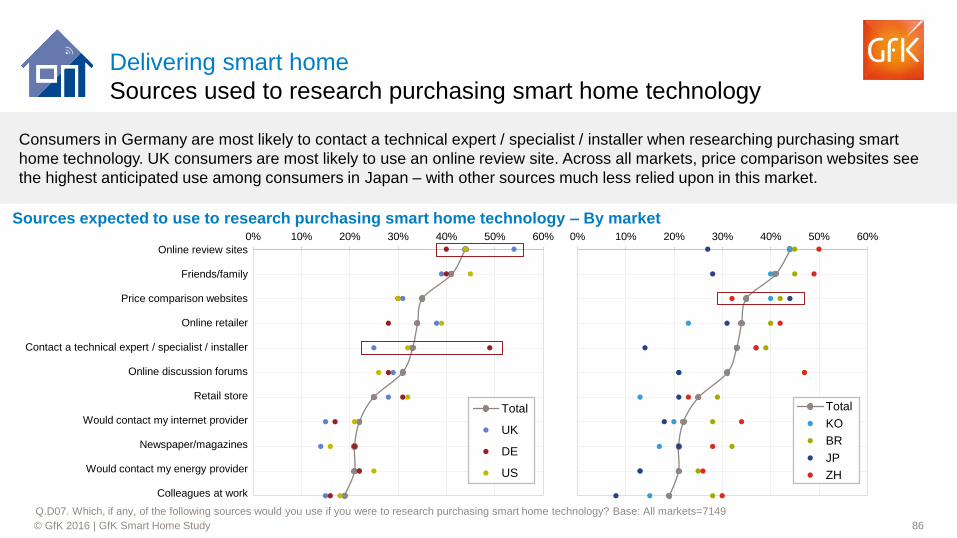
86 © GfK 2016 | GfK Smart Home Study
Delivering smart home
Sources used to research purchasing smart home technology
Q.D07. Which, if any, of the following sources would you use if you were to research purchasing smart home technology? Base: All markets=7149
Consumers in Germany are most likely to contact a technical expert / specialist / installer when researching purchasing smart
home technology. UK consumers are most likely to use an online review site. Across all markets, price comparison websites see
the highest anticipated use among consumers in Japan – with other sources much less relied upon in this market.
0% 10% 20% 30% 40% 50% 60%
Total
UK
DE
US
Online review sites
Friends/family
Price comparison websites
Online retailer
Contact a technical expert / specialist / installer
Online discussion forums
Retail store
Would contact my internet provider
Newspaper/magazines
Would contact my energy provider
Colleagues at work
0% 10% 20% 30% 40% 50% 60%
Total
KO
BR
JP
ZH
Sources expected to use to research purchasing smart home technology – By market
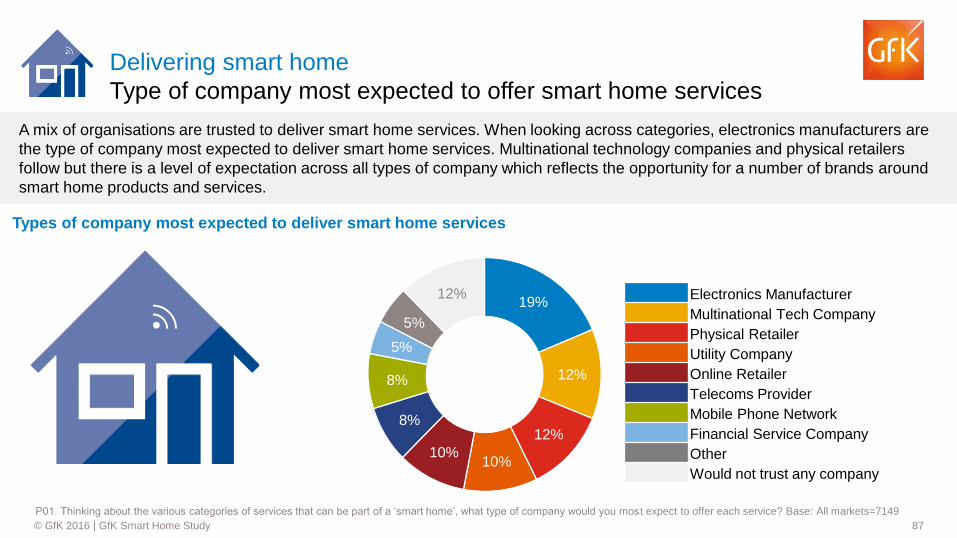
87 © GfK 2016 | GfK Smart Home Study
Delivering smart home
Type of company most expected to offer smart home services
P01. Thinking about the various categories of services that can be part of a ‘smart home’, what type of company would you most expect to offer each service? Base: All markets=7149
A mix of organisations are trusted to deliver smart home services. When looking across categories, electronics manufacturers are
the type of company most expected to deliver smart home services. Multinational technology companies and physical retailers
follow but there is a level of expectation across all types of company which reflects the opportunity for a number of brands around
smart home products and services.
Types of company most expected to deliver smart home services
Electronics Manufacturer
Multinational Tech Company
Physical Retailer
Utility Company
Online Retailer
Telecoms Provider
Mobile Phone Network
Financial Service Company
Other
Would not trust any company
19%
12%
12%
10% 10%
8%
8%
5%
5%
12%
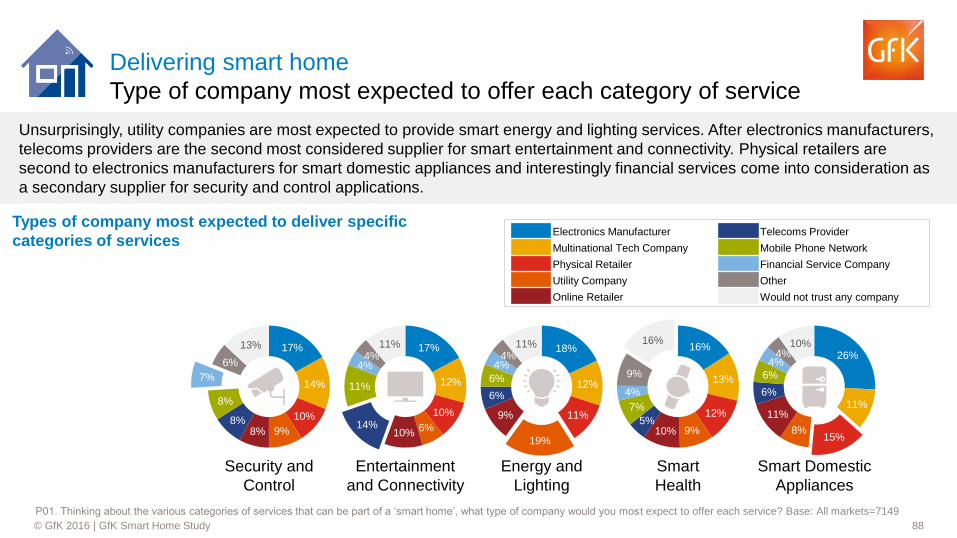
88 © GfK 2016 | GfK Smart Home Study
17%
14%
10%
9% 8% 8%
8%
7%
6%
13% 17%
12%
10%
6% 10%
14%
11%
4% 4%
11% 18%
12%
11%
19%
9%
6%
6%
4% 4%
11% 16%
13%
12%
9% 10% 5%
7%
4%
9%
16%
26%
11%
15% 8%
11%
6%
6%
4% 4%
10%
Delivering smart home
Type of company most expected to offer each category of service
P01. Thinking about the various categories of services that can be part of a ‘smart home’, what type of company would you most expect to offer each service? Base: All markets=7149
Unsurprisingly, utility companies are most expected to provide smart energy and lighting services. After electronics manufacturers,
telecoms providers are the second most considered supplier for smart entertainment and connectivity. Physical retailers are
second to electronics manufacturers for smart domestic appliances and interestingly financial services come into consideration as
a secondary supplier for security and control applications.
Electronics Manufacturer Telecoms Provider
Multinational Tech Company Mobile Phone Network
Physical Retailer Financial Service Company
Utility Company Other
Online Retailer Would not trust any company
Security and
Control
Entertainment
and Connectivity
Energy and
Lighting
Smart
Health
Smart Domestic
Appliances
Types of company most expected to deliver specific
categories of services
89 © GfK 2016 | GfK Smart Home Study
Appendix
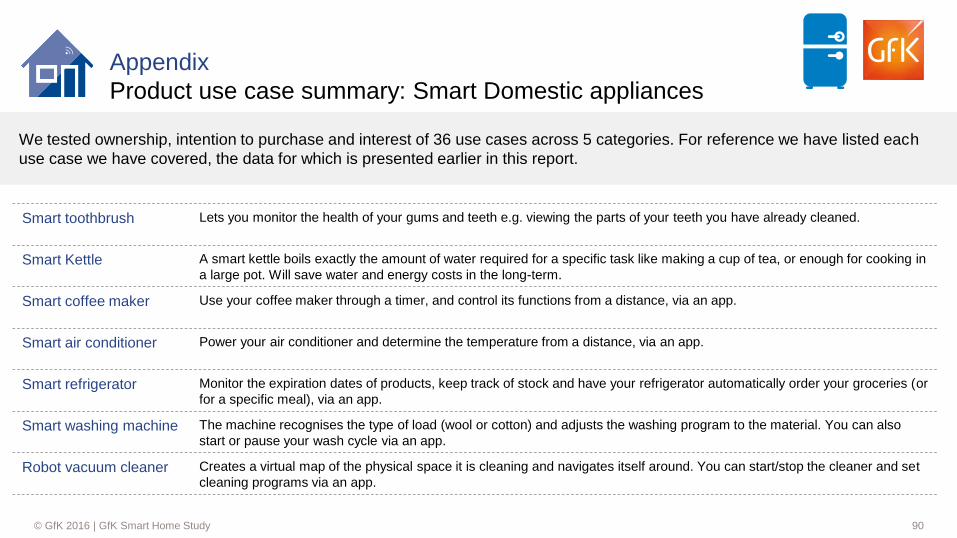
90 © GfK 2016 | GfK Smart Home Study
Appendix
Product use case summary: Smart Domestic appliances
Smart toothbrush Lets you monitor the health of your gums and teeth e.g. viewing the parts of your teeth you have already cleaned.
Smart Kettle A smart kettle boils exactly the amount of water required for a specific task like making a cup of tea, or enough for cooking in
a large pot. Will save water and energy costs in the long-term.
Smart coffee maker Use your coffee maker through a timer, and control its functions from a distance, via an app.
Smart air conditioner Power your air conditioner and determine the temperature from a distance, via an app.
Smart refrigerator Monitor the expiration dates of products, keep track of stock and have your refrigerator automatically order your groceries (or
for a specific meal), via an app.
Smart washing machine The machine recognises the type of load (wool or cotton) and adjusts the washing program to the material. You can also
start or pause your wash cycle via an app.
Robot vacuum cleaner Creates a virtual map of the physical space it is cleaning and navigates itself around. You can start/stop the cleaner and set
cleaning programs via an app.
We tested ownership, intention to purchase and interest of 36 use cases across 5 categories. For reference we have listed each
use case we have covered, the data for which is presented earlier in this report.

91 © GfK 2016 | GfK Smart Home Study
Appendix
Product use case summary: Smart Entertainment & Connectivity
Streaming multi-room
audio
Play music from your smart phone or tablet (via an app) on various speakers in your home.
Smart TV A television connected to the internet on which you can install apps (e.g. Facebook / Youtube, etc), and your smart phone
can function as a remote control.
Smart set top box While the box is still owned by your cable/satellite TV provider, you can pay for smartphone control in your subscription.
This control will allow you to set up or start the recording of television program via an app.
Smart
tuner/Amplifier/Receiver
You can play music on speakers, or stream video to screens from various devices in your home, via an app.
Home Plugs Once plugged into your socket/electrical outlet, connect devices to the Internet and one another using your home’s existing
electrical wiring.
Routers A device that sends the data signal from a Local Area Network (LAN) to other devices.
Repeaters An apparatus that extends a wireless signal further so devices can access the signal from a greater distance.
W-LAN sticks A USB adapter you can plug into your computer so as to make a direct internet connection.
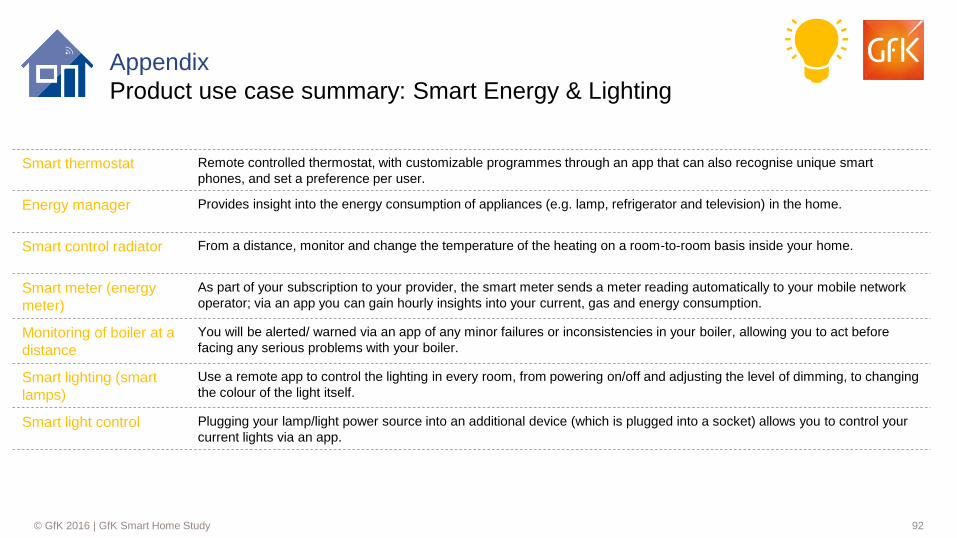
92 © GfK 2016 | GfK Smart Home Study
Appendix
Product use case summary: Smart Energy & Lighting
Smart thermostat Remote controlled thermostat, with customizable programmes through an app that can also recognise unique smart
phones, and set a preference per user.
Energy manager Provides insight into the energy consumption of appliances (e.g. lamp, refrigerator and television) in the home.
Smart control radiator From a distance, monitor and change the temperature of the heating on a room-to-room basis inside your home.
Smart meter (energy
meter)
As part of your subscription to your provider, the smart meter sends a meter reading automatically to your mobile network
operator; via an app you can gain hourly insights into your current, gas and energy consumption.
Monitoring of boiler at a
distance
You will be alerted/ warned via an app of any minor failures or inconsistencies in your boiler, allowing you to act before
facing any serious problems with your boiler.
Smart lighting (smart
lamps)
Use a remote app to control the lighting in every room, from powering on/off and adjusting the level of dimming, to changing
the colour of the light itself.
Smart light control Plugging your lamp/light power source into an additional device (which is plugged into a socket) allows you to control your
current lights via an app.
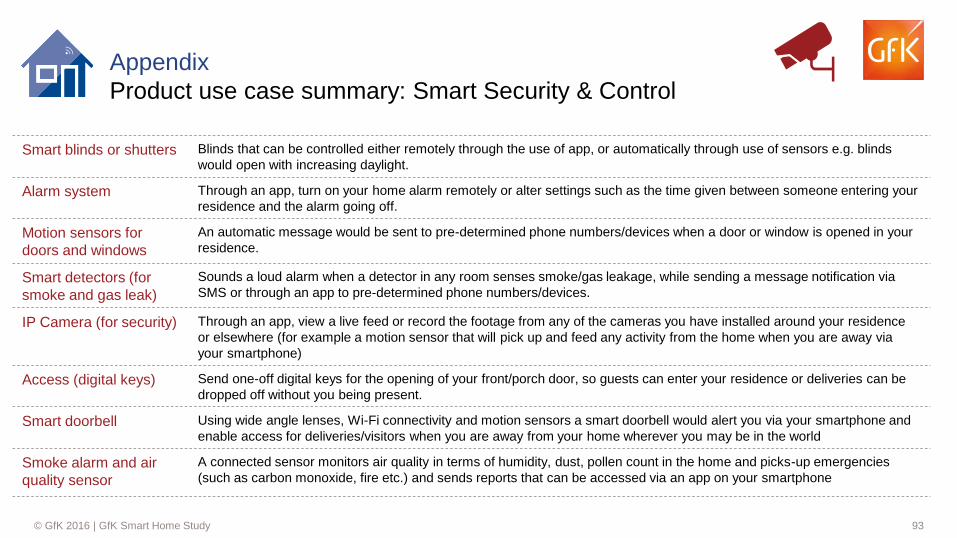
93 © GfK 2016 | GfK Smart Home Study
Appendix
Product use case summary: Smart Security & Control
Smart blinds or shutters Blinds that can be controlled either remotely through the use of app, or automatically through use of sensors e.g. blinds
would open with increasing daylight.
Alarm system Through an app, turn on your home alarm remotely or alter settings such as the time given between someone entering your
residence and the alarm going off.
Motion sensors for
doors and windows
An automatic message would be sent to pre-determined phone numbers/devices when a door or window is opened in your
residence.
Smart detectors (for
smoke and gas leak)
Sounds a loud alarm when a detector in any room senses smoke/gas leakage, while sending a message notification via
SMS or through an app to pre-determined phone numbers/devices.
IP Camera (for security) Through an app, view a live feed or record the footage from any of the cameras you have installed around your residence
or elsewhere (for example a motion sensor that will pick up and feed any activity from the home when you are away via
your smartphone)
Access (digital keys) Send one-off digital keys for the opening of your front/porch door, so guests can enter your residence or deliveries can be
dropped off without you being present.
Smart doorbell Using wide angle lenses, Wi-Fi connectivity and motion sensors a smart doorbell would alert you via your smartphone and
enable access for deliveries/visitors when you are away from your home wherever you may be in the world
Smoke alarm and air
quality sensor
A connected sensor monitors air quality in terms of humidity, dust, pollen count in the home and picks-up emergencies
(such as carbon monoxide, fire etc.) and sends reports that can be accessed via an app on your smartphone
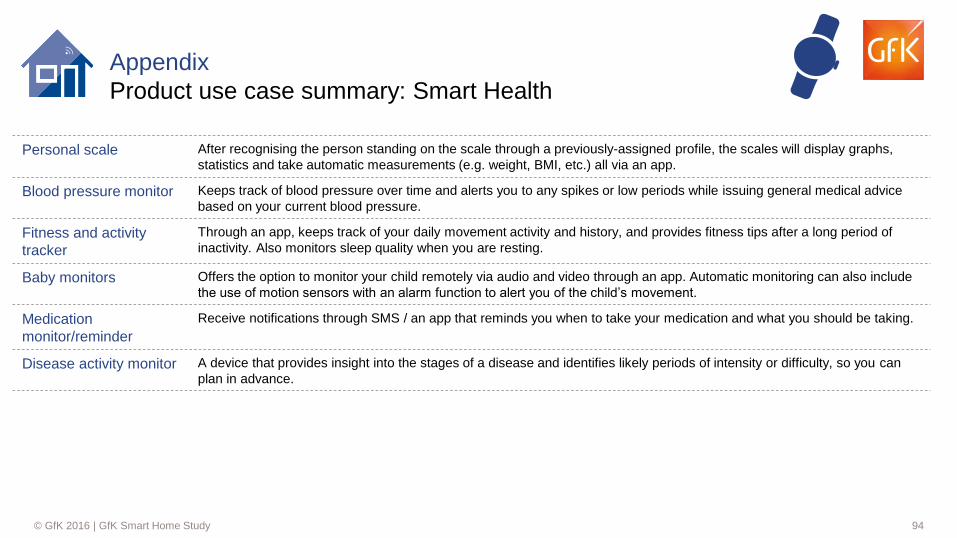
94 © GfK 2016 | GfK Smart Home Study
Appendix
Product use case summary: Smart Health
Personal scale After recognising the person standing on the scale through a previously-assigned profile, the scales will display graphs,
statistics and take automatic measurements (e.g. weight, BMI, etc.) all via an app.
Blood pressure monitor Keeps track of blood pressure over time and alerts you to any spikes or low periods while issuing general medical advice
based on your current blood pressure.
Fitness and activity
tracker
Through an app, keeps track of your daily movement activity and history, and provides fitness tips after a long period of
inactivity. Also monitors sleep quality when you are resting.
Baby monitors Offers the option to monitor your child remotely via audio and video through an app. Automatic monitoring can also include
the use of motion sensors with an alarm function to alert you of the child’s movement.
Medication
monitor/reminder
Receive notifications through SMS / an app that reminds you when to take your medication and what you should be taking.
Disease activity monitor A device that provides insight into the stages of a disease and identifies likely periods of intensity or difficulty, so you can
plan in advance.